August 2018 MUNICIPAL RESIDENTIAL WASTEWATER RATES (BASED ON 5,000 GALLONS OF CLEAN WATER PER MONTH) 2020 Andover Anoka Apple Valley Arden Hills Bayport Birchwood Blaine Bloomington Brooklyn Center Brooklyn Park Burnsville Carver Centerville Champlin Chanhassen Chaska Circle Pines Columbia Heights Columbus Coon Rapids Corcoran Cottage Grove Crystal Dayton Deephaven Eagan East Bethel Eden Prairie Edina Elko New Market Empire Township Excelsior Falcon Heights Farmington Forest Lake Fridley Gem Lake Golden Valley Greenfield Greenwood Hastings Hilltop Hopkins Hugo Independence Inver Grove Heights Lake Elmo Laketown Township Lakeville Landfall Lauderdale Lexington Lilydale Lino Lakes Little Canada Long Lake Mahtomedi Maple Grove Maple Plain Maplewood Medicine Lake Medina Mendota Mendota Heights Minneapolis Minnetonka Minnetonka Beach Minnetrista Mound Mounds View New Brighton New Hope Newport North Oaks North St. Paul Oak Park Heights Oakdale Orono Osseo Plymouth Prior Lake Ramsey Richfield Robbinsdale Rogers Rosemount Roseville Saint Anthony Saint Bonifacius Saint Louis Park Saint Paul Saint Paul Park Savage Shakopee Shoreview Shorewood South St. Paul Spring Lake Park Spring Park Stillwater Tonka Bay Vadnais Heights Victoria Waconia Wayzata West St. Paul White Bear Lake White Bear Township Willernie Woodbury
Transcript
August 2018
MUNICIPAL RESIDENTIAL WASTEWATER RATES
(BASED ON 5,000 GALLONS OF CLEAN WATER PER MONTH)
2020Andover Anoka Apple Valley Arden Hills Bayport Birchwood Blaine Bloomington Brooklyn Center Brooklyn Park Burnsville Carver Centerville Champlin Chanhassen Chaska Circle Pines Columbia
Heights Columbus Coon Rapids Corcoran Cottage Grove
Crystal Dayton Deephaven Eagan East Bethel Eden Prairie Edina Elko New Market Empire Township Excelsior Falcon Heights Farmington Forest Lake Fridley Gem Lake Golden Valley Greenfield Greenwood Hastings Hilltop Hopkins Hugo Independence
Inver Grove Heights
Lake Elmo Laketown
Township Lakeville Landfall Lauderdale Lexington Lilydale Lino Lakes Little Canada Long Lake Mahtomedi Maple Grove Maple Plain Maplewood Medicine Lake Medina Mendota Mendota Heights Minneapolis Minnetonka
Minnetonka Beach
Minnetrista Mound Mounds View New Brighton New Hope Newport North Oaks North St. Paul Oak Park Heights Oakdale Orono Osseo Plymouth Prior Lake Ramsey Richfield Robbinsdale Rogers Rosemount Roseville Saint Anthony
Saint Bonifacius Saint Louis Park Saint Paul Saint Paul Park Savage Shakopee Shoreview Shorewood South St. Paul Spring Lake Park Spring Park Stillwater Tonka Bay Vadnais Heights Victoria Waconia Wayzata West St. Paul White Bear Lake White Bear
Township Willernie Woodbury
THE COUNCIL’S MISSION IS TO FOSTER
EFFICIENT AND ECONOMIC GROWTH FOR A PROSPEROUS METROPOLITAN REGION
Published August 2020
Prepared by: Metropolitan Council Environmental Services
Author: Dan Schueller, Principal Financial Analyst
Metropolitan Council Members Charlie Zelle Chair Judy Johnson District 1 Reva Chamblis District 2 Christopher Ferguson District 3 Deb Barber District 4 Molly Cummings District 5 Lynnea Atlas-Ingebretson District 6 Robert Lilligren District 7 Abdirahman Muse District 8
Raymond Zeran District 9 Peter Lindstrom District 10 Susan Vento District 11 Francisco J. Gonzalez District 12 Chai Lee District 13 Kris Fredson District 14 Phillip Sterner District 15 Wendy Wulff District 16
The Metropolitan Council is the regional planning organization for the seven-county Twin Cities area. The Council operates the regional bus and rail system, collects and treats wastewater, coordinates regional water resources, plans and helps fund regional parks, and administers federal funds that provide housing opportunities for low- and moderate-income individuals and families. The 17-member Council board is appointed by and serves at the pleasure of the governor.
On request, this publication will be made available in alternative formats to people with disabilities. Call Metropolitan Council information at 651-602-1140 or TTY 651-291-0904.
Page - 1 | METROPOLITAN COUNCIL
Contents Background Information ............................................................................................................................ 1
Introduction ........................................................................................................................................... 1 MCES’s Rate System ............................................................................................................................ 1
The MCES Cost Allocation System .......................................................................................................... 4 Regional Approach ................................................................................................................................ 4
Twin Cities Area Residential Average Annual Cost .................................................................................. 6 Weighted Average per Household ........................................................................................................ 6 Median Community Charge................................................................................................................... 6
National Data and Trends ......................................................................................................................... 8 National Comparison ............................................................................................................................. 8 Interpretation of National Survey Data .................................................................................................. 8 National Trends ..................................................................................................................................... 8
Other Rates and Charges ......................................................................................................................... 9 Next Steps ................................................................................................ Error! Bookmark not defined. Exhibit 1 .................................................................................................................................................. 12
2010-2020 National Comparison: Average Annual Sewer Charges ................................................... 16 Exhibit 3 MN Statute 473.517………………………………………………………………………………… 17
Exhibit 4 MN Statute 473.519 ................................................................................................................. 19 Exhibit 5 Approval of user charge system ............................................................................................... 19 Contact Us .............................................................................................................................................. 19
Thank you to the customer communities that responded to our questions to clarify information found on city web sites.
Page - 1 | METROPOLITAN COUNCIL
Background Information Introduction
The Metropolitan Council The Metropolitan Council is a regional agency serving the Twin Cities seven-county metropolitan area, providing essential services to the region. The Council works with local communities to provide these critical services:
• Operates the region’s largest bus systems and the light-rail system.
• Enhances water sustainability in the region, most notably treating wastewater.
• Engages communities and the public in planning for future growth.
Under its 2040 Water Resources Policy Plan, the Council works to support development that makes the most efficient use of public resources and investments, protects natural resources, enhances livability and quality of life, and promotes economic competitiveness.
The plan also integrates the “regional systems” including transportation, aviation, parks and open space, and water resources management.
More information about the Metropolitan Council can be found on the Council’s Web site, www.metrocouncil.org.
Metropolitan Council Environmental Services (MCES) MCES is one of the public service divisions of the Metropolitan Council.
Water services provided by MCES ensure that:
• Wastewater collection and treatment services are provided in a cost- and quality-competitive manner.
• Sufficient sewer capacity exists to serve current and planned development.
• Local government plans include policies and requirements that support adequate future water supplies, inflow and infiltration
mitigation efforts, and nonpoint source pollution prevention in the region.
In order to provide these services to customer communities, MCES:
• Operates and maintains approximately 600 miles of regional sewers that collect flow from about 5,000 miles of sewers owned by 109 communities.
• Treats about 250 million gallons of wastewater daily at nine regional treatment plants.
• Continues to achieve near-perfect compliance with federal and state clean water standards.
• Establishes user fees that pay 100 percent of wastewater operations and debt service costs.
• Maintains wastewater service rates consistently below the national average.
• Works with approximately 800 industrial clients to substantially reduce the amount of pollution entering our wastewater collection system.
• Provides facilities that accept liquid wastes from industries, landfills, ethanol plants, groundwater cleanup, septic system pumping, and port-a-potties.
• Provides water resources monitoring and analysis for the region.
MCES’s Rate System A system of rates has been established to pay the costs incurred in meeting MCES’s responsibilities. These rates are briefly defined and listed in order of their fiscal significance (Figure 1).
While the focus of this report is municipal wastewater rates, other rates and charges are on pages 9 and 10 of this report. More information can be found on the Met Council’s Web site, www.metrocouncil.org/wastewater-water.aspx.
Community Rates Addressed in this Study Within the seven-county metropolitan area, there are 110 communities that are the customers (primary users) of the MCES wastewater system in 2020. They are billed by MCES at a wholesale rate. In turn, each community bills property owners – residential, industrial and commercial users – for wastewater collection and treatment.
The focus of this report is on the municipal wastewater charges imposed by the metropolitan communities on their single-family residential customers. This is a retail rate that includes MCES’s wholesale rate charged to each community, plus the additional amount added by each community to pay for local trunk and lateral sewer costs.
MCES wholesale volume charges are billed to each community monthly. Most communities base their wastewater charges on metered water consumption.
Retail Rate is the fee a municipality charges its customers – residential, commercial or industrial – for wastewater. This fee covers the wholesale cost from MCES as well as funds needed to administer and maintain the local government’s trunks and lateral system.
Exhibit 1 lists the retail rates of MCES’s customer communities in 2020 along with several years of history.
MCES sewer charges are supported by Minnesota Statute 473.519 (Exhibit 4) and EPA regulation 35.929 (Exhibit 5).
Figure 1. Definition of MCES’s Rates • Municipal Wastewater Charge (MWC): A wholesale charge to a community by MCES for
regional wastewater collection and treatment. Communities pay MCES based on the proportion of wastewater treated originating within their borders and MCES revenue requirement (MCES budget). Communities add their own fees on top of the MWC which results in the retail sewer billings.
• Sewer Availability Charge (SAC): Another wholesale rate charged by MCES to a community. This capacity fee is imposed for new connections or increased demand to the metropolitan wastewater system. A freestanding single-family residence is charged one SAC unit, which is based on 274 gallons of maximum potential daily wastewater flow volume. Some communities add their own SAC fees on top of MCES’s sewer availability charge, but about two-thirds do not.
• Industrial Strength Charges: These retail fees (billed directly to industries by MCES) cover additional treatment costs caused by industrial wastewater that has more pollutants than typical residential wastewater. Industrial strength charges are based on the concentration of pollutants and the volume of the discharge.
• Other Industrial Charges: Included in this category are liquid waste hauler load charges, industrial discharge permit fees, temporary capacity charges, self-monitoring report late fees, stipulation agreement payments and cost recovery fees.
Page - 3 | METROPOLITAN COUNCIL
Revenue Sources MCES’s main revenue source for wastewater operations and debt service is fees from users of the system (primarily the municipal wastewater charges).
These fees, or charges, are established through a system-wide cost allocation process that distributes the annual cost of developing and operating the system among users.
Refer to Exhibit 3, State Law on Cost Allocation: Minnesota Statutes 473.517. In addition to municipal wastewater charges, most of the remaining revenue comes from SAC fees and industry-specific charges.
Maintaining competitive rates and a high level of performance are priorities for MCES and the health of the region.
Factors That Influence Wastewater Pricing Comparing wastewater treatment charges among communities, both locally and nationally, is one indicator of relative cost and efficiency. Many factors other than cost and efficiency can have an influence on wastewater pricing.
These factors include variables such as the:
• level of treatment (primary, secondary, or tertiary),
• age of the system, • amount of infiltration and inflow (influenced
by proximity to water table), • climate in the locale of the system, • customer composition, • inclusion of debt service in sewer service
charges, • size and density of urban area, • varying rules and regulations, and • system size.
For example, MCES pays for its debt service (which is its largest expense item) from its fee revenue, while in some comparably-sized metropolitan areas, debt service is paid from property taxes and not reflected in fees. The level of treatment can also cause large cost variances among otherwise comparable metropolitan areas. MCES (near the source of the Mississippi River) has some of the most stringent environmental regulations in the Midwest.
The range and variety of factors that influence operations mean that rates alone are insufficient data from which to draw conclusions regarding the efficiency and effectiveness of wastewater operations.
Exhibit 2 shows some national comparison sewer charge data.
Figure 2. MCES’s Revenue Sources
Based on 2020 Budget of $307 million
Page - 4 | METROPOLITAN COUNCIL
The MCES Cost Allocation System
Regional Approach In the 1970s the Metropolitan Council and the Metropolitan Waste Control Commission (a predecessor agency to MCES), acting under statutory direction, initiated a regional approach to the cost of wastewater treatment.
As a result, a community’s sewer bill does not depend on the size of the nearest treatment plant (and its unit cost of treatment). Rather, the costs of the system are pooled and allocated across all communities.
In 1992 the regional approach was also applied to wastewater conveyance and the cost of constructing interceptors.
The regional approach was reaffirmed by a 1995 customer-based Sewer Rates/Cost Allocation Task Force, which said:
A uniform sewer service rate is the most equitable way to allocate costs throughout the Metropolitan Disposal System (MDS) for sewage requiring a normal level of treatment because the system is designed to maximize regional efficiency and regional water quality goals.
Regional treatment provides cost savings not available with local treatment. In general, the larger the plant, the lower the unit cost of treatment.
The regional approach also provides equity in costs and service throughout the region. Regional service enhances environmental quality by allowing service decisions to be made at the regional level, avoiding inter-city negotiations and conflicts.
Over time, the facilities that make up the metropolitan disposal system have gone through several phases of development. In the early years the focus was on consolidating and regionalizing the system and decommissioning small inefficient plants, especially those that were discharging into lakes rather than rivers. A primary focus was on bringing the entire system into compliance with
evolving federal and state environmental standards.
Later, expansion and upgrade of several larger regional plants was completed to meet the demands of growth and of increased regulation. In the current phase, maintenance, rehabilitation and efficiencies are the primary focus.
System-Wide Cost Allocation System While the facilities and operation of MCES were being updated and made efficient, so too was its methodology for setting wastewater service charges.
The result of this evolution is that today, MCES has a rate system that charges on a utility-like basis and reflects only the cost of providing service and the volume of use.
All customer communities pay an allocated portion of the Metropolitan Wastewater Charge, which is based on their annual volume of wastewater treated.
Each year MCES uses budgeted expenses to derive its Metropolitan Wastewater Charge (Figure 3). MCES began using this method in 2005 to allocate the Metropolitan Wastewater Charge to customer communities. With this method, the cost of service is allocated based on actual known flow from the most recent calendar year.
These tentative overall charges are analyzed for competitiveness and affordability and are compared to prior MWCs and inflation rates.
Figure 3. MCES’s Rate Determination: Step 1
Total Annual Budget Expense – Transfer from SAC Fund – Other Revenues & Use of Reserves = Metropolitan Wastewater Charge
Required
Page - 5 | METROPOLITAN COUNCIL
Adjustments are made by putting pressure on the total annual budget or using excess operating reserves. During this process of budgeting and rate setting, the MCES management team, Council administration and staff, and municipal and industrial customers interact to determine the best way to meet the region’s wastewater collection and treatment needs.
The next step of the process determines an individual community’s bill by multiplying the metropolitan wastewater charge by the community’s percent of the total system flow for the prior year (Figure 4). One-twelfth is billed each month.
Impact of System Flow on Wholesale Rate Annual flows can vary significantly as a consequence of weather and climate cycles. Therefore, even if MCES’s total revenue remained the same, the rate charged per volume of flow varies. For example, total charges of $200,000,000 and a system flow of 100 billion
gallons yield a rate of $2,000.00 per million gallons, or $2 per 1,000 gallons.
Should the system flow drop to 95 billion gallons, the rate would be $2,105.26 per million gallons.
The dollars that need to be collected by MCES remain almost the same at either flow level since the vast majority of expenses are fixed (debt service and labor), and those that vary do so more with the solids content of wastewater than the volume.
Figure 4. MCES’s Rate Determination: Step 2
Metropolitan Wastewater Charge X Community’s Percentage of Total Flow = Community’s Annual MWC Bill
Page - 6 | METROPOLITAN COUNCIL
Twin Cities Area Residential Average Annual Cost
Weighted Average per Household In 2020, the weighted average retail community wastewater charge for a single-family residence in the Twin Cities area was $347 per household per year, a 13.1% increase for the two years since last reported in 2018. During the same two-year period, MCES’ total MWC increased 7.5%.
The household cost is based on each community’s reported rates for a household with consumption of 5,000 gallons per month. These rates are then weighted based on the number of single-family customer households served by each community.
The number of one-and two-family households served by MCES varies from seven in Columbus to 77,000 in Minneapolis. Therefore, MCES believes a weighted average is the most accurate reflection of rates for the purpose of this study. Weighted average has been used since 1998.
See Exhibit 1 for individual community charges.
Median Community Charge At the end of Exhibit 1 are median charges for the years 2002 through 2020. Weighted average and median charges for metropolitan area
communities from 2002 to 2020 are summarized in Figure 5.
Types of Rates Communities in the metropolitan region use several types of sewer rates to charge residential customers.
• 17 use a flat charge; • 8 use a uniform rate; • 69 use a base/uniform rate; • 12 use a base/increasing block rate; • 1 use an increasing block rate, and • 2 do not charge residential wastewater rates
(Landfall and Medicine Lake)
These rate types used by MCES customer communities are defined as follows.
The flat charge for residential customers is a fixed dollar amount for each residential unit, regardless of use. Reportedly this method is used based on the following assumptions: that volume varies little among single-family houses; that system access or availability is the principal consideration in costs; that revenue from flat charges is more predictable than from volume-based rates; and/or that a flat charge system is easier to administer. Also, flat charges are used where water use is not metered.
Environmentalists generally discourage this methodology as it encourages consumption and discourages conservation.
Uniform rates are set so that each gallon of metered water use is charged the same rate. Bills are often based on usage of water during the winter quarter so that homeowners are not charged sewerage fees based on water used in lawn and garden care.
The base/uniform rate combines a fixed dollar charge or minimum charge (generally, per month or per quarter) with a metered volume charge. The fixed dollar charge varies widely. In some cities, the fixed portion equates to a service charge or billing fee and the total is modest. In other cities the fixed portion is relatively large.
Figure 5. Twin Cities Metropolitan Area Weighted Average Retail Charge per
Base/increasing block means that like the base/uniform rate, a fixed dollar charge is combined with a volume charge. The difference is that the volume rate increases as the volume used increases. For example, the first 5,000 gallons might be $2 per thousand gallons and the second 5,000 gallons might be $3 per thousand gallons.
Increasing block rates mean that sewer service charges are based on metered water use, but increase as water use increases, without a fixed component. The higher charges are set incrementally, often in 5,000 to 10,000 gallon blocks.
Community Rate-Setting Practices Communities served by MCES have the authority to set their own retail rates, but they must be consistent with pertinent laws and regulations. Pursuant to MN Statutes, section 473.519 (Exhibit 4), each unit of government must adopt a system of charges sufficient to pay its share of the cost allocated to it by the Council.
Residential Rate Changes Figure 6 shows the approximate portion of the total average retail sewer charge that is paid to
MCES. The remainder is needed to cover city sewer costs.
*Based on 60,000 gallons of water sold, which equates to 70,200 gallons of wastewater due to inflow/infiltration (I/I) that is estimated to be 17% of wastewater flow (70.2 X $2.68 per 1,000 gal.=$188).
Page - 8 | METROPOLITAN COUNCIL
National Data and Trends
National Comparison Comparing MCES’s performance and competitiveness with wastewater agencies in other areas of the country is important to the Council. While not perfect, analyzing national data and comparing levels of service, rates, operating and maintenance costs, and debt service with similar agencies helps MCES assess Council’s regional competitiveness.
MCES uses the annual survey prepared by the National Association of Clean Water Agencies (NACWA) as its primary authority on the expenses, revenues and rates of other agencies across the nation. NACWA members represent the majority of the sewered population in the United States and collectively treat more than 18 billion gallons of wastewater per day.
The most current NACWA survey, the 2019 NACWA Index, contains rate data from 1986 to 2019 with projected data through 2024; 174 member agencies completed this survey, serving nearly 104 million people. The annual retail wastewater charges for these communities increased, on average, 4.0% over the past ten years, slightly higher than MCES’ 3.5% average increase in municipal wastewater charges over the same period.
Exhibit 2 shows the NACWA retail average and compares its annual increases to inflation and annual increases in MCES’s Metropolitan Wastewater Charge and to our region’s average retail household rates.
Interpretation of National Survey Data Interpretation of survey data can be challenging. Survey data may differ because of survey wording and wording of responses, unique rate-setting and operational strategies, and other factors not covered by generic survey forms. NACWA mentions that some agencies, when responding to a current survey, will modify answers to previous surveys; others respond to some of the questions, but not all.
However, even with the disparities and not always perfect responses, survey information can be useful for comparative purposes and as an indicator of trends in wastewater cost.
The self-selecting nature of surveys must also be noted. One metropolitan area, which was frequently the highest cost city in the survey for many years, has declined to participate in recent surveys.
National Trends The NACWA survey also provides information on the current trends in the wastewater industry across the nation.
Many wastewater agencies have experienced cost increases two times greater than inflation over the past several years. To meet these increased cost challenges, wastewater agencies have implemented programs to become more efficient, including:
• Cost-saving energy recovery initiatives, • Implementation of asset management programs, • Increased provision of reclaimed water services, • Sales of fertilizer products made from biosolids, and • Implementation of utility management/excellence programs.
Page - 9 | METROPOLITAN COUNCIL
Other Rates and Charges
Other MCES rates and charges related to treatment of wastewater are summarized in this section. Communities also have related charges, such as sewer connection and/or city SAC fees.
This study does not include information on these other community charges; that information is most reliable if received from individual communities.
MCES Sewer Availability Charge (SAC) Since 1973, MCES began to levy this one-time capacity charge for new connections or increased capacity demand to the metropolitan wastewater system.
One SAC unit is based on 274 gallons of maximum potential daily wastewater flow volume. A freestanding single-family residence is charged one SAC unit. Other types of buildings pay a prorated SAC fee, based on the estimated capacity of wastewater they may demand.
The dollar value of a single SAC is set by the Metropolitan Council and is the subject of a periodic study. Figure 7 shows the SAC for the years 2009 through 2020, which hasn’t increased since 2013.
which has more pollutants than typical residential wastewater.
Industrial strength charges are based on the concentration of pollutants (as measured by Total Suspended Solids [TSS] and Chemical Oxygen Demand [COD]) and the volume of the discharge.
Strength charge rates are determined annually by the Council, based on operational expenses at wastewater treatment plants for treating TSS and COD in excess of normal residential wastewater.
Industrial users are also subject to normal municipal wastewater and sewer availability charges.
Industrial Strength Charge Rate
Industrial Strength Charge: Outside the Region
This strength charge applies to customers outside the Council’s seven-county area.
Liquid Waste Hauler Load Charge Rates Liquid waste haulers pay MCES for septage, leachate and other hauled wastes that are discharged to MCES disposal sites. The load charge combines a strength charge component, a
volume component, and a receiving facilities component.
In addition, a $15 per 1,000-gallon service charge applies to hauled wastes originating outside the seven-county metropolitan area.
Industrial Discharge Permit Fees Industrial users of the Metropolitan Disposal System must apply for a permit from MCES to discharge wastewater.
Those industrial users issued a permit are subject to annual permit fees, which recover a portion of the costs to administer the industrial pretreatment program.
Permit fees are based on permit type, annual volume of wastewater, significant industrial user (SIU) status, and self-monitoring reporting frequency.
Temporary Capacity Service Charge This charge is assessed for temporary use of the metropolitan system (e.g., capacity for disposal of contaminated groundwater) and is assessed in lieu of SAC, due to the temporary nature of the service. Essentially this charge is for renting capacity in the system.
Industrial Capacity Charge (ICC) As of January 1, 2019, industries have a new option for paying SAC for process discharge (that may reduce or eliminate large SAC payments) and a new way that Industrial SAC is determined and billed. ICC will be determined and invoiced after each industry’s reporting period, but only for discharges above an industry’s SAC baseline. One way to look at ICC is that it gives permitted industries a choice to rent their needed capacity instead of owning it.
Self-Monitoring Report Late Fee A late fee is assessed to permittees who fail to submit a complete self-monitoring report on a timely basis. The fee amount is based on the frequency and severity of late reports.
Stipulation Agreement Payment These rare penalties are charged to negate the economic advantage of noncompliance with federal pretreatment standards or local limits.
Cost Recovery Fees These fees are used to recover costs from any responsible party associated with spill or enforcement responses or non-routine data requests.
Inflow and Infiltration (I/I) Surcharge MCES monitors wastewater flows from communities and identifies those that exceed peak flow limits, which indicates excessive flows due to I/I. These communities are assigned a work plan value, which is the amount they are expected to invest into their wastewater system to mitigate sources of I/I. Communities are eligible for State I/I grant funds to pay up to 50% of the expenses, when funds are allocated by the Legislature. Since 2010, MCES has distributed more than $19M in state grant funds, supporting over $150M of total spending.
A 2016 task force determined this program has been successful in focusing attention and funds on I/I improvements, and recommended continuation of the program. The success of the program includes:
• MCES has deferred or eliminated the almost $1 billion that was projected to be needed to build capacity for this excess I/I,
• The MPCA recently terminated MCES’s joint CSO permit with Minneapolis (NPDES/SDS permit) due to joint work to eliminate CSO events which has resulted in no sewer overflows since 2010,
• Some evidence of reduction in peaks has been observed,
• Total annual flows have been trending down, despite regional growth and increased rainfall trends,
• There has been no consent decree from EPA.
See Council website for more information.
Encroachment Application Fee Assessed to recover administrative time spent by MCES staff developing and processing
encroachment agreements when someone requests to encroach on MCES property ($600 fee per easement).
Page - 11 | METROPOLITAN COUNCIL
Direct Connection Application Fee Assessed to recover administrative time spent by MCES staff on requests to connect directly to an ES interceptor ($1,000 fee per connection).
Next Steps Wastewater treatment agencies are one of the stewards of the health and environment of the nation’s communities (part of their quality of life).
MCES embraces this stewardship with goals that continue to ensure a sustainable environment within the context of providing competitive, quality service to the region’s residents. We hope that the information presented in this study is of interest and value to our customers and stakeholders.
We welcome reader feedback on this issue and suggestions for future studies.
Please e-mail comments to Dan Schueller at [email protected] or call (651) 602-1624.
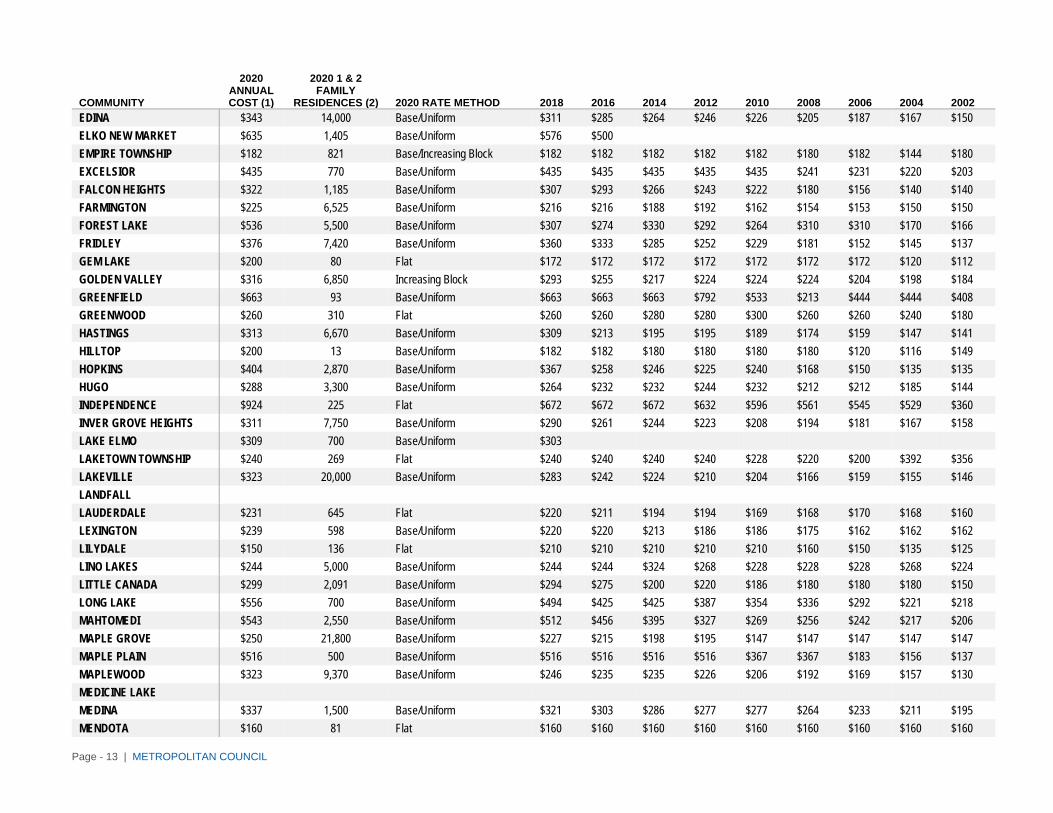
MCES 2020 Survey Community Retail Sewer Charges — Annual Charges for One-and Two-Family Residences Based on 5,000 metered gallons of water consumption per month. See page 6 for explanation of rate methods in column 4.
(1) Cost based on 60,000 gallons of clean water purchased per year. (2) Estimated number of residential (one and two family) households served by MCES. (3) Weighted for the number of households served.
Page - 16 | METROPOLITAN COUNCIL
Exhibit 2
2010 - 2020 National Comparison: Average Annual Sewer Charges 2010 2011 2012 2013 2014 2015 2016 2017 2018 2019 2020 National Average Annual Residential Sewer Service Charge (1) $381 $398 $412 $435 $448 $452 $479 $501 $517 $537 $555
National Average Increase in Cost of Wastewater Services (2) 4.4% 6.1% 3.3% 5.5% 4.1% 3.1% 2.6% 3.6% 3.9% 3.8% 3.4%
Metro Area Retail Rate Average (3) $216 $225 $235 $245 $255 $264 $274 $290 $307 $327 $347
Metro Area Retail Increase 4.9% 4.2% 4.4% 4.3% 4.1% 3.6% 3.6% 5.8% 5.9% 6.5% 6.1%
(1) Based on the National Association of Clean Water Agencies (NACWA) annual Service Charge Index survey which gets a survey response from about 175 wastewater agencies nationwide. This average is based on the increase in the NACWA Clean Water Index, which is based on including only the same agencies that report from one year to the next. Source is 2019 National Association of Clean Water Agencies (NACWA) Index- Web Address: https://www.nacwa.org/news-publications/financial-survey-nacwa-index
(2) Same source as above. Note that percentages in (2) don’t match (1) because charges in (1) include all survey responses and percentages in (2) include only responses from agencies that responded in both the previous year and the current year, which is more accurate.
(3) Odd years are interpolated from even year results per this survey. (4) This is the increase in MCES’ total Metropolitan Wastewater Charges. (5) This is the consumer price index for the Minneapolis-St. Paul area (all items).
Exhibit 3 State Law on Cost Allocation (Minnesota Statutes 473.517)
473.517 ALLOCATION OF COSTS Subdivision 1. Allocation method. Except as provided in subdivision 3, the estimated costs of operation, maintenance, and debt service of the metropolitan disposal system to be paid by the council in each fiscal year, and the costs of acquisition and betterment of the system which are to be paid during the year from funds other than bond proceeds, including all expenses incurred by the council pursuant to sections 473.501 to 473.545, are referred to in this section as current costs, and shall be allocated among and paid by all local government units which will discharge sewage, directly or indirectly, into the metropolitan disposal system during the budget year according to an allocation method determined by the council. The allocated costs may include an amount for a reserve or contingency fund and an amount for cash flow management. The cash flow management fund so established must not exceed five percent of the council's total waste control operating budget.
Subd. 2. [Repealed by amendment, 1997 c 181 s 2]
Subd. 3. Allocation of treatment, interceptor costs; reserved capacity. (a) In preparing each budget the council shall estimate the current costs of acquisition, betterment, and debt service, only, of the treatment works in the metropolitan disposal system which will not be used to total capacity during the budget year, and the percentage of such capacity which will not be used, and shall deduct the same percentage of such treatment works costs from the current costs allocated under subdivision 1. The council shall also estimate the current costs of acquisition, betterment, and debt service, only, of the interceptors in the metropolitan disposal system that will not be used to total capacity during the budget year, shall estimate the percentage of the total capacity that will not be used, and shall deduct the same percentage of interceptor costs from the current costs allocated under subdivision 1. The total amount so deducted with respect to all treatment works and interceptors in the system shall be allocated among and paid by the respective local government units in the metropolitan area through a metropolitan sewer availability charge for each new connection or increase in capacity demand to the metropolitan disposal system within each local government unit. Amounts collected through the metropolitan sewer availability charge (SAC) must be deposited in the council's wastewater reserve capacity fund. Each fiscal year an amount from the wastewater reserve capacity fund shall be transferred to the wastewater operating fund for the reserved capacity costs described in this paragraph. For the purposes of this subdivision, the amount transferred from the wastewater reserve capacity fund to the wastewater operating fund shall be referred to as the "SAC transfer amount."
(b) If, after appropriate study and a public hearing, the council determines for the next fiscal year that a reduction of the SAC transfer amount is necessary or desirable to ensure adequate funds remain in the wastewater reserve capacity fund, based on a goal of maintaining at least the next year's estimated SAC transfer amount in the wastewater reserve capacity fund, the council may reduce the SAC transfer amount for that fiscal year. If the council reduces the SAC transfer amount for the next fiscal year, the council must then increase the metropolitan sewer availability charge not less than the greater of six percent or the annual percentage change in the Consumer Price Index for the metropolitan region for the previous year plus three percentage points. For the purposes of this subdivision, any reduction in the SAC transfer amount shall be referred to as the "SAC transfer deficit." The provisions of this paragraph expire at the end of calendar year 2015.
(c) The council will record on a cumulative basis the total SAC transfer deficit. In any year that the wastewater reserve capacity fund has a year-end balance of at least two years' estimated SAC transfer amount, the council shall increase the subsequent annual SAC transfer amount in
Page - 18 | METROPOLITAN COUNCIL
excess of the amount required by paragraph (a) with the goal of eliminating the cumulative total SAC transfer deficit. The annual amount by which the council increases the SAC transfer amount shall be determined by the council after appropriate study and a public hearing.
Subd. 4. [Repealed, 1987 c 53 s 8]
Subd. 5. [Repealed, 1987 c 53 s 8] Subd. 6. Deferment of payments. The council may provide for the deferment of payment of all or part of the allocated costs which are allocated by the council to a local government unit in any year pursuant to subdivision 3, repayable at such time or times as the council shall specify, with interest at the approximate average annual rate borne by council bonds outstanding at the time of the deferment, as determined by the council. Such deferred costs shall be allocated to and paid by all local government units in the metropolitan area which will discharge sewage, directly or indirectly, into the metropolitan disposal system in the budget year for which the deferment is granted, in the same manner and proportions as costs are allocated under subdivision 1.
Subd. 7. [Repealed, 1987 c 53 s 8]
Subd. 8. [Repealed, 1994 c 628 art 3 s 209] Subd. 9. Advisory committees. The council may establish and appoint persons to advisory committees to assist the council in the performance of its wastewater control duties. If established, the advisory committees shall meet with the council to consult with such members concerning the acquisition, betterment, operation and maintenance of interceptors and treatment works in the metropolitan disposal system, and the allocation of costs therefore. Members of the advisory committee serve without compensation but must be reimbursed for their reasonable expenses as determined by the council.
Subd. 10. Direct charging of industrial users. (a) The term "industrial discharger" for the purposes of this subdivision means a recipient of wastewater treatment services that is required by council rules or procedures to have a permit issued by the council in order to discharge sewage to the metropolitan disposal system.
(b) The council may directly impose on all or any category of industrial dischargers all or any portion of the costs that would otherwise be allocated among and paid by local government units under subdivision 1. Any amounts imposed directly on industrial dischargers by the council under this subdivision must be deducted from the amounts to be allocated among and paid by local government units under subdivision 1, and any charges imposed by a local government unit for the same purpose are of no further force and effect from and after the effective date of the council's direct charges. Charges imposed under this subdivision are in addition to any other charges imposed on industrial dischargers by a local government unit and must be paid by the industrial discharger at such intervals as may be established by the council. The council may impose interest charges upon delinquent payments.
(c) Charges by the council to industrial dischargers under this subdivision including any interest charges, as well as any other charges or related fees owed by the industrial discharger pursuant to a discharge permit issued by the council for the subject property, are a charge jointly and severally against the owners, lessees, and occupants of the property served. The council may certify such unpaid amounts to the appropriate county auditor as a tax for collection as other taxes are collected on the property served. The proceeds of any tax collected pursuant to the council's certification must be paid by the county treasurer to the council when collected.
History: 1975 c 13 s 83; 1987 c 53 s 2-5; 1994 c 628 art 3 s 166-170; 1997 c 181 s 2;1Sp2003 c 16 s 8; 2010 c 212 s 1
Exhibit 4 MINNESOTA STATUTES 2013 473.519 473.519 1972 U.S. WATER POLLUTION CONTROL ACT: USE CHARGE SHARES.
Each local government unit shall adopt a system of charges for the use and availability of the metropolitan disposal system which will assure that each recipient of waste treatment services within or served by the unit will pay its proportionate share of the costs allocated to the unit by the council under section 473.517, as required by the federal Water Pollution Control Act amendments of 1972, and any regulations issued pursuant thereto. Each system of charges shall be submitted to the council if requested by the council.
History: 1975 c 13 s 84; 1994 c 628 art 3 s 171; 1997 c 181 s 3; 2013 c 101 s 5
Exhibit 5 40 CFR 35.929-1 - Approval of the user charge system. § 35.929-1 Approval of the user charge system.
The Regional Administrator may approve a user charge system based on either actual use under paragraph (a) of this section or ad valorem taxes under paragraph (b) of this section. The general requirements in §§ 35.929-2 and 35.929-3 must also be satisfied.
(a) User charge system based on actual use. A grantee's user charge system based on actual use (or estimated use) of waste water treatment services may be approved if each user (or user class) pays its proportionate share of operation and maintenance (including replacement) costs of treatment works within the grantee's service area, based on the user's proportionate contribution to the total waste water loading from all users (or user classes). To insure a proportional distribution of operation and maintenance costs to each user (or user class), the user's contribution shall be based on factors such as strength, volume, and delivery flow rate characteristics.
Contact Us 390 Robert Street North Saint Paul, MN 55101-1805