13
Page 1 of 13 User Guide for India’s 2047 Energy Calculator Municipal Waste to Energy

Page 1 of 13
User Guide for India’s 2047 Energy Calculator
Municipal Waste to Energy
Page 2 of 13
Sector Handbook: Municipal Waste to Energy
1. Overview of the sector/Introduction/ Trends and historic growth
As per Census 2011, 377 million people, that is, 31.2% of the total population in India live in towns.
Number of towns increased from 5161 in 2001 to 7935 in 2011. 42.6% of this urban population
resides in metropolitan cities. Further, it is expected that more than 50% of India’s population will
reside in urban areas by 2050.
One of the attributes of large agglomeration of people in urban areas is waste generation that is
beyond the assimilative capacity of the local ecosystem, and hence requires careful management.
Municipal Solid Waste (MSW), which gets generated primarily by households and commercial
establishments, is heterogeneous mix of combustibles, organic matter, inert materials and
moisture. Urban India produces about 1.5 lakh metric tonnes per day (MTPD) of MSW at present.
About 81% of total MSW is generated in 468 Class-I cities (cities with a population of more than
one million). Waste collection efficiency ranges between 70% and 90% in major metro cities, and
in several smaller cities, it is less than 50%.
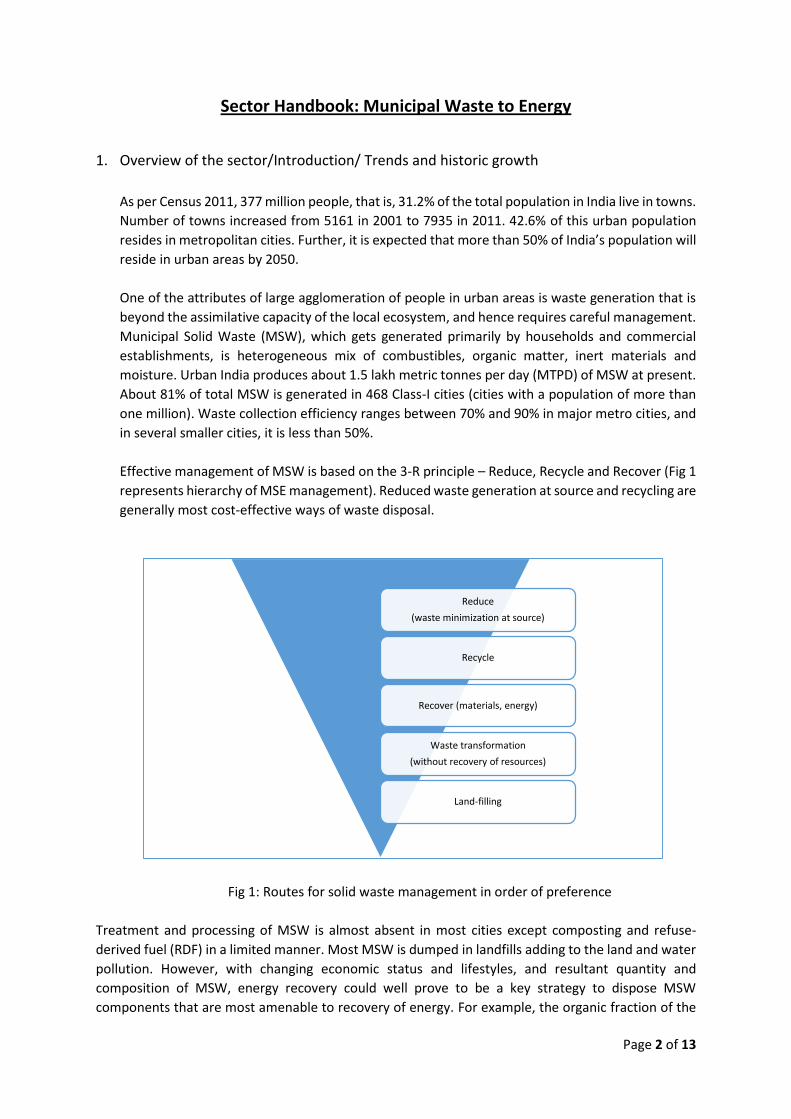
Effective management of MSW is based on the 3-R principle – Reduce, Recycle and Recover (Fig 1
represents hierarchy of MSE management). Reduced waste generation at source and recycling are
generally most cost-effective ways of waste disposal.
Fig 1: Routes for solid waste management in order of preference
Treatment and processing of MSW is almost absent in most cities except composting and refuse-
derived fuel (RDF) in a limited manner. Most MSW is dumped in landfills adding to the land and water
pollution. However, with changing economic status and lifestyles, and resultant quantity and
composition of MSW, energy recovery could well prove to be a key strategy to dispose MSW
components that are most amenable to recovery of energy. For example, the organic fraction of the
Reduce
(waste minimization at source)
Recycle
Recover (materials, energy)
Waste transformation
(without recovery of resources)
Land-filling
Page 3 of 13
MSW contains bio-degradable matter ranging from 30% to 55%, which can be converted into compost,
refuse-derived fuel or energy (WTE) products.
Energy generation from waste can be through biochemical conversion or combustion, depending on
various aspects such as the levels of segregation, collection efficiency of MSW and others.
While technologies for WTE are existent and in use for several decades in many countries, and first
experiments were held in India in last quarter of 20th century, WTE sector can still be considered in its
initial stages in India and the viability of technologies, process and projects, is still being established.
A major initiative that provided required impetus toward MSW management for large cities is
Jawaharlal Nehru Urban Renewal Mission (JNNURM), which envisages the components like primary
and secondary collection, transfer station, transportation, integrated solid waste management facility
with composting, RDF & sanitary landfills for MSW management. In parallel, there have been central
government sponsored programmes for small and medium cities. However, despite significant funding
being made available by Central Government to states and local bodies under the programs, the
progress is slow. The focus of urban bodies has been on removing garbage (read MSW) from the
houses and streets, and MSW segregation, and processing have taken back seats.
For same reasons, so far, there has been limited focus on recovering waste from energy, with India’s
installed capacity on waste to energy (urban and industrial) being only around 154 MW as on March
2015. All this capacity has been developed on mixed waste and incineration/ combustion /
biodegradation of waste is carried out after its processing at the energy recovery site, which is
certainly less optimal that segregating MSW at source.
2. Existing legal/regulatory policy frameworks
As per the Constitution of India, solid waste management is a state subject. State legislation and the
local laws governing municipal authorities include provisions for collection, transportation, and
disposal of waste. According to these legislations, urban local bodies (ULBs) or the municipal
authorities must provide these services.
At the central level, The Ministry of Urban Development (MoUD), Government of India, is the nodal
agency that formulates policies and strategies on various aspects of urban development including solid
waste management and also provides technical and financial assistance to the states. The Central
Public Health and Environmental Engineering Organisation (CPHEEO) is the technical wing of MoUD.
Ministry of New and Renewable Energy (MNRE) leads the development of waste to energy sector and
hence expected to collaborate closely with MoUD/CPHEEO as well as state level stakeholders.
Without appropriate legislation and any associated monitoring mechanisms on the performance of
municipalities, the system of waste management remained inefficient. Consequently, in response to
a public interest litigation filed in 1996, the Supreme Court of India, in 1999, directed the Government
of India, state governments, and municipal authorities to deliver effectively on management of solid
waste in the country. The Ministry of Environment and Forests (MoEF) was directed to issue rules for
MSW management and handling.
In the year 2000, the MoEF notified the Municipal Solid Waste (Management and Handling) Rules
2000, under the Environment Protection Act 1986. These rules mention steps to be taken by all
municipal authorities to ensure management of solid waste as per best practice. Municipal authorities

Page 4 of 13
are required to meet the deadlines stated in Schedule I of the rules and must adhere to the compliance
criteria and procedure mentioned in Schedule II. Implementation level guidelines were published in
2000 as ‘Manual on Municipal Solid Waste Management and Handling 2000’ by MoUD through
CPHEEO.
The MSW Management and Handling Rules 2000 require the municipal authorities to obtain clearance
from the state pollution control board (SPCB) to set up waste processing and disposal facilities. The
SPCBs are directed to process the application of municipal authorities and to provide clearance to the
municipalities within 45 days of the submission of the application.
The Central Pollution Control Board (CPCB) is responsible for coordinating the implementation of the
rules among the state boards. The municipalities were mandated to implement the rules by December
2003, with punishment for non-compliance. However, most municipalities did not meet the deadline.
Central and state governments are facilitating, through financial support and other means, provision
of MSW management services for ULBs, and the coming years will thus see more progress.
3. Drivers
India’s daily per capita solid waste generation is one of the lowest in the world – 0.2 to 0.6
kg/capita/day. This is because the consumption patterns have been low till now and recycling rates
are inherently high in the country. This is a positive factor when it comes to solid waste management.
Waste minimization, recycling, and traditional methods like composting are cost-effective ways of
waste management. However, with rapid urbanization, MSW generation is increasing and waste
composition has enhanced quantity of substances amenable only to energy recovery e.g. food
packaging, sanitary napkins etc.
To effectively process, manage and dispose of such waste, it is essential that we segregate waste at
generation points. Improved segregation and collection practices will also help recover energy in a
cost-effective manner because this is a critical parameter for successful operation of all the existing
waste to energy conversion technologies, which are otherwise well-proven, economically viable and
have been performing well in other countries. At the same time, pollution control technologies have
also become more efficient, which otherwise has been a major constraint for waste recovery
technologies in last few decades.
Effective waste management can provide alternative fuels that can be used in a variety of ways. For
instance, refuse-derived fuel (RDF) can be used to generate electricity. It can also replace traditional
fuels used in facilities such as cement kilns and thermal power plants. Converting MSW into biogas
can provide clean cooking fuel to rural areas, thereby reducing our dependence on hydrocarbons.
Thus, energy recovery from MSW will diversify to our energy basket.
However, in India, presently, segregated waste collection efficiency is nearly 0%. This is a major barrier
to widespread deployment of conversion technologies mentioned above. Additionally, issues in
maintaining a consistent supply chain of the feedstock for the conversion plants have delayed scale.
We envisage that segregation at source, mandated by the MSW (Management &
Handling) Rules, 2000, is expected to improve over the coming years. Waste management is also a key
focus area under the Jawaharlal Nehru National Urban Renewal Mission launched in 2005, and more
recently with the Swachh Bharat Abhiyaan, launched by the Honourable Prime Minister of India, in
October 2014.

Page 5 of 13
4. Assumptions
IESS 2047 assumes the following to build the supply trajectories for the municipal WTE sector:
a. Waste generation, collection efficiency, segregation efficiency and waste composition are
considered same across all four levels. The envisaged MSW composition is given below:
Table 1: Existing and projected composition of MSW
S.No. Organic/
compostables (food waste) (%)
Combustibles (paper, wood, plastics, rags, cloth, leather, rubber) (%)
Recyclables/inorganic (metals, ceramics,
glass) (%)
Others (dust, ash, fines, inert) (%)
2012 40 10 5 45
2047 44 26 9 21
b. Waste composition will have enhancing levels of organic waste (slow growth), combustibles (fast
growth), and recyclable materials (medium growth) while contribution of inert matter will keep
decreasing.
c. No significant waste to energy capacity additions will take place during the 12th plan
d. Beginning 13th plan, increasing quantities of waste will be channelized to generating energy as well
as electricity.
e. Urban areas
Waste generation will reach 750 g per capita in 2047 compared to 370 g per capita in 2012
Collection efficiency will reach 100% by 2047 from an average of around 70% in 2012
Segregation efficiency will reach 90% in 2047 compared to 0% in 2012
f. Rural areas
Per capita rural MSW generation will be less than that in urban areas
For purpose of energy recovery, even under the best scenario, only organic fraction of rural
MSW will be available because of sparse population density
Daily rural per capita organic waste generation is assumed to be half of that of its urban
counterpart at 325 g per capita in 2047 as compared to 75 g per capita in 2012
Collection efficiency will reach 100% by 2047
Segregation efficiency will reach close to 70% in 2047 compared to 0% in 2012
Table 2: Technology parameters for conversion routes
Bio-chemical conversion
Total Solids (TS) (%) 15
Total Volatile Solids (% of TS) 78
Typical digestion efficiency for urban systems (%)
Urban systems 60
Rural systems 45
Typical bio-gas yield (m3 / kg of VS destroyed)
0.6
Calorific value of bio-gas (typical) (kcal/m3)
5000
Thermo-chemical conversion
NCV of segregated combustibles (kCal/kg)
3600
Typical conversion efficiency (%)
25
1 KW (equivalent kCal/hr)
860
NCV of non-segregated waste (kCal/kg)
2400

Page 6 of 13
5. Methodology
IESS 2047 shows four levels for development of municipal waste to energy, over 2012-2047 for
urban as well as rural areas of India. The MSW generation rates and change in its characteristics
across the years are based on estimated growth rate of India’s urban and rural population and
also comparing the same with that of other developing as well as developed countries.
Technologies considered for modelling the scenarios are:
Biogas Generation through bio-methanation
Power Generation through thermo-chemical conversion using especially designed
combustion systems
Combined Heat and Power (CHP)
6. Scenarios
Level 1 assumes that there will be no capacity additions and hence MSW based waste-to-energy
capacity will remain at a level of 96MW. There will be no capacity additions even beyond 2017,
primarily due to lack of inter-agency coordination and favourable policies. Other key adverse
factor will be limited understanding of technical issues involved in construction, operational and
environmental aspects of MSW based waste-to-energy projects. Once these projects have lived
their life, there will be no MSW based waste-to-energy projects, by 2037.
Level 2 assumes that the capacity addition happen in line with 12th plan targets resulting in
153MW installed capacity by end of 12th Plan. Most of it will still be based on mixed MSW. With
improving segregation levels and Government’s focus on waste-to-energy, by 2047:
25% of segregated urban organic MSW will yield 0.36 MTOE of biogas
20% of segregated rural organic MSW will yield 0.28 MTOE of biogas
18% of total ‘waste to electricity generation’ potential will be realized resulting in approx
3,550MW installed power generation capacity
18% of segregated urban combustibles will be used as fuel yielding 2.36 MTOE of thermal
energy
Level 3 assumes that Government and ULBs emphasize on MSW based waste-to-energy as a key
resource recovery option. The policies and incentives get aligned. Rural areas adopt organic MSW
based gas as a key energy option. However in urban areas, evolving technologies like combined
heat and power still does not get any traction. By 2047:
50% of segregated urban organic MSW will yield 0.72 MTOE of biogas
40% of segregated rural organic MSW will yield 0.55 MTOE of biogas
30% of total ‘waste to electricity generation’ potential will be realized resulting in approx
5,850 MW installed power generation capacity
32% of segregated urban combustibles will be used as fuel yielding 4.4 MTOE of thermal
energy
Level 4 assumes that there are absolutely no barriers (economic, social or technical) to the growth
of MSW based waste-to-energy. Inter-agency conflicts are also resolved. Waste-to-energy sector
gets enhanced attention coupled with significant increases in fossil fuel prices, especially coal.

Page 7 of 13
Fossil fuel externalities are priced. Energy security is consciously factored in energy planning. In
this level, by 2047:
75% of segregated urban organic MSW will yield 1.09 MTOE of biogas
60% of segregated rural organic MSW will yield 0.83 MTOE of biogas
30% of total ‘waste to electricity generation’ potential will be realized resulting in approx
5,850MW installed power generation capacity
63% of segregated urban combustibles will be used as fuel yielding 8.44 MTOE of thermal
energy
30% of combustible urban waste will be used for combined heat and power applications
yielding 4.35 MTOE of energy
7. Costs
For building the cost trajectories, three types of applications have been considered:
Biogas generation
Mixed waste to power
Segregated waste to power
CHP has not been accounted for in the cost estimates because there is no CHP plant in India that
is currently operational.
Inputs were sought from experts, practitioners and technology providers to arrive at possible
trends in capital costs for the applications specified above.
Assumptions
Cost trajectories assume the following:
I. Waste collection and segregation costs are not loaded to energy generation facility since
the associated costs would anyways have to be incurred for effective solid waste
management
II. Waste processing costs are included in the estimated capital, operation and
maintenance costs
III. Calorific value of segregated waste and mixed waste is assumed to be 3600 kCal/kg and
2400 kCal/kg respectively, beyond 2017
IV. Operations and maintenance expenses (as a percentage of capital expenditure) have
been assumed as:
• 8% (segregated waste to power)
• 10% (mixed waste to power)
• ~5% (biogas generation)
8. Tables- Scenarios (High, low, point)
Biogas generation
Table 3: Capital cost per TPD for new capacity (INR Crore)

Page 8 of 13
Year 2012 2017 2022 2027 2032 2037 2042 2047
High Estimate 0.29 0.28 0.28 0.28 0.27 0.27 0.27 0.27
L1 0.29 0.28 0.27 0.27 0.26 0.26 0.25 0.25
L2 0.29 0.28 0.27 0.27 0.26 0.26 0.25 0.25
L3 0.29 0.27 0.26 0.24 0.23 0.22 0.21 0.20
L4 0.29 0.27 0.25 0.23 0.21 0.20 0.18 0.17
Low Estimate 0.29 0.26 0.24 0.22 0.20 0.19 0.17 0.16
Table 4: Annual operation and maintenance cost per TPD for new capacity (INR Crore)
Year 2012 2017 2022 2027 2032 2037 2042 2047
High Estimate 0.011 0.011 0.011 0.011 0.011 0.011 0.011 0.011
L1 0.011 0.011 0.011 0.011 0.011 0.010 0.010 0.010
L2 0.011 0.011 0.011 0.011 0.011 0.010 0.010 0.010
L3 0.011 0.011 0.010 0.010 0.009 0.009 0.008 0.008
L4 0.011 0.011 0.010 0.009 0.009 0.008 0.007 0.007
Low Estimate 0.011 0.010 0.010 0.009 0.008 0.008 0.007 0.006
Power generation (through mixed MSW)
Table 5: Capital cost per MW for new capacity (INR Crore)
Year 2012 2017 2022 2027 2032 2037 2042 2047
High Estimate 21.0 20.8 20.6 20.4 20.2 20.0 19.8 19.6
L1 21.0 20.6 20.2 19.8 19.4 19.0 18.6 18.2
L2 21.0 20.6 20.2 19.8 19.4 19.0 18.6 18.2
L3 21.0 20.0 19.0 18.0 17.1 16.2 15.4 14.7
L4 21.0 19.5 18.2 16.9 15.7 14.6 13.6 12.6
Low Estimate 21.0 19.3 17.8 16.4 15.0 13.8 12.7 11.7
Table 6: Annual operation and maintenance cost per MW for new capacity (INR Crore)
Year 2012 2017 2022 2027 2032 2037 2042 2047
High Estimate 2.10 2.08 2.06 2.04 2.02 2.00 1.98 1.96
L1 2.10 2.06 2.02 1.98 1.94 1.90 1.86 1.82
L2 2.10 2.06 2.02 1.98 1.94 1.90 1.86 1.82
L3 2.10 2.00 1.90 1.80 1.71 1.62 1.54 1.47
L4 2.10 1.95 1.82 1.69 1.57 1.46 1.36 1.26
Low Estimate 2.10 1.93 1.78 1.64 1.50 1.38 1.27 1.17
Power generation (through segregated MSW)
Table 7: Capital cost per MW for new capacity (INR Crore)
Year 2012 2017 2022 2027 2032 2037 2042 2047
High Estimate 17.0 16.8 16.7 16.5 16.3 16.2 16.0 15.8
L1 17.0 16.7 16.3 16.0 15.7 15.4 15.1 14.8
L2 17.0 16.7 16.3 16.0 15.7 15.4 15.1 14.8
Page 9 of 13
L3 17.0 16.3 15.7 15.0 14.4 13.9 13.3 12.8
L4 17.0 16.0 15.0 14.1 13.3 12.5 11.7 11.0
Low Estimate 17.0 15.6 14.4 13.2 12.2 11.2 10.3 9.5
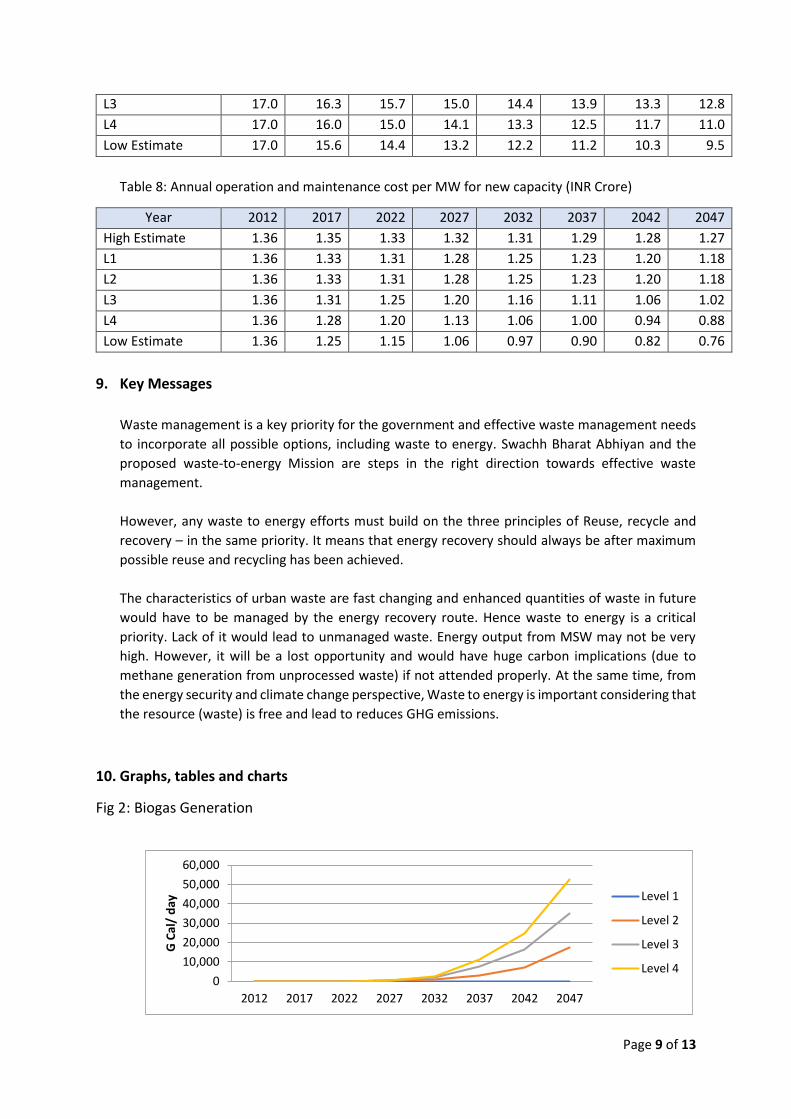
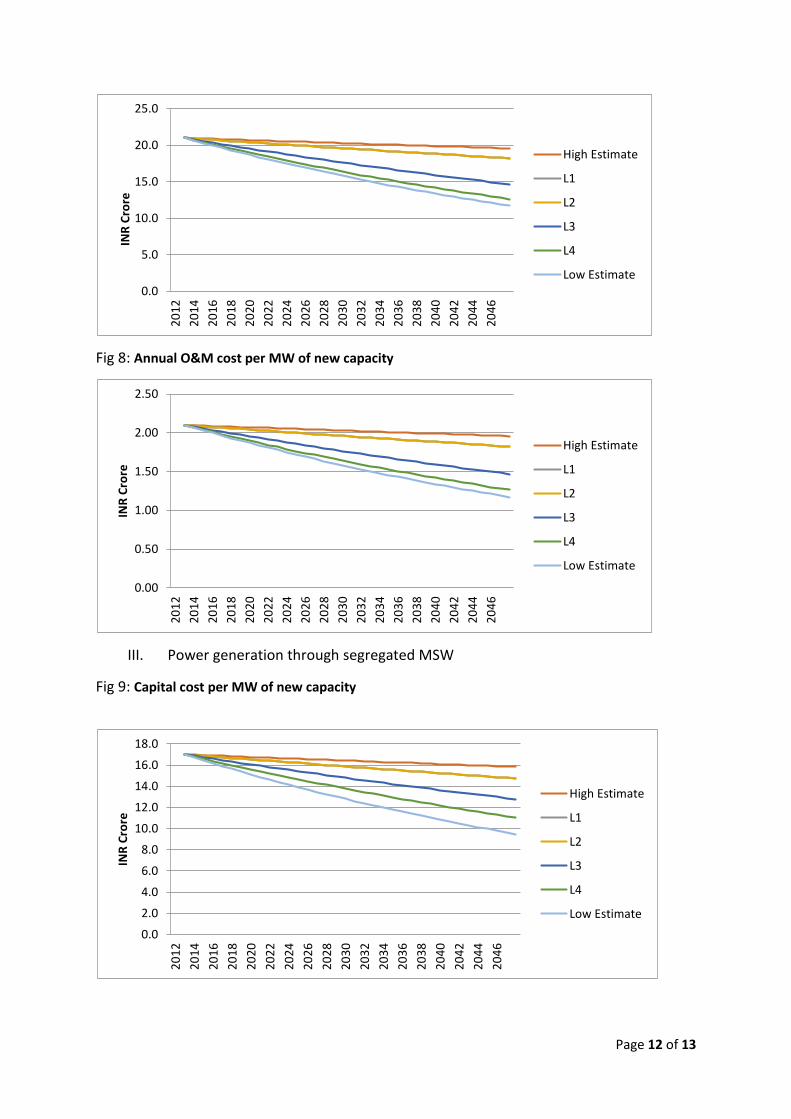
Table 8: Annual operation and maintenance cost per MW for new capacity (INR Crore)
Year 2012 2017 2022 2027 2032 2037 2042 2047
High Estimate 1.36 1.35 1.33 1.32 1.31 1.29 1.28 1.27
L1 1.36 1.33 1.31 1.28 1.25 1.23 1.20 1.18
L2 1.36 1.33 1.31 1.28 1.25 1.23 1.20 1.18
L3 1.36 1.31 1.25 1.20 1.16 1.11 1.06 1.02
L4 1.36 1.28 1.20 1.13 1.06 1.00 0.94 0.88
Low Estimate 1.36 1.25 1.15 1.06 0.97 0.90 0.82 0.76
9. Key Messages
Waste management is a key priority for the government and effective waste management needs
to incorporate all possible options, including waste to energy. Swachh Bharat Abhiyan and the
proposed waste-to-energy Mission are steps in the right direction towards effective waste
management.
However, any waste to energy efforts must build on the three principles of Reuse, recycle and
recovery – in the same priority. It means that energy recovery should always be after maximum
possible reuse and recycling has been achieved.
The characteristics of urban waste are fast changing and enhanced quantities of waste in future
would have to be managed by the energy recovery route. Hence waste to energy is a critical
priority. Lack of it would lead to unmanaged waste. Energy output from MSW may not be very
high. However, it will be a lost opportunity and would have huge carbon implications (due to
methane generation from unprocessed waste) if not attended properly. At the same time, from
the energy security and climate change perspective, Waste to energy is important considering that
the resource (waste) is free and lead to reduces GHG emissions.
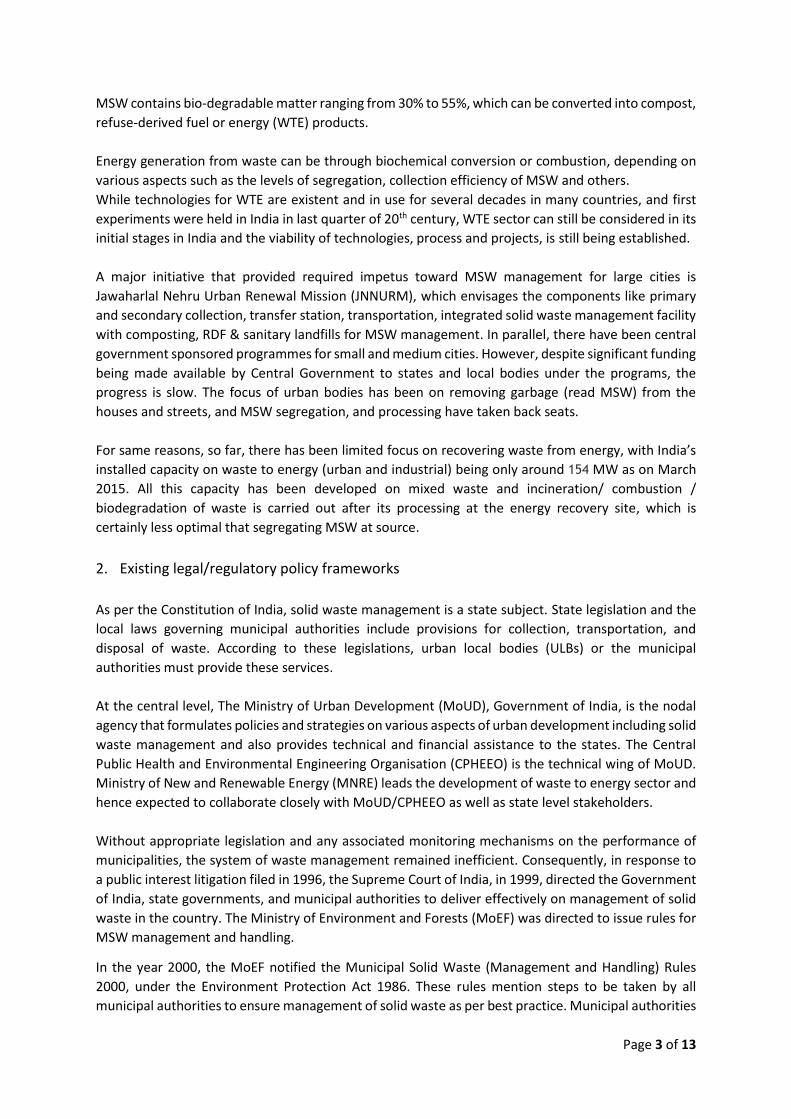
10. Graphs, tables and charts
Fig 2: Biogas Generation
0
10,000
20,000
30,000
40,000
50,000
60,000
2012 2017 2022 2027 2032 2037 2042 2047
G C
al/
day
Level 1
Level 2
Level 3
Level 4

Page 10 of 13
Fig 3: Fuel Availability
Fig 4: Waste to Power Capacity
0
50
100
150
200
250
2012 2017 2022 2027 2032 2037 2042 2047
TCal
/ d
ay
Level 1
Level 2
Level 3
Level 4
0
2,000
4,000
6,000
8,000
2012 2017 2022 2027 2032 2037 2042 2047
MW
Level 1
Level 2
Level 3
Level 4

Page 11 of 13
Costs
I. Biogas generation
Fig 5: Capital cost per TPD of new capacity
Fig 6: Annual O&M cost per TPD of new capacity
II. Power generation through mixed MSW
Fig 7: Capital cost per MW of new capacity
0.00
0.05
0.10
0.15
0.20
0.25
0.30
20
12
20
14
20
16
20
18
20
20
20
22
20
24
20
26
20
28
20
30
20
32
20
34
20
36
20
38
20
40
20
42
20
44
20
46
INR
Cro
re
HighEstimate
L1
L2
L3
0.000
0.002
0.004
0.006
0.008
0.010
0.012
20
12
20
14
20
16
20
18
20
20
20
22
20
24
20
26
20
28
20
30
20
32
20
34
20
36
20
38
20
40
20
42
20
44
20
46
INR
Cro
re
High Estimate
L1
L2
L3
L4
Low Estimate
Page 12 of 13
Fig 8: Annual O&M cost per MW of new capacity
III. Power generation through segregated MSW
Fig 9: Capital cost per MW of new capacity
0.0
5.0
10.0
15.0
20.0
25.0
20
12
20
14
20
16
20
18
20
20
20
22
20
24
20
26
20
28
20
30
20
32
20
34
20
36
20
38
20
40
20
42
20
44
20
46
INR
Cro
re
High Estimate
L1
L2
L3
L4
Low Estimate
0.00
0.50
1.00
1.50
2.00
2.50
20
12
20
14
20
16
20
18
20
20
20
22
20
24
20
26
20
28
20
30
20
32
20
34
20
36
20
38
20
40
20
42
20
44
20
46
INR
Cro
re
High Estimate
L1
L2
L3
L4
Low Estimate
0.0
2.0
4.0
6.0
8.0
10.0
12.0
14.0
16.0
18.0
20
12
20
14
20
16
20
18
20
20
20
22
20
24
20
26
20
28
20
30
20
32
20
34
20
36
20
38
20
40
20
42
20
44
20
46
INR
Cro
re
High Estimate
L1
L2
L3
L4
Low Estimate

Page 13 of 13
Fig 10: Annual O&M cost per MW of new capacity
11. References a. Report of the Task Force on Waste to Energy (Volume II), Planning Commission of India,
May 2014
b. Toolkit for Solid Waste Management, Jawaharlal Nehru National Urban Renewal
Mission, Ministry of Urban Development, Government of India, November 2012
c. Report Of Central Pollution Control Board On “Status Of Compliance By CPCB with
Municipal Solid Wastes (Management And Handling) Rules, 2000; published 2012;
available at http://www.cpcb.nic.in/divisionsofheadoffice/pcp/MSW_Report.pdf
d. Manual on Municipal Solid Waste Management, Ministry of Urban Development Expert
Committee, 2000; available at
http://www.indiawaterportal.org/sites/indiawaterportal.org/files/Manual%20on%20mu
nicipal%20solid%20waste%20management_%20MoUD_GOI_2000.pdf
e. Improving Municipal Solid Waste Management in India: A Sourcebook for Policy Makers
and Practitioners; World Bank, Washington, DC, 2008
f. Physical Progress (Achievements), Ministry of New and Renewable Energy, Government
of India; available at http://mnre.gov.in/mission-and-vision-2/achievements/
12. Acknowledgements
We gratefully acknowledge expert inputs received from:
a. Thermax Ltd.
b. IL&FS Environmental Infrastructure & Services Ltd.
c. Kirloskar Integrated Technologies Ltd.
d. Jindal Ecopolis
0.00
0.20
0.40
0.60
0.80
1.00
1.20
1.40
1.60
20
12
20
14
20
16
20
18
20
20
20
22
20
24
20
26
20
28
20
30
20
32
20
34
20
36
20
38
20
40
20
42
20
44
20
46
INR
Cro
re
High Estimate
L1
L2
L3
L4
Low Estimate


