Page 1
Murdoch University - School of Engineering and Energy
Engineering Thesis Development of the Photovoltaic Training Facility on the Engineering and Energy Building
Luke de Hoog 2013
A report submitted to the School of Engineering and Information Technology, Murdoch
University in partial fulfilment of the requirements for the degree of Bachelor of Engineering.
Page 2
2
Abstract
Solar energy is an abundant resource, especially in Australia. While increasing numbers of
households, businesses and utility companies are installing photovoltaics to combat climate change
and ever increasing power bills, network operators are having to deal with the problems this can
cause such as voltage rise and other power quality issues. Monitoring of PV systems is becoming
increasingly more important in addressing such issues, as is localised environmental monitoring.
Utilising different sensors to measure solar radiation, ambient temperature and wind speed,
network operators are better able to predict and react to environmental changes which can affect
the output of PV systems.
This report focuses on the installation of an environmental and PV inverter monitoring system for
the Photovoltaic Training Facility on the Engineering and Energy Building at Murdoch University.
This work follows on from that of Stuart Kempin who designed and managed the installation of the
PV Training Facility and Mael Riou who designed much of the environmental monitoring system.
The environmental monitoring system consists of two anemometers, a wind vane, an ambient
temperature sensor, two pyranometers (one mounted horizontally and one mounted on the plane
of the PV array) and RTD temperature sensors for PV module temperature measurement. The
communication interface for these sensors incorporates I/O modules from Avantech’s ADAM 4000
series and communicates via RS485 with a computer running the LabView programming software for
monitoring and logging purposes. Design work for the environmental monitoring system is now
complete, including specifications and drawings for the mounting brackets.
For monitoring the PV inverters, serial communication is also utilised. Where required, each inverter
is fitted with a serial communication card which is wired to the same computer used for
environmental monitoring via an RS485 to USB adapter. Again, the LabView programming software
is used to monitor the inverters. All physical aspects of the inverter monitoring system have been
completed. This includes the selection and acquisition of a suitable computer interface along with
enclosure design and construction to suit. Installation of serial communication cards in the inverters
and wiring and connection of the inverters has also been completed.
Several smaller assignments were also undertaken over the course of the project such as the review
of technical diagrams provided by the installer of the PV Training Facility and testing of the SMA
Backup system to ensure correct functionality. Some background information on the functional
earthing of PV arrays is given and discussed in relation to the PV Training Facility. Unfortunately,
Page 3
3
final schematic diagrams of the system have not yet been obtained however sections of the actual
system configuration including the functional earthing arrangement have been confirmed.
The eventual goal of the system is to provide a solid, safe and informative teaching platform which
can be used in the future to educate students on the role such monitoring systems may have in real-
world scenarios. It is also planned to utilise the system to compare PV technologies and inverter
topologies and their reactions under different environmental conditions.
Page 4
4
Acknowledgements
I would like to thanks Dr Martina Calais for her support and provision of knowledge throughout this
project. Her efficiency, punctuality and willingness to provide time and information have been vital
to the completion of this project.
Dr Calais must also be thanked for her excellent teaching and course content throughout the
Renewable Energy Engineering degree. She has provided inspiration and enthusiasm to me and
many other students throughout the degree.
Special thanks must also go to:
Mr Craig Carter for co-supervising my thesis. Craig’s extensive knowledge and industry experience
was highly valued throughout the course of the project.
Mr Will Sterling [Technician] for his knowledge on the topic of serial communication and his
assistance installing and wiring the serial communication system for the PV inverters and the
monitoring computer.
Mr Lafeta Laava [Technician] for his assistance in installing and wiring the serial communication
system for the PV inverters and his willingness to assist with equipment at any time.
Mr John Boulton [Technician] for offering his time in consultation regarding sensor mounting
arrangements, computer setup and access arrangements for the PV Training Facility.
Mrs Julie Yewers for her persistence in resolving the issues surrounding the installation and
commissioning of the PV Training Facility.
Finally, I would like to thank my family, especially my wife Chloe, for their understanding, support
and patience throughout the project.
Page 5
5
Contents Abstract ................................................................................................................................................... 2
Acknowledgements ................................................................................................................................. 4
List of Figures .......................................................................................................................................... 7
List of Tables ........................................................................................................................................... 8
1.0 Introduction ...................................................................................................................................... 9
1.1 Review of Texts and Previous Work .............................................................................................. 9
1.2 Background on the Photovoltaic Training Facility ...................................................................... 10
1.3 Cloud Fluctuation Impact on PV System Stability ....................................................................... 11
1.4 Design Requirements .................................................................................................................. 12
1.5 Project Timeline and Difficulties ................................................................................................. 12
2.0 Monitoring System .......................................................................................................................... 15
2.1 Initial System Status and Early Planning Decisions ..................................................................... 15
2.1.1 Equipment Status ................................................................................................................. 15
2.1.2 PV Inverter Interfacing ......................................................................................................... 16
2.2 Environmental Monitoring Design .............................................................................................. 17
2.2.1 Mounting brackets ............................................................................................................... 17
2.3 PV Inverter Monitoring ............................................................................................................... 18
2.3.1 RS485 Interface Selection .................................................................................................... 18
2.3.2 Computer Setup and Security .............................................................................................. 18
2.3.3 Wiring Configuration ............................................................................................................ 19
2.3.4 SMA Daisy Chaining Wiring Diagram ................................................................................... 20
2.3.5 Samil Power SolarRiver Wiring............................................................................................. 25
2.3.6 Fronius IG20 Interface and Wiring ....................................................................................... 25
2.3.7 Monitoring Software ............................................................................................................ 25
2.4 Serial Communication ................................................................................................................. 26
2.4.1 Background on Serial Communication ................................................................................. 26
2.4.2 RS232 ................................................................................................................................... 27
2.4.3 RS485 ................................................................................................................................... 28
2.4.4 RS485 Interface Overview .................................................................................................... 28
2.4.5 Enclosure Design .................................................................................................................. 28
2.5 Monitoring System Conclusions.................................................................................................. 30
3.0 PV Training Facility Review ............................................................................................................. 31
3.1 Functional Earthing ..................................................................................................................... 31
Page 6
6
3.1.1 Functional Earthing Background and Effects ....................................................................... 31
3.1.2 Functional Earthing in the PV Training Facility .................................................................... 32
3.2 SMA SBU5000 testing ................................................................................................................. 35
3.2.1 System Operation Overview ................................................................................................ 36
3.2.2 Test 1 – Operation Under Load in a Blackout and Restoration Situation (short term outage)
...................................................................................................................................................... 37
3.2.3 Test 2 - Operation Under Load in a Blackout and Restoration Situation (medium term
outage) .......................................................................................................................................... 38
3.2.4 Test 3 - Operation Under Load in a Blackout and Restoration Situation (long term outage)
...................................................................................................................................................... 38
3.2.5 Test Results .......................................................................................................................... 39
3.2.6 SBU5000 Charge Regime ...................................................................................................... 39
3.3 Review of PV Training Facility Schematics .................................................................................. 40
3.4 PV Training Facility Conclusions .................................................................................................. 41
4.0 Conclusion ....................................................................................................................................... 42
5.0 Future Work .................................................................................................................................... 43
5.1 Work to be done on the environmental monitoring system ...................................................... 43
5.2 Work to be done on the PV inverter monitoring system............................................................ 43
5.3 Work to be done in the PV Training Facility ............................................................................... 43
5.4 Power Analyser ........................................................................................................................... 44
Bibliography .......................................................................................................................................... 45
Appendix ............................................................................................................................................... 47
Documents provided to John Boulton specifying pyranometer mounting equipment .................... 47
Page 7
7
List of Figures
Figure 1 - Timeline of major project events .......................................................................................... 12
Figure 2 - PV array configuration and proposed environmental sensor positioning and locations (Riou
2012) ..................................................................................................................................................... 13
Figure 3 - Proposed system schematic and equipment location (Riou 2012) ...................................... 14
Figure 4 - PV Training Facility room configuration................................................................................ 19
Figure 5 - PV inverter interfacing layout ............................................................................................... 20
Figure 6 - SMA daisy chaining wiring schematic ................................................................................... 21
Figure 7 – SMA SBU5000 RS485 pin configuration ............................................................................... 21
Figure 8 - SMA SB1100 with RS485 communication card installed ...................................................... 22
Figure 9 - SMA SB1700 with RS485 communication card installed ...................................................... 22
Figure 10 - SMA SBU5000 with RS485 communication card installed ................................................. 23
Figure 11 - Close-up of RS485 communication card installed in SMA SB1700 ..................................... 24
Figure 12 - RS485 to USB interface in 3D printed enclosure ................................................................ 29
Figure 13 - Google SketchUp model of RS485 to USB enclosure .......................................................... 30
Figure 14 - SMA SB1700 with negative earthing kit installed ............................................................... 33
Figure 15 - SMA SB1100 with negative earthing kit installed ............................................................... 33
Figure 16 - Fronius solar supply switchboard showing positive earthing link ...................................... 34
Figure 17 - Schematic diagram of SMA Sunny Backup system ............................................................. 35
Figure 18 - SMA Sunny Backup relay operation under testing ............................................................. 37
Figure 19 - Pyranometer mounting bracket [view 1] ............................................................................ 47
Figure 20 - Pyranometer mounting bracket [view 2] ........................................................................... 47
Figure 21 - Pyranometer mounting bracket [view 3] ........................................................................... 48
Figure 22 - Wind sensor mounting bracket .......................................................................................... 49
Page 8
8
List of Tables
Table 1 - Specified system configuration .............................................................................................. 10
Table 2 - Equipment available upon commencement of project ......................................................... 15
Table 3 - Equipment required to complete the installation of the environmental monitoring system
.............................................................................................................................................................. 16
Table 4 - PV inverter interfacing equipment available at beginning of project .................................... 16
Table 5 - Serial interface options .......................................................................................................... 18
Table 6 - Samil Power RJ11 pin configuration ....................................................................................... 25
Table 7 - Monitoring software options ................................................................................................. 26
Page 9
9
1.0 Introduction
Murdoch University has had a significant involvement with renewable energy for some time. It was
one of the first universities in Australia to offer a bachelor’s degree in Renewable Energy Engineering
and currently has some of the best renewable energy research facilities in Australia (University,
Murdoch 2013). As well as the 56kWp photovoltaic array installed on the library on the South street
Campus, Murdoch University has recently invested in an 8kWp photovoltaic installation on the
recently constructed Engineering and Energy Building.
The aim is to use this system as a teaching and learning aid as well as a research tool, allowing the
observation of the environmental effects on the power output of different PV technologies and
inverter topologies as well as monitoring the degradation and responsiveness to environmental
change of each cell type. The inverters’ response to change may also be monitored. The ability to
perform detailed performance analyses and compare cell and inverter technologies is advantageous,
as it will provide data which may be used for developing better PV systems as well as designing
systems specifically depending on their location and needs.
This report will focus on the completion of the environmental monitoring system as well as the
design and implementation of a monitoring system for the PV inverters. It will also report on the
commissioning and testing of the PV systems and the review of technical diagrams. Over the course
of the project, several smaller issues were met and will also be discussed in this report.
1.1 Review of Texts and Previous Work
This thesis project follows on from work by Stuart Kempin and Mael Riou.
The PV Training Facility was designed and its installation managed by Stuart Kempin for his final year
engineering thesis (Kempin 2012) and was intended to be used as a teaching and learning aid.
The system consists of five solar PV systems comprising four different PV technologies, including
polycrystalline, monocrystalline, CIGS (Copper Indium Gallium Selenide) thin film and amorphous.
Five different inverter models were used from three different manufacturers, namely SMA, Fronius
and Samil Power. A total of 8kW [DC] was installed.
As the installation is to be used as a teaching resource, monitoring equipment for both
environmental conditions and AC and DC electrical parameters are required. Mael Riou took on the
Page 10
10
challenge of designing the environmental monitoring system in his thesis (Riou 2012). The system
he designed consists of two anemometers, a wind vane, an ambient temperature sensor, two
pyranometers (one mounted horizontally and the other mounted on the plane of the PV array) and
RTD temperature sensors for PV module temperature measurement. The sensors are interfaced
with a computer via I/O modules from Avantech’s ADAM 4000 series and an RS485-PCI adapter.
LabView programming software is used to monitor and log the incoming data.
Several standards were referred to over the course of the project including IEC61724: Photovoltaic
system performance monitoring - Guidelines for measurement, data exchange and analysis;
IEC61215: Crystalline silicon terrestrial photovoltaic (PV) modules - Design qualification and type
approval, AS5033: Installation and Safety Requirements for Photovoltaic (PV) Arrays and AS4777:
Grid Connection of Energy Systems via Inverters.
The technical manuals for each inverter and their respective serial interfaces were also utilised for
information regarding connection and correct operation.
1.2 Background on the Photovoltaic Training Facility
Table 1 gives a description of the make/model of the equipment specified for installation in the PV
Training Facility, the quantities of each and the configuration. Please see figure 2 for physical array
configuration and figure 3 for the proposed system schematic and equipment location.
Table 1 - Specified system configuration
PV Modules
Monocrystalline Polycrystalline Amorphous Thin Film (CIGS)
Model Sunpower E19 HHV AmpleSun Q.Cells
SPR-238E-WHT-D HSDTDF24255P ASF100 Q.Smart 90
Array configuration
Array number 1 2 3 4 5
Number of modules
9 8 20 6 16
Configuration 9S1P 8S1P 4S5P 3S2P 4S4P
Array power (W, nominal)
2142 2040 2000 540 1440
Inverter make/model
Fronius IG20 Samil Power SolarRiver
2300TL
SMA Sunny Boy
SB2500HF
SMA Sunny Boy SB1100
SMA Sunny Boy
SB1700
Inverter nominal power (AC, W)
1800 2000 2500 1000 1550
Page 11
11
This facility is a valuable resource for teaching due to the multiple PV module technologies and
inverter topologies. It allows the different types to be compared in an accurate way and with the
inclusion of the monitoring system and enables the effects of weather on each system to be clearly
demonstrated.
At the beginning of the project, the system was yet to be commissioned. Regular contact was made
with the project manager, Julie Yewers, in the hope that the commissioning could be attended for
documentation, however, due to a communication error this did not take place. The handover of
the system by Vince Aitken (TPE services) was attended where several issues were identified. These
and the subsequent resolutions will be discussed later in this report.
1.3 Cloud Fluctuation Impact on PV System Stability
As the production of energy in a PV system relies primarily on the availability of light from the sun,
any rapid changes in this resource can have a substantial impact on the output of the system. In
areas where there is a high level of PV penetration, this can cause problems with the stability of the
wider electricity network. A case study performed in the Western Australian town of Carnarvon
(Lewis 2012) states: “When the systems are highly clustered together (such as in the Carnarvon
network), it is possible that large clouds can effectively reduce a large proportion of PV generation in
a short period of time.” It goes on to say: “The combination of these effects is that passing cloud
cover has the potential to cause large and rapid variation in PV system output...” (Lewis 2012).
The bulk of the energy produced in Carnarvon is supplied by gas and diesel generators and
distributed on an isolated grid. PV penetration is estimated to peak at 13% of system load at
midday. In a network such as this, a rapid fall in PV generation due to sudden cloud cover appears as
a large load variation to the main generators which can, depending on generator ramps rates and
spinning reserve, cause issues with system stability. This can mean issues with system frequency
and generator overload as well as over and under-voltages throughout the network.
The PV Training Facility is designed to allow the monitoring of the effects of rapid changes in cloud
cover on different system types. Once up and running, it will prove to be a useful resource for
research into cases such as that in Carnarvon and will potentially allow for the design of systems
which will provide better stability to smaller isolated grids.
Page 12
12
1.4 Design Requirements
The system as a whole must be able to record high-resolution data from the environmental sensors
as well as data from the PV inverters. The system must be user friendly as it will be used as a
teaching aid with students. This also means it must be extremely safe, with no live parts easily
accessible. The user interface should be informative and easy to use.
Other requirements include:
Brackets for equipment which will be located outside must be corrosion and UV resistant and
waterproof where required.
All equipment must comply with the relevant standards.
All equipment should be installed to meet the relevant standards.
Provision for future improvement, development or expansion is desirable.
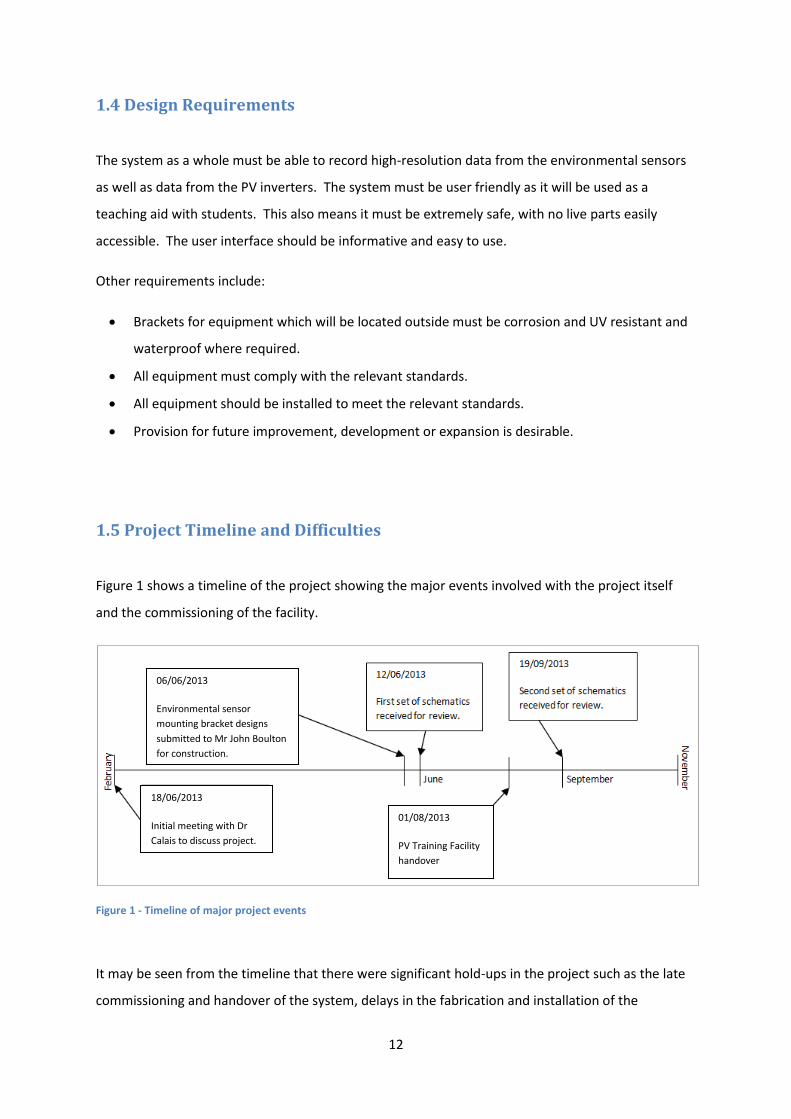
1.5 Project Timeline and Difficulties
Figure 1 shows a timeline of the project showing the major events involved with the project itself
and the commissioning of the facility.
Figure 1 - Timeline of major project events
It may be seen from the timeline that there were significant hold-ups in the project such as the late
commissioning and handover of the system, delays in the fabrication and installation of the
06/06/2013
Environmental sensor
mounting bracket designs
submitted to Mr John Boulton
for construction.
18/06/2013
Initial meeting with Dr
Calais to discuss project.
01/08/2013
PV Training Facility
handover
Page 13
13
mounting equipment for the environmental sensors and issues with the confirmation and
finalisation of the schematic diagrams and system configuration. Unfortunately, these set-backs
limited the amount of work which could be completed over the course of the project.
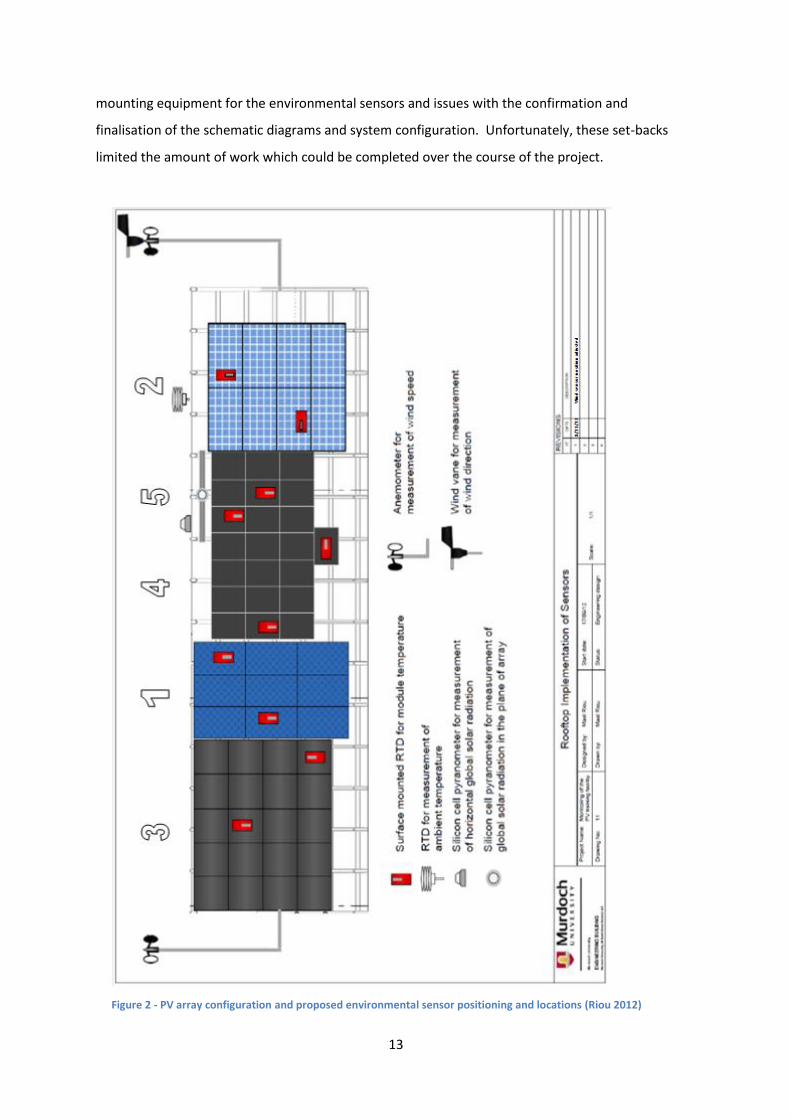
Figure 2 - PV array configuration and proposed environmental sensor positioning and locations (Riou 2012)
Page 14
14
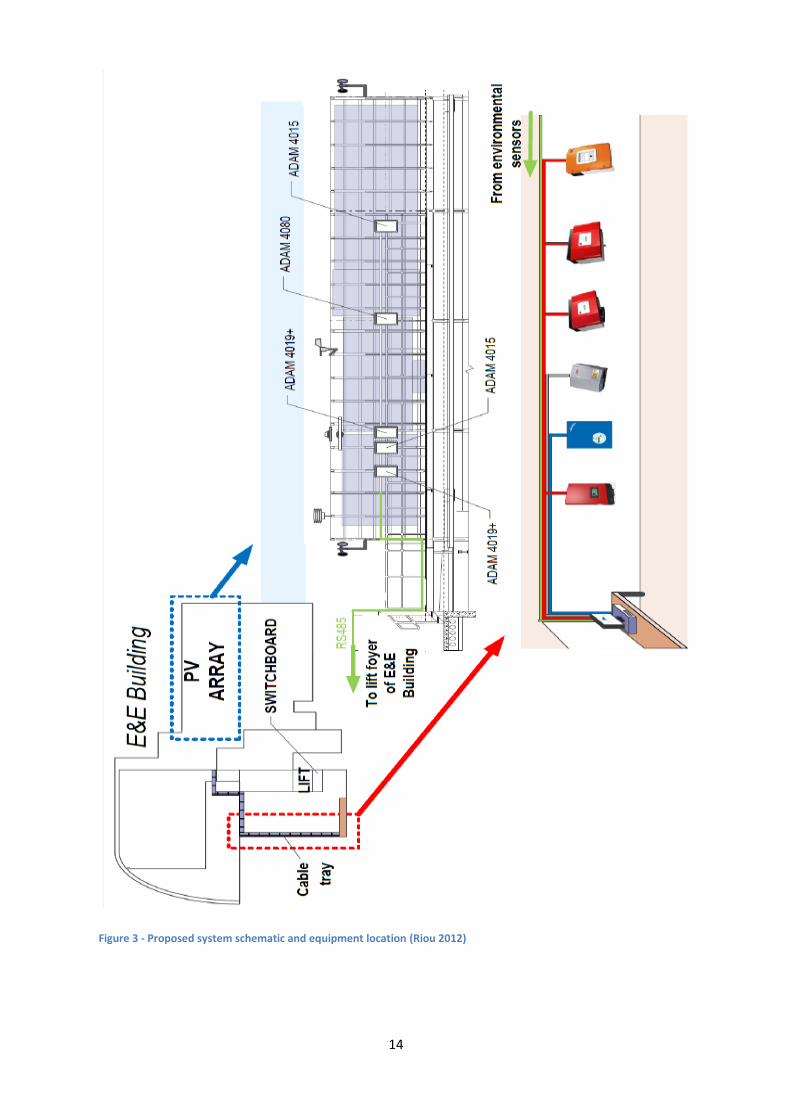
Figure 3 - Proposed system schematic and equipment location (Riou 2012)
Page 15
15
2.0 Monitoring System
2.1 Initial System Status and Early Planning Decisions
At the beginning of the project, the PV systems were yet to be connected to the grid. Unfortunately,
this meant any work on the inverter monitoring system was limited to design and component
acquisition. Fortunately, there was some work to be done designing the mounts for the
environmental sensors.
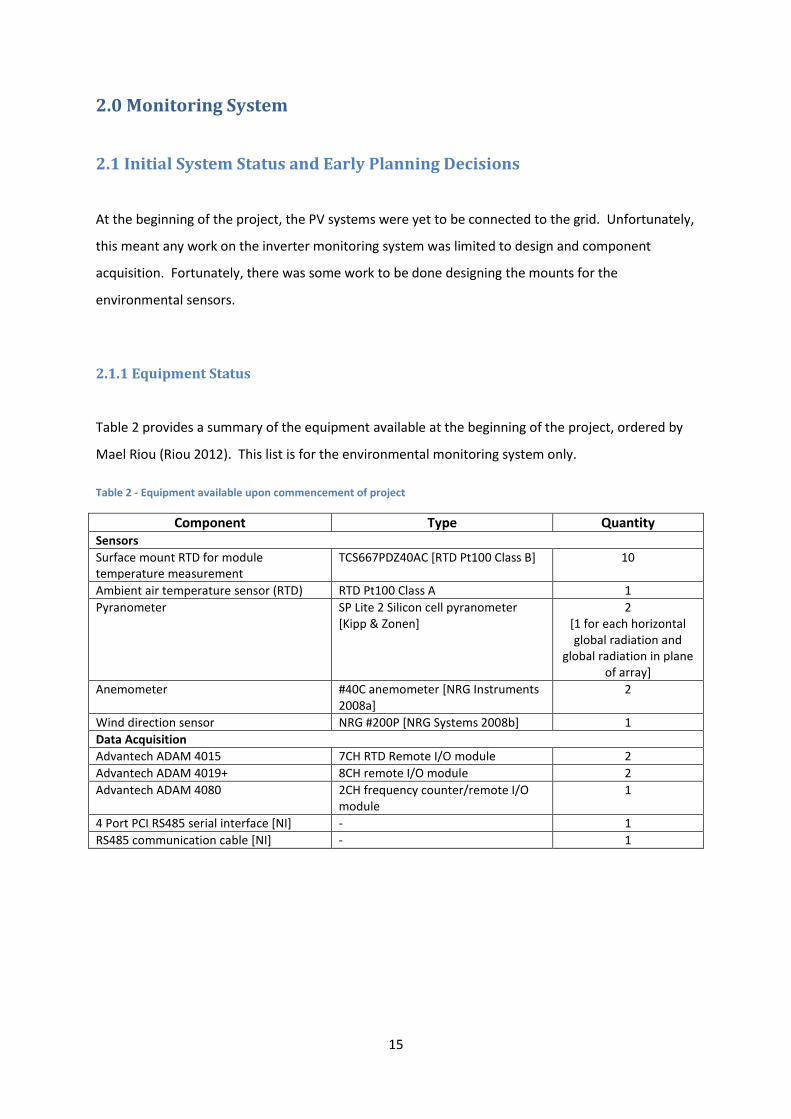
2.1.1 Equipment Status
Table 2 provides a summary of the equipment available at the beginning of the project, ordered by
Mael Riou (Riou 2012). This list is for the environmental monitoring system only.
Table 2 - Equipment available upon commencement of project
Component Type Quantity Sensors
Surface mount RTD for module temperature measurement
TCS667PDZ40AC [RTD Pt100 Class B] 10
Ambient air temperature sensor (RTD) RTD Pt100 Class A 1
Pyranometer SP Lite 2 Silicon cell pyranometer [Kipp & Zonen]
2 [1 for each horizontal global radiation and
global radiation in plane of array]
Anemometer #40C anemometer [NRG Instruments 2008a]
2
Wind direction sensor NRG #200P [NRG Systems 2008b] 1
Data Acquisition
Advantech ADAM 4015 7CH RTD Remote I/O module 2
Advantech ADAM 4019+ 8CH remote I/O module 2
Advantech ADAM 4080 2CH frequency counter/remote I/O module
1
4 Port PCI RS485 serial interface [NI] - 1
RS485 communication cable [NI] - 1
Page 16
16
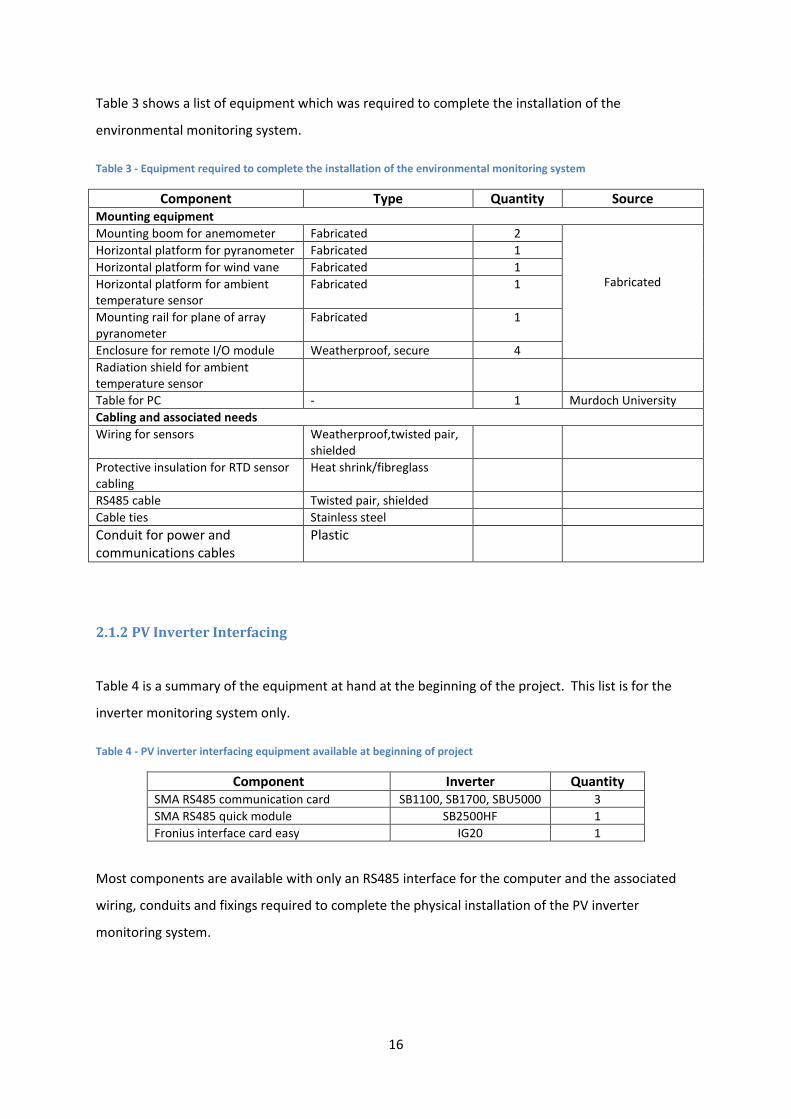
Table 3 shows a list of equipment which was required to complete the installation of the
environmental monitoring system.
Table 3 - Equipment required to complete the installation of the environmental monitoring system
Component Type Quantity Source Mounting equipment
Mounting boom for anemometer Fabricated 2
Fabricated
Horizontal platform for pyranometer Fabricated 1
Horizontal platform for wind vane Fabricated 1
Horizontal platform for ambient temperature sensor
Fabricated 1
Mounting rail for plane of array pyranometer
Fabricated 1
Enclosure for remote I/O module Weatherproof, secure 4
Radiation shield for ambient temperature sensor
Table for PC - 1 Murdoch University
Cabling and associated needs
Wiring for sensors Weatherproof,twisted pair, shielded
Protective insulation for RTD sensor cabling
Heat shrink/fibreglass
RS485 cable Twisted pair, shielded
Cable ties Stainless steel
Conduit for power and communications cables
Plastic
2.1.2 PV Inverter Interfacing
Table 4 is a summary of the equipment at hand at the beginning of the project. This list is for the
inverter monitoring system only.
Table 4 - PV inverter interfacing equipment available at beginning of project
Component Inverter Quantity SMA RS485 communication card SB1100, SB1700, SBU5000 3
SMA RS485 quick module SB2500HF 1
Fronius interface card easy IG20 1
Most components are available with only an RS485 interface for the computer and the associated
wiring, conduits and fixings required to complete the physical installation of the PV inverter
monitoring system.
Page 17
17
2.2 Environmental Monitoring Design
2.2.1 Mounting brackets
Mael Riou had completed a thorough design of the environmental monitoring system in his thesis
(Riou 2012), however the location of the wind sensors, the design of the mounting brackets for
these sensors and the pyranometers still needed to be done.
Several research facilities including the Fraunhofer Center for Sustainable Energy Systems
(Fraunhofer USA 2012) and the Sandia National Laboratories PV Facilities (Sandia National
Laboratories 2012) were examined for information on mounting the wind sensors. Two
international standards were also consulted when determining the correct location for the wind
sensors (IEC61724: Photovoltaic system performance monitoring - Guidelines for measurement, data
exchange and analysis 1998) (Standards, International 2005). These standards specify that the wind
sensors should be mounted 0.7m above the array and 1.2m to the East or West of the array. As two
anemometers are to be utilised in this installation, one shall be installed to both the East and West,
with the wind vane to be installed on the West side.
The pyranometers shall be installed centrally on the array, both horizontally and on the plane of the
array. This allows the measurement of solar radiation on a horizontal surface as well as solar
radiation on the plane of the array. The horizontal data is useful in creating a database which may
be referenced when designing PV systems in the future while the latter measurement, along with
cell temperature values, may be used to calculate the efficiency of the array.
After a discussion with John Boulton, it was decided that drawings and a description of the exact
location and configuration of the sensors would be provided to him upon which time he would
construct the mounts. Materials such as aluminium, galvanised steel and stainless steel will be
utilised for their corrosion resistance. The diagrams and descriptions provided to him can be found
in the appendix.
At the time of writing, no further progress has been made on the installation of the environmental
monitoring equipment. As there is no further design work to be done, completion of this part of the
project is easily achievable in the future.
Page 18
18
2.3 PV Inverter Monitoring
2.3.1 RS485 Interface Selection
Research was done on possible options for interfacing the RS485 serial connection from the
inverters with the computer that was to be used for monitoring and data acquisition. These options
are given in table 5.
Table 5 - Serial interface options
Option Product Description Website Cost
1
USB-COM485-PLUS4
4 RS485 connections, USB interface
http://www.ftdichip.com/Products/Modules/USBRSxxx.htm Buy: http://australia.rs-online.com/web/p/products/6877758/?cm_mmc=AU-PPC-0411-_-google-_-3_EEM_MPN_Jun2012-_-usb-com485-plus4_Phrase
AUD $73 (free shipping)
2 RS485 HUB 7-WAY SPLITTER
RS485 7 way hub
http://www.daveonlinestore.com.au/rs485-hub-7-way-splitter-p-505.html
AUD $299 +shipping
3
StarTech.com 4-port RS-422/RS-485 Serial PCI Adapter Card
4 Port RS485 PCI card
http://www.overstock.com/Electronics/StarTech.com-4-port-RS-422-RS-485-Serial-PCI-Adapter-Card/4598130/product.html?cid=207675
AUD $251.90 +shipping
4
Shentek 4 port High Speed Serial RS 422/485 RS422/485 RS485 RS 485 PCI Card WIN8
4 Port RS485 PCI card
http://www.ebay.com.au/itm/271144445606?hlp=false#ht_4061wt_1397
~AUD$91 (free shipping)
After speaking with Mr Will Sterling about these options, it was decided that a USB interface would
be the most appropriate for several reasons. Firstly, USB ports are common and will be a technology
that will remain present in computers in the future, unlike PCI ports which are being phased out.
Additionally, a USB interface makes changing computers easy should the need arise.
Option 1 was selected as it is a USB device, has 4 ports which allows for simultaneous use of the
monitoring system and a power analyser as well allowing for future expansion. It was also well
priced.
2.3.2 Computer Setup and Security
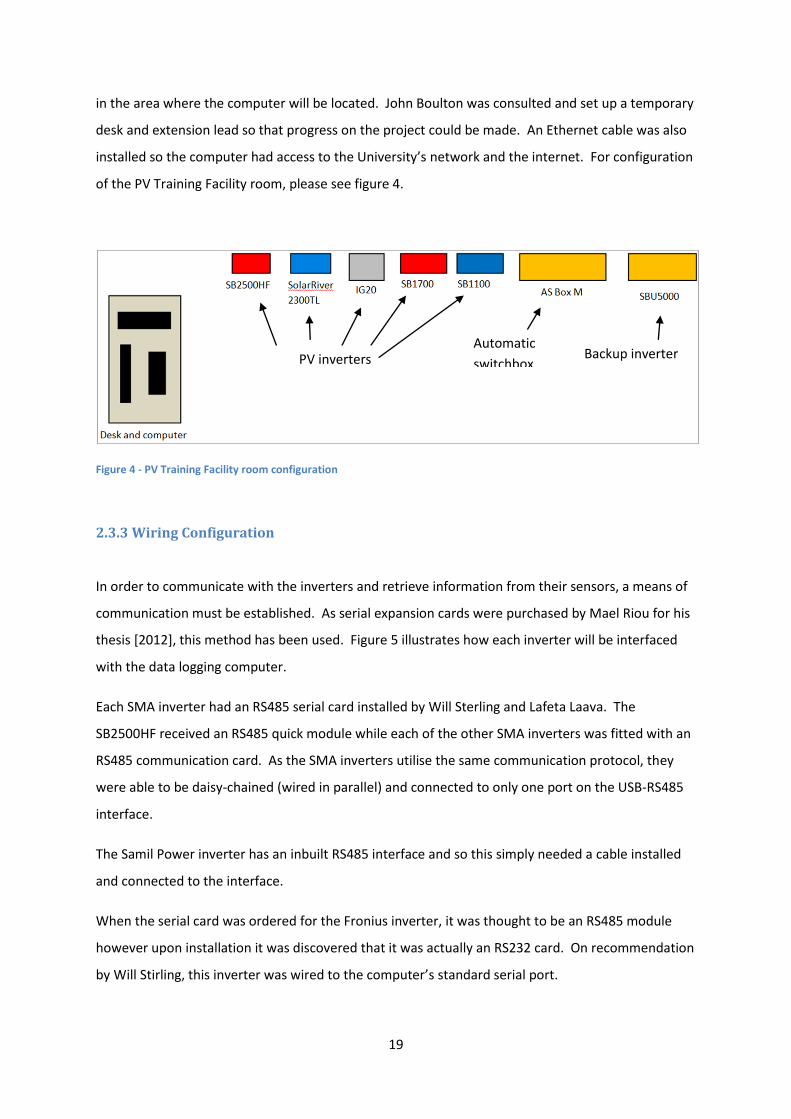
A desk is required on the top floor of the Engineering and Energy building to mount the computer
which will be used for monitoring the PV inverters and environmental sensors. This computer was
set aside by Mael Riou for his thesis (Riou 2012) and is already fitted with a PCI RS485 interface for
the environmental sensor monitoring.
As this room is publicly accessible, some form of security is required to prevent tampering with the
equipment and to ensure the area is safe. A power socket and Ethernet connection is also required
Page 19
19
in the area where the computer will be located. John Boulton was consulted and set up a temporary
desk and extension lead so that progress on the project could be made. An Ethernet cable was also
installed so the computer had access to the University’s network and the internet. For configuration
of the PV Training Facility room, please see figure 4.
Figure 4 - PV Training Facility room configuration
2.3.3 Wiring Configuration
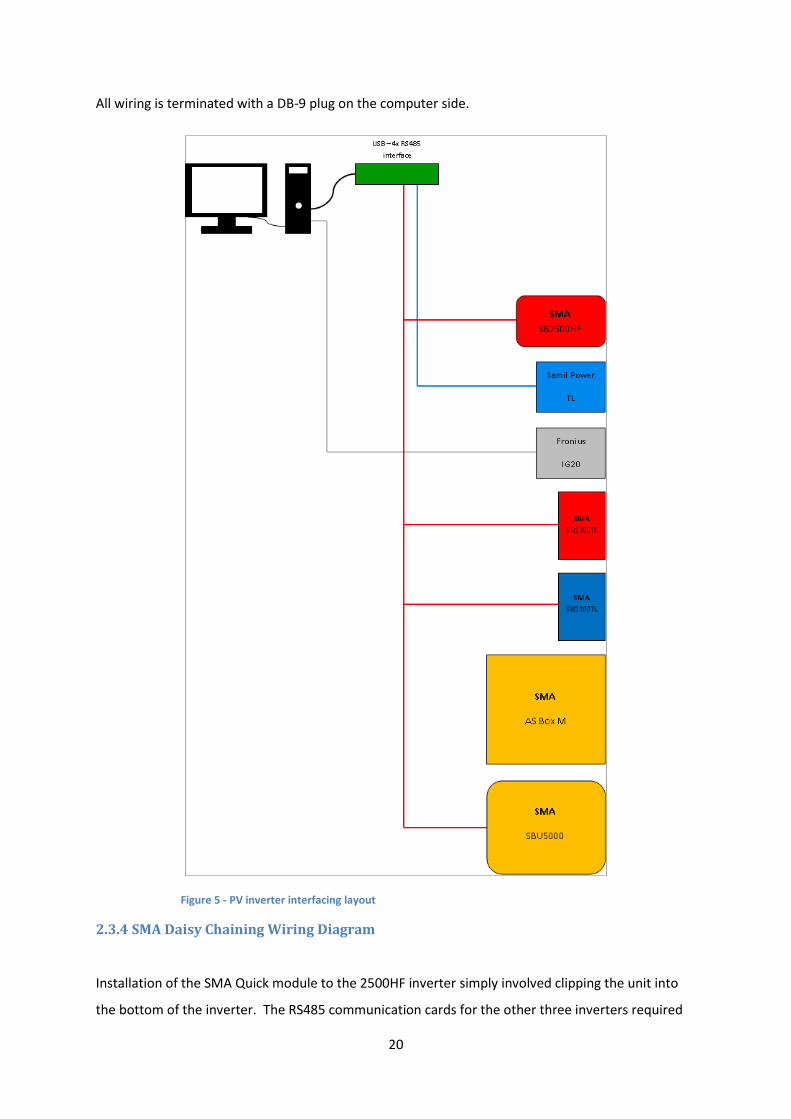
In order to communicate with the inverters and retrieve information from their sensors, a means of
communication must be established. As serial expansion cards were purchased by Mael Riou for his
thesis [2012], this method has been used. Figure 5 illustrates how each inverter will be interfaced
with the data logging computer.
Each SMA inverter had an RS485 serial card installed by Will Sterling and Lafeta Laava. The
SB2500HF received an RS485 quick module while each of the other SMA inverters was fitted with an
RS485 communication card. As the SMA inverters utilise the same communication protocol, they
were able to be daisy-chained (wired in parallel) and connected to only one port on the USB-RS485
interface.
The Samil Power inverter has an inbuilt RS485 interface and so this simply needed a cable installed
and connected to the interface.
When the serial card was ordered for the Fronius inverter, it was thought to be an RS485 module
however upon installation it was discovered that it was actually an RS232 card. On recommendation
by Will Stirling, this inverter was wired to the computer’s standard serial port.
PV inverters Backup inverter Automatic
switchbox
Page 20
20
All wiring is terminated with a DB-9 plug on the computer side.
Figure 5 - PV inverter interfacing layout
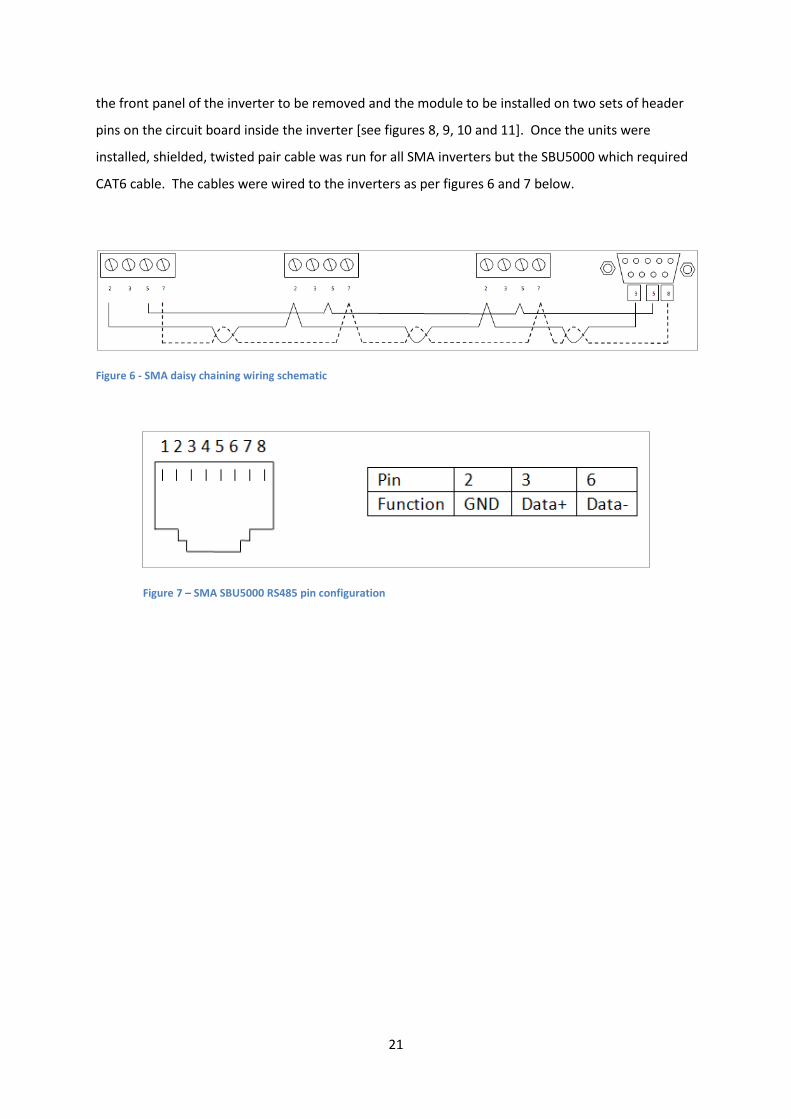
2.3.4 SMA Daisy Chaining Wiring Diagram
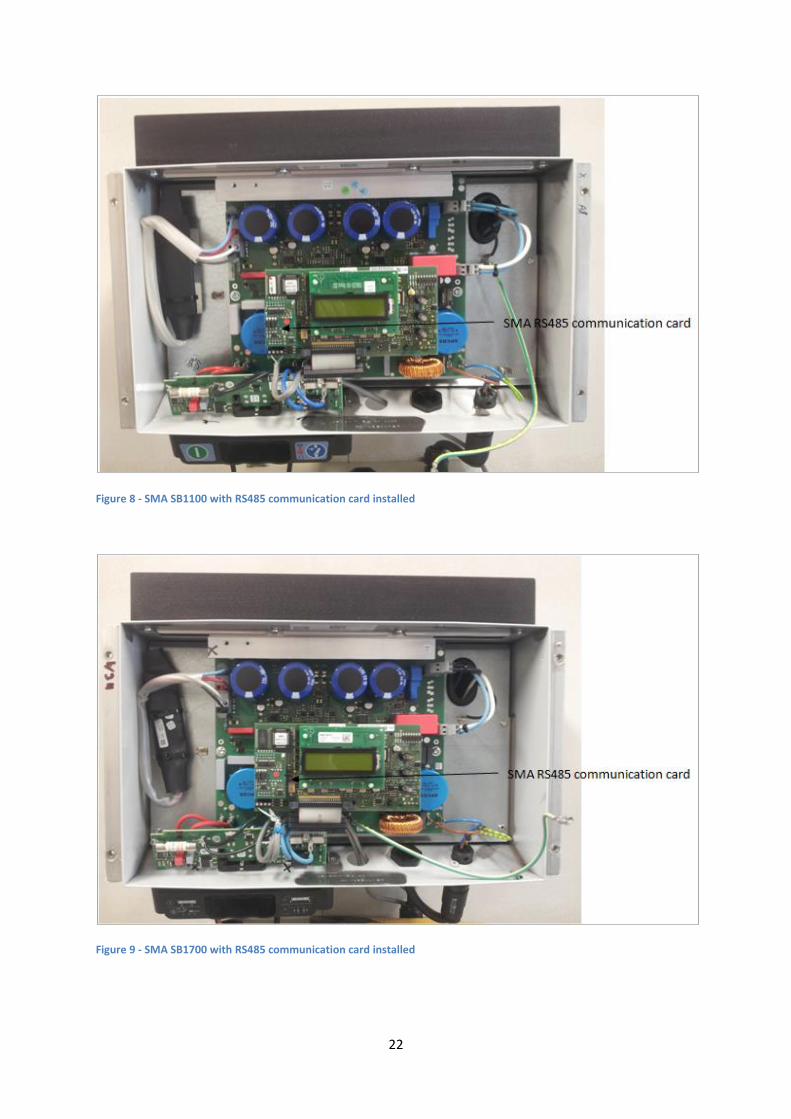
Installation of the SMA Quick module to the 2500HF inverter simply involved clipping the unit into
the bottom of the inverter. The RS485 communication cards for the other three inverters required
Page 21
21
the front panel of the inverter to be removed and the module to be installed on two sets of header
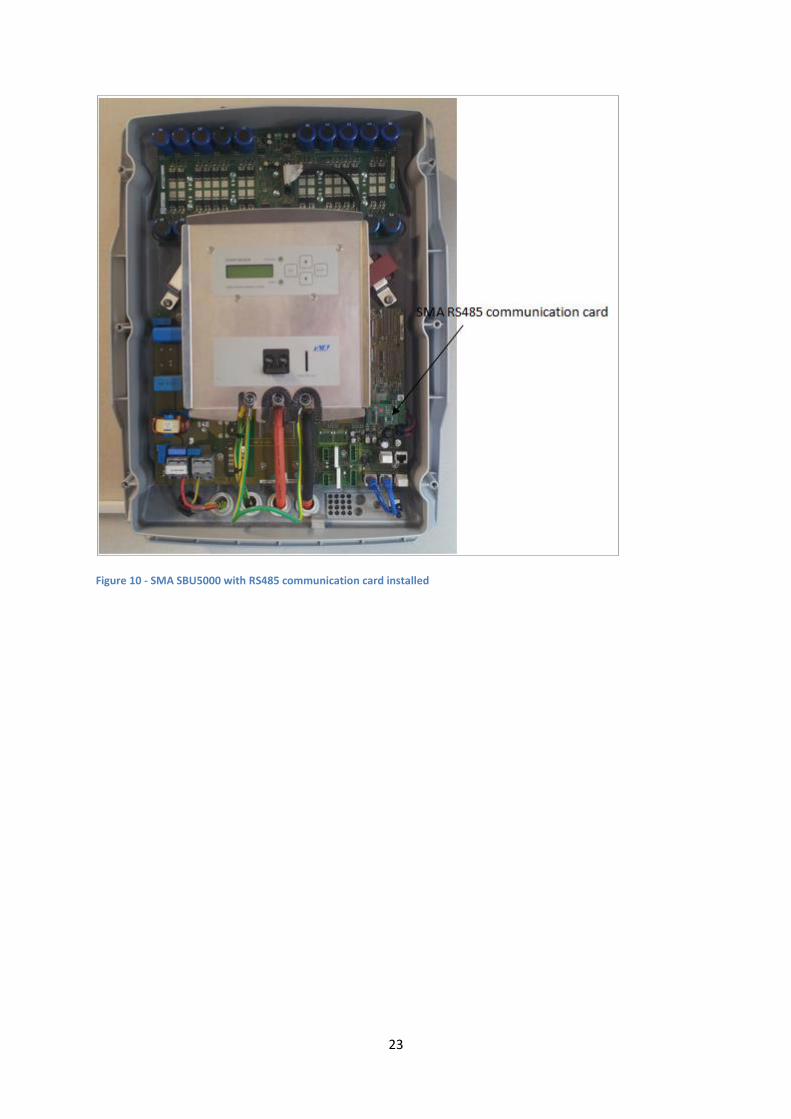
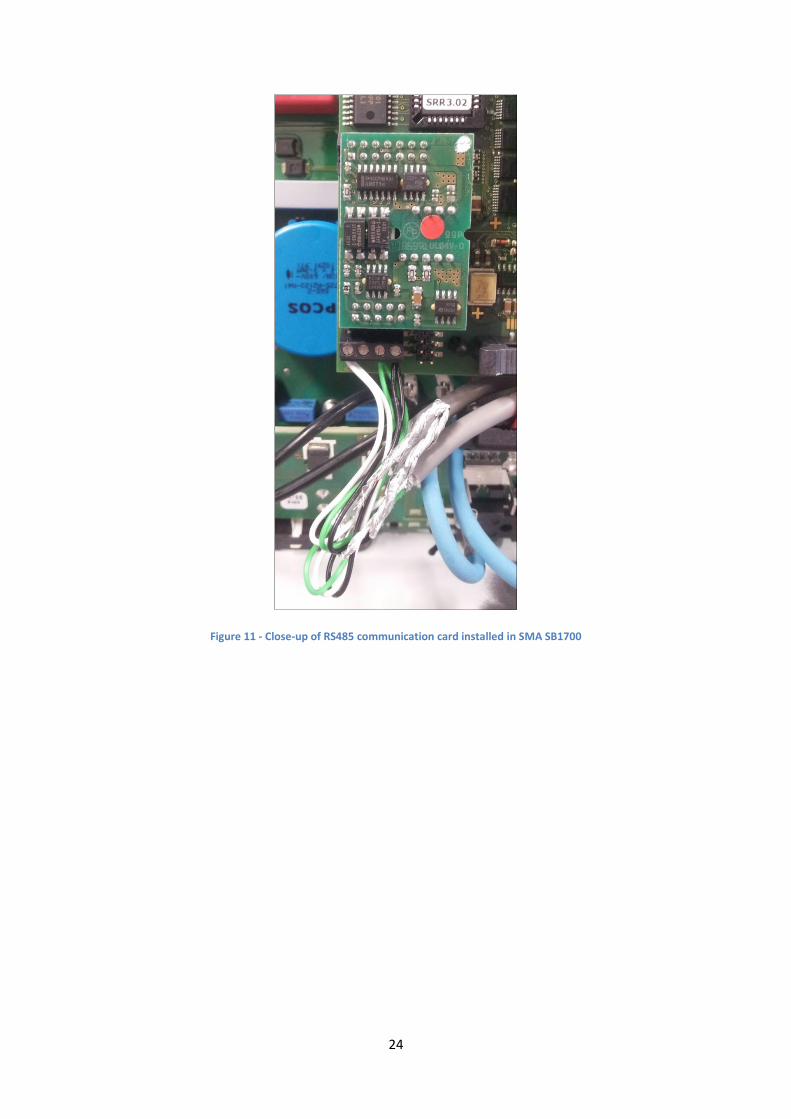
pins on the circuit board inside the inverter [see figures 8, 9, 10 and 11]. Once the units were
installed, shielded, twisted pair cable was run for all SMA inverters but the SBU5000 which required
CAT6 cable. The cables were wired to the inverters as per figures 6 and 7 below.
Figure 6 - SMA daisy chaining wiring schematic
Figure 7 – SMA SBU5000 RS485 pin configuration
Page 22
22
Figure 8 - SMA SB1100 with RS485 communication card installed
Figure 9 - SMA SB1700 with RS485 communication card installed
Page 23
23
Figure 10 - SMA SBU5000 with RS485 communication card installed
Page 24
24
Figure 11 - Close-up of RS485 communication card installed in SMA SB1700
Page 25
25
2.3.5 Samil Power SolarRiver Wiring
The SolarRiver inverter has inbuilt both RS232 and RS485 serial interfaces. When wiring the RS485
interface, an RJ11 plug is used. This plug is of the type typically used to connect a telephone to a
wall socket in Australia.
A grommet must be removed from the bottom of the inverter and the cable passed through it
before a plug is crimped onto the wires. The plug can then be plugged in to the inverter and the
grommet replaced.
The pin configuration of the RS485 socket is shown in table 6.
Table 6 - Samil Power RJ11 pin configuration
Pin 1 2 3 4
Function Tx+ Tx- Rx+ Rx-
2.3.6 Fronius IG20 Interface and Wiring
The Fronius IG20 inverter requires a small front fascia to be removed when installing the ‘Interface
Card Easy’ serial communication card. The card then slots into a port on the circuit board, providing
a DB-9 socket on the bottom of the inverter. The cable required is simply a DB-9 to DB-9 cable and is
plugged into the standard serial port on the back of the computer.
2.3.7 Monitoring Software
There are many options when it comes to software which can be used to read and write data from
and to a serial port. The requirements for this project are reliability, ease of use, flexibility,
familiarity and the ability to modify or update the program as required. These stem from the
eventual use of the PV Training Facility as a teaching and learning resource. Listed in table 7 are
some of the options considered.
Page 26
26
Table 7 - Monitoring software options
Interface Pros Cons
Labview Accepted industry tool
Flexible
Can be difficult to use, especially for a beginner
Microsoft Excel Powerful data analysis tool
Flexible
Easy to use
Possible manual operation
Matlab Powerful
Flexible
Possible manual operation
May add unnecessary complication
123Solar (www.123solar.org)
Already up and running
Nice user interface
Lack of flexibility
Requires a domain name
Custom web interface Flexible Could be time consuming
Hyper terminal (paid) or Realterm (free and
sounds better)
Communicates well with RS485 devices
Can be controlled using Excel and all the data can then be manipulated in Excel
Some coding requirements
Windmill 7 RS485 data logging in real time
Can log in real time to Excel
Some coding requirements
After consultation with Martina Calais on the matter, it was decided that LabView would be used for
several reasons. Firstly, it would tie in well with the environmental monitoring system as LabView is
used for monitoring the sensors used in that setup. LabView is also used in many of the University’s
engineering units, therefore there is a relatively large knowledge base on campus. It is also a
powerful and flexible package and is used for many industrial processes (Instruments, National n.d.)
which rely on its robust nature.
2.4 Serial Communication
2.4.1 Background on Serial Communication
Serial communication is a common communication protocol and comes standard on most
computers in one form or another.
The concept behind serial communication is very simple, with the port sending and receiving bytes
of data one bit at a time. While slower than parallel communication, which can send whole bytes at
once, it is simpler and may be used over greater distances of up to 1200 meters as opposed to the
Page 27
27
maximum of 20 metres (with 2 metres at most between devices) that parallel communication is
restricted to (Instruments, National 2013).
Three conductors, namely ground, transmit and receive, are used to send predominantly ASCII
(American Standard Code for Information Interchange) data. Due to the asynchronous nature of
serial communication, a port may transmit data on one line while it receives data on another
(Instruments, National 2013).
Below are the most important characteristics of serial communication.
Baud rate: a speed measurement which indicated the number of bit transfers per second. For
example, 1200 baud is 1200 bits per second. The higher the baud rate, the lower the possible
distance between devices (Instruments, National 2013).
Data bits: a measurement of the actual number of data bits in a transmission. The most
common values are 5, 7 and 8 bits. Here, the term ‘packet’ is used to refer to a single byte
transfer (Instruments, National 2013).
Stop bits: these are used to indicate the end of communication for a single packet. Standard
values are 1, 1.5 and 2 bits (Instruments, National 2013). The purpose of stop bits is twofold;
signalling both the end of transmission and also allowing for some error in the clock speed
between the communicating devices. The more stops bits used in communication, the greater
the acceptable tolerance between clock speeds but the slower the data transfer rate
(Instruments, National 2013).
Parity: a basic method of error checking commonly utilised in serial communication. There are
four types of parity, namely, even, odd, marked and spaced with the possibility of not using
parity also available (Instruments, National 2013).
2.4.2 RS232
RS232 serial communication is used in the Fronius IG20 inverter and enabled by the installation of
the Interface Card Easy. RS232 is found in most IBM compatible PC’s (Instruments, National 2013).
It can be used for communication between things like computer mice and keyboards or industrial
instrumentation. This method of serial communication is limited to point to point communication
from computer to device, with up to 15 metres between the two (Instruments, National 2013).
Page 28
28
2.4.3 RS485
RS485 is used in the communication between the SMA and Samil Power inverters and the computer.
This serial communication method is an improvement over RS232 for several reasons. Firstly,
multiple devices may be ‘daisy-chained’ (as is done with the SMA inverters) and connected to a
single serial port. It also has greater noise immunity and may be used for serial communication up
to 1220 metres (Instruments, National 2013).
2.4.4 RS485 Interface Overview
The interface ordered is from FTDI chip and comes as a bare circuit board. It requires a USB A to
mini USB B cable for power and data connection to the computer. It features 4 serial ports, each
with its own TxD (red) and RxD (green) activity LED’s. It also features a yellow power LED.
2.4.5 Enclosure Design
To protect the interface from the environment and tampering, an enclosure needed to be designed.
Google SketchUp was utilised and a design was created (see figure 13). The enclosure design is
made compact so as to allow for space efficient mounting if required. It also includes mounting tabs
so it may be fixed to a surface if required. The screws which hold the top and bottom pieces of the
enclosure together are located underneath the enclosure when it is mounted, increasing security to
the interface inside. The design was optimised for 3D printing and was printed on a Solidoodle 2 3D
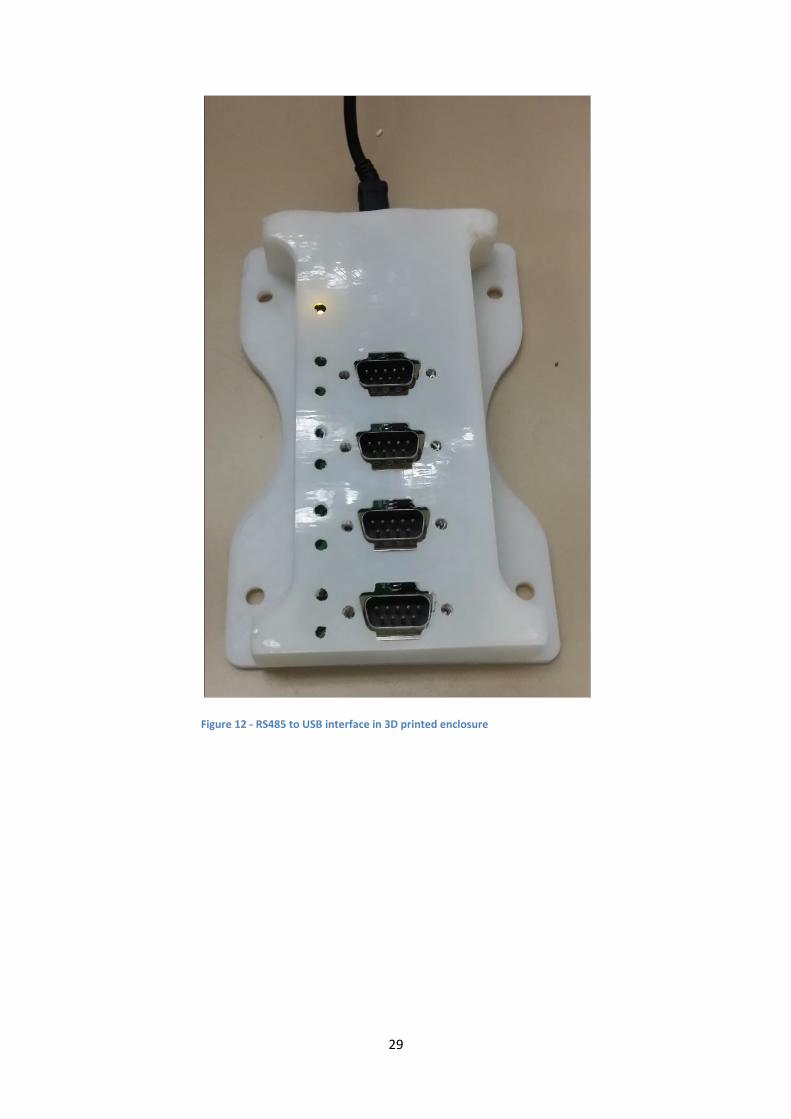
printer using ABS plastic. The interface installed in its enclosure is shown in figure 12.
Page 29
29
Figure 12 - RS485 to USB interface in 3D printed enclosure
Page 30
30
Figure 13 - Google SketchUp model of RS485 to USB enclosure
2.5 Monitoring System Conclusions
The physical design of the environmental monitoring system has been completed. Once the
mounting brackets are fabricated and installed with the sensors, it is just a matter of running the
cabling and making the necessary connections to complete the environmental monitoring system.
Once up and running, the system will allow for accurate, high-resolution data collection with the
ability to expand, alter or upgrade the system in the future. Although the surrounding buildings and
trees limit the use of wind data as a meteorological tool, the data which will be recorded in the
context of monitoring for the effects on the PV systems will be highly valuable, especially
considering the utilisation of two anemometers.
All of the components for the PV inverter monitoring system are at hand. All that is required to
complete the setup is a LabView program written to query the inverters and record their reply while
displaying the data in a useful manner. Although the data which will be recorded this way will be of
value, it is not a particularly accurate way to measure the parameters of a PV system as it relies on
Page 31
31
the internal sensors of the PV inverters. To record highly accurate values, the integration of a power
analyser is necessary. This is discussed in section 5.4.
3.0 PV Training Facility Review
3.1 Functional Earthing
3.1.1 Functional Earthing Background and Effects
Some PV installations require either the positive or negative DC terminal to be connected to earth,
either directly or through a resistor. This is called functional earthing, differing from protective
earthing which involves non-energised conductive parts on equipment being connected to ground to
prevent a wiring fault, potentially causing injury or death. Functional earthing is usually necessary
on an array which uses thin-film or back-contacted PV modules. There are several reasons this may
be necessary.
Page 32
32
TCO (Transparent Conductive Oxide) corrosion: TCO is used in some types of PV module and is
the electrically conductive layer on top of the semiconductor material (SMA 2010). TCO
corrosion occurs when a module has a negative potential with respect to ground (SMA 2010).
Damage to the TCO layer is non-repairable and results in loss of power from the module (SMA
2010). The effects of TCO corrosion can become apparent after several months of use but may
not appear until years after installation. Visual damage is usually in the form of ‘bar-graph
corrosion’ (Fraunhofer Institute 2009). This type of damage appears on the front of the modules
and looks like bars of different lengths.
Polarisation effect: Solar cells which utilise ‘back-contact’ technology are susceptible to the
polarisation effect when a positive potential with respect to ground exists (SMA 2010). These
cells have an electric field which is concentrated on the back of the cells. A static negative
surface charge can build up on the anti-reflective coating of these cells. Polarisation is reversible,
meaning that permanent damage does not occur (SMA 2010).
3.1.2 Functional Earthing in the PV Training Facility
The PV Training Facility utilises three module types spread over four arrays which require functional
earthing. These include:
Amplesun ASF100 amorphous modules
o Require negative functional earth (Amplesun 2009). The Amplesun ASF100 amorphous
modules utilise TCO technology and require negative functional earthing to prevent TCO
corrosion.
Sunpower E19 monocystalline modules
o Require positive functional earthing as these modules utilise back contact technology.
Q.Cells Q.Smart thin film (CIGS) modules
o Require negative functional earthing (Q.Cells 2011). The Q.Cells CIGS modules utilise TCO
technology and therefore require function earthing of the negative terminal via a 35 ohm
resistor. This limits ground fault current to 30mA (Q.Cells 2011).
Although a final installation diagram was not available at the time of writing, some investigation was
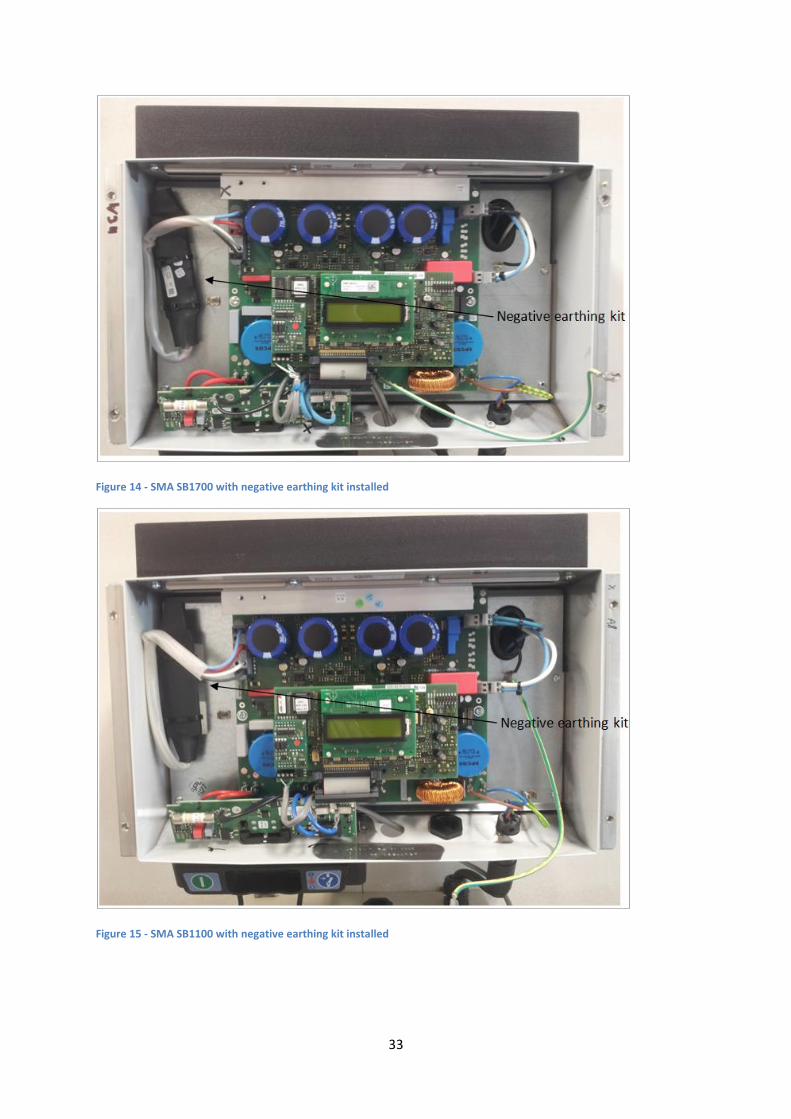
done into the earthing configuration of the inverters. Shown below in figures 14 and 15 are the
SB1100 and SB1700 inverters with a negative earthing kit installed. This is the correct configuration
for the Q.Cells modules which feed the inverters.
Page 33
33
Figure 14 - SMA SB1700 with negative earthing kit installed
Figure 15 - SMA SB1100 with negative earthing kit installed
Page 34
34
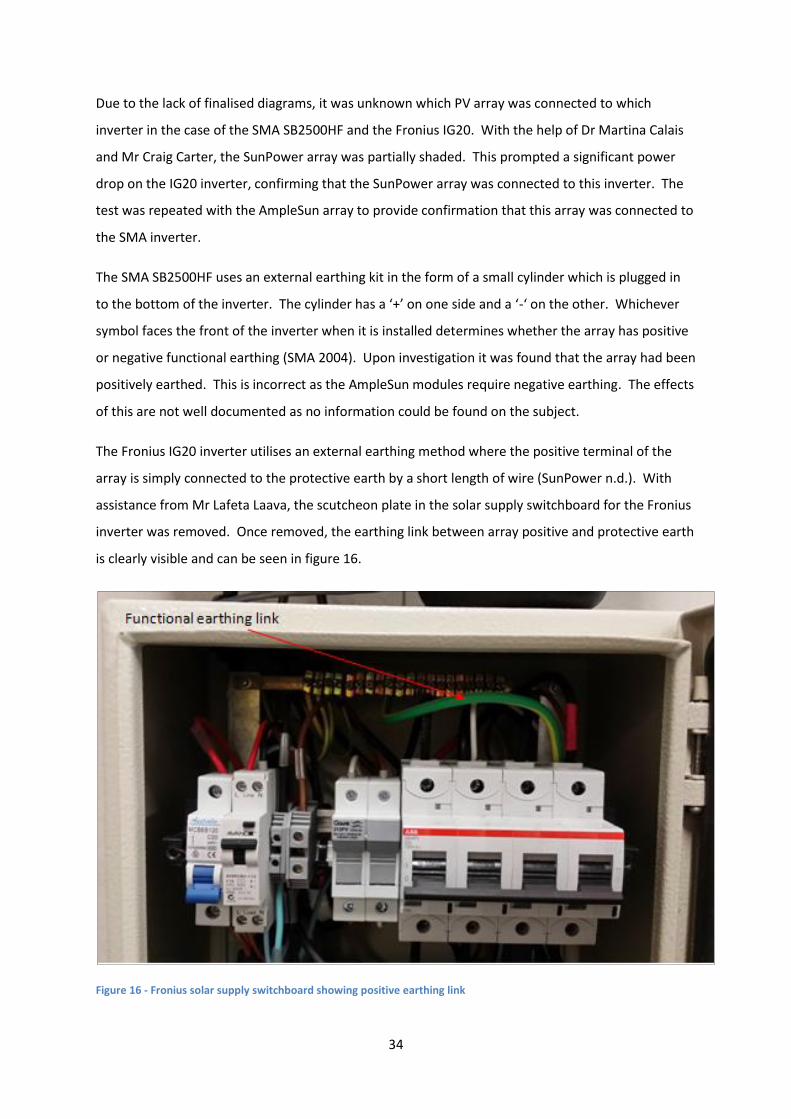
Due to the lack of finalised diagrams, it was unknown which PV array was connected to which
inverter in the case of the SMA SB2500HF and the Fronius IG20. With the help of Dr Martina Calais
and Mr Craig Carter, the SunPower array was partially shaded. This prompted a significant power
drop on the IG20 inverter, confirming that the SunPower array was connected to this inverter. The
test was repeated with the AmpleSun array to provide confirmation that this array was connected to
the SMA inverter.
The SMA SB2500HF uses an external earthing kit in the form of a small cylinder which is plugged in
to the bottom of the inverter. The cylinder has a ‘+’ on one side and a ‘-‘ on the other. Whichever
symbol faces the front of the inverter when it is installed determines whether the array has positive
or negative functional earthing (SMA 2004). Upon investigation it was found that the array had been
positively earthed. This is incorrect as the AmpleSun modules require negative earthing. The effects
of this are not well documented as no information could be found on the subject.
The Fronius IG20 inverter utilises an external earthing method where the positive terminal of the
array is simply connected to the protective earth by a short length of wire (SunPower n.d.). With
assistance from Mr Lafeta Laava, the scutcheon plate in the solar supply switchboard for the Fronius
inverter was removed. Once removed, the earthing link between array positive and protective earth
is clearly visible and can be seen in figure 16.
Figure 16 - Fronius solar supply switchboard showing positive earthing link
Page 35
35
While the SunPower modules do require positive functional earthing, it appears that the inverter’s
settings have not been changed, as required when functional earthing is installed (SunPower n.d.).
It is apparent that functional earthing was a stumbling point in this installation and may not be fully
understood by the system’s installers.
3.2 SMA SBU5000 testing
Figure 17 provides a simplified schematic of the SMA Backup system.
Figure 17 - Schematic diagram of SMA Sunny Backup system
Page 36
36
3.2.1 System Operation Overview
After commissioning of the PV systems, tests were carried out on the Sunny Backup unit to ensure
its correct operation as well as gain some insight to its workings. The tests were performed using a
heating element/fan load and were done on an overcast day.
Figure 17 shows the configuration of the backup system. When operating correctly, the system
should function as follows.
When connected to the grid, contactors A and B should be closed and contactor C should be open.
When the grid fails the contactors at A and B should open immediately and, after the system has
established that the grid is staying down (ie. not a brownout or momentary blackout), contactor C
will close after 60 seconds. This allows the PV inverters to see the local AC voltage produced by the
SBU5000 and reconnect their internal contactors, allowing the PV array and inverters to supply the
load, with any extra power used to charge the batteries.
In the event that the batteries are fully charged and there is excess power being generated in stand-
alone operation mode, the SBU5000 is designed to shift the output frequency slightly, causing the
PV inverters to ramp down their output (SMA 2007). Unfortunately, the correct setup of the PV
inverters is yet to be determined and they are currently utilising their standard over-frequency
protection to trip their internal relay when the SBU5000 raises the frequency of the stand-alone grid.
It is important to establish the inverters’ current programming and rectify it, as required, to use the
ramp-up/down functionality, as it will prevent premature wear of the inverters’ relay contacts and
allow for better charge management by the SBU5000.
Once the grid is restored, the system takes 60 seconds to react, delaying the reconnection of the
Sunny Backup to ensure the grid has returned permanently. After this time, contactor C is opened
and contactors A and B are closed. This action causes the PV inverters to drop out however they
should reconnect after 60 seconds (Standards Australia AS4777 2005) and begin to supply the load
and feed the grid with any additional power.
Page 37
37
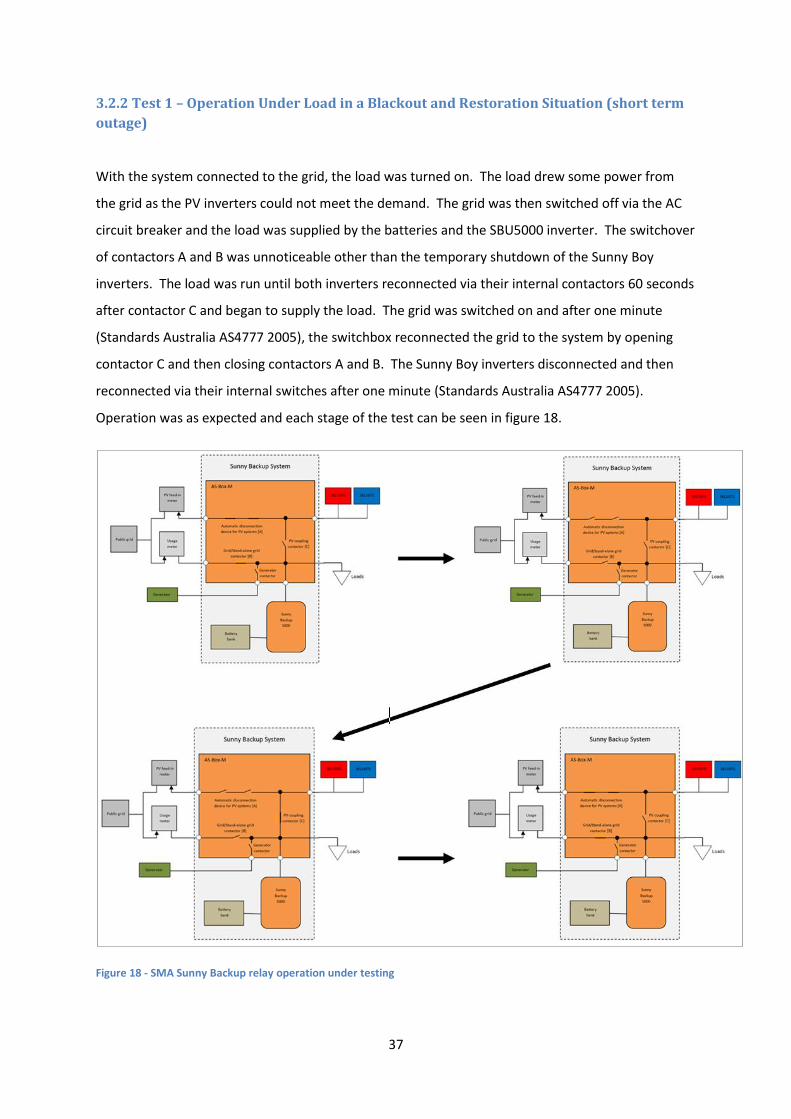
3.2.2 Test 1 – Operation Under Load in a Blackout and Restoration Situation (short term
outage)
With the system connected to the grid, the load was turned on. The load drew some power from
the grid as the PV inverters could not meet the demand. The grid was then switched off via the AC
circuit breaker and the load was supplied by the batteries and the SBU5000 inverter. The switchover
of contactors A and B was unnoticeable other than the temporary shutdown of the Sunny Boy
inverters. The load was run until both inverters reconnected via their internal contactors 60 seconds
after contactor C and began to supply the load. The grid was switched on and after one minute
(Standards Australia AS4777 2005), the switchbox reconnected the grid to the system by opening
contactor C and then closing contactors A and B. The Sunny Boy inverters disconnected and then
reconnected via their internal switches after one minute (Standards Australia AS4777 2005).
Operation was as expected and each stage of the test can be seen in figure 18.
Figure 18 - SMA Sunny Backup relay operation under testing
Page 38
38
3.2.3 Test 2 - Operation Under Load in a Blackout and Restoration Situation (medium
term outage)
With the system connected to the grid, the load was turned on. The load drew some power from
the grid as the PV inverters could not meet the demand. The grid was then switched off via the AC
circuit breaker and the load was supplied by the batteries and the SBU5000 inverter. The switchover
of contactors A and B was unnoticeable other than the temporary shutdown of the Sunny Boy
inverters. The load was run until the batteries are discharged to 98%. During this time, the SB1100’s
internal contactor remained disconnected due to a frequency disturbance (frequency over 51Hz)
while the SB1700 cycled between connected and disconnected via its internal contactor. The
SBU5000 showed the charge operation to be ‘float’ as the battery charge level remains above 70%
(Standards Australia AS4777 2005). This operation is described in the SBU5000 manual, section 13.5.
The grid was switched on and after one minute (Standards Australia AS4777 2005), the switchbox
reconnected the grid to the system by operating contactors A, B and C. The Sunny Boy inverters
disconnected and then reconnected via their internal switches after one minute (Standards Australia
AS4777 2005). As the settings of the PV inverters have not been confirmed, it is not known why the
inverters behave differently. Once the settings have been retrieved from the inverters, the reason
for this operation can be determined and corrected, if required.
3.2.4 Test 3 - Operation Under Load in a Blackout and Restoration Situation (long term
outage)
With the system connected to the grid, the load was turned on. The load drew some power from
the grid as the PV inverters could not meet the demand. The grid was then switched off via the AC
circuit breaker and the load was supplied by the batteries and the SBU5000 inverter. The switchover
of contactors A and B was unnoticeable other than the temporary shutdown of the Sunny Boy
inverters. The PV inverters were switched off via the DC circuit breaker in order to discharge the
batteries at a faster rate. The load was run for approximately 1 hour until the batteries were
discharged to 96%. The load was then switched off and the PV inverters were reconnected via the
DC breaker. After one minute (Standards Australia AS4777 2005), the PV inverters’ internal
contactors reconnected and the inverters began to feed power into the system, charging the
batteries. As the batteries were close to being full, neither inverter remained on for long before the
SB1100 disconnected via its internal contactor and the SB1700 started to cycle as in test 2. The grid
was switched on via the AC circuit breaker and after one minute (Standards Australia AS4777 2005),
Page 39
39
the switchbox reconnected the grid to the system by opening contactor C and closing contactors A
and B. The Sunny Boy inverters disconnected and then reconnected their internal relays after one
minute (Standards Australia AS4777 2005).
3.2.5 Test Results
While the complete disconnection of the Sunny Boy inverters does the job of reducing the feed in
power during stand-alone grid operation, it is not ideal. The inverters can be set up to use a
“Frequency Shift Power Control” system, as described in the SBU5000 manual, section 17.1 (SMA
2007). This allows the output power of the Sunny Boy inverters to be ramped down rather than
utilising discreet on/off control. To activate this function, an installer code is needed and can be
obtained from SMA.
Another concern with the system is the lack of battery temperature monitoring. The SBU5000
comes with provision for a temperature sensor, however it is not installed. Section 6.4.1 of the
SBU5000 manual states, “A battery temperature sensor is provided with each Sunny Backup 5000.”
(SMA 2007) Section 6.4.1 also states, “The battery temperature sensor measures the temperature
of the connected battery. This is necessary since the optimum charging voltage for a battery strongly
depends on the temperature.” (SMA 2007)
The charge current delivered to the batteries can be adjusted as described in section 14.4 of the
SBU5000 manual (SMA 2007).
3.2.6 SBU5000 Charge Regime
The SBU5000 has a sophisticated charging regime. In this system, the charge current is limited by
the lowest value of the maximum defined battery current, the nominal grid current or the maximum
AC charging current of the SBU5000. The first phase (constant current phase) uses this limit and
raises the voltage of the batteries as they are charged.
Once the batteries reach a predefined voltage the charging enters phase 2, the constant voltage
phase or absorption phase. This sees the battery voltage maintained at a constant level, causing the
battery current to continually decrease. The system will remain in this phase for a defined period of
time. The system chooses one of three charging processes during this phase, as described below.
Page 40
40
Boost charge: enables the battery to be charged to approximately 85% to 90% using a high
charge voltage for a short period of time.
Full charge: After a discharge of more than 30%, the system will initiate a full charge if it has been
longer than 14 days since the last grid failure. This process aims to charge the batteries to a level
of at least 95%.
Equalisation charge: After a discharge of more than 30%, the system will initiate an equalisation
charge if it has been over 180 days since the last grid failure. This process aims to charge the
batteries to a level of at least 95% to 100%. During this process, the system performs controlled
over-charging of the battery bank to ensure any weaker cells are fully charged. It also acts as
battery maintenance and extends the life of the battery bank.
During phase 2 of the charging process, the remaining charge time and the current process are
displayed on the inverter’s LCD.
Phase 3 is float charge which again uses constant voltage charging but at a reduced charging voltage.
The purpose of this phase is to keep the batteries fully charged without overcharging which would
cause premature aging of the cells. The system will remain in this phase until either more than 30%
of the battery banks’ capacity has been used or the charge state is below 70%.
The charging process is dependent on battery temperature. For temperatures below 20°C, the
charging voltage is increased slightly and for temperatures over 20°C it is reduced slightly. This is to
prevent overcharging and increase charging reliability. The charging voltage is reduced by
4mV/°C/cell for the current battery bank type (SMA 2007).
3.3 Review of PV Training Facility Schematics
One of the major challenges faced over the course of this project was the incomplete status of the
equipment. Julie Yewers, the project manager for the original installation, was kind enough to
provide updates of the progress along the way.
One of the issues that required resolving was the lack of accurate and detailed schematics for the
facility. At several stages, drawings were provided however they proved very inadequate and
somewhat inaccurate. As such, I was asked by Martina Calais to review the diagrams to aid in the
resolution of this part of the system.
Some of the issues discovered in the schematic diagrams include:
Page 41
41
Lack of string wiring detail for PV arrays
Battery bank configuration missing
No ratings given for surge protectors, cables, circuit breakers and several other pieces of
equipment
String fuses missing from diagram (AmpleSun array)
Test loops and terminals missing from diagram
Incorrect configuration shown for SMA Backup system
No functional earthing shown
Unfortunately, many other omissions and errors were discovered in each set of drawings received.
Overall, this represents an incomplete service especially when coupled with the other issues related
to the installation of the facility.
3.4 PV Training Facility Conclusions
Despite the many setbacks and difficulties associated with getting the PV Training Facility
commissioning finalised, valuable progress has been made. A lot has been learned when it comes to
functional earthing; knowledge which will hopefully be passed on to the system installers for their
future use. While final drawings and confirmation of correct installation have not yet been
established, it was interesting to have been part of the operation and see how businesses operate.
Also providing an insight was the review of schematics for the PV Training Facility. More a lesson of
what to avoid doing, the review of these diagrams was useful in determining possible issues with the
system and errors in its installation.
As part of the verification of correct installation, testing was performed on the SMA Backup system,
incorporating SMA SB1100 and SB1700 PV inverters, an SMA AS-BOX-M and an SMA SBU5000
backup inverter to ensure correct operation. While the settings of the two PV inverters related to
their ramp-down functions are yet to be determined and adjusted where necessary, extensive
documentation on the operation of the system as a whole has been created and will no doubt be
valuable in the future when using the facility for teaching and research.
Page 42
42
4.0 Conclusion
The PV Training Facility on the Engineering and Energy Building at Murdoch University is on its way
to becoming a very valuable resource for teaching, learning and research into the effects of
environmental factors on different PV cell technologies and inverter topologies.
This project aimed to provide a monitoring setup for the facility, following on from work by Stuart
Kempin (Kempin 2012) and Mael Riou (Riou 2012). The design for the environmental monitoring
system was completed by the realisation of the necessary mounting brackets and equipment
required for the environmental sensors through the use of the CAD software Google SketchUp.
Whilst delays in the fabrication of the brackets limited progress, minimal input is needed to finalise
this aspect of the project.
The PV inverter monitoring system was also delayed by several factors, however the physical
construct of the system is all but complete. The installation of the serial communication cards in the
inverters and subsequent wiring was made simple with help from Mr Will Sterling and Mr Lafeta
Laava. The USB-RS485 serial interface card which was purchased for communication of the inverters
with the computer is housed in a 3D printed case, designed to protect it from physical damage and
tampering. It was chosen for its flexibility, low cost and provision of spare serial ports for
communication with a power analyser in the future. With the creation of LabView scripts which
read, interpret, display and log the data from the inverters, the PV inverter monitoring system will
be complete.
The requirement of several of the PV modules installed at the PV Training Facility to have functional
earthing is something which caused some confusion.
Page 43
43
5.0 Future Work
Due to time constraints and several other factors, work was not completed on the PV Training
Facility. This does mean, however, that there is scope for further work by other students.
5.1 Work to be done on the environmental monitoring system
Completion of the environmental monitoring system requires the fabrication and installation of the
mounting brackets by John Boulton. Once the brackets are installed, the sensors can then be
mounted. It also requires wiring to be installed, including conduits and cable trays, where necessary.
Once the wiring is in place, it is simply a matter of installing the ADAM modules along with the other
serial communication equipment and ensuring the LabView scripts written by Mael Riou (Riou 2012)
are functioning as intended.
5.2 Work to be done on the PV inverter monitoring system
To complete the inverter monitoring system, a LabView script must be written which can
communicate with the PV inverters. As suggested by Graeme Cole [Associate Professor], several
procedures should be used to separate the process. For example, one script could query the
inverters, another could decipher the data received, another could plot to a GUI and yet another
could record the useable data to a server. The installation of cable trays to run the serial cable safely
and neatly also needs to be arranged.
5.3 Work to be done in the PV Training Facility
To create an environment more conducive to teaching and learning, a more permanent arrangement
must be organised for the monitoring computer. Ideally, a cabinet should be installed which would
house the computer and serial interface. This would aid in the prevention of vandalism or tampering
while also ensuring the equipment is safe to use.
It is also necessary to finalise the installation. This includes obtaining accurate copies of the
installation schematic and rectifying the issues discovered with the functional earthing.
Page 44
44
As part of the verification of installation, the settings of both the SB1100 and SB1700 should be
retrieved via the use of the serial communication setup. This is necessary to ensure that the
inverters are correctly configured for use in the Sunny Backup system. Specifically, the ramp-
up/ramp-down functionality of the inverters must be checked and adjusted, as required, as it is
currently believed that the inverters are simply utilising their over-frequency protection to
disconnect when the SBU5000 raises the frequency in the attempt to ramp-down power generation.
Another area where more testing would prove helpful is the Sunny Backup system. Deeper
discharge of the battery bank using a larger load would allow for more tests to be conducted on the
systems’ response under different conditions. It would also provide an accurate measurement of
the real-world capacity of the battery bank.
5.4 Power Analyser
The integration of a power analyser into the PV Training Facility would be beneficial, as it would
allow the capture and recording of high-resolution data from the inverters. This is valuable when
analysing the effects of sudden cloud cover and other weather and location related interference.
In order to provide this functionality to the PV Training Facility, a means of connecting to the
inverters to read voltage and current is required. This could be achieved in several different ways,
however it is important to bear in mind that the facility will be used for teaching and learning and
therefore users must not be exposed to voltages exceeding 50VAC or 120VDC, defined as extra-low
voltage by Australian Standards and suitable for work on and modification to by a “competent
person” (Standards Australia AS4509.1 2009). The use of current and voltage transformers is
recommended as these devices are commercially available and are very accurate.
Page 45
45
Bibliography Amplesun. “Installation Manual - Photovoltaic Module ASF100.” 15 8 2009. http://www.ample-
sun.com/data/article/Amplesun%20Installation%20Manual%20final.pdf (accessed 10 25, 2013).
Fraunhofer Institute. Interactions between Solar Modules and Inverters. Freiburg: Fraunhofer
Institute, 2009.
Fraunhofer USA. Fraunhofer Center for Sustainable Energy Systems Announces Opening of
Albuquerque Outdoor Solar Test Field. 2 7 2012. http://cse.fraunhofer.org/press-releases/cse-
announces-opening-of-outdoor-solar-test-field/ (accessed 5 8, 2013).
“IEC61724: Photovoltaic system performance monitoring - Guidelines for measurement, data
exchange and analysis.” International Standard. 1998.
Instruments, National. Serial Communication General Concepts. National Instruments. 25 01 2013.
http://digital.ni.com/public.nsf/allkb/2AD81B9060162E708625678C006DFC62 (accessed 10 19,
2013).
—. Solutions. National Instruments. http://www.ni.com/solutions/ (accessed 10 20, 2013).
Kempin, Stuart. A Photovoltaic Training Facility on the Murdoch University Engineering and Energy
Building's North East Roof. Perth, Western Australia: Murdoch University, 2012.
Lewis, Simon. “Carnarvon - A Case Study of Increasing Levels of PV Penetration in an Isolated
Electricity Supply System.” 2012.
Mastervolt. “Info Bulletin Solar - Functional grounding.”
http://www.coenergia.com/Apps/WebObjects/Coenergia.woa/wa/viewFile?id=2125&lang=ell
(accessed 10 24, 2013).
Q.Cells. Q.Smart and SL series Installation and Operation Manual. 2011.
Riou, Mael. Monitoring and Data Acquisition System for the Photovoltaic Training Facility on the
Engineering and Energy Building. Perth, Western Australia: Murdoch University, 2012.
Sandia National Laboratories. PV Facilities. 29 11 2012. http://energy.sandia.gov/?page_id=272
(accessed 8 5, 2013).
SMA. SMA Plug-in Grounding. 2004.
SMA. Sunny Backup 5000 Installtion and Instruction Manual. Niestetal, 2007.
—. Which Inverter is the Right One? 08 2010. http://www.sma.de/en/solutions/medium-power-
solutions/knowledgebase/which-inverter-is-the-right-one.html (accessed 12 14, 2013).
Standards Australia AS4509.1. AS4509.1 Stand-alone power systems - Part 1: Safety and installation.
21 12 2009.
Standards Australia AS4777. AS4777-2005 Grid connection of energy system via inverters. SAI Global,
2005.
Page 46
46
Standards, International. “IEC61215: Crystalline silicon terrestrial photovoltaic (PV) modules - Design
qualification and type approval.” International Standards, 2005.
SunPower. Positive Earthing: A Quick Guide.
University, Murdoch. Renewable Energy Engineering. 2013.
http://www.murdoch.edu.au/Courses/Renewable-Energy-Engineering/ (accessed 10 12, 2013).
Page 47
47
Appendix
Documents provided to John Boulton specifying pyranometer mounting
equipment
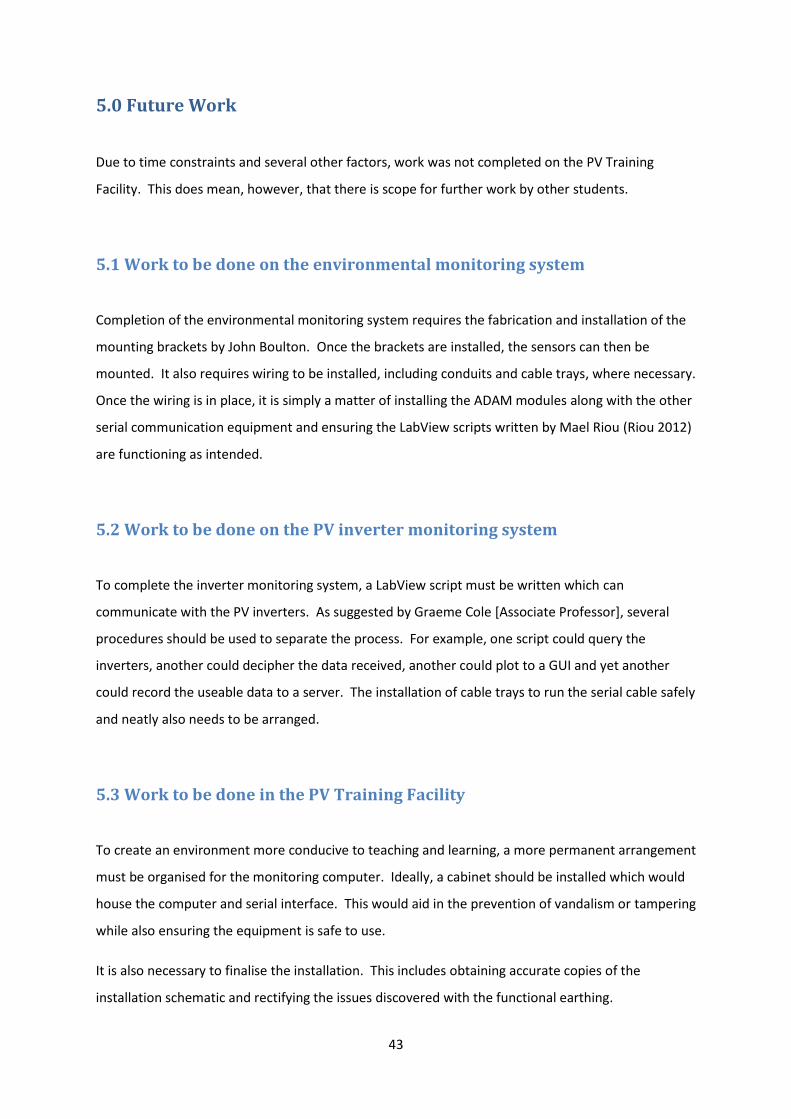
Pyranometer Brackets Requirements:
Brackets should be made as low-profile as possible.
Bracket material and cross section is not important as long as it is sturdy and
weather resistant.
Pyranometers should be mounted horizontally level and on the same plane as the
PV array (respectively).
Any conductive parts should be grounded to main array frame.
Figure 19 - Pyranometer mounting bracket [view 1]
Figure 20 - Pyranometer mounting bracket [view 2]
Page 48
48
Figure 21 - Pyranometer mounting bracket [view 3]
Page 49
49
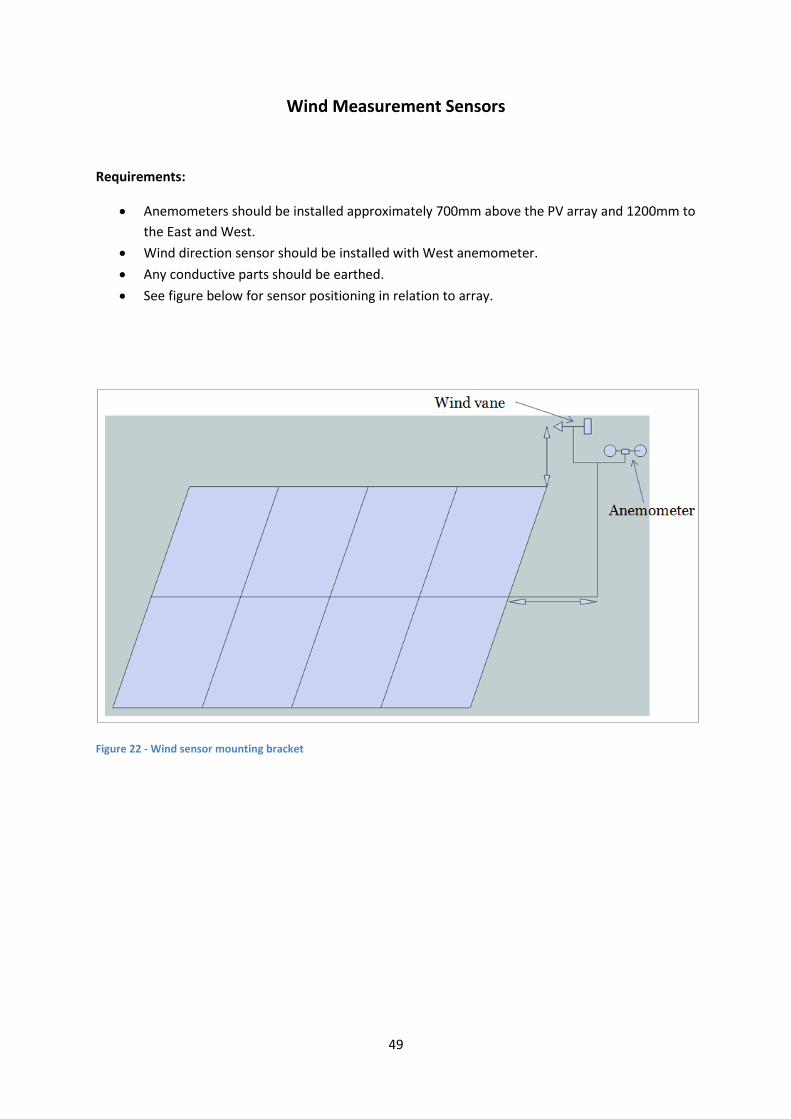
Wind Measurement Sensors
Requirements:
Anemometers should be installed approximately 700mm above the PV array and 1200mm to
the East and West.
Wind direction sensor should be installed with West anemometer.
Any conductive parts should be earthed.
See figure below for sensor positioning in relation to array.
Figure 22 - Wind sensor mounting bracket