Version 1.1 Page 1 MUSES PROJECT CASE STUDY 3A: DEVELOPMENT OF TOURISM AND FISHING IN THE SOUTHERN ATLANTIC SEA (SOUTH COAST OF MAINLAND PORTUGAL - ALGARVE REGION - EASTERN ATLANTIC SEA) MUSES DELIVERABLE: D3.3 - CASE STUDY IMPLEMENTATION - ANNEX 5 Mario Caña Varona, Helena Calado, Marta Vergílio University of the Azores Acknowledgements: Michele Silva for contributing to the preparation of interviews and all the stakeholders who actively participated in WP3 of the MUSES project 30 November 2017
Transcript
Version 1.1
Page 1
MUSES PROJECT
CASE STUDY 3A: DEVELOPMENT OF TOURISM AND FISHING IN THE SOUTHERN ATLANTIC SEA (SOUTH COAST OF MAINLAND
PORTUGAL - ALGARVE REGION - EASTERN ATLANTIC SEA)
MUSES DELIVERABLE: D3.3 - CASE STUDY IMPLEMENTATION - ANNEX 5
Mario Caña Varona, Helena Calado, Marta Vergílio University of the Azores
Acknowledgements: Michele Silva for contributing to the preparation of interviews and all
the stakeholders who actively participated in WP3 of the MUSES project
30 November 2017
Version 1.1
Page 2
TABLE OF CONTENTS
1 Geographic Description and Geographical Scope of the Analysis .................................... 4
2 Current Characteristics and Trends in the Use of the Sea ................................................ 5
APPENDIX 2 Sheets used in the stakeholder engagement phase ............................................. 93
Version 1.1
Page 4
Introduction
This report is integrated in Work Package (“WP”) 3 – Case Studies, of the Multi-Use in European Seas (“MUSES”) Project. It presents the case study report for the Southern Atlantic Sea (Algarve region), one of two study areas included in the Portuguese case study. A parallel case study report is also being developed for the Southern Atlantic Sea in the Azores archipelago. 1 GEOGRAPHIC DESCRIPTION AND GEOGRAPHICAL SCOPE OF THE ANALYSIS
The Algarve is the region occupying the southernmost range of mainland Portugal. It is a well-individualized geographical unit with an administrative definition and adjusted to the natural bor-ders (Turismo do Algarve, 2015). The Algarve is surrounded by the Atlantic Ocean on its western and southern border, the Alentejo region to the north and the Guadiana River to the east, which separates this region and Portugal from Spain (Strand & Bergh, 2017; Turismo de Portugal, 2014). The region occupies over 5,000 km2 and is home to about 440,000 inhabitants, which accounts for 4.3% of the Portuguese population approximately (European Commission, 2017).
Figure 1 Location of the Algarve region (source: authors from Claus et al., 2017).
Located between the Mediterranean Sea, North Africa and the Eastern Atlantic, the Algarve has a coastline of approximately 220 km whose waters are among the most productive of the Iberian Peninsula (Stelzenmüller et al., 2013). The convergence of water masses from the Mediterranean, temperate Atlantic and tropical Atlantic Seas along the Algarve coast allows marine organisms with northern and southern affinities to meet. These marine organisms then benefit from highly productive waters favoured by upwelling phenomena, especially in the Algarve Barlavento and Costa Vicentina. The variety of rocky, sandy and silt seafloors and landforms such as sea stacks, bays, capes, lagoons and estuaries, provide habitats for shelter, feeding, reproduction and growth of many different marine species (Turismo do Algarve, 2015).
Version 1.1
Page 5
2 CURRENT CHARACTERISTICS AND TRENDS IN THE USE OF THE SEA
The Algarve presents a strong link with the ocean, as a result of its natural conditions, history, cul-ture and notorious know-how related with traditional maritime activities (Valadas-Monteiro, 2014).
Historically, fisheries and fish processing industry have been crucial economic activities with a strong tradition in the region (Valadas-Monteiro, 2014). However, fisheries are heavily exploited due to the generally calm ocean conditions and high diversity of resources (Stelzenmüller et al., 2013). Industrial fishing is undertaken by larger trawlers and pelagic purse seiners. Artisanal fish-ers use a large range of gear and fishing devices. Catches are mainly high valued finfish or bottom species and cephalopods (Bolman, 2012). The fish conservation industry in this region has its origin in the 19th century when the first fish processing factory of Portugal was built in the town of Vila Real de Santo António in the Algarve. In the early 1960s there were 60 active fish pro-cessing factories across the Algarve (Guedes Soares & Santos, 2015). However, the strongly spe-cialized development of the Algarve in recent decades has led this major traditional sector, to-gether wth shipbuilding and naval repair, to a situation of general decline. This is partially ex-plained by the fishing sector’s inability to adapt to new operating requirements of the market (Valadas-Monteiro, 2014).
The catching of tuna in this area can be traced back to before the Roman occupation (Valadas-Monteiro, 2014). At the beginning of the 20th century, there were more than 15 tuna traps re-leased in the Algarve near-shore areas. This activity, which is a descendent of the anciant Arab almadravas, was restored in the 1990s in the Algarve, after several decades of disuse. Currently, the tuna caught are fed for several months in order to to gain weight before being sent to market (Guedes Soares & Santos, 2015), throught the activity of fish farming.
The Algarve has excellent natural conditions for the development of aquaculture production (Valadas-Monteiro, 2014), occupying an important place in the national aquaculture production with 54% in volume and 65% in value of the national totals in 2008 (Guedes Soares & Santos, 2015). Most of the aquaculture activities are related to bivalve culture in inshore estuarine-lagoons (Stelzenmüller et al., 2013) where the preferred species are clams and oysters. Long-lines for mussel culture is a more recent activity. Finfish culture, using extensive rearing systems in in-land waters, exists but is mainly for self-consumption. Fish culture in ponds using semi-intensive rearing systems is still low scale (Bolman, 2012). Since 2008, the region is attracting significant in-vestments, especially on longlines for bivalve molluscs such as mussels, oysters and scallops, blue-fin tuna traps, and fish cages for gilthead bream and sea bass (Valadas-Monteiro, 2014), which is supported by the Portuguese Government.
Both the fisheries and the aquaculture sectors have a reduced expression in the Algarve’s total GVA – around 2% in 2008. This figure has decreased from around 20% in the period 1995 to 2008. However, the relevance of these activities transcends the purely economic value to the social sig-nificance, as this region has a higher proportion of employees in fishing, aquaculture, processing and marketing of fish products. Their contribution to the respective sectorial GVA nationally is 25% in 2007 (Guedes Soares & Santos, 2015).
The Algarve is one of the main tourism areas of the country, which is recognised world-wide as a holiday destination (European Commission, 2017). This region became a popular tourist destina-
Version 1.1
Page 6
tion from the 1960s. It is also a place for retirement and secondary/holiday homes for Northern Europeans (Petrov et al., 2009; WTTC, 2003). This population increase has led to increased pres-sure for construction of both residential areas and tourist facilities, which is especially high at the shoreline (Petrov et al., 2009). Nautical activities, such as recreational boating, have been gaining increasing importance. One major external positive of nautical tourism, particularly concerning yachting and nautical sports, is the potential mitigation of tourism seasonality in the region (Vala-das-Monteiro et al., 2014). The expected trend of this scenario is the continued development of touristic activities, possibly with an increase in the diversity of offered activities. Diving and un-derwater tourism has the potential for growth in the region and this is being explored by creating artificial reefs and the first Portuguese underwater museum (Valadas-Monteiro, 2014). The envi-ronment of the Algarve has special characteristics which has led to the protection of several spac-es. Ria Formosa Natural Park is one of the most outstanding natural spaces of the Algarve and is a humid zone of international importance. The Ria Formosa estuary is a complex of canals, islands, marshland and sandy beaches that extend 60 km along the Algarve coast (Turismo de Portugal, 2013). The Natural Park of Sudoeste Alentejano e Costa Vicentina extends along 110 km of the southwest coast of Portugal from the Algarve to the Alentejo region. This land-sea interface area has a high diversity of landscapes and flora and fauna biotopes (ICNF, 2017).
Marine renewable technologies are almost non-existent in the region, although prototypes of tid-al energy generation are being tested in Ria Formosa by the Centre of Environment and Marine Research (“CIMA”) of the University of the Algarve (Naves, 2016). The University of the Algarve and CIMA, together with the Marine Sciences Centre (“CCMAR”) are leading marine scientific re-search in the region. Concerning non-renewable energy, there were attempts to develop Oil and Gas in the south coast which has been stopped by the Portuguese Government who recenlty re-voked exploration licences (Petiz & Baldaia, 2016). Maritime transportation is an important sector in the region since the Algarve is located near the Strait of Gibraltar, which is the maritime en-trance to the Mediterranean Sea, leading to heavy maritime traffic in the area.
Version 1.1
Page 7
3 MULTI-USE OVERVIEW
The Algarve has not developed multi-use (“MU”) to a large extent. Even high technological mari-time activities are not yet in place but are being promoted in some cases. Existing MUs are mainly related to “soft” or traditional uses of the maritime space, such as aquaculture (tuna farming) as-sociated with tourism, or underwater cultural heritage (“UCH”) associated with tourism and envi-ronmental protection. Therefore, MU consists mainly of combinations of geographical, human and biological resources. Information about MU in this area is limited. Several steps were under-taken to overcome this lack of information, mainly based on desk analysis and stakeholder en-gagement.
3.1 Desk Research
Desk research was defined to be the starting point for the analysis. Desk research included anal-yses of past or on-going projects related to MU. There are few projects that have focused their at-tention on the Algarve region, specifically COEXIST and AQUASPACE, which both have a case study in the area.
Table 1 Screened projects (data for MUSES, 2017)
COEXIST AQUASPACE
Project title Interaction in European coastal waters: A roadmap to sustainable integration of aq-uaculture and fisheries
Ecosystem Approach to making Space for Aquacul-ture
Leader and in-volved actors
Institute of Marine Research (IMR) (Nor-way) and 13 partners from 10 countries
The Scottish Association for Marine Science and 22 partners across the world
Type of project FP7; Collaborative project (small or medi-um-scale focused research project)
EU Horizon 2020
Start April 2010 March 2015
End June 2013 February 2018
Aim Provide a roadmap to better integration, sustainability and synergies across the di-verse activities taking place in the European coastal zone
Provide increased space for aquaculture by identi-fying key constraints limiting development
MU combination Coastal fisheries and aquaculture Co-use and optimising space allocation
Scope Cross-sector, but especially coastal fisheries and aquaculture
Offshore aquaculture
Demonstra-tion/pilot activi-ties
Case study in the Algarve Case study in the Algarve
Location European Seas Worldwide
COEXIST offers a deep analysis of conflicts and synergies between aquaculture and fisheries and other different activities existing in the examined coastal areas like the Algarve. Synergies in the Algarve concern mainly with fisheries/aquaculture and environmental conservation (ecological and oceanographic research benefits from data obtained from the tuna trap firm), and also vessel construction and fisheries (Stelzenmüller et al., 2013.). AQUASPACE studies key issues in the Al-
Version 1.1
Page 8
garve such as co-use, optimising space allocation or disease connectivity. A limited level of plan-ning for implementation of aquaculture and other activities offshore is identified as a weakness for the case study. However, a possibility of installing offshore concessions which can be com-bined with other activities has been identified as an opportunity.
Furthermore, desk research included the exploration and analysis of the main policy documents regarding uses and activities in the maritime space of the Algarve, and related policies such as Maritime Spatial Planning (“MSP”), sectorial legislation, and other relevant documents. Examples of these are listed below: - National Ocean Strategy 2006-2016 - National Ocean Strategy for 2013-2020 - Law 17/2014 basis for the Policy of Planning and Management of the National Maritime
Space - Spatial Plan for Maritime Space (POEM) - Situation Plan of the Maritime Spatial Planning (PSOEM)
Portugal has developed several policy documents aimed at regulating the Portuguese maritime space. The Portuguese Government approved two National Ocean Strategies (PG, 2006; PG, 2013); and developed the Spatial Plan for Maritime Space in 2012 (“POEM”) (DGPM, 2017a). Law 17/2014, approving the basis for the Policy of Planning and Management of the National Mari-time Space (“LBOGEM”), is the fundamental law for MSP in Portugal. These documents do not make explicit references to the concept of MU. However, LBOGEM refers to MU when conflicting uses arise, stating that priority should be given to uses or activities with higher social and econom-ic advantages for the countries or to those that present the maximum coexistence of uses or ac-tivities (Vergílio et al, 2017).
The National Ocean Strategy for 2013-2020 is the policy instrument for the sustainable develop-ment of the economic sectors related to the sea (PG, 2013), based on the “Blue Growth” para-digm. The Action Plan – Plan Mar-Portugal – defined in the National Ocean Strategy aims to pro-mote the economic, social and environmental enhancement of the national maritime space through the execution of sectorial and inter-sectorial projects. The Portuguese Situation Plan of the POEM (“PSOEM”) promotes the compatibility between uses or activities, contributing for a better and higher economic exploitation of the national maritime space. PSOEM is also the in-strument that defines how private citizens may use maritime space, allowing the national admin-istration to issue the permits for use of public maritime space, called Titles for the Private Use of the National Maritime Space (“TUPEM”) (PSOEM, 2017). Portugal has also developed a one-stop-shop for all maritime uses and activities. Licensing is centralized in one single online platform, however sometimes it is more difficult for investors to follow the process, as different entities an-alyse the licences. Portugal created the Blue Fund (Fundo Azul), aimed at developing the blue economy, supporting scientific and technological research, among others, through the creation or strengthening of funding mechanisms for entities, activities or projects that meet these objectives (Vergílio et al, 2017; DGPM, 2017b).
Version 1.1
Page 9
3.2 Stakeholder Engagement
Stakeholder engagement, as one of the principle sources of information in the MUSES project (Zaucha et al., 2017), was the main source of information for the Algarve, where MU is either not yet well known or not yet implemented enough to a large extent. For this reason, great efforts were made to gather information, according to stakeholder’s knowledge on the MU and time availability. A detailed description of the stakeholder engagement methodology is described in Section 7.1: Stakeholder Engagement Methodology.
Based on desk research, a total of 13 combinations were pre-selected for the analysis. These MUs were presented to stakeholders and separated in two categories: those identified as MU currently in place and those which have the potential to be developed in the near future (Table 2).
Table 2 Current and potential MU identified in Algarve (data for MUSES, 2017)
Current MU Potential MU Fisheries + Tourism and Recreation Blue Biotechnology + Environmental Protection* Tourism and Recreation + UCH + Environmental Protec-tion*
Renewable energy + Environmental Protection*
Tourism and Recreation + Environmental Protection* Renewable energy + Fisheries Scientific Research + Environmental Protection* Renewable energy + Tourism Scientific Research + Defence Renewable energy + Aquaculture Scientific Research + UCH Aquaculture + Tourism Aquaculture + Environmental Protection*
* Conservation is a "use" in the sense that sufficient value is attributed to conserved resources that placing restrictions on other possible uses is consider or in place
The stakeholders interviewed checked the list in Table 2, choosing between “Yes” or “No” on the pre-selected MU, and changing MUs between the two categories “Current MU” and “Potential MU”. Stakeholders then suggested additional MUs to be added to the two categories, according to their local knowledge. Table 3 shows the final result of the responses given by interviewees to the pre-selected MU, together with new combinations identified by them as current or potential MU. A green colour shows MU considered as being currently in place while an orange colour means MU is perceived as potentially occurring in the near future. A total of 19 MUs were identi-fied in total, with six being added to the original MU list by interviewees. From the original list, five MUs were agreed to be existing in the Algarve, and four MUs were agreed to be likely to oc-cur in the near future. There was disagreement on whether or not four MUs were currently or had the potential to be. However, these four are considered to be current MUs because at least one interviewee knows about the implementation of these MUs in the case-study area, except for one MU where the interviewee who considered as current did not provide more details or specific lo-cation. Among the six MUs added by interviewees, three were identified as potential and three as current. This gives a total of 11 current MUs and 8 potential MUs in the Algarve.
Version 1.1
Page 10
Table 3 Overview of responses given to current (green colour) and potential (orange colour) MUs by stakeholders and final consideration (data for MUSES, 2017)
MU Combination Int. 1 Int. 2 Int. 3 Int. 4 Int. 5 Int. 6 Int. 7 Int. 8 Int. 9 Final considerationFisheries + Tourism and Recreation Current MUTourism and Recreation + Underwater Cultural Heritage + Environmental Protection Current MUTourism and Recreation + Environmental Protection Current MUScientific Research + Environmental Protection Current MUScientific Research + Defence Current MUScientific Research + UCH Current MUBlue Biotechnology + Environmental Protection Current MURenewable energy + Environmental Protection Potential MURenewable energy + Fisheries Potential MURenewable energy + Tourism Potential MURenewable energy + Aquaculture Potential MUAquaculture + Tourism Current MUAquaculture + Environmental Protection Potential MUScientific Research + Fisheries Current MUAquaculture + Scientific Research Potential MUBlue Biotechnology + Scientific Research Potential MUAquaculture + Blue Biotechnologie + Tourism Current MUOil&Gas + Scientific Research Current MUOil&Gas + Tourism + Aquaculture Potential MU
Version 1.1
Page 11
Interviewees performed their own analysis of MUs identified in Algarve. Table 4 shows the number of analysis per MU performed by interviewees. Out of the 19 MUs identified, a total of seven MUs have been analysed by interviewees, with three of these being analysed by more than 1 interviewee:
• Aquaculture + Tourism and Recreation; • Tourism and Recreation + Environmental Protection; • Fisheries + Tourism and Recreation; • Tourism and Recreation + UCH + Environmental Protection; • Scientific Research + Environmental Protection; • Aquaculture + Environmental Protection, and; • Oi l& Gas + Tourism + Aquaculture.
Table 4 Number of analysis per MU by interviewees (data for MUSES, 2017)
MU Status Number of analysis Aquaculture + Tourism and Recreation Current 4 Tourism and Recreation + Environmental Protection Current 4 Fisheries + Tourism and Recreation Current 3 Tourism and Recreation + UCH + Environmental Protection Current 1 Scientific Research + Environmental Protection Current 1 Aquaculture + Environmental Protection Potential 1 Oil & Gas + Tourism + Aquaculture Potential 1 Scientific Research + Defence Current 0 Scientific Research + UCH Current 0 Blue Biotechnology + Environmental Protection Current 0 Renewable energy + Environmental Protection Potential 0 Renewable energy + Fisheries Potential 0 Renewable energy + Tourism Potential 0 Renewable energy + Aquaculture Potential 0 Scientific Research + Fisheries Potential 0 Aquaculture + Scientific Research Potential 0 Blue Biotechnology + Scientific Research Current 0 Aquaculture + Blue Biotechnology + Tourism Current 0 Oil & Gas + Scientific Research Current 0
The interviewees therefore analysed these seven MUs, providing information about the activities they consist of, the resources used in common and their location. These seven MUs are described in the following subchapters. Tables of Drivers, Barriers, Added values and Impacts (“DABIs”) for each relevant MU are presented in Appendix 1.
3.3 Relevant MU Combinations
Aquaculture + Tourism and Recreation
This combination was identified by half of the interviewees as a potential MU. However, it is consid-ered a current MU because some of the interviewees revealed where the MU is implemented, and what was also corroborated by desk research. This MU consists of aquaculture facilities which are
Version 1.1
Page 12
used as a touristic attraction, or where recreational activities are also taking place associated to the aquaculture activity. In this case, aquaculture includes different types of activity, namely fish farm-ing, together with fish, mussel and algae aquaculture. Decree-Law 10/2017 establishes the legal re-gime for the installation and exploration of marine aquaculture sites.
This MU is implemented offshore of Ria Formosa (Figure 3) via the joint activities of fish farming (e.g. tuna farming) and tourism, where visitors develop recreational activities such as diving related to farming exploration. It is developed by the company Tuna Dive Tours, subsidiary of the company Tunipex. The combination of both activities allows tourists to enjoy the observation of large tuna shoals and other fish in their natural habitat (Tunipex, 2011). Companies of nautical tourism include the visiting of mussel cultivations of the company Companhia de Pescarias do Algarve in Olhão and Culatra (Ria Formosa) and of the company Testa & Cunhas along the coasts of Sagres and Portimão. Synergies between the two activities are present, but also conflicts are also apparent, namely with fishing communities. Aquaculture is a priority for the national government of Portugal and the areas to develop this activity are the areas where traditional fisheries are, which means conflict with this sector (MUSES Stakeholder interviews, 2017 com.per.).
Figure 2 Location of the MU Aquaculture + Tourism and Recreation in the case-study area (data for MUSES, 2017)
Version 1.1
Page 13
Tourism and Recreation + Environmental Protection
This combination was agreed to be a current MU by all interviewees. It consists of the development of touristic activities inside designated marine areas, managed with the goal to preserve natural re-sources. For the purposes of the MUSES project, “Environmental Protection” is defined as any area-based management solution for the marine space where measures are set up to achieve long-term conservation objectives, while other uses are managed within a clearly defined geographical scope. This definition includes, but is not limited to, Marine Protected Areas (“MPAs”), Natura 2000 sites, biosphere reserves and Ecologically or Biologically Significant Marine Areas (“EBSA’s”). This MU was identified to be currently in place in the areas surrounding important towns in the Algarve such as Sagres, Lagos, Portimão, Albufeira, Vilamoura, Faro, Olhão, Tavira e Vila Real de Santo Antonio, and specifically in the natural protected areas of Ria Formosa and Costa Vicentina (Figure 4) (MUSES Stakeholder interviews, 2017 com.per.).
Figure 3 Location of the MU Tourism and Recreation + Environmental Protection in the case-study area (data for MUSES, 2017)
Version 1.1
Page 14
Fisheries + Tourism and Recreation
This combination was identified as a current MU by all interviewees except for one who considered it as a potential MU. The reason for this is that in mainland Portugal there is no specific regulation that allows tourists going on fishing boats to develop the activity known as “pesca-tourism”, which exists in the autonomous region of the Azores (MUSES Stakeholder interviews, 2017 com.per.). Pes-ca-tourism is characterized by professional small-scale fishers welcoming tourists on their boats to go along with fishers and watch, or even participate, in the traditional fishing activity. This combina-tion is different from recreational fishing as it really involves fishers and fishing vessels and people participating as tourists in the activity. This combination was identified around the main ports of the Algarve: Sagres, Portimão, Albufeira, Vilamoura, Faro, Olhão, Tavira and Vila Real de Santo Antonio as well as in along Ria Formosa and Costa Vicentina (Figure 5).
Figure 4 Location of the MU Fisheries + Tourism and Recreation in the case-study area (data for MUSES, 2017)
Version 1.1
Page 15
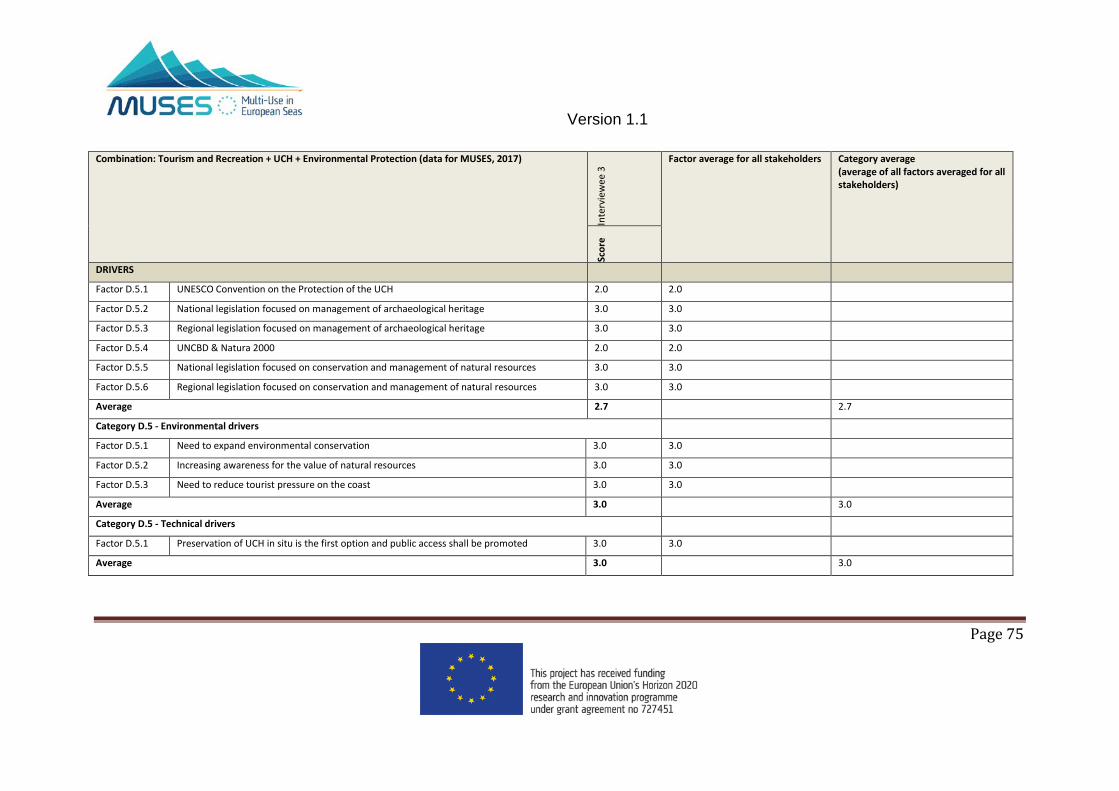
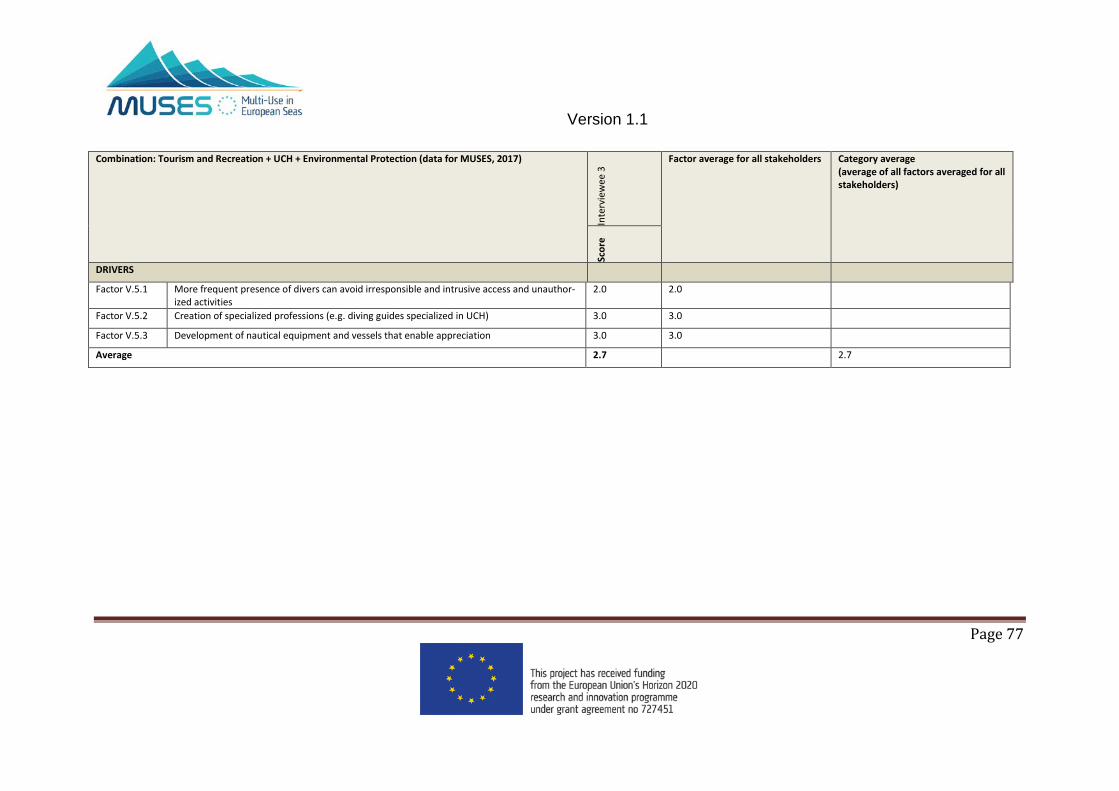
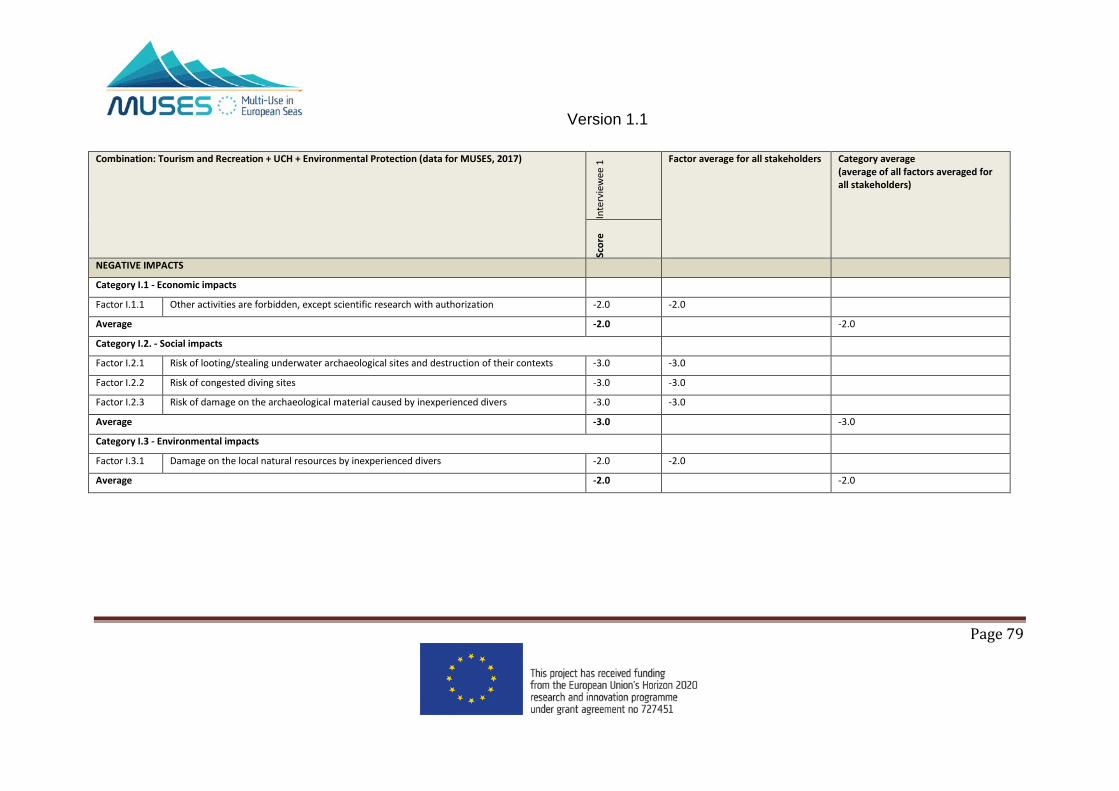
Tourism and Recreation + UCH + Environmental Protection
This combination was agreed to be a current MU by all interviewees. This combination consists of UCH being used as a resource for tourism and recreation inside designated marine areas, managed with the goal of preserving natural resources. UCH is understood in the MUSES project as “all traces of human existence having a cultural, historical or archaeological character which have been partially or totally under water, periodically or continuously, for long (UNESCO, 2001) or shorter periods of time, usually designated as Historical Relevant Sites” (Haponiuk, 2015). Examples of traces of human existence are structures, buildings, artefacts and vehicles, such as vessels and aircraft. Portugal rati-fied that Convention in 2006 (Decree of the President of the Republic 65/2006). For the purposes of the MUSES project, “Environmental Protection” is defined as any area-based management solution for the marine space where measures are set up to achieve long-term conservation objectives, while other uses are managed within a clearly defined geographical scope. This combination has been lo-cated in two areas where UCH has an important presence in the region, the coasts between Sagres and Portimão and Ria Formosa (Figure 6).
Figure 5 Location of the MU Tourism and Recreation + UCH + Environmental Protection in the case-study ar-ea (data for MUSES, 2017)
Ocean Revival is one of the more interesting locations for this combination. Ocean Revival is an un-derwater museum where four vessels of the Portuguese Navy were sunk to attract divers. It also works as an artificial reef (MUSES Stakeholder interviews, 2017 com.per.).
Version 1.1
Page 16
Scientific Research + Environmental Protection This combination was agreed to be a current MU by all interviewees. This combination is character-ized by scientific research activities being developed inside designated marine areas managed with the goal of preserving natural resources. Interviewees identified this combination to be present es-pecially in the areas of Ria Formosa, Sagres, and offshore in Costa Vicentina (Figure 7).
Figure 6 Location of the MU Scientific Research + Environmental Protection in the case-study area (data for MUSES, 2017)
Aquaculture + Environmental Protection This combination was identified for most of the interviewees as a potential one. It was also consid-ered as a current MU by one of interviewees. However, since this interviewee did not provide a spe-cific location or more detail about the implementation of the MU in the Algarve, the combination is considered to be potential MU. This combination refers to aquaculture facilities developed within designated areas managed with the goal of preserve natural resources. This combination might also refer to aquaculture developed with species that might improve environmental conditions of spots where they are located (e.g. some species of mussels and algae).
Oil and Gas + Tourism + Aquaculture
Version 1.1
Page 17
This combination was identified by one interviewee as potential in the Algarve. Oil and gas explora-tion and exploitation have been partially stopped with the recession of the contracts with the com-panies Portfuel and Repsol-Partex at the end of 2016 (Petiz & Baldaia, 2016). The company Eni Por-tugal has an offshore concession in Algarve, along the coast of Alentejo and Costa Vicentina (western coast of Algarve) (MUSES Stakeholder interviews, 2017 com.per.), which may be important for the development of MU related to the Oil & Gas activity as the present one. The interviewee did not provide any specific location for this MU.
3.4 Combinations Selected to be Analysed Further
The number of analysis is considered to be representative of the importance of each MU for the case-study. Three MUs stand out for the number of analysis performed by interviewees: Aquacul-ture + Tourism and Recreation; Tourism and Recreation + Environmental Protection, both receiving four analysis each; and Fisheries + Tourism and Recreation with three analysers. The rest of the MU combinations only received one analysis (Table 5). These three combinations will be further analysed in the following chapters.
Table 5 Number of analysis per MU obtained from performed interviews (data for MUSES, 2017)
MU Number of analysis Aquaculture + Tourism and Recreation 4 Tourism and Recreation + Environmental Protection 4 Fisheries + Tourism and Recreation 3 Tourism and Recreation + UCH + Environmental Protection 1 Scientific Research + Environmental Protection 1 Aquaculture + Environmental Protection 1 Oil & Gas + Tourism + Aquaculture 1
Version 1.1
Page 18
4 CATALOGUE OF MU DRIVERS, BARRIERS, ADDED VALUE, IMPACTS
The starting point for the completion of catalogues of Drivers, Barriers, Added Values and Impacts (“DABI”) was the MUSES internal document of general DABI for the 14 most relevant MU combina-tions identified under WP2 – Sea Basin Overview. Thus, for the 13 MU pre-selected for the Algarve, DABI factors have been incorporated to each MU from the general DABI document. Before their in-tegration, general DABIs have been checked and adapted to the context of Portugal, and specifically to the Algarve region context. In addition to this, more DABI factors have been included for those important factors that were missing in the general DABI or found by desk research. In this way, 13 catalogues of DABI have been compiled and prepared to present to stakeholders during interviews. Interviewees have been asked to comment and add more DABIs to these catalogues. The final cata-logues of the three most important MUs in the Algarve are presented here, along with the contribu-tion of interviewees.
4.1 MU Aquaculture + Tourism and Recreation
The catalogue of factors of the MU Aquaculture + Tourism and Recreation was verified by four inter-viewees, who contributed and evaluated these DABI factors (Table 6). This catalogue integrates the original DABI factors of the present MU combination, together with some of the factors of the MU combination Fisheries + Tourism and Recreation. The reason for this is that some interviewees eval-uated the activity fish farming, which is integrated as part of the Aquaculture + Tourism and Recrea-tion MU, on the catalogue of DABI for the Fisheries + Tourism and Recreation MU. Since fish farming have elements of both aquaculture and fisheries, DABI factors of both combinations were suitable for the analysis. Those DABI elements from the Aquaculture + Tourism and Recreation MU evaluated by interviewees concerning fish farming have been integrated in the present catalogue.
Table 6 Catalogue of factors: MU Aquaculture + Tourism and Recreation (data for MUSES, 2017)
DRIVERS = factors promoting MU BARRIERS = factors hindering MU
Category D.1 – policy drivers Factor D.1.1 Co-location of uses recommended by strate-gic plans Factor D.1.2 Dedicated regional funds specific for the ac-tivity Factor D.1.3 “European Maritime and Fisheries Fund (EMFF)” for 2014-2020 has an aim of diversifying the ac-tivity Factor D.1.4 Strategic measures with the aim to diversify the activity with tourism Factor D.1.5 Limitation (e.g. quotas, closed seasons and not allowed areas)
Category B.1 – legal barriers Factor B.1.1 Lack of specific guidelines/regulatory aspects Factor B.1.2 Possible concession/licensing barriers, limiting tour-ism activities Factor B.1.3 Legal aspects concerning hygiene and security of pas-sengers on the vessel Factor B.1.4 Need for a second Licence Factor B.1.5 Funding schemes are decentralized (e.g. national funds are subjected to specific regional development priorities) Factor B.1.6 Repeated licences
Category D.2 – interactions with other uses Factor D.2.1 Tourism growth Factor D.2.2 Competition for space Factor D.2.3 High number of maritime activities in the ar-ea – need to limit conflicts
Category B.2 – administrative barriers Factor B.2.1 No existence of administrative Simplex Factor B.2.2 Complexity of procedures
Category B.3 – financial barriers / risks Factor B.3.1 Concurrence of other tourism sectors Factor B.3.2 Lack of investors, also due to the limited expertise
Version 1.1
Page 19
DRIVERS = factors promoting MU BARRIERS = factors hindering MU
Factor D.3.3 Low potential for fisheries’ growth Factor D.3.4 Ensure all year activity for aquacul-ture/farming and tourism Factor D.3.5 Find new sources of income Factor D.3.6 Increasing eco-tourism
Factor B.3.3 Lack of adequate funding for start-up of activity (e.g. buy material for ensuring security or pay a second Licence and in-surances)
Category D.4 – societal drivers Factor D.4.1 Need to diversify activity to maintain com-munities’ identity
Category B.4 – barriers related to technical capacity Factor B.4.1 Need to adapt aquaculture/farming vessels for tour-ism activities Factor B.4.2 Limited expertise of actors involved in this combina-tion Factor B.4.3 Lack of expertise to deal with tourists (e.g. language and communication skills) Factor B.4.4 Lack of expertise to develop organized economic business Factor B.4.5 Need of logistic infrastructure in land (it can be a partner) Factor B.4.6 Lack of advertisement/publicity of the MU
Category D.5 – legal drivers Factor D.5.1 Simplification of licensing of the MU Factor D.5.2 National legislation Factor D.5.3 Regional legislation Factor D.5.4 Licence is issued in short time Factor D.5.5 Licence’s process is similar to the process for commercial activity
Category B.5 – barriers related to social factors Factor B.5.1 Resistance to change in small fishing communities Factor B.5.2 Risks on board (e.g., fall during recovering gear)
Category D.6 – environmental drivers Factor D.6.1 Need to reduce tourist pressure on the coast Factor D.6.2 Public awareness to responsible activities Factor D.6.3 Reduction of fisheries exploitation
Category B.6 – barriers related to environmental factors Factor B.6.1 MU is more dependent on environmental conditions Factor B.6.3 Restriction/dependence on fishing ban periods Factor B.6.4 Restriction/dependence on weather conditions
ADDED VALUES = positive effects of MU IMPACTS = negative effects of MU
Category V.1 – economic added value Factor V.1.1 Increase of local economy Factor V.1.2 Specialized jobs creation Factor V.1.3 Development of new market opportunities for both aq-uaculture/farming and tourism (e.g. integrative income) Factor V.1.4 Improvement of commercialization of local products Factor V.1.5 Diversification of tourism sector Factor V.1.6 Extension of income season for both tourism and aqua-culture/farming
Category I.1 – economic impacts Factor I.1.1 Concurrence for other tourism sectors (e.g. whale watching and recreational fishing)
Category V.2 – societal added value Factor V.2.1 Consumer awareness Factor V.2.2 Involving family to help onshore Factor V.2.3 Conservation of traditional activity and their culture Factor V.2.4 Education and public awareness about state and issues of fisheries, as well as fisher culture Factor V.2.5 Promotion of seafood diet Factor V.2.6 Opportunity for tourists to present a high degree of satis-
Category I.3 – environmental impacts Factor I.3.1 Multiplication of cumulative impacts if tourism is too intensive
Version 1.1
Page 20
ADDED VALUES = positive effects of MU IMPACTS = negative effects of MU
faction (e.g. Sardinia – Italy) Category V.3 – environmental added value Factor C.3.1 Environmental awareness Factor C.3.2 Reinforced environmental protection Factor C.3.3 Education and public awareness about state and issues of marine environment Factor C.3.4 More sustainable than the single use of traditional fisher-ies because there is a limited catch Factor C.3.5 Reduction of tourists in the coast (e.g. traditional beach tourism)
Category V.5 - technical added values Factor V.5.1 Regional enterprises created Factor V.5.2 Improvement of technical skills (e.g. fishers become tour-ist actors)
Interviewees disregarded the driver “High number of maritime activities in the area – need to limit conflicts” by assigning it a value of zero. However, few interviewees mentioned the conflict between aquaculture producers, tourism operators and, the traditional users of the sea, fishers. These con-flicts may have a more local component than regional, which would explain why is not perceived as a driver to promote the MU in this case. The degradation of marine resources (which might impair the MU) is not perceived as a barrier. This means that interviewees do not perceive the general marine environment as a problem to develop maritime activities such as aquaculture and tourism which rely strongly on the environment. This barrier might be seemed as a problem at the local level though. Contrary to the multiple added values identified, the impacts identified are scarce.
4.2 MU Tourism and Recreation + Environmental Protection
The catalogue of factors of the Tourism and Recreation + Environmental Protection MU was verified by four interviewees, who contributed and evaluated the DABI factors (Table 7). Interviewees added several new barriers to the catalogue. These were related to legal aspects (regional legislation or bu-reaucracy) or different economical, technical and social aspects, such as the lack of support and re-sources for tourist infrastructures and services, or the lack of nautical infrastructures and tourism fa-cilities resulting in conflict with the local population space. The integration of these barriers shows interviewees’ experiences and knowledge related to the activities, which may be classified as real barriers. However, some barriers may be considered as perceived because of their generalisation, such as regional legislation. Interviewees also provided more added values such as combating sea-sonality in tourism or improving environmental responsibility by visiting the areas.
Version 1.1
Page 21
Table 7 Catalogue of factors: Tourism and Recreation + Environmental Protection MU (data for MUSES, 2017)
DRIVERS = factors promoting MU BARRIERS = factors hindering MU
Category D.1 – policy drivers Factor D.1.1 Strategic plan that promotes sustainable tour-ism and environmental conservation
Category B.1 – legal barriers Factor B.1.1 Nautical sports (e.g. recreational fisheries) need au-thorization or are not allowed in some designated areas Factor B.1.2 It is not allowed both people and boat access in some designated areas Factor B.1.3 Regional legislation Factor B.1.4 Bureaucracy
Category D.2 – interactions with other uses Factor D.2.1 Multiple synergies between tourism and envi-ronmental protection
Category B.3 – financial barriers / risks Factor B.3.1 Lack of support and resources for tourist infrastruc-tures and services
Category D.3 – economic drivers Factor D.3.1 Financial incentive systems Factor D.3.2 Increasing eco-tourism Factor D.3.3 Increasing number of designated/managed sites to be explored Factor D.3.4 Incentives to diversify economy
Category B.4 – barriers related to technical capacity Factor B.4.1 Design of new equipment (vessels to observe sea floor) Factor B.4.2 Lack of nautical infrastructures and tourism facilities
Category D.5– legal drivers Factor D.5.1 UNCBD & Natura 2000 Factor D.5.2 National legislation focused on conservation and management of natural resources Factor D.5.3 Regional legislation focused on conservation and management of natural resources
Category B.5 – barriers related to social factors Factor B.5.1 Population get in conflict with tourism for space
Category D.6 – environmental drivers Factor D.6.1 Need to expand environmental conservation Factor D.6.2 Increasing awareness for the value of natural resources Factor D.6.3 Need to reduce tourist pressure on the coast
Category B.6 – barriers related to environmental factors Factor B.6.1 Restriction/dependence on weather conditions
ADDED VALUES = positive effects of MU IMPACTS = negative effects of MU
Category V.1 – economic added value Factor V.1.1 Increase of local revenues related to tourist services Factor V.1.2 Diversification of tourism sector Factor V.1.3 Combat seasonality in tourism
Category I.1 – economic impacts Factor I.1.1 Other activities are forbidden, except scientific re-search with authorization
Category V.2 – societal added value Factor V.2.1 Establishment of an ecosystem service for des-ignated areas Factor V.2.2 Improve and environmental responsibility by visiting the areas Factor V.2.3 Creation of specialised job/professions
Category I.2 – societal impacts Factor I.2.1 Risk of congested sites might decrease level of satis-faction of tourists
Category V.3 – environmental added value Factor C.3.1 Lower impact use of environmental resources Factor C.3.2 Protection of natural resources Factor C.3.3 Education and public awareness about envi-ronmental protection Factor C.3.4 Improve environmental conditions of vessels
Category I.3 – environmental impacts Factor I.3.1 Damage on the local natural resources Factor I.3.2 Changes in behaviour and physiology of local fauna
Version 1.1
Page 22
ADDED VALUES = positive effects of MU IMPACTS = negative effects of MU
Category V.5 - technical added values Factor V.5.1 More frequent presence of tourists can avoid irresponsible and intrusive access and unauthorized activi-ties Factor V.5.2 Development of nautical equipment and ves-sels that enable appreciation
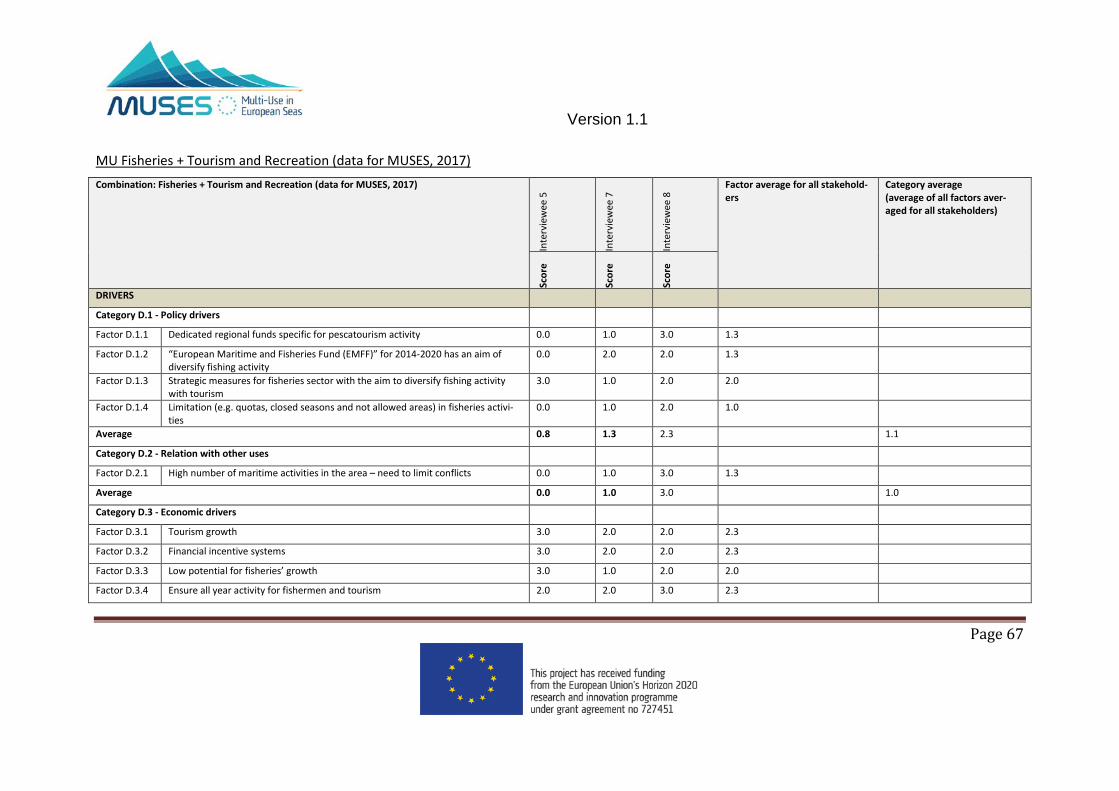
4.3 MU Fisheries + Tourism and Recreation
The catalogue of factors of the Fisheries + Tourism and Recreation MU was verified by three inter-viewees, who evaluated the DABI factors (Table 8). Interviewees did not add new factors to the cata-logue, and agree with the presence of most DABI elements identified. Barriers related with econom-ic availability/risk (such as concurrence from other tourism sectors or lack of adequate funding for start-up activity) are perceived very differently according to stakeholders’ evaluation. This poses the question if these are real barriers or perceived. Contrary to the multiple added values identified, the impacts identified are a very few.
Table 8 Catalogue of factors: MU Fisheries + Tourism and Recreation (data for MUSES, 2017)
DRIVERS = factors promoting MU BARRIERS = factors hindering MU
Category D.1 – policy drivers Factor D.1.1 Dedicated regional funds specific for pesca-tourism activity Factor D.1.2 “European Maritime and Fisheries Fund (EMFF)” for 2014-2020 has an aim of diversify fishing activi-ty Factor D.1.3 Strategic measures for fisheries sector with the aim to diversify fishing activity with tourism Factor D.1.4 Limitation (e.g. quotas, closed seasons and not allowed areas) in fisheries activities
Category B.1 – legal barriers Factor B.1.1 Legal aspects concerning hygiene and security of passengers on the vessel Factor B.1.2 Need for a second Licence Factor B.1.3 Funding schemes are decentralized (e.g. national funds are subjected to specific regional development priorities)
Category D.2 – interactions with other uses Factor D.2.1 High number of maritime activities in the area – need to limit conflicts
Category B.3 – financial barriers / risks Factor B.3.1 Concurrence from other tourism sectors Factor B.3.2 Lack of adequate funding for start-up of activity (e.g. buy material for ensuring security or pay a second Licence and insurances)
Category D.3 – economic drivers Factor D.3.1 Tourism growth Factor D.3.2 Financial incentive systems Factor D.3.3 Low potential for fisheries’ growth Factor D.3.4 Ensure all year activity for fishermen and tour-ism Factor D.3.5 Find new sources of income Factor D.3.6 Increasing eco-tourism
Category B.4 – barriers related to technical capacity Factor B.4.1 Lack of expertise to deal with tourists (e.g. language and communication skills) Factor B.4.2 Lack of expertise to develop organized economic business Factor B.4.3 Need of logistic infrastructure in land (it can be a partner) Factor B.4.4 Lack of advertisement/publicity of the MU Factor B.4.5 Lack of on-line platform to contact the fishers
Category D.4 – societal drivers Factor D.4.1 Need to diversify fishing activity to maintain fishing communities’ identity
Category B.5 – barriers related to social factors Factor B.5.1 Resistance to change in small fishing communities Factor B.5.2 Risks on board (e.g., fall during recovering gear)
Category D.5 – legal drivers Category B.6 – barriers related to environmental factors
Version 1.1
Page 23
DRIVERS = factors promoting MU BARRIERS = factors hindering MU
Factor D.5.1 National legislation focused on pesca-tourism Factor D.5.2 Regional legislation focused on pesca tourism Factor D.5.3 Licence is issued in short time Factor D.5.4 Licence’s process for pesca-tourism is similar to the process for commercial fishery
Factor B.6.1 Current degradation of marine resources might im-pair the activity Factor B.6.2 Restriction/dependence on fishing ban periods Factor B.6.3 Restriction/dependence on weather condi-tions
Category D.6 – environmental drivers Factor D.5.1 Public awareness to responsible fisheries and tourism activities Factor D.5.2 Need to reduce tourist pressure on the coast Factor D.5.3 Reduction of fisheries exploitation
ADDED VALUES = positive effects of MU IMPACTS = negative effects of MU
Category V.1 – economic added value Factor V.1.1 Increase of local economy Factor V.1.2 Development of new market opportunities for both traditional fisheries and tourism (e.g. integrative in-come for fishers) Factor V.1.3 Extension of income season for both tourism and fisheries Factor V.1.4 Diversification of tourism sector
Category I.1 – economic impacts Factor I.1.1 Concurrence for other tourism sectors (e.g. whale watching and recreational fishing)
Category V.2 – societal added value Factor V.2.1 Involving fisher’s family to help onshore Factor V.2.2 Conservation of traditional fisheries and their culture Factor V.2.3 Education and public awareness about state and issues of fisheries, as well as fisher culture Factor V.2.4 Promotion of seafood diet Factor V.2.5 Opportunity for tourists to present a high de-gree of satisfaction (e.g. Sardinia – Italy)
Category V.3 – environmental added value Factor C.3.1 Education and public awareness about state and issues of marine environment Factor C.3.2 More sustainable than the single use of tradi-tional fisheries because there is a limited catch Factor C.3.3 Reduction of tourists in the coast (e.g. tradi-tional beach tourism)
Category V.5 - technical added values Factor V.5.1 Improvement of technical skills (e.g. fishers become tourist actors)
Version 1.1
Page 24
5 RESULTS OF DABI SCORING: ANALYSIS OF MU POTENTIAL AND MU EFFECT
The methodology applied to the analysis presented in this section was developed for the WP3 - Case Studies (Bocci et al., 2017). The scoring system used to characterize DABI factors assumes that fac-tors influencing positively, or positive impacts resulting from the implementation of the MU, are as-signed with a positive value, while barriers and negative impacts resulting from the implementation of the MU are assigned with a negative value, in a four values scale. Thus, drivers and added values are assigned with values of 1, 2 or 3 and barriers and negative impacts are assigned with values of -1, -2 or -3. Values of 1 and -1 represent factors with the lower significance and values of 3 and -3 repre-sent factors with the higher significance. A value of zero is assigned to factors that are not relevant or absent in the case study and no scoring was assigned if the stakeholder did not know or preferred not to answer. Results of scoring presented in this section are the scoring averages resulting from the individual scoring of all analysis of each of the three MUs with more relevance for the sub-case study: Aquaculture + Tourism and Recreation; Tourism and recreation + Environmental Protection; and Fisheries + Tourism and Recreation. Results of all DABI tables analysed by interviewees are in-cluded in APPENDIX 1.
In addition, MU potential and MU overall effect are also presented in this section. The MU potential is evaluated by averaging the average drivers’ score and the average barriers’ score, assuming values in the interval [-1.5, 1.5], where -1.5 reflects totally negative MU potential and 1.5 totally positive MU potential. In instances where MU potential is a zero value it is assumed that there is a balance between factors promoting MU development and factors hindering it. Similarly, the MU overall ef-fect will be evaluated by averaging the average added value’s score and the average impacts’ score. The MU overall effect can assume values in the interval [-1.5, 1.5], where -1.5 reflects a totally nega-tive effect of MU in the area and 1.5 a totally positive effect. In instances where MU overall effect is a zero value it is assumed that there is a balance between pros and cons of MU development.
5.1 MU Aquaculture + Tourism and Recreation
The MU potential and MU effect of the combination Aquaculture + Tourism and Recreation is based on the analysis performed by four interviewees. The tables below present the average score of all factors as well as the average score of all categories in order of importance by the average scoring. Not all the factors were analysed by all four stakeholders since some of them were not answered by interviewees for different reasons: lack of knowledge on the specific factor; the factor was added and evaluated by only one of the interviewees; or in the case of this combination, two DABI tables are integrated into one.
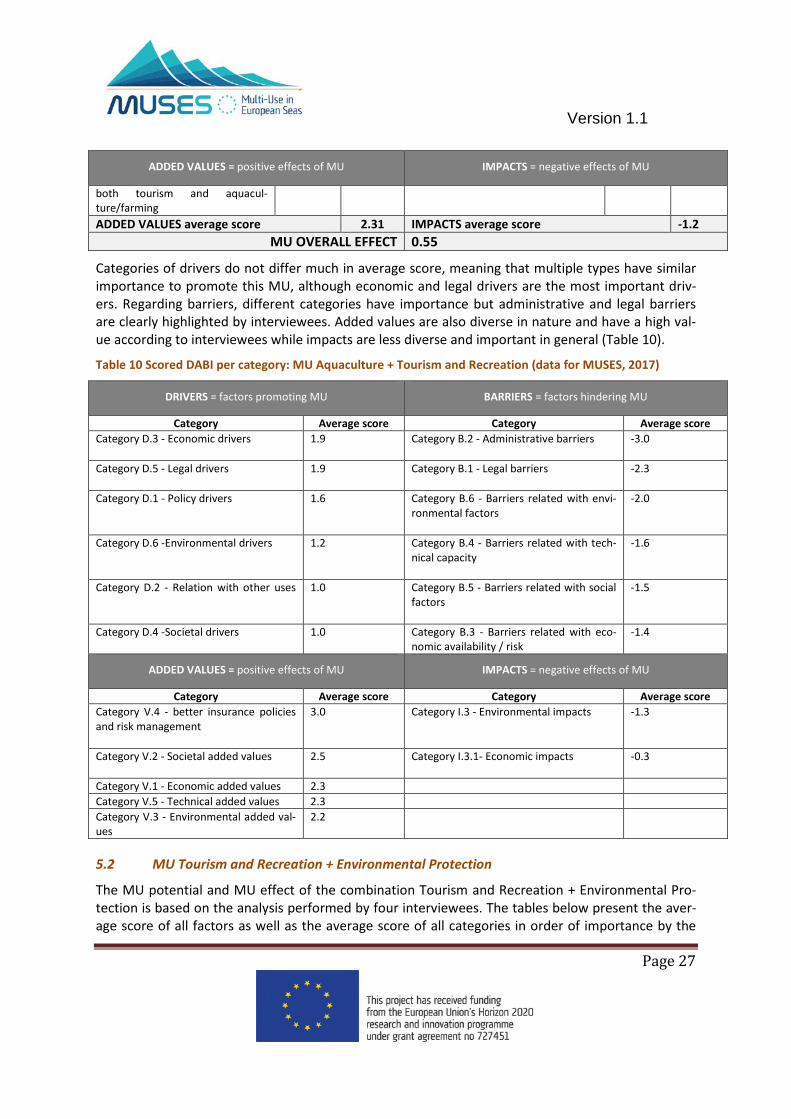
Aquaculture + Tourism and Recreation is a combination that is increasing in the Algarve. There are several drivers coming from the implementation of this activity but also several barriers that need to be overcome in order to fully create the conditions to promote the MU. The MU potential in this combination is therefore very little (0.07) because drivers and barriers are very compensated in terms of number and scoring, meaning that the relevance of drivers and barriers is very balanced. The MU overall effect of this combination is relatively higher (0.55) than MU potential, meaning that positive effects are more relevant than negative effects. This also shows the perception of the stake-holders who believe this MU is quite positive (Table 9).
Version 1.1
Page 25
Table 9 Scored DABI: MU Aquaculture + Tourism and Recreation (data for MUSES, 2017)
DRIVERS = factors promoting MU BARRIERS = factors hindering MU
Factor Category Average score
Factor Category Average score
Competition for space D.2 3
Lack of specific guidelines/regulatory aspects B.1 -3
National legislation D.5 3
Possible concession/licensing barriers, limiting tourism activities B.1 -3
Licence’s process is similar to the process for commercial activity D.5 3 Repeated licences B.1 -3 Co-location of uses recommended by strategic plans D.1 2.5
No existence of administrative Sim-plex B.2 -3
Simplification of licensing of the MU D.5 2.5 Complexity of procedures B.2 -3 Public awareness to responsible activities D.6 2.5
Restriction/dependence on fishing ban periods B.6 -3
Financial incentive systems D.3 2.25
Restriction/dependence on weather conditions B.6 -3
“European Maritime and Fisheries Fund (EMFF)” for 2014-2020 has an aim of diversify the activity D.1 2
Limited expertise of actors involved in this combination B.4 -2.5
Limitation (e.g. quotas, closed sea-sons and not allowed areas)
D.1 2
Lack of adequate funding for start-up of activity (e.g. buy material for en-suring security or pay a second Li-cence and insurances) B.3 -2
Tourism growth D.2 2
Need to adapt aquaculture/farming vessels for tourism activities B.4 -2
Tourism growth D.3 2
MU is more dependent on environ-mental conditions B.6 -2
Low potential for fisheries’ growth D.3 2
Resistance to change in small fishing communities B.5 -1.7
Ensure all year activity for aquacul-ture/farming and tourism D.3 2 Need for a second Licence B.1 -1.5 Find new sources of income
D.3 2 Lack of investors, also due to the lim-ited expertise B.3 -1.5
Increasing eco-tourism D.3 2
Need of logistic infrastructure in land (it can be a partner) B.4 -1.5
Regional legislation D.5 2
Lack of advertisement/publicity of the MU B.4 -1.5
Licence is issued in short time D.5 2
Legal aspects concerning hygiene and security of passengers on the vessel B.1 -1
Strategic measures with the aim to diversify the activity with tourism
D.1 1.5
Funding schemes are decentralized (e.g. national funds are subjected to specific regional development priori-ties) B.1 -1
Need to reduce tourist pressure on the coast D.6 1.5 Concurrence of other tourism sectors B.3 -1 Need to diversify activity to main-tain communities’ identity D.4 1.5
Lack of expertise to develop orga-nized economic business B.4 -1
Dedicated regional funds specific for the activity D.1 0.5
Risks on board (e.g., fall during recov-ering gear) B.5 -1
Version 1.1
Page 26
DRIVERS = factors promoting MU BARRIERS = factors hindering MU
Reduction of fisheries exploitation
D.6 0.5
Lack of expertise to deal with tourists (e.g. language and communication skills) B.4 -0.5
DRIVERS average score 1.92 BARRIERS average score -1.78 MU POTENTIAL 0.07
ADDED VALUES = positive effects of MU IMPACTS = negative effects of MU
Factor Category Average score
Factor Category Average score
Specialized jobs creation V.1 3 Multiplication of cumulative impacts if tourism is too intensive
I.1 -2
Consumer awareness V.2 3
Concurrence for other tourism sec-tors (e.g. whale watching and recrea-tional fishing)
Shared responsibility V.4 3 Regional enterprises created V.5 3 Increase of local economy V.1 2.5 Development of new market op-portunities for both aquacul-ture/farming and tourism (e.g. in-tegrative income) V.1 2.5
Improvement of commercialization of local products V.1 2.5
Education and public awareness about state and issues of fisheries, as well as fisher culture V.2 2.5
Opportunity for tourists to present a high degree of satisfaction (e.g. Sardinia – Italy) V.2 2.5
Diversification of tourism sector V.1 2.25 Promotion of seafood diet V.2 2 Education and public awareness about state and issues of marine environment V.3 2
More sustainable than the single use of traditional fisheries because there is a limited catch V.3 2
Improvement of technical skills (e.g. fishers become tourist actors) V.5 2
Involving family to help onshore V.2 1.5 Conservation of traditional activity and their culture V.2 1.5
Reduction of tourists in the coast (e.g. traditional beach tourism) V.3 1.5
Extension of income season for V.1 1
Version 1.1
Page 27
ADDED VALUES = positive effects of MU IMPACTS = negative effects of MU
both tourism and aquacul-ture/farming ADDED VALUES average score 2.31 IMPACTS average score -1.2
MU OVERALL EFFECT 0.55
Categories of drivers do not differ much in average score, meaning that multiple types have similar importance to promote this MU, although economic and legal drivers are the most important driv-ers. Regarding barriers, different categories have importance but administrative and legal barriers are clearly highlighted by interviewees. Added values are also diverse in nature and have a high val-ue according to interviewees while impacts are less diverse and important in general (Table 10).
Table 10 Scored DABI per category: MU Aquaculture + Tourism and Recreation (data for MUSES, 2017)
DRIVERS = factors promoting MU BARRIERS = factors hindering MU
Category Average score Category Average score Category D.3 - Economic drivers 1.9 Category B.2 - Administrative barriers
-3.0
Category D.5 - Legal drivers
1.9 Category B.1 - Legal barriers -2.3
Category D.1 - Policy drivers 1.6 Category B.6 - Barriers related with envi-ronmental factors
-2.0
Category D.6 -Environmental drivers
1.2 Category B.4 - Barriers related with tech-nical capacity
-1.6
Category D.2 - Relation with other uses
1.0 Category B.5 - Barriers related with social factors
-1.5
Category D.4 -Societal drivers
1.0 Category B.3 - Barriers related with eco-nomic availability / risk
-1.4
ADDED VALUES = positive effects of MU IMPACTS = negative effects of MU
Category Average score Category Average score Category V.4 - better insurance policies and risk management
5.2 MU Tourism and Recreation + Environmental Protection
The MU potential and MU effect of the combination Tourism and Recreation + Environmental Pro-tection is based on the analysis performed by four interviewees. The tables below present the aver-age score of all factors as well as the average score of all categories in order of importance by the
Version 1.1
Page 28
average scoring. Most of them were analysed by the four interviewees. However, a few of them were not answered by some of the interviewees since the factor was added and evaluated by a unique interviewee.
The MU potential in this combination is negative (-0.02) but almost zero, meaning that drivers and barriers are highly compensated. Barriers identified were less than drivers, however they are per-ceived as most important as the factors promoting the MU. This means that stakeholders perceived barriers to be difficult to overcome while drivers are less important relatively. The MU overall effect is little (0.2) but positive. However, a large difference in terms of number of added values which are many and impacts which are less is noticed. This also shows the perception of the stakeholders who believe this MU is little positive (Table 11).
Table 11 Scored DABI: MU Tourism and Recreation + Environmental Protection (data for MUSES, 2017)
DRIVERS = factors promoting MU BARRIERS = factors hindering MU
Factor Category Average score
Factor Category Average score
Need to expand environmental conservation D.6 2.75 Bureaucracy B.1 -3
Increasing eco-tourism D.3 2.5 Lack of support and resources for tourist infrastructures and services B.3 -3
National legislation focused on conservation and management of natural resources D.5 2.5
Lack of nautical infrastructures and tourism facilities B.4 -3
Increasing awareness for the value of natural resources D.6 2.5
Nautical sports (e.g. recreational fish-eries) need authorization or are not allowed in some designated areas B.1 -2.25
Increasing number of designat-ed/managed sites to be explored D.3 2.25 Regional legislation B.1 -2
UNCBD & Natura 2000 D.5 2.25 Population get in conflict with tour-ism for space B.5 -2
Strategic plan that promotes sus-tainable tourism and environmen-tal conservation D.1 2
It is not allowed both people and boat access in some designated areas B.1 -1.75
Multiple synergies between tour-ism and environmental protection D.2 2
Restriction/dependence on weather conditions B.6 -1.5
Incentives to diversify economy D.3 2 Design of new equipment (vessels to observe sea floor) B.4 -1.25
Regional legislation focused on conservation and management of natural resources D.5 2
Financial incentive systems D.3 1.5 Need to reduce tourist pressure on the coast D.6 1.5
DRIVERS average score 2.15 BARRIERS average score -2.19 MU POTENTIAL -0.02
Version 1.1
Page 29
ADDED VALUES = positive effects of MU IMPACTS = negative effects of MU
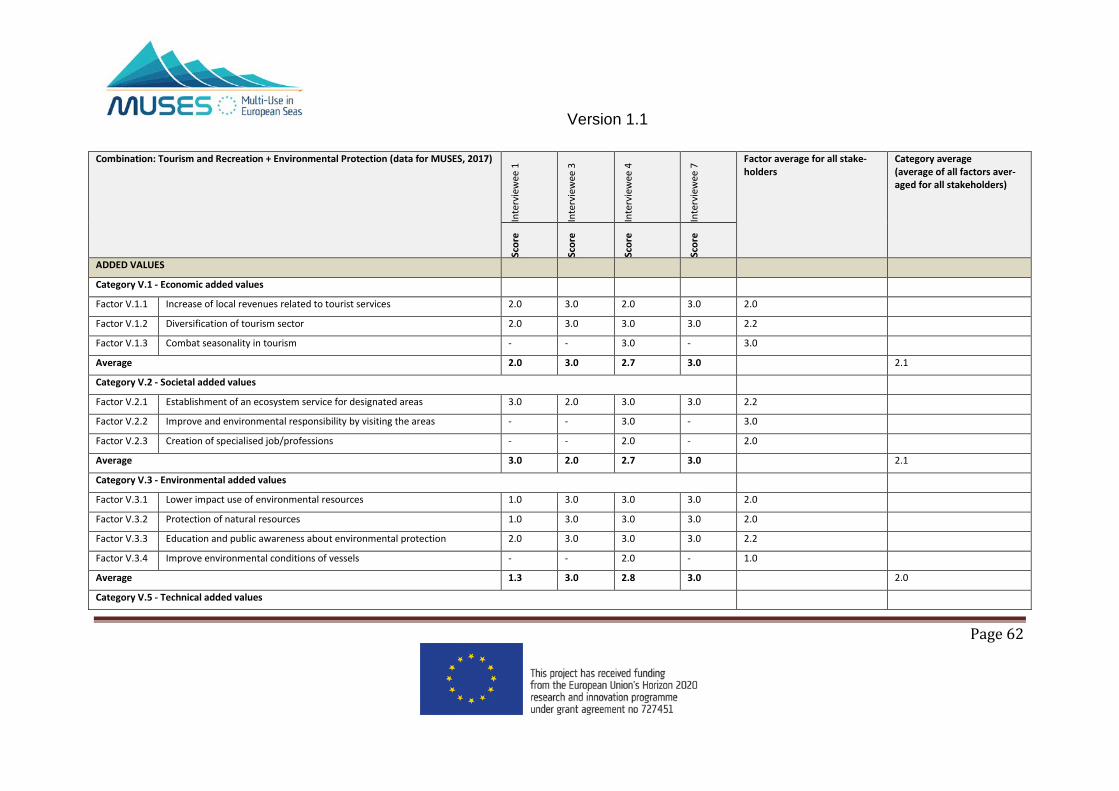
Factor Category Average score
Factor Category Average score
Combat seasonality in tourism V.1 3 Risk of congested sites might de-crease level of satisfaction of tourists
-1.8
Improve and environmental re-sponsibility by visiting the areas V.2 3
Changes in behaviour and physiology of local fauna
-1.8
Diversification of tourism sector V.1 2.2 Damage on the local natural re-sources
-1.6
Establishment of an ecosystem service for designated areas V.2 2.2
Other activities are forbidden, except scientific research with authorization
-1.4
Education and public awareness about environmental protection C.3 2.2
Increase of local revenues related to tourist services V.1 2
Creation of specialised job/professions V.2 2
Lower impact use of environmen-tal resources V.3 2
Protection of natural resources V.3 2 More frequent presence of tourists can avoid irresponsible and intru-sive access and unauthorized activ-ities V.5 1.8
Development of nautical equip-ment and vessels that enable ap-preciation V.5 1.6
Improve environmental conditions of vessels V.3 1
ADDED VALUES average score 2.1 IMPACTS average score -1.7 MU OVERALL EFFECT 0.2
Categories of drivers are very similar in average score, meaning that multiple types have similar im-portance to promote this MU, starting with legal and environmental drivers. Categories of barriers however present differences in relevance, being highlighted by barriers related with economic as-pects. Added values are also diverse in nature and all have a high and similar value according to in-terviewees as well as impacts, where social impacts are highlighted (Table 12).
Version 1.1
Page 30
Table 12 Scored DABI per category: MU Tourism and Recreation + Environmental Protection (data for MUSES, 2017)
DRIVERS = factors promoting MU BARRIERS = factors hindering MU
Category Average score Category Average score Category D5. -Legal drivers
1.8 Category B.3 - Barriers related with eco-nomic availability / risk
-3
Category D.6 -Environmental drivers
1.8 Category B.1 - Legal barriers -2.1
Category D.3 - Economic drivers 1.7 Category B.5 - Barriers related with social factors
-2
Category D.1 - Policy drivers 1.6 Category B.6 - Barriers related with envi-ronmental factors
-1.5
Category D.2 – Interactions with other uses
1.6 Category B.4 - Barriers related with tech-nical capacity
-1.4
ADDED VALUES = positive effects of MU IMPACTS = negative effects of MU
Category Average score Category Average score Category V.1 - Economic added values 2.1 Category I.2. - Social impacts
-1.8
Category V.2 - Societal added values
2.1 Category I.3 - Environmental impacts
-1.7
Category V.3 - Environmental added val-ues
2.0 Category I.1 - Economic impacts -1.4
Category V.5 - Technical added values
1.7
5.3 MU Fisheries + Tourism and Recreation
The MU potential and MU effect of the combination Fisheries + Tourism and Recreation is based on the analysis performed by three interviewees. The tables below present the average score of all fac-tors as well as the average score of all categories in order of importance by the average scoring. All the factors were analysed by the three stakeholders since they responded to every factor presented and did not make any additions.
The MU potential in this combination is negative (-0.3) which means that barriers are clearly per-ceived as more important than drivers in this MU, despite more drivers have been identified than barriers. This means that there are multiple and important barriers to overcome in order to increase the potential of this MU. The MU overall effect is large (0.7). However, only one impact was identi-fied while many added values were evaluated. This means that stakeholders perceived this MU to have multiple positive impacts and not many negative impacts (Table 13).
Version 1.1
Page 31
Table 13 Scored DABI: MU Fisheries + Tourism and Recreation (data for MUSES, 2017)
DRIVERS = factors promoting MU BARRIERS = factors hindering MU
Factor Category Average score
Factor Category Aver-age
score Find new sources of income D.3 2.3 Need for a second Licence B.1 -2.7 Tourism growth
D.3 2.3 Need of logistic infrastructure in land (it can be a partner) B.4 -2.7
Financial incentive systems D.4 2.3
Legal aspects concerning hygiene and security of passengers on the vessel B.1 -2.3
Ensure all year activity for fisher-men and tourism
D.5 2.3
Funding schemes are decentralized (e.g. national funds are subjected to specific regional development priorities) B.1 -2.3
Increasing eco-tourism D.3 2.3
Lack of expertise to deal with tourists (e.g. language and communication skills) B.4 -2.3
Need to diversify fishing activity to maintain fishing communities’ identity D.4 2.3
Lack of expertise to develop organized economic business B.4 -2.3
Public awareness to responsible fisheries and tourism activities D.1 2.0
Lack of advertisement/publicity of the MU B.4 -2.0
Need to reduce tourist pressure on the coast D.3 2.0
Lack of on-line platform to contact the fishers B.4 -2.0
Reduction of fisheries exploitation D.1 1.3
Current degradation of marine resources might impair the activity B.6 -2.0
Strategic measures for fisheries sector with the aim to diversify fishing activity with tourism D.1 1.3
Restriction/dependence on fishing ban periods B.6 -2.0
Low potential for fisheries’ growth D.2 1.3
Restriction/dependence on weather conditions B.6 -2.0
Dedicated regional funds specific for pesca-tourism activity
D.1 1.0
Lack of adequate funding for start-up activity (e.g. buy material for ensuring security or pay a second Licence and in-surances) B.3 -1.7
“European Maritime and Fisheries Fund (EMFF)” for 2014-2020 has an aim of diversify fishing activity D.1 0.7
Resistance to change in small fishing communities B.5 -1.7
High number of maritime activities in the area – need to limit conflicts D.2 0.3
Risks on board (e.g., fall during recover-ing gear) B.5 -1.7
Limitation (e.g. quotas, closed sea-sons and not allowed areas) in fisheries activities D.1 0.3 Concurrence from other tourism sectors B.3 -1.3 Licence is issued in short time D.5 0.3 National legislation focused on pesca-tourism
D.5 0.3
Regional legislation focused on pesca-tourism
D.5 0.3
Licence’s process for pesca-tourism is similar to the process for commercial fishery
D.5 0.3
DRIVERS average score 1.5 BARRIERS average score -2.1 MU POTENTIAL -0.3
Version 1.1
Page 32
ADDED VALUES = positive effects of MU IMPACTS = negative effects of MU
Factor Category Average score
Factor Category Average score
Development of new market op-portunities for both traditional fisheries and tourism (e.g. integra-tive income for fishers) V.1 3.0
Concurrence for other tourism sectors (e.g. whale watching and recreational fishing)
I.1 -1.3
Conservation of traditional fisher-ies and their culture V.2 3.0
Education and public awareness about state and issues of fisheries, as well as fisher culture V.2 3.0
Opportunity for tourists to present a high degree of satisfaction (e.g. Sardinia – Italy) V.2 3.0
Increase of local economy V.1 2.7 Extension of income season for both tourism and fisheries V.1 2.7
Involving fisher’s family to help onshore V.2 2.7
Education and public awareness about state and issues of marine environment V.3 2.7
More sustainable than the single use of traditional fisheries because there is a limited catch V.3 2.7
Improvement of technical skills (e.g. fishers become tourist actors) V.5 2.7
Diversification of tourism sector V.1 2.3 Promotion of seafood diet V.2 2.3 Reduction of tourists in the coast (e.g. traditional beach tourism) V.3 2.3
ADDED VALUES average score 2.7 IMPACTS average score -1.3 MU OVERALL EFFECT 0.7
There are multiple categories of drivers but they highlight economic, societal and environmental drivers as the most important. Barriers are also diverse in nature and with an approximately similar value, with legal barriers standing out. Added values are all very relevant and with a similar score, while impacts are scarce in nature (Table 14).
Version 1.1
Page 33
Table 14 Scored DABI per category: MU Fisheries + Tourism and Recreation (data for MUSES, 2017)
DRIVERS = factors promoting MU BARRIERS = factors hindering MU
Category Average score Category Average score Category D.3 - Economic drivers 1.8 Category B.1 - Legal barriers -1.8 Category D.4 - Societal drivers 1.8 Category B.4 - Barriers related with tech-
nical capacity -1.7
Category D.5 - Environmental drivers
1.8 Category B.6 - Barriers related with envi-ronmental factors
-1.5
Category D.1 - Policy drivers 1.1 Category B.5 - Barriers related with social factors
-1.3
Category D.2 - Relation with other uses
1.0 Category B.3 - Barriers related with eco-nomic availability / risk
-1.1
Category D.5 - Legal drivers
0.3
ADDED VALUES = positive effects of MU IMPACTS = negative effects of MU
Category Average score Category Average score Category V.2 - Societal added values
This analysis is focused on certain characterizing elements of the case-study, with the purpose to identify the needs for developing MU, impacts (both negative, positive and cumulative), barriers and enablers, and actions to overcome barriers and max synergies. Answers to the following questions are based on stakeholder engagement and desk research and these are divided into three focus are-as. The analysis of focus areas included the qualitative data analysis through MAXQDA software. More details about the stakeholder engagement methodology are included in Section 7.1 (Subsec-tion Engagement Method).
6.1 Focus-Area-1 "Addressing Multi-Use"
The first focus area analyses MU development potentialities with the main objective of identifying and evaluating possibilities for (additional) MU development, ways to overcome barriers, to mini-mise limitations and maximise synergies.
1. Is it possible to establish / widen / strengthen MU in the case study area? (Y/N)
Since MUs in the Algarve are not developed to a large extent, there is much ground to develop and widen MU. The stakeholder engagement phase of MUSES in this region and in Portugal, and the out-comes of the present case-study, will be very relevant for raising awareness on the benefits of MU among stakeholders. MU involving traditional sectors like fisheries and aquaculture, besides tourism as the economic driver of the region, and outstanding “sectors” such as environmental protection or UCH have multiple possibilities concerning MU in the present and near future.
2. Is space availability an issue for MU development / strengthening in the case study area at pre-sent? (Y/N) Will space availability become an issue for your area in the future? (Y/N) For what el-ements space availability is / could become an issue?
Currently, space availability in the Algarve is not an issue for the development of MU in general terms. However, some interviewees identified that this may be an issue (Figure 8) in the near future and even currently in specific locations where the intensification of activities and the increase in tourism and recreational activities started to create conflicts with traditional users of the sea like fishers. Plans set out from MSP may be the solution to combat these conflicts in the future.
Figure 7 MAXQDA analysis for KEQ 2 of Focus-Area-1 (data for MUSES, 2017)
3. Are there MUs combinations and potentials that will share the same resources but in different times (e.g. reuse of an infrastructure after the end of its first life and original scope)? (Y/N) What are they?
Version 1.1
Page 35
MUs are a good solution to seasonality in this region. The Algarve relies on economic activities which strongly depend on climate and environmental conditions such as tourism or fisheries. These activi-ties present high, medium and low seasons throughout the year, meaning that activities as well as the resources they use reflect peaks in activity and other periods of low performance where re-sources are underused. MUs such as pesca-tourism combat seasonality and make use of resources in times where they are underused for their primary activity, fisheries.
4. What would be the most important resources to be shared between uses (infrastructures, ser-vices, personnel, etc.)?
Human resources and infrastructures are the most important resources to share in the context of the Algarve. Services and equipment are also relevant in this regard (Figure 9).
Figure 8 MAXQDA analysis for KEQ 4 of Focus-Area-1 (data for MUSES, 2017)
5. Are existing and/or potential MUs taken into account within the existing or under development Maritime Spatial Plans? (Y/N)
There are no specific references to cases where MU have been taking into account in MSP plans. In-deed, the Portuguese Situation Plan includes the mapping of maritime uses and activities but does not cover MU explicitly. The positive reply to this question by interviewees shows the importance of addressing MU in MSP plans in the future.
6. How are MUs connected or related to land-based activities?
MU including tourism and recreation have extensive needs of land-based infrastructures and instal-lations. The needed services that tourism demands make this activity and consecutively the MU in-tegrating it to be largely depending on land-based infrastructures, especially in the Algarve where this activity is the main economic driver.
7. Is the needed knowledge and technology for MU development/strengthening in the case study area already available? (Y/N) What is the level of maturity of available knowledge? What is the level of readiness of available technology? Are there still research needs? (Y/N)
Knowledge and technology to develop MU is available in a general way but is not extensively used. Promotion and dissemination of these, especially technologies and techniques, needs to be further developed. There is a need for further research, pilot projects and testing sites as well as dissemina-tion of good practises.
Version 1.1
Page 36
8. What action(s) would you recommend to develop / widen / strengthen MU in the case study ar-ea? What actor(s) do you see particularly important to develop / widen / strengthen MU in the case study area?
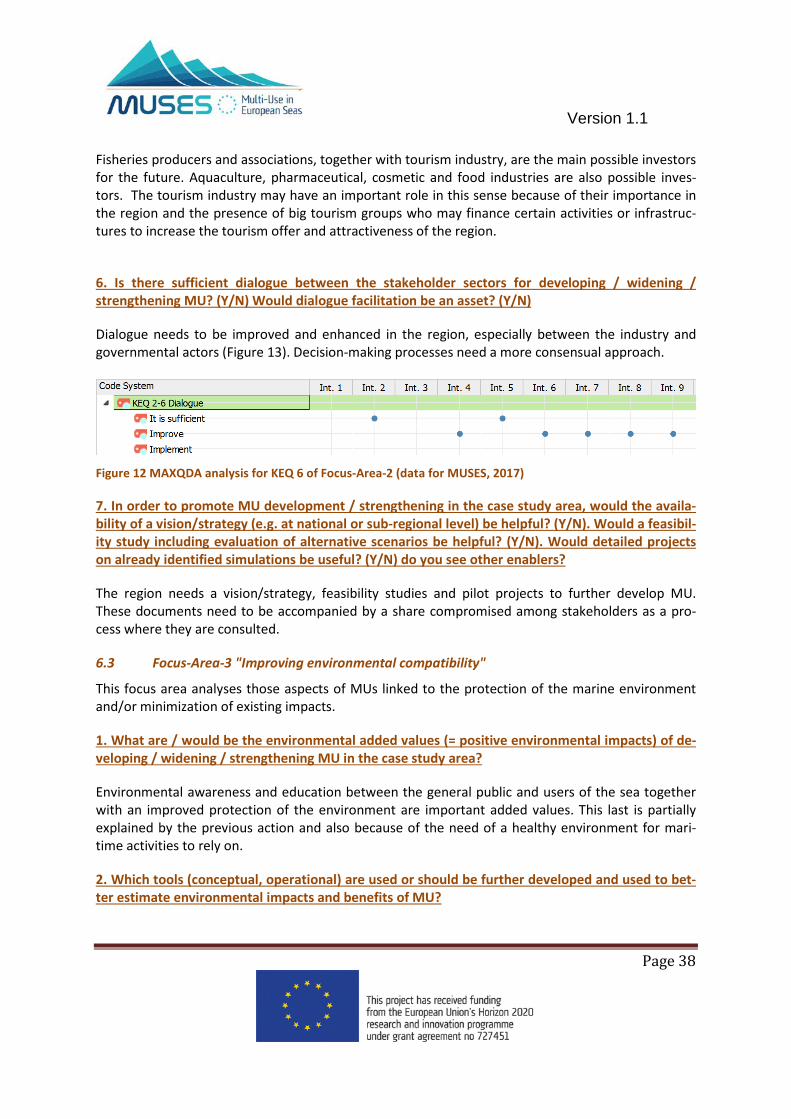
There is a need of a legal framework to strengthen MU in the region, as well as strategic lines and licensing procedures (Figure 10). In this frame, one of the possible actions is the formulation of spe-cific legislation for the pesca-tourism activity, as made by the Regional Government of the Azores. Also, establishing a proper MSP system was indicated as a way to widen MU. Improving communica-tion as well as technical resources and changing attitudes are also seen as actions of importance. These actions highlights the need of getting both policy-makers/regulators and industry together to invest more resources in communication, dissemination and technology to further develop MU.
Figure 9 MAXQDA analysis for KEQ 8 of Focus-Area-1 (data for MUSES, 2017)
Fisheries, aquaculture, and tourism & recreation industries and associations are important promot-ers of MU in the region. Policy-makers and regulators, especially the Regional Development and Co-ordination Commission of the Algarve (“CCDR Algarve”) as well as others such as DGRM, DGPM, APPA, ICNF, Captaincy or the Navy are relevant stakeholders in decision-making.
6.2 Focus-Area-2 "Boosting Maritime Blue Economy"
This Focus Area analyses those aspects of MUs strictly linked to the development of maritime econ-omy.
1. Do you see added values for society and economy at large and/or for local communities of de-veloping / widening / strengthening MU in the case study area? (Y/N). What are the most im-portant ones?
The most important benefit is that MUs serve as an alternative income for the population. This is the case of fishers who may live from alternative activities such as pesca-tourism in bad periods for the fishing activity for example. Other benefits for the local society and economy are related to public awareness and valuation of traditional activities. The MU of pesca-tourism helps to better under-
Version 1.1
Page 37
stand and valuate traditional activities which have a long history and are part of the culture. Public awareness is also enhanced when MUs include environmental protection or UCH (Figure 11).
Figure 10 MAXQDA analysis for KEQ 1 of Focus-Area-2 (data for MUSES, 2017)
2. Is it possible to quantify the socio-economic benefits related to MUs and how they (could) con-tribute to the sea economy at local and regional/national scale? (Y/N) What tools, knowledge, ex-periences are available?
Quantifying the socio-economic benefits of MU is possible, but there are difficulties due to lack of reliable data. Employment and education statistics, maritime economy studies (e.g. GAL Pesca) or the mapping of fishing grounds and other uses constitute available resources for this purpose. Map-ping tools such as GIS or data gathering tools too.
3. Would MU development / strengthening be an opportunity for job creation and / or job requali-fication in your area? (Y/N)
MU would be an opportunity to create new jobs directly. The importance of having alternative in-comes and combating certain activities’ seasonality is very relevant in the Algarve context (Figure 12).
Figure 11 MAXQDA analysis for KEQ 3 of Focus-Area-2 (data for MUSES, 2017)
4. Do you see possible elements of attractiveness for investors in developing / widening / strengthening MU in the case study area? (Y/N) What are these elements?
The case-study area possesses attractive elements for investors develop MU. The nature of the region, together with the culture of traditional maritime activities such as fisheries, fish farming or mari-culture, are some of the elements which may attract potential investors.
5. What are possible investors interested in developing / widening / strengthening MU in the case study area?
Version 1.1
Page 38
Fisheries producers and associations, together with tourism industry, are the main possible investors for the future. Aquaculture, pharmaceutical, cosmetic and food industries are also possible inves-tors. The tourism industry may have an important role in this sense because of their importance in the region and the presence of big tourism groups who may finance certain activities or infrastruc-tures to increase the tourism offer and attractiveness of the region.
6. Is there sufficient dialogue between the stakeholder sectors for developing / widening / strengthening MU? (Y/N) Would dialogue facilitation be an asset? (Y/N)
Dialogue needs to be improved and enhanced in the region, especially between the industry and governmental actors (Figure 13). Decision-making processes need a more consensual approach.
Figure 12 MAXQDA analysis for KEQ 6 of Focus-Area-2 (data for MUSES, 2017)
7. In order to promote MU development / strengthening in the case study area, would the availa-bility of a vision/strategy (e.g. at national or sub-regional level) be helpful? (Y/N). Would a feasibil-ity study including evaluation of alternative scenarios be helpful? (Y/N). Would detailed projects on already identified simulations be useful? (Y/N) do you see other enablers?
The region needs a vision/strategy, feasibility studies and pilot projects to further develop MU. These documents need to be accompanied by a share compromised among stakeholders as a pro-cess where they are consulted.
This focus area analyses those aspects of MUs linked to the protection of the marine environment and/or minimization of existing impacts.
1. What are / would be the environmental added values (= positive environmental impacts) of de-veloping / widening / strengthening MU in the case study area?
Environmental awareness and education between the general public and users of the sea together with an improved protection of the environment are important added values. This last is partially explained by the previous action and also because of the need of a healthy environment for mari-time activities to rely on.
2. Which tools (conceptual, operational) are used or should be further developed and used to bet-ter estimate environmental impacts and benefits of MU?
Version 1.1
Page 39
The set of tools include: GIS and remote sensing to monitor impacts geographically; environmental Impact Assessment, Cost-Benefit Analysis and plans to control regular actions; indicators of envi-ronmental quality and contribution of MU to the economy; dissemination of good practices.
3. Is saving free sea space for nature conservation a driver for MU the case study area? (Y/N). Are there evidences about the present and future benefits of reserving free sea space? (Y/N). What are they?
Saving free space for nature conservation is a driver for MU. Environmental protection is indeed one of the more relevant “uses” for this region and its current and potential MU. Some of the evidences of these are ecosystem services such as ecological functions (e.g. CO2 sequestration), species (e.g. beneficiating fisheries, biotech), and habitats or landscapes (e.g. beneficiating tourism). The promo-tion of artificial reefs is important evidence too (Figure 14).
Figure 13 MAXQDA analysis for KEQ 3 of Focus-Area-3 (data for MUSES, 2017)
4. What practical actions would you undertake to link MU development / widening / strengthen-ing to improved environmental compatibility of maritime activities?
Environmental awareness action among stakeholders and the general public would be the most im-portant practical action (Figure 15). This includes promoting education, communication and training about benefits of MU for the environment, promoting good practises and pilot projects (especially for the interaction of fisheries and tourism with the environment) or improving dialogue between sectors to apply eco-friendly techniques and share knowledge. A strategic, legal and licensing framework is also seen as very relevant. In this regard, applying an ecosystem-based approach for the sustainable development of activities and promoting environmental impact assessment and ma-rine planning would help to this purpose. Promoting the knowledge and scientific research need also be taken into account.
Figure 14 MAXQDA analysis for KEQ 4 of Focus-Area-3 (data for MUSES, 2017)
5. Are there win-win solutions triggering both socio-economic development and environmental protection already available for the case study area that MU should take up? (Y/N) What are they?
Version 1.1
Page 40
Yes. Experiences such as the deployment of vessels in the Ocean Revival project to attract divers and tourism, while creating artificial reefs, constitutes an outstanding example of a win-win solution.
6. Is the environmentally friendly knowledge / technology for MU development/strengthening in the case study area available? (Y/N). Which is the level of readiness of available solutions? Are there still research needs on blue/green technologies for MU? (Y/N)
Yes, environmentally friendly knowledge and technology in the Algarve is partially available to de-velop MU. However, there is an important need for research in blue (especially) and green technolo-gy since maritime activities in the Algarve do not have a strong technology component in a general way. Funding of technology and research, together with dissemination of good practises and training is needed.
7. Would it be possible to promote MU through SEA/EIA procedures? (Y/N). What modifications would you suggest at your national / local level to promote MU through SEA/EIA procedures?
Yes, promoting MU through SEA/IEA is possible. Establishing mandatory EIA for all activities at sea or creating working groups with private and public entities for the follow-up of these processes are modifications that would promote MU in this context.
Version 1.1
Page 41
7 STAKEHOLDER ENGAGEMENT AND LOCAL STAKEHOLDER PROFILES The stakeholder engagement method is described in detail in this chapter, together with the charac-terisation of stakeholders’ profile in the Algarve.
7.1 Stakeholder Engagement Methodology
Mapping of stakeholders Mapping of relevant stakeholders in the Algarve was the initial phase for the stakeholder engage-ment phase. The identification of stakeholders was based on different sources of information, name-ly from the screening of past and on-going MU projects as well as MSP projects. Stakeholders in-volved in MU and MSP projects were considered of special interest to fill the gaps of knowledge on MU in the region. In addition to this, desk research highlighted new stakeholders involved in current MU. Stakeholders competent on maritime activities in general, as well as those important for the maritime economic drivers of the region, were also identified.
Invited stakeholders Nine stakeholders were selected to be invited to participate in the engagement phase. The selected stakeholders present a balance among maritime sectors, being representatives of important mari-time activities of the region: fisheries, aquaculture, tourism, environmental protection, oil & gas and of cross-cutting nature. Furthermore, they were sorted in terms of stakeholders’ categories: regula-tors, commercial business, research organisations and clusters or associations. Preference on regula-tors was given instead of policy-makers in the case of the Algarve. The governmental system of Por-tugal centralises most of the competences in the national administration. However, the implementa-tion of certain policies is administered by regulators at the regional or local level, who were the tar-get of the interviews in order to collect their regional-local knowledge. Nevertheless, most of the stakeholders invited were commercial businesses from different sectors because of their current or potential involvement in MU. Figure 16 shows the number of planned and performed interviews from stakeholder category. All the invited stakeholders accepted the invitation to participate in MUSES.
Version 1.1
Page 42
Figure 15 Number of planned and performed interviews (data for MUSES, 2017)
Engagement method
Interviews were selected as the preferable engagement method for this case-study because they are recognised as an excellent method of gaining access to information about experiences and opinions and help to fill the gaps in knowledge that other methods are unable to bridge (Dunn, 2005). As Pomeroy and Douvere (2008) states, conducting interviews is a comprehensive and efficient manner to collect data on stakeholders and their attributes, being the participatory research approach and working method most commonly used in the field of stakeholder analysis.
The method consisted of individual structured interviews supported by MUSES case-study sheets and documents, which were adapted to the context of the Algarve and the case-study objectives. Sheets and documents supporting interviews different from the sheets provided by MUSES are pre-sented in APPENDIX 2. Interviews consisted of the following steps:
i. Presentation: the MUSES project was presented to the interviewee as well as the infor-mation about their participation in the project. The MUSES leaflet and the Participant Infor-mation Sheet were used in this step.
ii. Participation forms: interviewees filled the consent form of participation and the General In-terviewee Information Sheet, to be able to participate and to gain general information about the interviewee.
iii. Multi-Uses: interviewees were asked about current and potential MUs in the case-study ar-ea, their description and respective location. The definition of MU was previously provided to make sure they understand the MU concept of MUSES. Sheets with the list of MUs as well as a map of the case-study area supported this step (see APPENDIX 2).
iv. DABI factors: interviewees were asked to analyse one or several MUs in detail and evaluate, add, discard and validate DABIs for the selected MU. Sheets of DABI factors per MU are pre-compiled to support this step (see example in APPENDIX 2)
v. Research questions: interviewees are asked to discuss several KEQs regarding the general MU context in the case-study area. A sheet with the research questions is provided (see APPENDIX 2).
Interviews were completed in two rounds, the first during the month of July (four stakeholders in-terviewed) and the second in September (five stakeholders interviewed). Most of the interviews were conducted in Portuguese, except for two that were held in English.
The engagement phase included the following steps during and after the interviews:
i. Recording: interviews were recorded with a recording device; ii. Notes: taken during and immediately after the interview to express the impressions and the
most important points covered; iii. Transcription: interviews are transcribed from the recordings and notes taken; iv. Analysis: Transcriptions are subject to qualitative data analysis with MAXQDA software. v. Interpretation: reducing data collected to relevant information for case-study goals;
vi. Reporting: integrating the relevant information obtained in the report.
Version 1.1
Page 43
Level of anonymity
According to WP6 (Ethics), all stakeholders were required to sign a consent form where the level of anonymity wished to keep was registered. Most stakeholders allowed to be identified in research data to be shared publicly and identified as contributors in reports and other documents, and also gave permission when referring to quotations and citations (Figure 17). References to stakeholders in the present report are made according to stakeholders’ desires.
Figure 16 Level of anonymity required by stakeholders (data for MUSES, 2017)
7.2 Stakeholder Profile
This section provides an overarching view of the stakeholder profiles of the three most relevant combinations in the Algarve. The elaboration of the stakeholder profiles is based on the knowledge gained by the stakeholder engagement phase and desk research. Local stakeholder profiles are compiled by themes or sectors and categories of stakeholders (i.e. commercial Business or regula-tors). Information is provided concerning the following themes: overall interest in MU; overall atti-tude towards MU; geographical scale at which stakeholder has the powers to operate; organisation of stakeholders; level of power; and type of power to influence.
7.2.1 MU Aquaculture + Tourism and Recreation
Overall activity of relevant stakeholders in relation to the MU Generally, aquaculture and tourism businesses in Algarve have a reactive interest in MU as they ac-cepted the invitation to participate in MUSES. One of the aquaculture businesses has a proactive in-terest because it currently participates in MU projects and contributes to its promotion in the re-gion. Tourism and cross-cutting regulators also show a reactive interest. Regional research organisa-tions are proactive in this regard, being also involved in MU as well as MSP projects. Cross-cutting
8
8
7
9
9
1
1
2
0
0
0
0
0% 50% 100%
I may be identified in research data which is sharedpublically
I may be identified as a contributor in reports,publications, written web material, photographs…
My words may be quoted and attributed to me
My words may be quoted without attribution tome
I would like to receive information on the MUSESProject
Yes No Not answered
Version 1.1
Page 44
intermediaries are also reactive. Overall attitude towards MU Commercial businesss, both from the aquaculture and tourism sectors, demonstrates a positive atti-tude towards MU in a general way. Regional regulators, research organisations and intermediaries also have a positive attitude and are driving forces towards MU. However, the role of aquaculture commercial business that are currently researching or implementing MU is especially important in the demonstration of the benefits of MU for the rest of regional stakeholders. Geographical scale at which certain stakeholder has the power Cross-cutting and tourism regulators have a regional or even sub-regional geographical scale imple-menting policies and strategies of the policy-makers, who have a national geographical scale. Com-mercial businesses have a strong local component that barely goes beyond their respective loca-tions. Although some of them belong to large companies, the subsidiary company has a more local or regional scale. Intermediaries also have a regional scale, representing all maritime businesses in the region. Organization of stakeholders Aquaculture businesses are few in the region, while tourism businesses are many because this sector is the main regional economic driver. There are several cross-cutting regulators although the tourism regulator has a majority in the region. This is also the case for the intermediary cluster. Research or-ganisations are few at the regional level. Type of power Commercial businesses have the power to influence indirectly through regional regulators and clus-ters. Regional regulators have the power to control the implementation of policies and regulate funding for businesses while clusters have the power to influence more directly on regulators and policy-makers, representing the industry interest. Research organisation has power to influence di-rectly in this regional context where they are recognised as outstanding institutions. Level of Power Many of the aquaculture businesses and tourism companies are SMEs with a low level of power (alt-hough big group tourism is also present in the region). Clusters are also considered to have low power because they still not have a strong level of organisation or clustering. Regional regulators have medium power because they have certain control on decision-making but not much on policy-making. Research organisations also have low power.
7.2.2 MU Tourism and Recreation + Environmental Protection
Overall activity of relevant stakeholders in relation to the MU As mentioned before, tourism businesses have a reactive interest in MU as they accepted the invita-tion to participate in MUSES. Tourism and cross-cutting regulators and intermediaries also showed a reactive interest. Research organisations are proactive in this regard, being also involved in MU as well as MSP projects.
Version 1.1
Page 45
Overall attitude towards MU Tourism commercial businesses have positive attitude towards MU in a general way. Regional regu-lators and intermediaries also have a positive attitude. Research organisations have an important role in environmental protection in the region, being positive and driving forces for MU. Geographical scale at which certain stakeholder has the power Research organisations have a strong regional component although they are part of the national re-search system. Small and medium tourism commercial businesses have a local or regional scale in general. Cross-cutting and tourism regulators have a regional or even sub-regional geographical scale. Intermediaries also have a regional scale, representing all maritime businesses in the region. Organization of stakeholders Tourism businesses are numerous as tourism is the main economic sector in the region. Cross-cutting regulators are several although the tourism regulator exercises monopoly in the region. Simi-lar is the case of the intermediary cluster. Research organisations are a few at the regional level. Type of power Tourism commercial businesses have the power to influence indirectly through regional regulators and clusters. Research organisation has power to influence directly in this regional context where they are recognised as outstanding institutions and consulted frequently. Level of Power Many of the tourism companies are small and medium enterprises with low level of power (big groups are also present). Clusters are also considered to have low power because they still not have a strong level of clustering. Regional regulators have medium power because they have certain con-trol on decision-making. Research organisations also have low power in a general way.
7.2.3 MU Fisheries + Tourism and Recreation
Overall activity of relevant stakeholders in relation to the MU Fisheries and tourism businesses have a reactive interest in MU as they accepted the invitation to participate in MUSES as well as regulators and intermediaries. Research organisations are proactive because they are involved in MU and MSP projects. Overall attitude towards MU Generally commercial businesses have positive attitudes and are the driving forces for MU, together with research organisations. Regional regulators and intermediaries also have a positive attitude in a general way and could have a more important role in promoting MU. Geographical scale at which certain stakeholder has the power Small and medium fisheries and tourism commercial businesses have a local or regional scale in gen-eral. Regulators have a regional or even sub-regional geographical scale as well as Intermediaries. Research organisations have a strong regional component although they are part of the national re-search system.
Version 1.1
Page 46
Organization of stakeholders Fisheries and tourism businesses are numerous as both sectors are very important in terms of em-ployment and activity. Cross-cutting regulators are several although the tourism regulator exercises monopoly in the region. Similar is the case of the intermediary cluster. Research organisations are a few at the regional level. Type of power Tourism and fisheries commercial businesses have the power to influence indirectly through regional regulators and clusters. Research organisation has power to influence directly in this regional con-text where they are positively valued. Level of Power Fisheries and tourism companies have low level of power in general. Clusters are also considered to have low power because they still not have a strong level of clustering. Regional regulators have medium power because they have certain control on decision-making. Research organisations also have low power in a general way.
Version 1.1
Page 47
8 CONCLUSIONS AND RECOMMENDATIONS TO THE ACTION PLAN
The Algarve has not developed MU’s to a large extent. This is mainly explained by the fact that MU is a new concept for most of the maritime stakeholders in Portugal. Portugal does not have a general context for MU. The existing MUs arose primarily from opportunities to develop joint activities (Vergílio et al., 2017). Thus, MUs currently involve traditional activities such as fisheries, aquaculture or fish farming, besides tourism which is the main economic driver of the region. These activities are combined or present synergies between them and with outstanding “sectors” such as environmental protection, UCH or scientific research. The recent promotion of a more technological offshore aqua-culture by the Portuguese Government and the predictable future investments on marine renewa-bles (e.g. tidal energy is currently being tested) creates a ground for further development and widen-ing of MU. However, the regional socio-economic context of the Algarve, dominated by the tourism sector, which relies on a healthy and favoured environment, needs to be taken into account. The at-tempts of the oil & gas industry to develop activities in the area have been largely contested by the economic actors and the society. Similar experiences may happen with activities seen as risky or po-tentially harmful for the environment and the general economy. Given this context, one of the main MUs with potential in the near future is Fisheries + Tourism and Recreation. This combination, de-spite being already in place, does not have a specific legislation regulating the pesca-tourism activity, which constitutes a barrier for its development. However, regional stakeholders are aware on the advances of the legislation in the Azorean context, meaning that a similar legal framework may be demanded soon. MU Aquaculture + Tourism and Recreation is also one of the most promising com-binations for the future, given the experience currently in place of Tunipex/Tuna Dive Tours. Other MU combinations related to the aquaculture activity may arise in the future since there are incen-tives to develop this activity. Marine renewable energies might be one of the activities to be com-bined with aquaculture, due the promotion of offshore aquaculture, whose platforms might be used to test energy devices. Finally, the MU UCH + Tourism + Environmental Protection has a strong po-tential which has already been explored in sites like the Ocean Revival project. The strategy of diver-sification of the tourism sector promotes recreational activities and other types of tourism like the one present in this combination.
There are many actions that could contribute to enhancing and widening MU in the region. The crea-tion of a general legal framework or a strategy for MU, facilitating licensing for joint activities or pro-cesses of risk assessment is a fundamental one. Besides the development of a legal and administra-tive context, which strongly rely on political will, there are simpler actions that may be undertaken to promote MU among stakeholders such as the promotion of pilot projects and testing sites and scientific research, dissemination of successful MU practises and knowledge or providing training and capacity-building for MU. Enhancing dialogue and creating mechanism for stakeholders getting together in order to participate in decision-making is one of the most important challenges in this case. The opportunity to do so may rise in the context of the MSP process. Important actors to de-velop and implement these actions are regional regulators such as the Regional Development and CCDR Algarve, GAL Pesca Sotavento, GAL Pesca Barlavento and Turismo do Algarve, together with policy-makers at the national level such as DGRM or DGPM, who may develop the legal and adminis-trative context. The industries of fisheries, aquaculture and especially from the tourism and recrea-tion sector, are also major actors regarding the interest for developing MU and sharing experiences. Research organisations like the University of the Algarve and CCMAR and CIMA research groups may
Version 1.1
Page 48
have an important role in pilot experiences and research. Maritime clusters such as MarAlgarve may serve as a forum for dissemination of best practises and knowledge.
Version 1.1
Page 49
REFERENCES
Bocci M., Ramieri E., Castellani C., De Pellegrin D., et al. 2017. Case study methodology. MUSES pro-ject. Edinburgh.
Bolman B., Poelman M., Jak R., Nijman R., Kuijs E. 2012. Interaction in coastal waters: A roadmap to sustainable integration of aquaculture and fisheries. Ireland: COEXIST project, 2013, 83pp.
Claus S., N. De Hauwere, B. Vanhoorne, F. Souza Dias, P. Oset García, F. Hernandez, and J. Mees (Flanders Marine Institute). 2017. MarineRegions.org. http://www.marineregions.org [01 November 2017]
DGPM .2017a. The POEM Framework Documents – Dissemination of the Maritime Spatial Planning Plan [in Portuguese]. Portugal: Ministério da Agricultura, Mar, Ambiente e Ordenamento do Território – Direção-Geral da Política do Mar. https://www.dgpm.mm.gov.pt/ordenamento-e-maritimo [20 September 2017]
DGPM. 2017b. Fundo Azul. Direção-Geral da Política do Mar. https://www.dgpm.mm.gov.pt/fundo-azul-anuncios [16 October 2017]
Dunn K. 2005. Interviewing. Ch.6 p79-105 in Hay, I (ed): Qualitative research methods in human ge-ography. 2nd Ed. Oxford University Press; UK.
European Commission. 2017. Algarve Region of Portugal. https://ec.europa.eu/growth/tools-databases/regional-innovation-monitor/base-profile/algarve-region-portugal-0 [06 November 2017]
Guedes Soares C. and Santos T.A. 2015. Maritime Technology and Engineering. London: Taylor & Francis Group.
Haponiuk, R.R. 2015. UCH and Marine Spatial Planning: An integration approach. Thesis project of the 1st Edition of the Erasmus Mundus Master Course on Marine Spatial Planning – University Iuav of Venice, University of Azores and University of Seville.
ICNF (Instituto da Conservação da Natureza e das Florestas). 2017. Informação Geral. http://www.icnf.pt/portal/turnatur/visit-ap/pn/pnsacv/inf-ger [16 November 2017]
Naves F. 2016. Ria Formosa entra para o mapa das energias marinhas. Diario de Noticias: 14 March 16.
Petiz J. and Baldaia P. 2016. Governo trava exploração de petróleo no Algarve. Diario de Noticias: 14 December 16. https://www.dn.pt/portugal/interior/governo-trava-exploracao-de-petroleo-no-algarve-5551064.html [09 November 2017]
Petrov L. O., Lavalle C., Kasankob, M. 2009. Urban land use scenarios for a tourist region in Europe: Applying the MOLAND model to Algarve, Portugal. Landscape and Urban Planning 92 (2009) 10–23.
PG. 2006. National Ocean Strategy 2006-2016 [in Portuguese]. Portugal: Ministério da Defesa Nacional, Estrutura de Missão para os Assuntos do Mar.
Version 1.1
Page 50
PG. 2013. National Ocean Strategy 2013-2020 [in Portuguese]. Portugal: Direcção-Geral de Política do Mar. Pomeroy R., Douvere F. 2008. The engagement of stakeholders in the marine spatial planning process. Marine Policy. 32: 816–822. https://doi.org/10.1016/j.marpol.2008.03.017.
PSOEM. 2017. Planning of the Maritime Space – About Situation Plan of the Maritime Spatial Planning (PSOEM). General Directorate for Natural Resources, Security and Maritime Resources. http://www.psoem.pt/sobre/. [13 October 2017]
Stelzenmüller, V., et al. 2013. Guidance on a Better Integration of Aquaculture, Fisheries, and other Activities in the Coastal Zone: From tools to practical examples. Ireland: COEXIST project, 2013, 79pp. Printed.
Strand, Ø. and Bergh, Ø. 2017. Case studies final report. AQUASPACE project, 2017, 303pp.
Tunipex. 2011. Tuna Dive Tours. http://www.tunipex.eu/pt/tuna_diving_tours.php [15 July 2017]
Turismo de Portugal. 2013. Parque Natural da Ria Formosa. https://www.visitportugal.com/en/NR/exeres/AC12D688-17AA-4F71-A1CD-50AE69B834EA [16 November 2017].
Turismo de Portugal. 2014. Plano de Marketing estratégico para o turismo do Algarve, 2015-2018. 494pp.
Turismo do Algarve. 2015. Guide to nature tourism in the Algarve. Faro: Turismo do Algarve.
Valadas-Monteiro, P. 2014. General Insights of the Portuguese Maritime Economy and Particularly of the Algarve Region: Contributing Towards a Strategic Vision. Journal of Maritime Research. Vol XI. No. I. 2014. pp 3–9.
Valadas-Monteiro P., Neto P.A., Noronha M.T. 2014. Understanding the ways and the dynamics of collaborative innovation processes: the case of the maritime cluster of the Algarve region (Portugal). Urban, Planning and Transport Research, 2:1, 247-264, DOI: 10.1080/21650020.2014.909739.
Vergílio, M.H.S.; Calado H.; Caña Varona, M. 2017. Country report: Portugal – Eastern Atlantic sea basin report. Edinburgh: MUSES project.
WTTC (World Travel and Tourism Council). 2003. The Algarve, The Impact of Travel and Tourism on Jobs and the Economy. http://www.wttc.org/.
Zaucha, J., Bocci, M., Depellegrin, D., Lukic, I., Buck, B., Schupp, M., Caña Varona, M., Buchanan, B., Kovacheva, A., Karachle, P.K., et al. 2017. Analytical Framework (AF) – Analysing Multi-Use (MU) in the European Sea Basins. Edinburgh: MUSES project.
Version 1.1
Page 51
APPENDIX 1 OVERALL DABI SCORING TABLES
MU Aquaculture + Tourism and Recreation (data for MUSES, 2017) Combination: Aquaculture + Tourism and Recreation (data for MUSES, 2017)
Inte
rvie
wee
1
Inte
rvie
wee
2
Inte
rvie
wee
3
Inte
rvie
wee
4 Factor average for all
stakeholders Category average (average of all fac-tors averaged for all stakeholders)
Scor
e
Scor
e
Scor
e
Scor
e
DRIVERS
Category D.1 - Policy drivers
Factor D.1.1 Co-location of uses recommended by strategic plans - 3.0 - 2.0 2.5
Factor D.1.2 Dedicated regional funds specific for the activity 1.0 - 0.0 - 0.5
Factor D.1.3 “European Maritime and Fisheries Fund (EMFF)” for 2014-2020 has an aim of diversify the activity
2.0 - 2.0 - 2.0
Factor D.1.4 Strategic measures with the aim to diversify the activity with tourism 0.0 - 3.0 - 1.5
Factor D.1.5 Limitation (e.g. quotas, closed seasons and not allowed areas) 1.0 - 3.0 - 2.0
Average 1.0 3.0 2.0 2.0 1.6
Category D.2 - Relation with other uses
Factor D.2.1 Tourism growth - 2.0 - 2.0 2.0
Factor D.2.2 Competition for space - 3.0 - 3.0 3.0
Factor D.2.3 High number of maritime activities in the area – need to limit conflicts 0.0 0.0 0.0
Average 0.0 2.5 0.0 2.5 1.0
Category D.3 - Economic drivers
Version 1.1
Page 52
Combination: Aquaculture + Tourism and Recreation (data for MUSES, 2017)
Inte
rvie
wee
1
Inte
rvie
wee
2
Inte
rvie
wee
3
Inte
rvie
wee
4 Factor average for all
stakeholders Category average (average of all fac-tors averaged for all stakeholders)
Scor
e
Scor
e
Scor
e
Scor
e
DRIVERS
Factor D.3.1 Financial incentive systems 1.0 2.0 3.0 3.0 2.3
Combination: Aquaculture + Tourism and Recreation (data for MUSES, 2017)
Inte
rvie
wee
1
Inte
rvie
wee
2
Inte
rvie
wee
3
Inte
rvie
wee
4 Factor average for all
stakeholders Category average (average of all fac-tors averaged for all stakeholders)
Scor
e
Scor
e
Scor
e
Scor
e
NEGATIVE IMPACTS
Category I.1- Economic impacts
Factor I.1.1 Concurrence for other tourism sectors (e.g. whale watching and recreational fishing) 0.0 - -1.0 - -0.3
Average 0.0 - -1.0 - -0.3
Category I.3 - Environmental impacts
Factor I.3.1 Multiplication of cumulative impacts if tourism is too intensive - -1.0 - -3.0 -2.0
Average - -1.0 - -3.0 -1.3
Version 1.1
Page 60
MU Tourism and Recreation + Environmental Protection (data for MUSES, 2017) Combination: Tourism and Recreation + Environmental Protection (data for MUSES, 2017)
Inte
rvie
wee
1
Inte
rvie
wee
3
Inte
rvie
wee
4
Inte
rvie
wee
7 Factor average for all stake-
holders Category average (average of all factors aver-aged for all stakeholders)
Scor
e
Scor
e
Scor
e
Scor
e
DRIVERS
Category D.1 - Policy drivers
Factor D.1.1 Strategic plan that promotes sustainable tourism and environmental con-servation
2.0 3.0 2.0 1.0 2.0
Average 2.0 3.0 2.0 1.0 1.6
Category D.2 - Interactions with other uses
Factor D.2.1 Multiple synergies between tourism and environmental protection 2.0 2.0 3.0 1.0 2.0
Average 2.0 2.0 3.0 1.0 1.6
Category D.3 - Economic drivers
Factor D.3.1 Financial incentive systems 1.0 1.0 2.0 2.0 1.5
Factor D.5.3 Licence is issued in short time 0.0 2.0 0.0 0.7
Factor D.5.4 Licence’s process for Pescatourism is similar to the process for commercial fishery 0.0 1.0 0.0 0.3
Average 0.0 1.3 0.0 0.3
Category D.5 - Environmental drivers
Factor D.5.1 Public awareness to responsible fisheries and tourism activities 2.0 2.0 3.0 2.3
Factor D.5.2 Need to reduce tourist pressure on the coast 2.0 2.0 3.0 2.3
Factor D.5.3 Reduction of fisheries exploitation 3.0 2.0 2.0 2.3
Average 2.3 2.0 2.7 1.8
Version 1.1
Page 69
Combination: Fisheries + Tourism and Recreation (data for MUSES, 2017)
Inte
rvie
wee
5
Inte
rvie
wee
7
Inte
rvie
wee
8
Factor average for all stakehold-ers
Category average (average of all factors aver-aged for all stakeholders)
Scor
e
Scor
e
Scor
e
ADDED VALUES
Category V.1 - Economic added values
Factor V.1.1 Increase of local economy 3.0 3.0 2.0 2.7
Factor V.1.2 Development of new market opportunities for both traditional fisheries and tour-ism (e.g. integrative income for fishers)
3.0 3.0 3.0 3.0
Factor V.1.3 Extension of income season for both tourism and fisheries 3.0 3.0 2.0 2.7
Factor V.1.4 Diversification of tourism sector 3.0 2.0 2.0 2.3
Average 3.0 2.8 2.3 2.0
Category V.2 - Societal added values
Factor V.2.1 Involving fisher’s family to help onshore 3.0 3.0 2.0 2.7
Factor V.2.2 Conservation of traditional fisheries and their culture 3.0 3.0 3.0 3.0
Factor V.2.3 Education and public awareness about state and issues of fisheries, as well as fisher culture
3.0 3.0 3.0 3.0
Factor V.2.4 Promotion of seafood diet 3.0 2.0 2.0 2.3
Factor V.2.5 opportunity for tourists to present a high degree of satisfaction (e.g. Sardinia – Italy)
3.0 3.0 3.0 3.0
Average 3.0 2.8 2.6 2.1
Category V.3 - Environmental added values
Version 1.1
Page 70
Combination: Fisheries + Tourism and Recreation (data for MUSES, 2017)
Inte
rvie
wee
5
Inte
rvie
wee
7
Inte
rvie
wee
8
Factor average for all stakehold-ers
Category average (average of all factors aver-aged for all stakeholders)
Scor
e
Scor
e
Scor
e
ADDED VALUES
Factor C.3.1 Education and public awareness about state and issues of marine environment 3.0 2.0 3.0 2.7
Factor C.3.2 More sustainable than the single use of traditional fisheries because there is a limited catch
3.0 3.0 2.0 2.7
Factor C.3.3 Reduction of tourists in the coast (e.g. traditional beach tourism) 3.0 2.0 2.0 2.3
Average 3.0 2.3 2.3 1.9
Category V.5 - Technical added values
Factor V.5.1 Improvement of technical skills (e.g. fishers become tourist actors) 3.0 2.0 3.0 2.7
Average 3.0 2.0 3.0 2.0
Version 1.1
Page 71
Combination: Fisheries + Tourism and Recreation (data for MUSES, 2017)
Inte
rvie
wee
5
Inte
rvie
wee
7
Inte
rvie
wee
8 Factor average for all stakehold-
ers Category average (average of all factors aver-aged for all stakeholders)
Scor
e
Scor
e
Scor
e
BARRIERS
Category B.1 - Legal barriers
Factor B.1.1 Legal aspects concerning hygiene and security of passengers on the vessel -3.0 -1.0 -3.0 -2.3
Factor B.1.2 Need for a second Licence -3.0 -2.0 -3.0 -2.7
Factor B.1.3 Funding schemes are decentralized (e.g. national funds are subjected to specific regional development priorities)
-3.0 -2.0 -2.0 -2.3
Average -3.0 -1.7 -2.7 -1.8
Category B.3 - Barriers related with economic availability / risk
Factor B.3.1 Concurrence from other tourism sectors 0.0 -1.0 -3.0 -1.3
Factor B.3.2 Lack of adequate funding for start-up activity (e.g. buy material for ensuring se-curity or pay a second Licence and insurances)
0.0 -2.0 -3.0 -1.7
Average 0.0 -1.5 -3.0 -1.1
Category B.4 - Barriers related with technical capacity
Factor B.4.1 Lack of expertise to deal with tourists (e.g. language and communication skills) -2.0 -2.0 -3.0 -2.3
Factor B.4.2 Lack of expertise to develop organized economic business -2.0 -2.0 -3.0 -2.3
Factor B.4.3 Need of logistic infrastructure in land (it can be a partner) -2.0 -3.0 -3.0 -2.7
Factor B.4.4 Lack of advertisement/publicity of the MU 0.0 -3.0 -3.0 -2.0
Factor B.4.5 Lack of on-line platform to contact the fishers 0.0 -3.0 -3.0 -2.0
Average -1.2 -2.6 -3.0 -1.7
Version 1.1
Page 72
Combination: Fisheries + Tourism and Recreation (data for MUSES, 2017)
Inte
rvie
wee
5
Inte
rvie
wee
7
Inte
rvie
wee
8 Factor average for all stakehold-
ers Category average (average of all factors aver-aged for all stakeholders)
Scor
e
Scor
e
Scor
e
BARRIERS
Category B.5 - Barriers related with social factors
Factor B.5.1 Resistance to change in small fishing communities -1.0 -2.0 -2.0 -1.7
Factor B.5.2 Risks onboard (e.g., fall during recovering gear) -1.0 -2.0 -2.0 -1.7
Average -1.0 -2.0 -2.0 -1.3
Category B.6 - Barriers related with environmental factors
Factor B.6.1 Current degradation of marine resources might impair the activity -1.0 -2.0 -3.0 -2.0
Factor B.6.2 Restriction/dependence on fishing ban periods -1.0 -2.0 -3.0 -2.0
Factor B.6.3 Restriction/dependence on weather conditions -1.0 -2.0 -3.0 -2.0
Average -1.0 -2.0 -3.0 -1.5
Version 1.1
Page 73
Combination: Fisheries + Tourism and Recreation (data for MUSES, 2017)
Inte
rvie
wee
5
Inte
rvie
wee
7
Inte
rvie
wee
8 Factor average for all stakehold-
ers Category average (average of all factors aver-aged for all stakeholders)
Scor
e
Scor
e
Scor
e
NEGATIVE IMPACTS
Category I.1 - Economic impacts
Factor I.1.1 Concurrence for other tourism sectors (e.g. whale watching and recreational fish-ing)
-1.0 -2.0 -1.0 -1.3
Average -1.0 -2.0 -1.0 -1.0
Version 1.1
Page 74
MU Tourism and Recreation + UCH + Environmental Protection (data for MUSES, 2017) Combination: Tourism and Recreation + UCH + Environmental Protection (data for MUSES, 2017)
Inte
rvie
wee
3 Factor average for all stakeholders Category average
(average of all factors averaged for all stakeholders)
Scor
e
DRIVERS
Category D.2 - Relation with other uses
Factor D.2.1 Multiple synergies between UCH, tourism and environmental protection 0.0 0.0
Average 0.0 0.0
Category D.3 - Economic drivers
Factor D.3.1 Financial incentive systems 1.0 1.0
Factor D.3.2 Increasing eco-tourism 2.0 2.0
Factor D.3.3 Need to diversify tourism sectors 3.0 3.0
Factor D.3.4 Increasing number of sites of marine and UCH resources to be explored 3.0 3.0
Average 2.3 2.3
Category D.4 - Societal drivers
Factor D.4.1 Harmonize the protection of submerged heritage 3.0 3.0
Factor D.4.2 Prevent the destruction of submerged archaeological sites 3.0 3.0
Factor D.4.3 Increasing awareness for the value of cultural heritage 3.0 3.0
Average 3.0 3.0
Category D.5 - Legal drivers
Version 1.1
Page 75
Combination: Tourism and Recreation + UCH + Environmental Protection (data for MUSES, 2017)
Inte
rvie
wee
3 Factor average for all stakeholders Category average
(average of all factors averaged for all stakeholders)
Scor
e
DRIVERS
Factor D.5.1 UNESCO Convention on the Protection of the UCH 2.0 2.0
Factor D.5.2 National legislation focused on management of archaeological heritage 3.0 3.0
Factor D.5.3 Regional legislation focused on management of archaeological heritage 3.0 3.0
Factor D.5.4 UNCBD & Natura 2000 2.0 2.0
Factor D.5.5 National legislation focused on conservation and management of natural resources 3.0 3.0
Factor D.5.6 Regional legislation focused on conservation and management of natural resources 3.0 3.0
Average 2.7 2.7
Category D.5 - Environmental drivers
Factor D.5.1 Need to expand environmental conservation 3.0 3.0
Factor D.5.2 Increasing awareness for the value of natural resources 3.0 3.0
Factor D.5.3 Need to reduce tourist pressure on the coast 3.0 3.0
Average 3.0 3.0
Category D.5 - Technical drivers
Factor D.5.1 Preservation of UCH in situ is the first option and public access shall be promoted 3.0 3.0
Average 3.0 3.0
Version 1.1
Page 76
Combination: Tourism and Recreation + UCH + Environmental Protection (data for MUSES, 2017)
Inte
rvie
wee
3 Factor average for all stakeholders Category average
(average of all factors averaged for all stakeholders)
Scor
e
ADDED VALUES
Category V.1 - Economic added values
Factor V.1.1 Increase of local revenues related to tourist services 2.0 2.0
Factor V.1.2 Diversification of tourism sector 2.0 2.0
Factor V.1.3 Opportunity for tourism green label certification 3.0 3.0
Average 2.3 2.3
Category V.2 - Societal added values
Factor V.2.1 Education and public awareness about UCH and its respective history 3.0 3.0
Factor V.2.2 Prevent the destruction of submerged archaeological sites 3.0 3.0
Factor V.2.3 Establishment of an ecosystem service for the UCH site 2.0 2.0
Average 2.7 2.7
Category V.3 - Environmental added values
Factor C.3.1 Lower impact use of environmental and cultural resources 2.0 2.0
Factor C.3.2 Protection of natural resources associated to the archaeological material 2.0 2.0
Factor C.3.3 Education and public awareness about environmental protection 3.0 3.0
Average 2.3 2.3
Category V.5 - Technical added values
Version 1.1
Page 77
Combination: Tourism and Recreation + UCH + Environmental Protection (data for MUSES, 2017)
Inte
rvie
wee
3 Factor average for all stakeholders Category average
(average of all factors averaged for all stakeholders)
Scor
e
DRIVERS
Factor V.5.1 More frequent presence of divers can avoid irresponsible and intrusive access and unauthor-ized activities
2.0 2.0
Factor V.5.2 Creation of specialized professions (e.g. diving guides specialized in UCH) 3.0 3.0
Factor V.5.3 Development of nautical equipment and vessels that enable appreciation 3.0 3.0
Average 2.7 2.7
Version 1.1
Page 78
Combination: Tourism and Recreation + UCH + Environmental Protection (data for MUSES, 2017)
Inte
rvie
wee
3 Factor average for all stakeholders Category average
(average of all factors averaged for all stakeholders)
Scor
e
BARRIERS
Category B.1 - Legal barriers
Factor B.1.1 UNESCO Convention on the Protection of the UCH -3.0 -3.0
Average -3.0 -3.0
Category B.4 - Barriers related with technical capacity
Factor B.4.2 Design of new equipment (vessels to observe sea floor) -2.0 -2.0
Factor B.4.3 Natural deterioration of the archaeological material -3.0 -3.0
Average -2.7 -2.7
Category B.6 - Barriers related with environmental factors
Factor B.6.1 Restriction/dependence on weather conditions -3.0 -3.0
Factor B.6.2 Tourism is not allowed if the area is high sensitive to negative impacts of the tourists -3.0 -3.0
Average -3.0 -3.0
Version 1.1
Page 79
Combination: Tourism and Recreation + UCH + Environmental Protection (data for MUSES, 2017)
Inte
rvie
wee
1 Factor average for all stakeholders Category average
(average of all factors averaged for all stakeholders)
Scor
e
NEGATIVE IMPACTS
Category I.1 - Economic impacts
Factor I.1.1 Other activities are forbidden, except scientific research with authorization -2.0 -2.0
Average -2.0 -2.0
Category I.2. - Social impacts
Factor I.2.1 Risk of looting/stealing underwater archaeological sites and destruction of their contexts -3.0 -3.0
Factor I.2.2 Risk of congested diving sites -3.0 -3.0
Factor I.2.3 Risk of damage on the archaeological material caused by inexperienced divers -3.0 -3.0
Average -3.0 -3.0
Category I.3 - Environmental impacts
Factor I.3.1 Damage on the local natural resources by inexperienced divers -2.0 -2.0
Average -2.0 -2.0
Version 1.1
Page 80
MU Scientific Research + Environmental Protection (data for MUSES, 2017) Combination: Scientific Research + Environmental Protection (data for MUSES, 2017)
Inte
rvie
wee
1 Factor average for all stakeholders Category average
(average of all factors averaged for all stakeholders)
Scor
e
DRIVERS
Category D.3 - Economic drivers
Factor D.3.1 Continuous demand for new products and technologies 2.0 2.0
Average 2.0 2.0
Category D.4 - Societal drivers
Factor D.4.1 Demand for new scientific knowledge 2.0 2.0
Average 2.0 2.0
Category D.5 - Legal drivers
Factor D.5.1 Scientific research is one of the principles for the management of the Natural Parks 3.0 3.0
Average 3.0 3.0
Category D.5 - Environmental drivers
Factor D.5.1 Ecosystem conservation 3.0 3.0
Average 3.0 3.0
Version 1.1
Page 81
Combination: Scientific Research + Environmental Protection (data for MUSES, 2017)
Inte
rvie
wee
1 Factor average for all stakeholders Category average
(average of all factors averaged for all stakeholders)
Scor
e
ADDED VALUES
Category V.2 - Societal added values
Factor V.2.1 New scientific knowledge (e.g., some discovery that can improve well-being) 3.0 3.0
Average 3.0 1.5
Category V.3 - Environmental added values
Factor C.3.1 Ecosystem conservation and services 3.0 3.0
Factor C.3.2 Habitats, species, functions 3.0 3.0
Average 3.0 1.5
Category V.5 - Technical added values
Factor V.5.1 Ecotourism benefits of MU 3.0 3.0
Average 3.0 1.5
Version 1.1
Page 82
Combination: Scientific Research + Environmental Protection (data for MUSES, 2017)
Inte
rvie
wee
1 Factor average for all stakeholders Category average
(average of all factors averaged for all stakeholders)
Scor
e
BARRIERS
Category B.1 - Legal barriers
Factor B.1.1 Scientific research needs authorization to be conducted inside designated areas -2.0 -2.0
Factor B.1.2 It is not allowed to collect organisms in some designated areas -2.0 -2.0
Average -2.0 -2.0
Version 1.1
Page 83
Combination: Scientific Research + Environmental Protection (data for MUSES, 2017)
Inte
rvie
wee
1 Factor average for all stakeholders Category average
(average of all factors averaged for all stakeholders)
Scor
e
NEGATIVE IMPACTS
Category I.1 - Economic impacts
Factor I.1.1 Fisheries short-term and loss of fishing grounds -2.0 -2.0
Average -2.0 -2.0
Category I.3 - Environmental impacts
Factor I.3.1 Damage on the local natural resources during sample collection -1.0 -1.0
Average -1.0 -1.0
Version 1.1
Page 84
MU Aquaculture + Environmental Protection (data for MUSES, 2017) Combination: Aquaculture + Environmental Protection (data for MUSES, 2017)
Inte
rvie
wee
6 Factor average for all stakeholders Category average
(average of all factors averaged for all stakeholders)
Scor
e
DRIVERS
Category D.1 - Policy drivers
Factor D.1.1 IUCN Report encouraging aquaculture inside some designated areas - -
Factor D.1.2 Government designated areas for aquaculture 3.0 3.0
Average 3.0 3.0
Category D.2 - Relation with other uses
Factor D.2.1 These two uses are highly synergetic - they need the same environment such as good water quality
3.0 3.0
Factor D.2.2 Competition for space 1.0 1.0
Average 2.0 2.0
Category D.3 - Economic drivers
Factor D.3.1 Financial incentive systems 3.0 3.0
Factor D.3.2 The possibility of implement an economic use in a designated area 3.0 3.0
Factor D.3.3 Existence of APORMAR and programme 2020 that supports economically 3.0 3.0
Average 3.0 3.0
Version 1.1
Page 85
Combination: Aquaculture + Environmental Protection (data for MUSES, 2017)
Inte
rvie
wee
6 Factor average for all stakeholders Category average
(average of all factors averaged for all stakeholders)
Scor
e
ADDED VALUES
Category V.1 - Economic added values
Factor V.1.1 Possible further combinations with tourism 2.0 2.0
Factor V.1.2 Marketing products labelled as green 3.0 3.0
Factor V.1.3 Extend available areas for aquaculture 1.0 1.0
Average 2.0 2.0
Category V.2 - Societal added values
Factor V.2.1 Responsible farming and quality food 3.0 3.0
Average 3.0 3.0
Category V.3 - Environmental added values
Factor C.3.1 Better control of nutrient input and confidence and transparency in reporting 0.0 0.0
Factor C.3.2 Establishment of an ecosystem service for the designated areas 2.0 2.0
Average 1.0 1.0
Category V.5 - Governance added values
Factor V.5.1 Reduction of conflicts between uses 1.0 1.0
Factor V.5.2 Contribution to implementation of MSFD 3.0 3.0
Factor V.5.3 Contribution to implementation of WFD 3.0 3.0
Average 2.3 2.3
Version 1.1
Page 86
Combination: Aquaculture + Environmental Protection (data for MUSES, 2017)
Inte
rvie
wee
6 Factor average for all stakeholders Category average
(average of all factors averaged for all stakeholders)
Scor
e
BARRIERS
Category B.1 - Legal barriers
Factor B.1.1 Regulations and laws regarding marine property and use -3.0 -3.0
Factor B.1.2 Aquaculture cannot take place in Natura 2000 sites 0.0 0.0
Factor B.1.3 Aquaculture provide limitations in Natura 2000 sites -1.0 -1.0
Factor B.2.2 Lack of carefully planned monitoring and regulation 3.0 3.0
Average 3.0 3.0
Category B.3 - Barriers related with economic availability / risk
Factor B.3.1 Lack of investors because aquaculture will be inside designated areas -1.0 -1.0
Factor B.3.2 MU might make eco-labelling harder -1.0 -1.0
Factor B.3.3 Lack of collaboration from the industry side 0.0 0.0
Average -0.7 -0.7
Category B.4 - Barriers related with technical capacity
Version 1.1
Page 87
Factor B.4.1 Need for additional infrastructures or procedures to ensure a healthy environment -3.0 -3.0
Factor B.4.2 Not enough maturity of offshore aquaculture -2.0 -2.0
Factor B.4.3 Increased risk of collision of marine vessels, causing environmental impacts -1.0 -1.0
Factor B.4.4 Lack of space on land to support industry -3.0 -3.0
Average -2.3 -2.3
Category B.5 - Barriers related with social factors
Factor B.5.1 Public perception against economic activities inside designated areas -3.0 -3.0
Average -3.0 -3.0
Category B.6 - Barriers related with environmental factors
Factor B.6.1 Potential negative impacts on the environment due to uncertainty about interaction be-tween these two uses
0.0 0.0
Average 0.0 0.0
Version 1.1
Page 88
Combination: Aquaculture + Environmental Protection (data for MUSES, 2017)
Inte
rvie
wee
6 Factor average for all stakeholders Category average
(average of all factors averaged for all stakeholders)
Scor
e
NEGATIVE IMPACTS
Category I.3 - Environmental impacts
Factor I.3.1 Visual impacts -1.0 -1.0
Factor I.3.2 Impacts during construction and operation phases -1.0 -1.0
Factor I.3.3 Marine litter in the beach that ruins infrastructures -2.0 -2.0
Average -1.3 -1.3
Version 1.1
Page 89
MU Oil & Gas + Tourism + Aquaculture (data for MUSES, 2017) Combination: Oil & Gas + Tourism + Aquaculture (data for MUSES, 2017)
Inte
rvie
wee
9
Factor average for all stakeholders Category average (average of all factors averaged for all stakeholders)
Scor
e
DRIVERS Category D.1 - Policy drivers Factor D.1.1 Need of the state to know about its resources, including Oil & gas 3.0 3.0 Factor D.1.2 Petroleum law that regulates the activity 3.0 3.0 Average 3.0 3.0 Category D.2 - Relation with other uses Factor D.2.1 Number of platforms to be decommissioned in Italy, UK and Norway - - Average - -
Version 1.1
Page 90
Combination: Oil & Gas + Tourism + Aquaculture (data for MUSES, 2017)
Inte
rvie
wee
9 Factor average for all stakeholders Category average
(average of all factors averaged for all stakeholders)
Scor
e
ADDED VALUES Category V.1 - Economic added values Factor V.1.1 Number of platforms to be decommissioned in Italy, UK and Norway 1.0 1.0 Factor V.1.2 Improve image of O & G industry 2.0 1.0 Factor V.1.3 Revenues and taxes increase 3.0 1.0 Factor V.1.4 Less import of petroleum products 3.0 1.0 Factor V.1.5 Diversification of the economy 2.0 1.0 Average 2.2 2.2 Category V.2 - Societal added values Factor V.2.1 Generate employment and create of highly specialized work force 2.0 1.0 Average 2.0 2.0 Category V.3 - Environmental added values Factor C.3.1 Preserve ecological integrity of the seafloor 1.0 1.0 Factor C.3.2 Foster low carbon economy and activities 2.0 1.0 Factor C.3.3 Less CO2 pollution and accident risk by producing oil & gas locally instead of long-distance
2.0 1.0
Average 1.7 1.7 Category V.4 - Better insurance policy and risk management Factor V.4.1 Government learn proper management of MU 2.0 1.0 Average 2.0 2.0 Category V.5 - Technical added values Factor V.5.1 Development of new technologies 1.0 1.0 Average 1.0 1.0
Version 1.1
Page 91
Combination: Oil & Gas + Tourism + Aquaculture (data for MUSES, 2017)
Inte
rvie
wee
9 Factor average for all stakeholders Category average
(average of all factors averaged for all stakeholders)
Scor
e
BARRIERS Category B.2 - Administrative barriers Factor B.2.1 Worldwide no specific BAT or Best Practice on decommissioning in place 1.0 1.0 Factor B.2.2 On EU level Hydrocarbons BREF (Best Available Techniques (BAT) Reference document) only
- -
Factor B.2.3 Efficiency of authorisation processes from regulators: timing need to improve 2.0 2.0 Average 1.5 1.5 Category B.3 - Barriers related with economic availability / risk Factor B.3.1 Few specialised available professionals 1.0 1.0 Average 1.0 1.0 Category B.5 - Barriers related with social factors Factor B.5.1 Public perception of the activity. Need of better information 3.0 3.0 Average 3.0 1.0 Category B.6 - Barriers related with environmental factors Factor B.6.1 Harsh environment: waves, deep waters 1.0 3.0 Average 1.0 1.0
Version 1.1
Page 92
Combination: Oil & Gas + Tourism + Aquaculture (data for MUSES, 2017)
Inte
rvie
wee
9 Factor average for all stakeholders Category average
(average of all factors averaged for all stakeholders)
APPENDIX 2 SHEETS USED IN THE STAKEHOLDER ENGAGEMENT PHASE
MU Definition and MU list Sheet (data for MUSES, 2017)
Multi-use definition In the realm of marine resource utilisation, multi-use should be understood as the intentional joint resource use by two or more different uses through one or more users. It is an umbrella term that covers a multitude of combinations wherein a single user shares the same resource or different users operate side by side. The user/the users (if there is more than one party) or uses are mutually-connected - they have to take into con-sideration and understand each other’s inherent needs and capabilities. Hence, MU represents a radical change from the concept of exclusive resource rights to the inclusive sharing of resources by one or more us-ers. The shared marine resource in this context can be geographical (e.g. ocean space), physical (e.g. infrastructure or energy), human (e.g. same staff) or even biological (e.g. fish stocks). MU can vary in the degree of connec-tion between users and uses as well as the drivers behind it. For a long-term success of the concept of MU it is important that sharing of resources is sustainable, efficient and fair and offers clear benefits either directly to the users themselves (e.g. economic benefits) and/or to society at large (e.g. ecological benefits).
Interviewee
Name: Institution:
List of multi-uses Do you agree with current and potential multi-uses identified for Algarve?
Current MU Yes/No MU, you would like to ana-lyse
Fisheries + Tourism and Recreation
Tourism and Recreation + UCH + Environmental Protec-tion
Tourism and Recreation + Environmental Protection
Scientific Research + Environmental Protection
Scientific Research + Defence
Scientific Research + UCH
Potential MU
Blue Biotechnology + Environmental Protection
Renewable energy + Environmental Protection
Renewable energy + Fisheries
Renewable energy + Tourism
Renewable energy + Aquaculture
Aquaculture + Tourism
Aquaculture + Environmental Protection
Version 1.1
Page 94
Interview map (data for MUSES, 2017) Interviewee: ________________________________________________________________________
Version 1.1
Page 95
Example of DABI table pre-compiled (data for MUSES, 2017) Fisheries + Tourism and Recreation Description: This combination of fishery and tourism is traditionally also known as Pescatourism, defined as professional fishermen welcoming a certain number of tourists on to their boats in a tourism-recreation activity (rec. fishing) or tourists join professional small-scale fishers on board of traditional boats. Locations: The Azores (Terceira, São Miguel and São Jorge) - Portugal Drivers D Added Values A Barriers B Impacts I D.1. Policy drivers Sc V.1. Economic Sc B.1. Legal barriers Sc I.1. Societal Sc Dedicated regional funds specific for pescatourism activity Increase of local economy Legal aspects concerning hygiene and
security of passengers on the vessel
“European Maritime and Fisheries Fund (EMFF)” for 2014-2020 has an aim of diversify fishing activity
Development of new market opportunities for both traditional fisheries and tourism (e.g. integrative income for fishers)
Need for a second Licence
“Melhor pesca, mais rendimento. Medidas estratégicas para o setor da pesca dos Açores 2015-2020” has an aim to diversify fishing activity with tourism
Extension of income season for both tourism and fisheries
Funding schemes are decentralized (e.g. national funds are subjected to specific regional development priorities)
Limitation (e.g. quotas, closed seasons and not allowed areas) in fisheries activities
Diversification of tourism sector
D.2.Relation between these uses Sc V.2. Environmental Sc B.2. Administrative barriers Sc I.2. Environmental Sc
High number of maritime activities in the area – need to limit conflicts
Education and public awareness about state and issues of marine environment
More sustainable than the single use of traditional fisheries because there is a limited catch
Reduction of tourists in the coast
Version 1.1
Page 96
(e.g. traditional beach tourism)
D.3. Economic drivers Sc V.3. Technical Sc B.3. Barriers related with economic availability / risk Sc I.3. Economic Sc
Tourism growth Improment of technical skills (e.g. fishers become tourist actors) Concurrence from other tourism sectors
Concurrence for other tourism sectors (e.g. whale watching and recreational fishing)
Financial incentive systems
Lack of adequate funding for startup of activity (e.g. buy material for ensuring security or pay a second Licence and insurances)
Low potential for fisheries’ growth Ensure all year activity for fishermen and tourism
Find new sources of income Increasing eco-tourism D.4. Societal drivers Sc V.4. Societal Sc B.4. Barriers related with social factors Sc I.4. Technical Sc Need to diversify fishing activity to maintain fishing communities identity
Involving fisher’s family to help onshore Resistance to change in small fishing
communities
Conservation of tradicional fisheries and their culture Risks onboard (e.g., fall during recovering
gear)
Education and public awareness about state and issues of fisheries, as well as fisher culture
Promotion of seafood diet
Oportunity for tourists to present a high degree of satisfaction (e.g. Sardinia – Italy)
Version 1.1
Page 97
D.5. Legal drivers Sc V.5. Governance Sc B.5. Barriers related with environmental factors Sc Sc
National legislation focused on pescatourism Current degradation of marine resources
might impair the activity
Regional legislation focused on pescatourism Restriction/dependence on fishing ban
periods
Licence is issued in short time Restriction/dependence on weather conditions
Licence’s process for Pescatourism is similar to the process for commercial fishery
D.6. Environmental Sc Sc B.6. Barriers related with technical capacity Sc Sc
Public awareness to responsible fisheries and tourism activities Lack of expertise to deal with tourists (e.g.
language and communication skills)
Need to reduce tourist pressure on the coast Lack of expertise to develop organized
economic business
Reduction of fisheries exploitation Need of logistic infrastructure in land (it can be a partner)
Lack of advertisement/publicity of the MU
Lack of on-line platform to contact the fishers
Version 1.1
Page 98
Research Questions Sheet (data for MUSES, 2017)
Focus-Area-1 "Addressing Multi-Use"
Focus-Area-2 "Boosting Blue Maritime Economy"
Focus-Area-3 "Improving environmental compatibil-
ity" ORIGINAL
12
(1.2) Is space availability an issue for MU develop-ment/strengthening in the case study area at present? (Y/N). Will space availability become an issue for your area in the future? (Y/N). For what elements space availability is / could become an issue?
27
(2.7) In order to promote MU development / strength-ening in the case study area, - would the availability of a vision/strategy (e.g. at na-tional or sub-regional level) be helpful? (Y/N) - would a feasibility study including evaluation of alter-native scenarios be helpful? (Y/N) - would detailed projects on already identified simula-tions be useful? (Y/N)- do you see other enablers?
Version 1.1
Page 99
15 (1.5) Are existing and/or potential MUs taken into ac-count and valorized within the existing or under devel-opment maritime spatial plans? (Y/N)
GOVERNMENT
18
(1.8) What action(s) would you recommend to develop / widen / strengthen MU in the case study area? What actor(s) do you see particularly important to de-velop / widen / strengthen MU in the case study area? (answers should be detailed enough to possibly allow undertaking actions finalized at MU promotion, at local case study level)
26
(2.6) Is there sufficient dialogue between the stake-holder sectors for developing / widening / strengthen-ing MU? (Y/N). Would dialogue facilitation be an asset? (Y/N)
14 (1.4) What would be the most important resources to be shared between uses (infrastructures, services, per-sonnel, etc.)?
MAINLY ACTORS
22
(2.2) Is it possible to quantify the socio-economic bene-fits related to MUs and how they (could) contribute to the sea economy at local and regional/national scale? What tools, knowledge, experiences are available?
Version 1.1
Page 100
23 (2.3) Would MU development / strengthening be an opportunity for job creation and / or job requalification in your area? (Y/N)
24
(2.4) Do you see possible elements of attractiveness for investors in developing / widening / strengthening MU in the case study area? (Y/N). What are these elements? (2.5) What are possible investors interested in develop-ing / widening / strengthening MU in the case study ar-ea?
GOVERNMENT
33
(3.3) Is saving free sea space for nature conservation a driver for MU the case study area? (Y/N). Are there evidences about the present and future ben-efits of reserving free sea space? (Y/N). What are they?
GOVERNMENT
34
(3.4) What practical actions would you undertake to link MU development / widening / strengthening to improved environmental compatibility of maritime ac-tivities?
Version 1.1
Page 101
36
(3.6) Is the environmentally friendly knowledge / tech-nology for MU development/strengthening in the case study area available? (Y/N). Which is the level of readiness of available solutions? Are there still research needs on blue/green technolo-gies for MU? (Y/N)
32 (3.2) Which tools (conceptual, operational) are used or should be further developed and used to better esti-mate environmental impacts and benefits of MU?
GOVERNMENT
37
(3.7) Would it be possible to promote MU through SEA/EIA procedures? (Y/N). What modifications would you suggest at your national / local level to promote MU through SEA/EIA proce-dures?