26
Music Education and Academic Performance © 2001, Daniel R. Zanutto A longitudinal study of the effects upon key academic indicators at the secondary level – grades 7-11.
| Date post: | 24-Dec-2015 |
| Category: |
Documents |
| Upload: | jonathan-roberts |
| View: | 213 times |
| Download: | 0 times |

Music Education andAcademic Performance © 2001, Daniel R.
Zanutto
A longitudinal study of the effects upon key academic indicators at the secondary
level – grades 7-11.

Introduction © 2001, Daniel R. Zanutto
Achievement profiles for 1,415 students were compared to analyze trends to determine if significant differences existed between music and non-music students.
The entire student population (and each subset) remained constant during the 5-year period of analysis.

Science GPA
0
0.5
1
1.5
2
2.5
3
3.5
4
7th 8th 9th 10th 11th
Instrumental
No Music

Science TableGroup 7th 8th 9th 10th 11th
Music
Mean 3.52 3.34 3.17 2.89 2.79
SD 0.87 0.63 0.75 0.89 0.98
N 41 97 99 95 80
No Music
Mean 3.45 2.95 2.81 2.55 2.48
SD 0.77 0.92 0.90 0.98 1.03
N 343 698 887 841 636
Mean Dif 0.08 0.39 0.35 0.34 0.31
t-value 0.53 5.42 4.33 3.47 2.66
p-value 0.60 <0.01 <0.01 <0.01 <0.01

Mathematics GPA
0
0.5
1
1.5
2
2.5
3
3.5
7th 8th 9th 10th 11th
Instrumental
No Music

Mathematics TableGroup 7th 8th 9th 10th 11th
Music
Mean 3.35 3.30 2.90 2.73 2.47
SD 0.64 0.83 0.83 0.86 1.05
N 91 98 99 99 101
No Music
Mean 3.19 3.01 2.61 2.36 2.29
SD 0.78 0.88 0.95 1.00 1.15
N 646 713 864 901 885
Mean Dif 0.17 0.29 0.29 0.36 0.17
t-value 2.23 3.22 3.27 3.90 1.56
p-value <0.05 <0.05 <0.01 <0.01 0.12

English GPA
0
0.5
1
1.5
2
2.5
3
3.5
7th 8th 9th 10th 11th
Instrumental
No Music
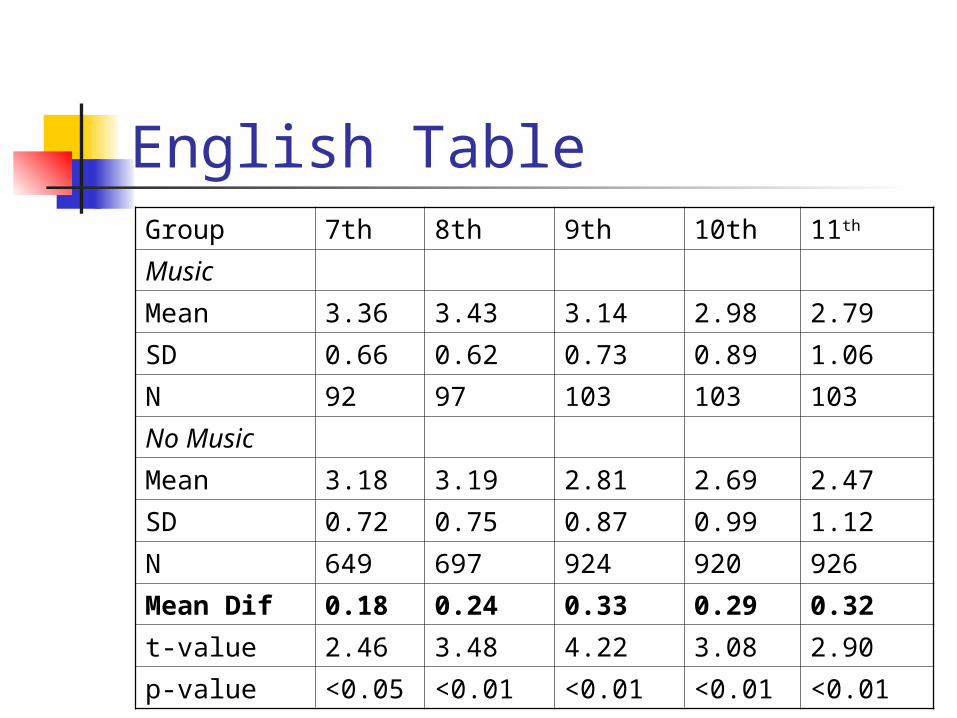
English TableGroup 7th 8th 9th 10th 11th
Music
Mean 3.36 3.43 3.14 2.98 2.79
SD 0.66 0.62 0.73 0.89 1.06
N 92 97 103 103 103
No Music
Mean 3.18 3.19 2.81 2.69 2.47
SD 0.72 0.75 0.87 0.99 1.12
N 649 697 924 920 926
Mean Dif 0.18 0.24 0.33 0.29 0.32
t-value 2.46 3.48 4.22 3.08 2.90
p-value <0.05 <0.01 <0.01 <0.01 <0.01

Social Science GPA
0
0.5
1
1.5
2
2.5
3
3.5
7th 8th 9th 10th 11th
Instrumental
No Music

Social Science Table
Group 7th 8th 9th 10th 11th
Music
Mean 3.35 3.41 3.05 3.26 3.06
SD 0.66 0.65 1.19 0.73 0.87
N 92 97 10 96 97
No Music
Mean 3.15 3.14 2.80 2.68 2.60
SD 0.80 0.79 0.98 0.99 1.09
N 649 697 110 865 892
Mean Dif 0.20 0.27 0.25 0.58 0.46
t-value 2.57 3.70 0.64 7.04 4.86
p-value <0.05 <0.01 0.54 <0.01 <0.01

CTBS Reading
58
60
62
64
66
68
70
72
74
76
7th 8th
Music
No Music

CTBS Reading TableGroup 7th 8th
Music
Mean 67.81 75.33
SD 16.88 15.00
N 91 97
No Music
Mean 65.09 68.32
SD 18.20 18.54
N 645 694
Mean Dif 2.72 7.01
t-value 1.43 4.18
p-value 0.16 <0.01
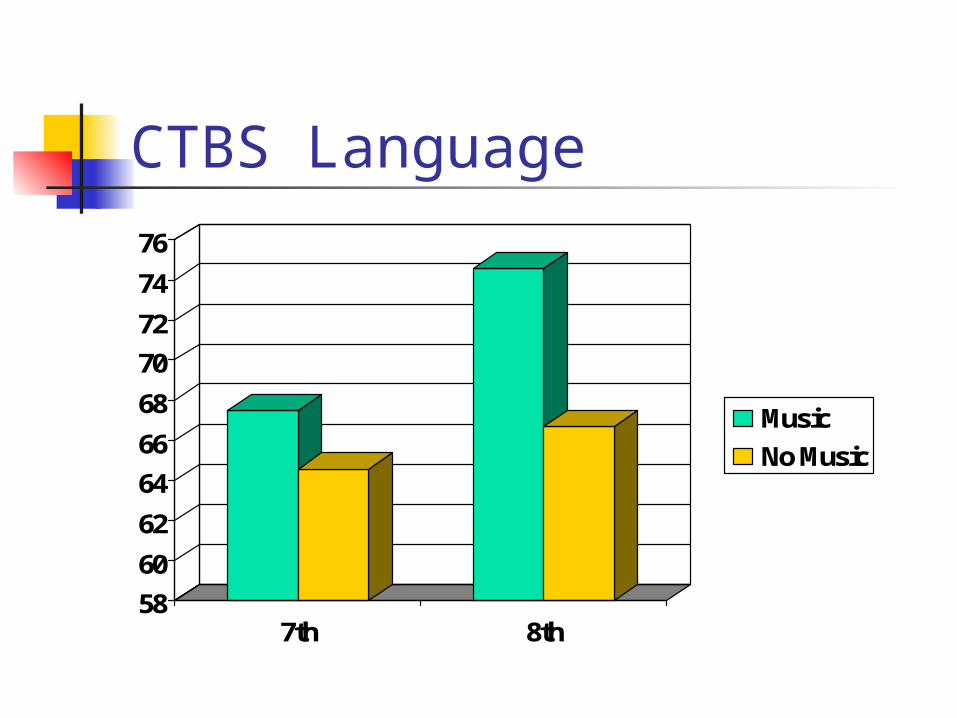
CTBS Language
58
60
62
64
66
68
70
72
74
76
7th 8th
Music
No Music

CTBS Language Table
Group 7th 8th
Music
Mean 67.49 74.58
SD 20.06 17.46
N 91 97
No Music
Mean 64.58 66.69
SD 19.24 18.96
N 645 694
Mean Dif 2.91 7.89
t-value 1.30 4.12
p-value 0.19 <0.01

CTBS Mathematics
646566676869707172737475
7th 8th
Music
No Music
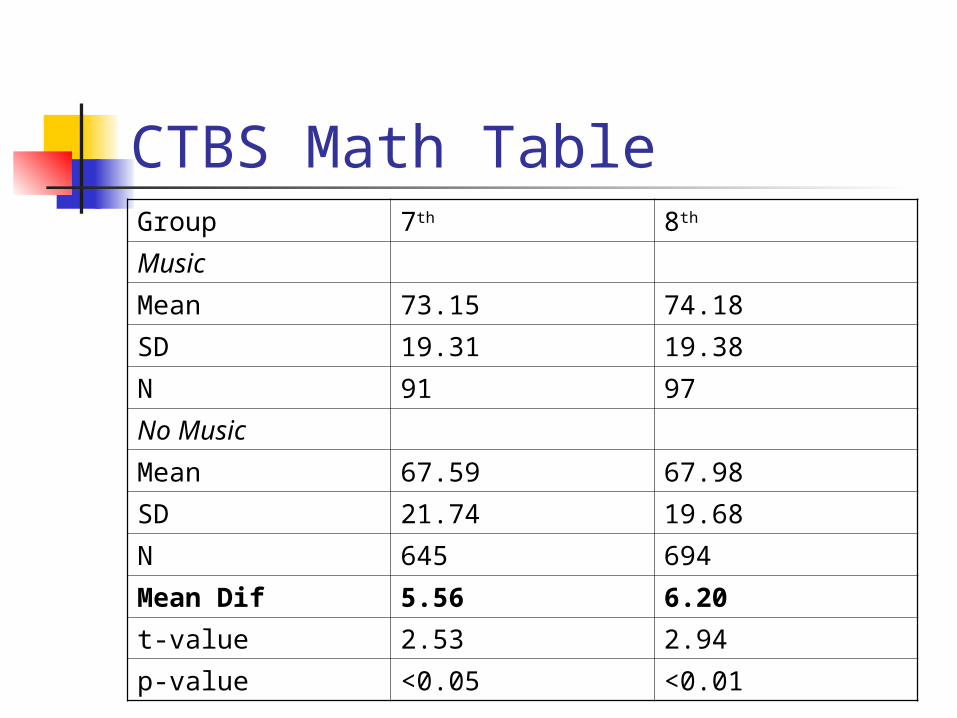
CTBS Math TableGroup 7th 8th
Music
Mean 73.15 74.18
SD 19.31 19.38
N 91 97
No Music
Mean 67.59 67.98
SD 21.74 19.68
N 645 694
Mean Dif 5.56 6.20
t-value 2.53 2.94
p-value <0.05 <0.01

Degrees of Reading Power
0
10
20
30
40
50
60
70
80
90
7th 8th 9th 10th 11th
Music
No Music

DRP TableGroup 7th 8th 9th 10th 11th
Music
Mean 66.06 77.57 78.48 63.75 81.50
SD 12.71 11.12 11.49 8.62 3.54
N 92 63 42 4 2
No Music
Mean 63.29 71.41 74.09 70.09 69.80
SD 12.03 11.43 11.95 11.68 13.03
N 631 439 488 138 60
Mean Dif 2.74 6.16 4.39 -6.34 11.70
t-value 1.95 4.10 2.37 -1.43 3.88
p-value 0.06 <0.01 <0.05 0.02 0.06

Writing Proficiency
6.26.46.66.8
77.27.47.67.8
88.28.4
9th 10th 11th
Music
No Music
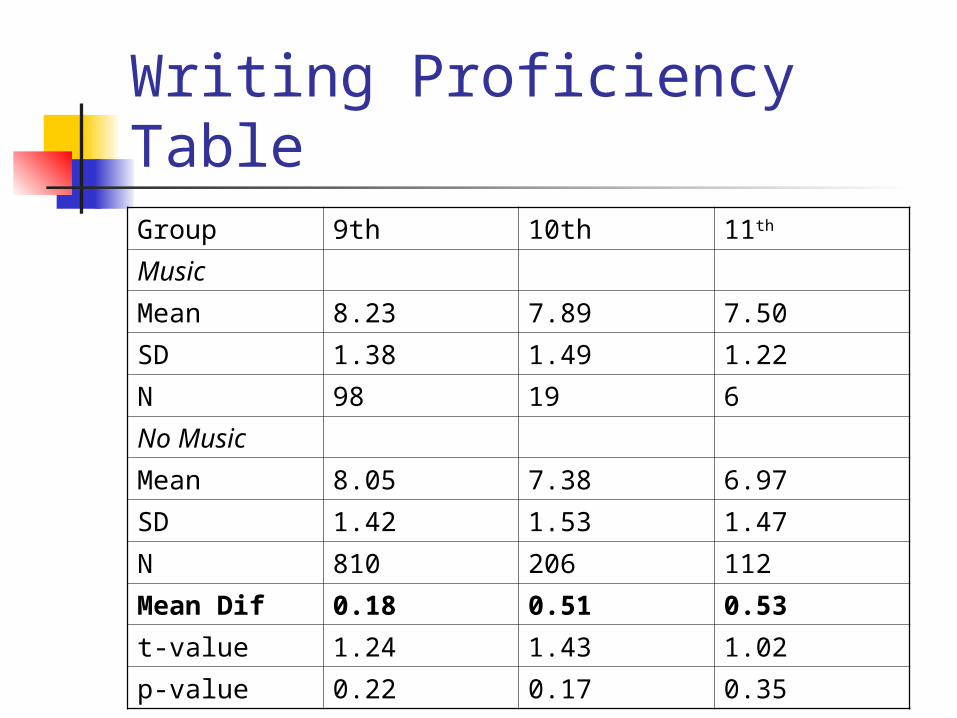
Writing Proficiency TableGroup 9th 10th 11th
Music
Mean 8.23 7.89 7.50
SD 1.38 1.49 1.22
N 98 19 6
No Music
Mean 8.05 7.38 6.97
SD 1.42 1.53 1.47
N 810 206 112
Mean Dif 0.18 0.51 0.53
t-value 1.24 1.43 1.02
p-value 0.22 0.17 0.35

Math Proficiency
60
62
64
66
68
70
72
74
76
7th 8th 9th 10th 11th
Music
No Music

Math Proficiency TableGroup 7th 8th 9th 10th 11th
Music
Mean 70.74 74.92 75.02 69.47 74.22
SD 15.68 14.39 9.16 10.51 7.92
N 92 63 61 17 2
No Music
Mean 65.96 68.15 70.34 68.03 74.25
SD 16.65 15.56 12.33 11.45 11.14
N 603 444 599 287 162
Mean Dif 4.78 6.77 4.68 1.44 -0.03
t-value 2.63 3.21 3.66 0.55 -0.01
p-value <0.01 <0.01 <0.01 0.59 0.06

Unexcused Absences
0
0.1
0.2
0.3
0.4
0.5
0.6
7th 8th 9th 10th 11th
Music
No Music

Unexcused Absence Table
Group 7th 8th 9th 10th 11th
Music
Mean 0.26 0.14 0.18 0.24 0.08
SD 0.78 0.52 0.67 0.60 0.36
N 94 98 100 103 104
No Music
Mean 0.23 0.38 0.34 0.58 0.27
SD 0.72 0.99 0.80 1.13 0.75
N 653 704 819 875 930
Mean Dif 0.03 -0.24 -0.16 -0.34 -0.19
t-value 0.30 -3.74 -2.24 -4.79 -4.41
p-value 0.76 <0.01 <0.05 <0.01 <0.01

What This Means There are significant observable differences in
academic profiles between music and non-music students.
While GPA trends show declining scores in all groups, music students do better.
Mean differences show that music students outperform non-music students in CTBS & proficiency testing over time.
While no direct claim is made relating to cause and effect, positive correlations infer that participation in music education can contribute to positive outcomes in academic achievement and attitudes/attendance relating to school.

Next Steps © 2001, Daniel R. Zanutto
Future study should include baseline information before music instruction occurs.
Further research could include case-studies that allow more detailed information, i.e. “outside musical influences.”
Study non performance-based music classes. What effect does elementary general- music
instruction have upon academic profiles at the secondary level?


