47
Muskrat Falls: The Best Option?: A Public Forum A Presentation to “Memorial Presents” by Wade Locke, Ph.D. (Economics) January 17, 2012 1

Muskrat Falls: The Best Option?: A Public ForumA Presentation to “Memorial Presents” by Wade Locke, Ph.D. (Economics) January 17, 2012 1

Presentation Outline
• Introduction
• Why get involved?
• How did NALCOR Derive the Price?
• Island Load Forecast
• Production Mix
• Can we price ourselves out?
• C.D. Howe Study
• Cost Comparison of Alternatives
• Calculating the Supply Price
• Oil and Gas Prices
• Lower Fuel Cost – A Viable Alternative
• Is Natural Gas an Alternative?
• LNG
• NL Electric Bills
• Shale Gas
• Debt Burden
• Conclusion
2

Introduction• I want to thank the Harris Centre, the Applied Economic Research Initiative and the Atlantic Province’s
Economic Council for sponsoring this event.
• I especially want to thank you for coming out to this lecture and letting me share my thoughts.
• I have been on the record as supporting the Muskrat Falls Development as a good for the province.
• However, when Dr. Vardy released, through the Harris Centre, his paper that raised a number of serious questions on the project, it spurred me to look more closely at the issues.
• I know Dr. Vardy as a passionate and bright Newfoundlander and given his paper, I had to look further to see if I was wrong or were there issues that I need to consider in more detail and possibly change my position.
• The outcome of that reflection is the presentation that I am offering tonight.
• Being liked or cheered by one political group or another is like the tide – it rises for a period of time, lifting you and then it recedes and you fall. Professional integrity is like this island – rock sold. I care little about the former (but I prefer to be liked than not) and I care passionately about the latter. My professional reputation is important to me!
3

Why get Involved in this Contentious Debate? (1)
• As a university academic, it is important for me personally to help people understand issues that may affect their lives; to help them utilize information to better plan for their future; and to be more active participants in the democratic process.
• This defines me as a person and a scholar. Its my essence!
• It is important for the intellectual capital resident at the University to contribute to the community in ways beyond our core competencies knowledge generation (research) and knowledge transfer (teaching).
• We have a responsibility to apply our expertise in a way that helps improve society for current and future generations to the extent that we can.
• I feel privileged to be in a position to teach and do research at the University and to be able to contribute to the province in a small way. I want to be helpful, I am having fun doing it and I find it interesting!
Why get Involved in this Contentious Debate? (2)
• For the record, I am not being paid by anyone to undertake this research and I do not represent anyone, but myself, on this issue. I am not under contract to NALCOR or the provincial government for anything pertaining to Muskrat Falls.
• As part of the EIA process (the Joint Review Panel), I was asked as a subcontract to another company which had a contract with NALCOR to estimate the economic (employment and income) impacts associated with the expenditures emanating from the Lower Churchill. I have been consistently up front about my involvement in the estimating the employment and income impacts of this project.
• I am receiving no compensation, either direct or implied, by undertaking this research and/or presenting my beliefs here tonight that are honestly held even if you don’t agree with them or believe them to be incorrect.
• I hope you will consider the information presented here tonight and give it whatever weight you feel it deserves in making your own conclusion about this important public policy facing Newfoundland and Labrador today.
Conceptual Approach to the analysis?
On one level, there are couple of basic questions that need to be answered:1. Do we need the power? If the answer is no, then we do not need to go any further? Looking at the
best option for something that is not needed is really not an interesting question. It is one better left to academics. We are have particular skill sets and time pressures that position us well to spend time on issues that are moot, but yield a great debate about nothing. We are good at it!
2. Can we avoid the need? If we need the power, can we avoid the need to add new generating capacity by raising prices sufficiently or through aggressive application of demand side management techniques?
3. What is the least cost alternative? If neither approach can effectively forestall the need without imposing excessive and negative adjustment costs to the most vulnerable in NL, then we have to eventually ask which option is the least cost (where costs are broadly defined to include direct financial and environmental costs and economic development benefits or through enhance oil recovery)
How we answer this last one can be quite complicated and has generated heated debate. So, I will spend some time on this particular issue tonight because it is basic and needs to be resolved.
6
How Did NALCOR Derive the Price Associated with Muskrat Falls (1)
• First, they calculated that 4,873 Gwh (824 MW) would be the energy produced from Muskrat Falls
• Second, for the generation project, they would have calculated the capital cost, the operating costs, Innu payments and water rentals in nominal terms to give a cost that would have to be covered from the sale of electricity.
• Third, they would have assumed that this cost is 100% equity financed (NL Gov.) and that the required rate of return would be 12%
• Fourth, they assumed that inflation applied to electricity rates would average 2% per annum
• Fifth, they would have calculated the price that would have to prevail in 2010 in order to give a 12% rate of return from the energy produced and this would have yielded a price of $75.82 per Mwh or 7.582 cents per Kwh
• Sixth, this figure would have would have been escalated at the annual inflation rate to derive a nominal price figure
7

How Did NALCOR Derive the Price Associated with Muskrat Falls (2)
• Seventh, they applied this nominal price to the actual energy assumed to be used on the island at various points in time. This start at approximately 2,000 Gwh per year and eventual rises to 4,873 Gwh – the capacity of the plant.
• Eight, this gives them a revenue flow that ignores initially the potential revenue from the residual energy and the Nova Scotia 20% commitment which is unavailable for revenue to NL until 2051 (i.e., 35 years out).
• This calculation yields an 8.4% rate of return on equity to the shareholder (the Gov. of NL), which is deemed to be sufficient to allow the project to proceed. That is, it would allow NALCOR to borrow a portion of the funds and the provincial government would kick in the rest in equity.
• The provincial government can currently borrow at less than 5%, so that is the implicit cost of the equity that the government will contribute to this project. Also, as long as NALCOR’s borrowing rate falls short of 8.4% (let’s say 7.2%), then borrowing some portion of the needed capital will increase the rate of return to shareholder [This assumes that debt servicing can be handled with the net cash flow provided by the project.]
• If the additional power, the difference between the Nova Scotia 20% commitment and the island needs at various points in time, is sold for industrial needs in Labrador or for export through the maritime link, then the return on equity will increase or the price needed to earn a given rate of return will be reduced.
8

Island Load Forecast – Energy Requirement and Assumed Growth
9
7,5858,806 9,235
9,704 10,087 10,431 10,99411,486 11,924
1.61.8
4.6
3.3
1.4
0.20.5
0.81.2
0.6
0.9 0.8 0.7 0.7 0.6 0.6 0.5 0.5 0.5 0.5
0.0
0.5
1.0
1.5
2.0
2.5
3.0
3.5
4.0
4.5
5.0
0
2,000
4,000
6,000
8,000
10,000
12,000
14,000
2010
2012
2014
2016
2018
2020
2022
2024
2026
2028
2030
2032
2034
2036
2038
2040
2042
2044
2046
2048
2050
2052
2054
2056
2058
2060
2062
2064
2066
Annu
al Cha
nge (%
)
Gwh of Ene
rgy Re
quire
d
GWh % ChgData Source: PUB Exhibit 1
In my assessment, the assumptions that went into this forecast and the methodology are reasonable and the technical people who performed this assessment are certainly technically competent and I have no reason to believe that they are motivated by anything other than to do their job as best they can. These things are never exact, but they are reasonable.

Comparison of Total Production Mix –Isolated Island vs. Muskrat Infeed
Isolated Island- Components Muskrat Falls Infeed - Components
10
0
2,000
4,000
6,000
8,000
10,000
12,000
14,000
2010
2013
2016
2019
2022
2025
2028
2031
2034
2037
2040
2043
2046
2049
2052
2055
2058
2061
2064
2067
Gigaw
att H
ours
Holyrood Other Thermal Hydro
Infeed Wind Unserved Energy
Total Production
0
2,000
4,000
6,000
8,000
10,000
12,000
14,000
2010
2013
2016
2019
2022
2025
2028
2031
2034
2037
2040
2043
2046
2049
2052
2055
2058
2061
2064
2067
Gigaw
att H
ours
Holyrood Other Thermal Hydro
Infeed Wind Unserved Energy
Total Production
The Island load is forecast to grow from 7,600 Gwh per year in 2010 to 10,500 Gwh per year in 2041 to 12,000 Gwh per year in 2067. The amount met from thermal versus hydro is the essential difference between the two scenarios. This seems reasonable and points to the need to do something – new capacity, higher prices, better education, improved energy efficiency, etc.
Can we Price Ourselves Out the Need to Expand Capacity by Reducing Demand?
• From a conceptual or hypothetical perspective, we certainly can.
• Specifically, with a downward or negatively sloping demand curve (i.e., with a demand elasticity that is less than infinite), we can reduce demand by raising prices.
• The only real question is how much prices would have to increase by and are the adjustment costs less than the infrastructure and operating/fuel costs associated with new capacity
• Moreover, if we do not care about the adjustment cost to rate payers, then it is an easy issue. Keep rising prices until the problem disappears.
11

C. H. Howe Pricing Solution –A Closer Look
• On January 11, 2011, Dr. Feehan released a paper through the C.D. Howe Institute which argued: if prices were increased to reflect the price of fuel, then “excessive power consumption” will be curtailed and this “could make the expensive Muskrat Falls project unnecessary.”
• It also advocates for time of year pricing – higher in the winter and lower in the summer and possibly time of day pricing, if feasible.
• The paper noted that fuel cost for Holyrood in 2011 was $135/Mwh but consumers were paying only $105/Mwh. However, the paper argues that a 30% increase in price might not be needed because only 15% of island power was derived from Holyrood.
• Empirical studies indicated that a 20% increase in price should reduce demand by 5%, one-third of Holyrood, implying that may be enough.
12
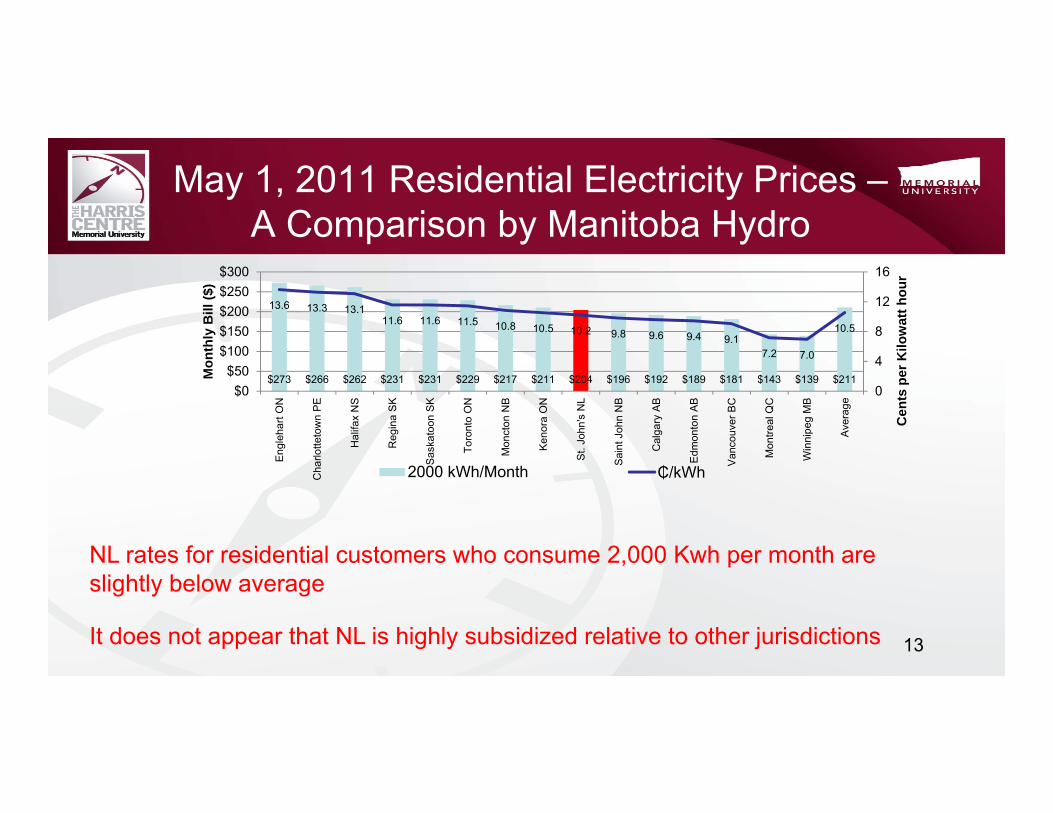
May 1, 2011 Residential Electricity Prices –A Comparison by Manitoba Hydro
$273 $266 $262 $231 $231 $229 $217 $211 $204 $196 $192 $189 $181 $143 $139 $211
13.6 13.3 13.111.6 11.6 11.5 10.8 10.5 10.2 9.8 9.6 9.4 9.1
7.2 7.0
10.5
0
4
8
12
16
$0$50
$100$150$200$250$300
Eng
leha
rt O
N
Cha
rlotte
tow
n P
E
Hal
ifax
NS
Reg
ina
SK
Sas
kato
on S
K
Toro
nto
ON
Mon
cton
NB
Ken
ora
ON
St.
John
's N
L
Sai
nt J
ohn
NB
Cal
gary
AB
Edm
onto
n A
B
Van
couv
er B
C
Mon
treal
QC
Win
nipe
g M
B
Ave
rage
Cen
ts p
er K
ilow
att h
our
Mon
thly
Bill
($)
2000 kWh/Month ₵/kWh
13
NL rates for residential customers who consume 2,000 Kwh per month are slightly below average
It does not appear that NL is highly subsidized relative to other jurisdictions
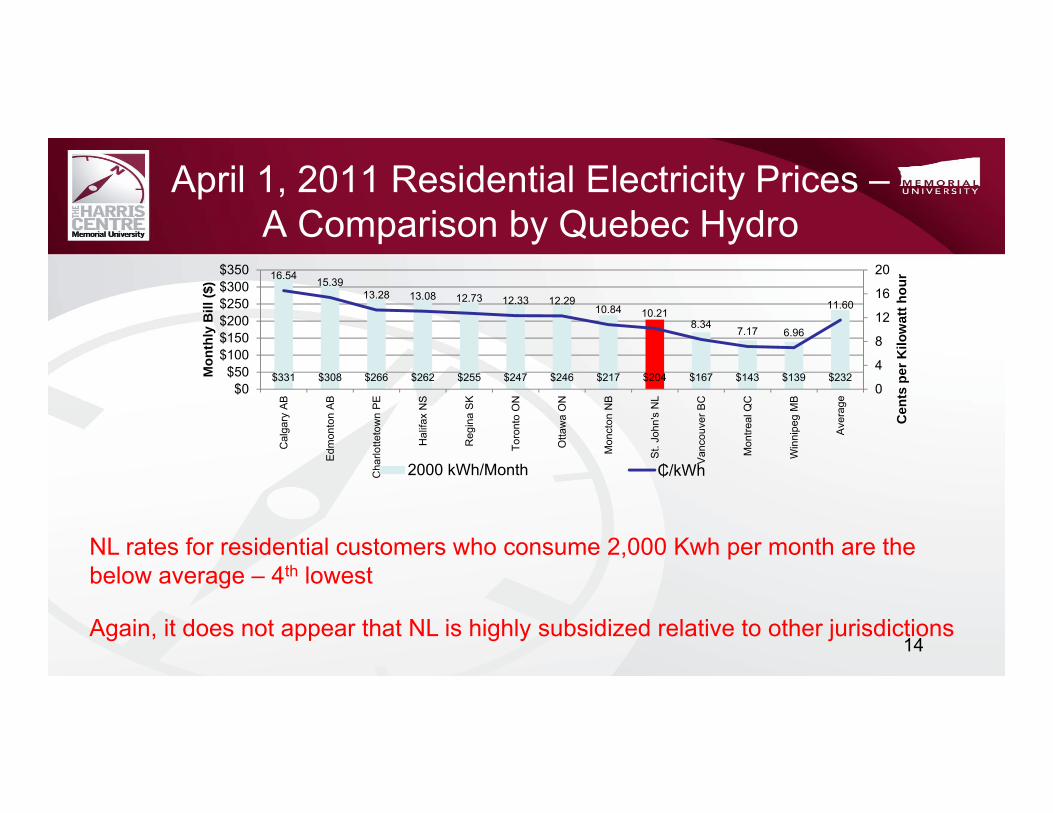
April 1, 2011 Residential Electricity Prices –A Comparison by Quebec Hydro
$331 $308 $266 $262 $255 $247 $246 $217 $204 $167 $143 $139 $232
16.54 15.3913.28 13.08 12.73 12.33 12.29
10.84 10.218.34 7.17 6.96
11.60
0
4
8
12
16
20
$0$50
$100$150$200$250$300$350
Cal
gary
AB
Edm
onto
n A
B
Cha
rlotte
tow
n P
E
Hal
ifax
NS
Reg
ina
SK
Toro
nto
ON
Otta
wa
ON
Mon
cton
NB
St.
John
's N
L
Van
couv
er B
C
Mon
treal
QC
Win
nipe
g M
B
Ave
rage
Cen
ts p
er K
ilow
att h
our
Mon
thly
Bill
($)
2000 kWh/Month ₵/kWh
14
NL rates for residential customers who consume 2,000 Kwh per month are the below average – 4th lowest
Again, it does not appear that NL is highly subsidized relative to other jurisdictions
C. H. Howe Pricing Solution –Issues for Further Consideration (1)
• In 2010, 1,104 Gwh of 7,575 Gwh (15%) came from thermal power. By 2041, the isolated island option forecast that 3,151 Gwh of 10,493 Gwh (30%) will have to come from thermal generation.
• NL electricity costs are forecast to increase by 21.2% between 2011 and 2016 because of oil price effects. However, this will not remove the need to deal with demand pressing against capacity by either the isolated island option or the interconnected option.
• While a 20% increase in price might be able to get you a 5% reduction in demand and reduce Holyrood to 10% of production in 2010, by 2041, you would need to reduce another 15% of forecast demand or prices would have to be 80% higher to reduce demand by 20% so that Holyrood only represents 10% of production.
• If prices are raised by 80%, we probably will not need the Muskrat Falls infeed either. Problem gone!
• An increase in prices will have a significant and negative adjustment cost to those who are most vulnerable and unable to adjust. While a professional can afford to replace electric heat with a high-efficient wood furnace when the price of electricity increases, his/her parents might not have the financial wherewithal to do it. They may simply have to adjust to the cold. We do not want that!
15

C. H. Howe Pricing Solution –Issues for Further Consideration (2)
• Recall why, in 1985, we adopted an annual Rate Stabilization Plan Adjustment Plan as opposed to a monthly fuel charge adjustment.
• It was to protect consumers from the fluctuating oil prices during the year.
• In July 1, 2011, rates rose by 7% because fuel costs increased from $84/bbl to $103/bbl. That is, prices are going up anyway in the presence of higher oil prices.
• The following excerpt from a letter written to the PUB is particularly enlightening.
• By the early 1980s this monthly surcharge because extremely unpopular and led to mass demonstrations…Since…Holyrod {sic} was primarily used only in the winter months, residents were getting huge electricity bills in the December/March period…the price per unit was double and triple the price per unit for the rest of the year…This surcharge was hitting families at their most vunerable {sic} time during the year…the surcharge varied greatly from month to month and no one had any idea what next month’s bill was likely to be. Andy Wells Mayor of St. John’s October 24, 2001 letter to the PUB
16

Calculating the Supply Price0% 1% 2% 3% 4% 5% 6%
Energy 248,523 248,523 248,523 248,523 248,523 248,523 248,523
Energy Adj. for Inflation 488,503 342,519 246,074 181,064 136,328 104,896 82,346Nominal Costs $6,446 $5,020 $4,209 $3,650 $3,252 $2,959 $2,736Supply Price $13.20 $14.66 $17.10 $20.16 $23.85 $28.21 $33.23
7% 8% 9% 10% 11% 12%
Energy 248,523 248,523 248,523 248,523 248,523 248,523
Energy Adj. for Inflation 65,835 53,505 44,123 36,857 31,138 26,569Nominal Costs $2,559 $2,414 $2,293 $2,189 $2,097 $2,015Supply Price $38.87 $45.12 $51.97 $59.39 $67.35 $75.82
17
It is a policy decision whether 12% is used to the yield an implied starting price for electricity for Muskrat Falls of $7.58cents per Kwh
If 10% were used instead, the starting price would only have to be 5.93 cents per Kwh or an 8% rate of return would imply 4.5 cents per Kwh

Implied Price of Electricity
18
$13.20
$14.66$17.10
$20.16$23.85
$28.21$33.23
$38.87 $45.12
$51.97$59.39
$67.35$75.82
$0.00
$10.00
$20.00
$30.00
$40.00
$50.00
$60.00
$70.00
$80.00
0% 1% 2% 3% 4% 5% 6% 7% 8% 9% 10% 11% 12%
Implies $/MW in
2010
Implied Rate of Return (100% Equity Financed)
Implied Price of Electricity in 2010 ($/MW)
The higher the required return, the higher the monthly electricity cost to the ratepayer and the larger will be the dividend to the shareholders and the better off are taxpayers (more expenditures, lower taxes or reduced public debt).
Within ranges that would still allow NALCOR to borrow, it is a policy decision whether to go with 12% or 10%, for example.
We might want to at least include this as part of our discussion on the Muskrat Falls development.

Cost Comparison – Isolated Island Vs. Muskrat Interconnected (PUB Exhibit 99)
Undiscounted (0%) Discounted at 8%
19
Isolated Muskrat Difference
Total Fixed Charges $1,403 M $1,750 M -$347 M
Total Fuel Expenses $6,049 M $1,170 M $4,879 M
No 2 Fuel $2,731 M $41 M $2,689 M
No 6 Fuel $3,318 M $1,128 M $2,190 M
Total Power Purchases $743 M $3,358 M -$2,615 M
PPA – Other $743 M $676 M $67 M
Muskrat Power Purchase $0 M $2,683 M -$2,683 M
Total Operating $616 M $374 M $241 M
Total Combined $8,810 M $6,652 M $2,158 M
Muskrat Falls has a $2.2 billion present value cost difference at an 8% discount rate that needs to be overcome before the isolated island can be the preferred option.

Comparison of Cost Components –Isolated Island vs. Muskrat Infeed
PV @ 8% Cost – Isolated Island PV @ 8% Cost – Muskrat Infeed
20
$0
$50
$100
$150
$200
$250
$300
$350
2010
2013
2016
2019
2022
2025
2028
2031
2034
2037
2040
2043
2046
2049
2052
2055
2058
2061
2064
2067
Millions of D
ollars (P
V 8%
)
Total Fixed Charges Total Fuel Expenses Total Power Purchase
Total Operating Costs Total Combined Costs
While the isolated Island is $2.2 billion (PV 8%) more expensive, the difference is driven by fuel costs.
Maybe there is an alternative fuel, like natural gas, that can eliminate this differential. Let’s look at this more carefully.
$0
$50
$100
$150
$200
$250
$300
$350
2010
2012
2014
2016
2018
2020
2022
2024
2026
2028
2030
2032
2034
2036
2038
2040
2042
2044
2046
2048
2050
2052
2054
2056
2058
2060
2062
2064
2066
Millions of D
ollars (P
V 8%
)
Total Fixed Charges Total Fuel Expenses Total Power Purchase
Total Operating Costs Total Combined Costs
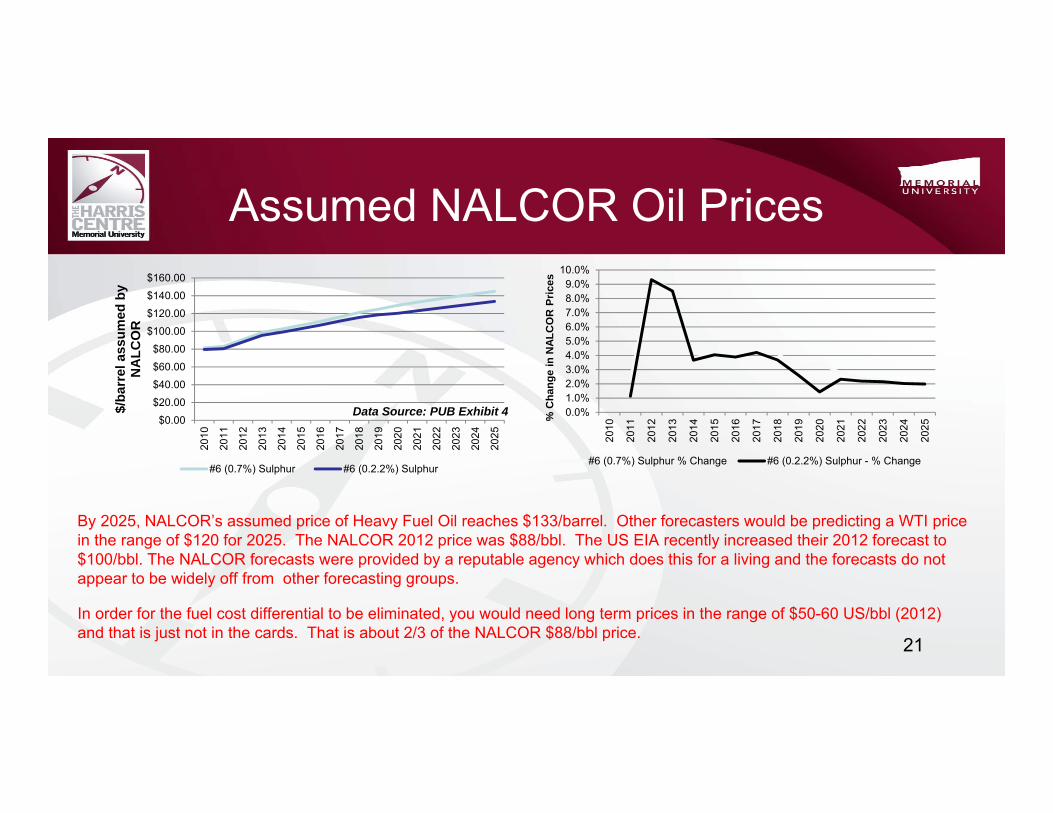
Assumed NALCOR Oil Prices
By 2025, NALCOR’s assumed price of Heavy Fuel Oil reaches $133/barrel. Other forecasters would be predicting a WTI price in the range of $120 for 2025. The NALCOR 2012 price was $88/bbl. The US EIA recently increased their 2012 forecast to $100/bbl. The NALCOR forecasts were provided by a reputable agency which does this for a living and the forecasts do not appear to be widely off from other forecasting groups.
In order for the fuel cost differential to be eliminated, you would need long term prices in the range of $50-60 US/bbl (2012) and that is just not in the cards. That is about 2/3 of the NALCOR $88/bbl price.
Data Source: PUB Exhibit 4
21
$0.00
$20.00
$40.00
$60.00
$80.00
$100.00
$120.00
$140.00
$160.00
2010
2011
2012
2013
2014
2015
2016
2017
2018
2019
2020
2021
2022
2023
2024
2025
$/ba
rrel
ass
umed
by
NA
LCO
R
#6 (0.7%) Sulphur #6 (0.2.2%) Sulphur
0.0%1.0%2.0%3.0%4.0%5.0%6.0%7.0%8.0%9.0%
10.0%
2010
2011
2012
2013
2014
2015
2016
2017
2018
2019
2020
2021
2022
2023
2024
2025
% C
hang
e in
NAL
CO
R P
rices
#6 (0.7%) Sulphur % Change #6 (0.2.2%) Sulphur - % Change

WTI and Brent Crude Oil Prices
WTI and Brent oil prices similar, except for last year. The gap appears to be converging again, so using WTI should be fine as a reference.
Data Source: http://research.stlouisfed.org/fred2/categories/32217
$0.00
$20.00
$40.00
$60.00
$80.00
$100.00
$120.00
$140.00
$160.00
1987
‐05‐01
1988
‐08‐01
1989
‐11‐01
1991
‐02‐01
1992
‐05‐01
1993
‐08‐01
1994
‐11‐01
1996
‐02‐01
1997
‐05‐01
1998
‐08‐01
1999
‐11‐01
2001
‐02‐01
2002
‐05‐01
2003
‐08‐01
2004
‐11‐01
2006
‐02‐01
2007
‐05‐01
2008
‐08‐01
2009
‐11‐01
2011
‐02‐01
US/ba
rrel
WTI Spot Price (Cushing OK) FRED data Brent Crude Price FRED Data
$0.00
$20.00
$40.00
$60.00
$80.00
$100.00
$120.00
$140.00
US/ba
rrel
WTI Spot Price (Cushing OK) FRED data Brent Crude Price FRED Data
22
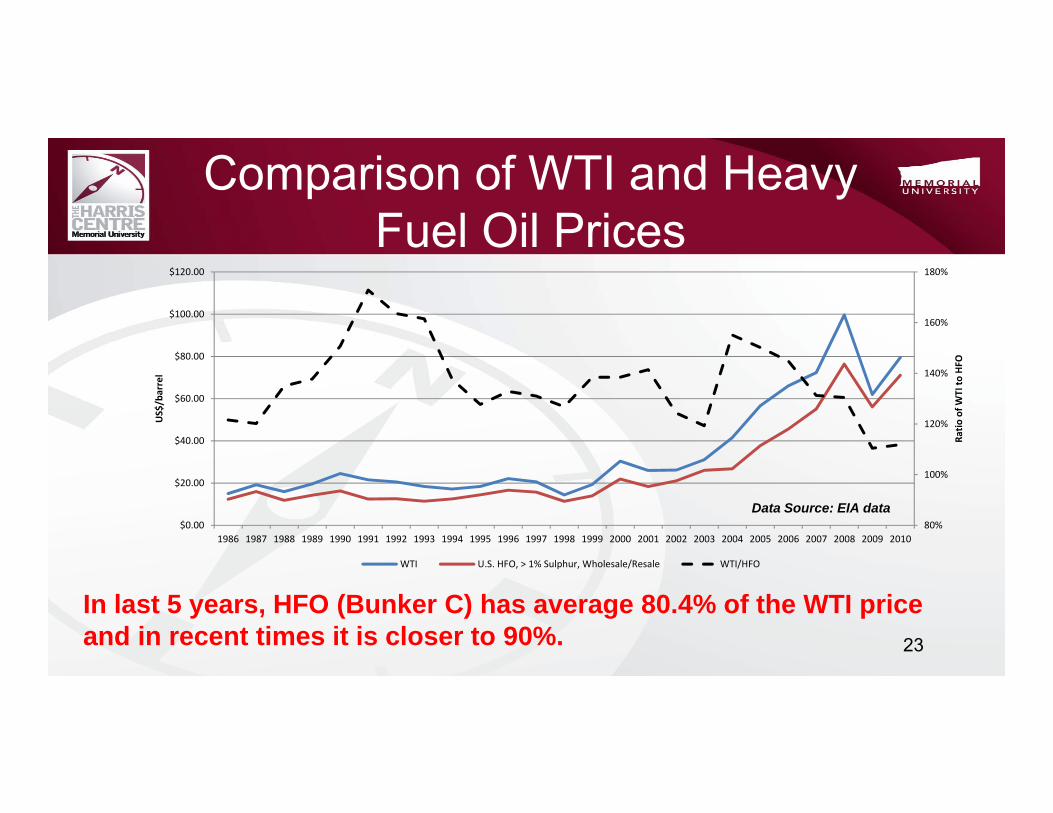
Comparison of WTI and Heavy Fuel Oil Prices
80%
100%
120%
140%
160%
180%
$0.00
$20.00
$40.00
$60.00
$80.00
$100.00
$120.00
1986 1987 1988 1989 1990 1991 1992 1993 1994 1995 1996 1997 1998 1999 2000 2001 2002 2003 2004 2005 2006 2007 2008 2009 2010
Ratio
of W
TI to
HFO
US$/barrel
WTI U.S. HFO, > 1% Sulphur, Wholesale/Resale WTI/HFO
In last 5 years, HFO (Bunker C) has average 80.4% of the WTI price and in recent times it is closer to 90%.
Data Source: EIA data
23
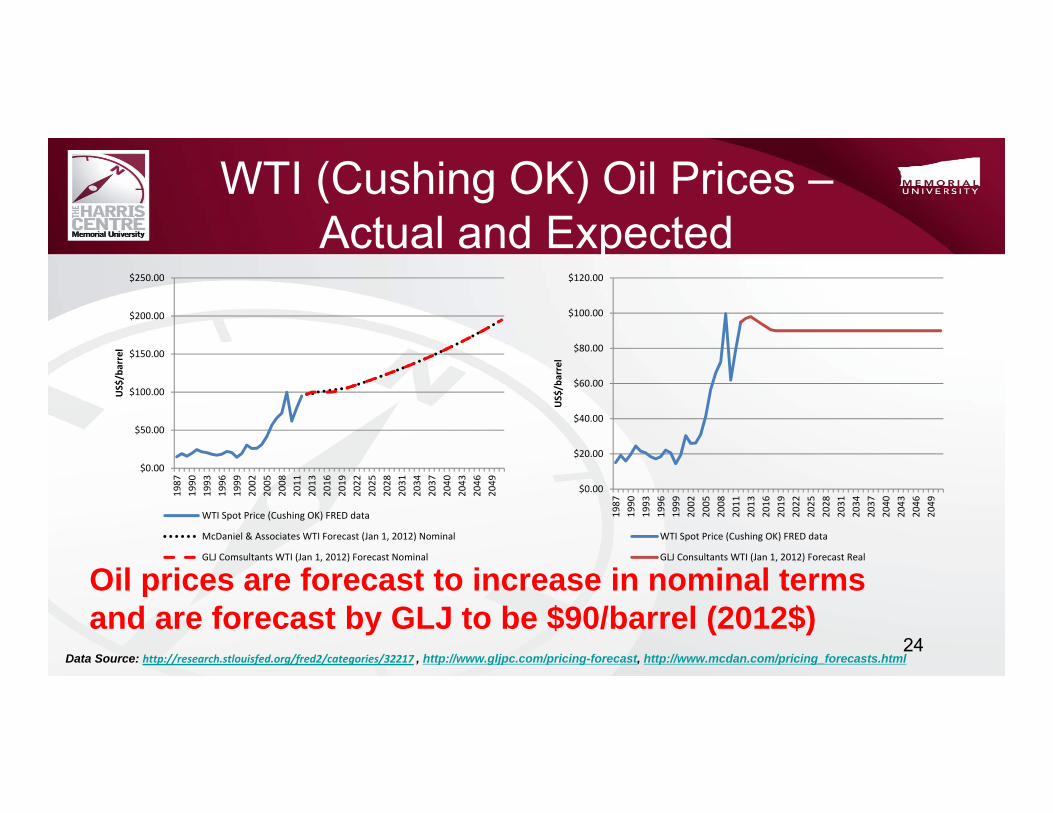
WTI (Cushing OK) Oil Prices –Actual and Expected
Oil prices are forecast to increase in nominal terms and are forecast by GLJ to be $90/barrel (2012$)
Data Source: http://research.stlouisfed.org/fred2/categories/32217 , http://www.gljpc.com/pricing-forecast, http://www.mcdan.com/pricing_forecasts.html
$0.00
$50.00
$100.00
$150.00
$200.00
$250.00
1987
1990
1993
1996
1999
2002
2005
2008
2011
2013
2016
2019
2022
2025
2028
2031
2034
2037
2040
2043
2046
2049
US$/barrel
WTI Spot Price (Cushing OK) FRED data
McDaniel & Associates WTI Forecast (Jan 1, 2012) Nominal
GLJ Comsultants WTI (Jan 1, 2012) Forecast Nominal
$0.00
$20.00
$40.00
$60.00
$80.00
$100.00
$120.00
1987
1990
1993
1996
1999
2002
2005
2008
2011
2013
2016
2019
2022
2025
2028
2031
2034
2037
2040
2043
2046
2049
US$/barrel
WTI Spot Price (Cushing OK) FRED data
GLJ Consultants WTI (Jan 1, 2012) Forecast Real
24

NEB – Estimate of Threshold Prices for New Oil Sands Projects
Economic Threshold (WTI US$ equivalent/bbl)
($2010 US)Mining, Extraction and Upgrading $85-$95
Source: Table 4.2, Canada’s Energy Future (NEB November 22, 2011)
Assuming an after-tax rate of return between 10 and 15%, WTI would have to be in the $80 to $100 (2010$) for a new integrated, mining and upgrading oil sand project to proceed.
25

NEB Reference Price ForecastNEB- Canada’s Energy Future: Energy Supply and Demand Projects to 2035 – Energy Market Assessment (November 22, 2011) (http://www.neb.gc.ca/clf-nsi/rnrgynfmtn/nrgyrprt/nrgyftr/2011/nrgsppldmndprjctn2035-eng.html#fes_1)
Reference price for WTI crude is US$90/bbl in 2011, which increases slowly to $115/bbl ($2010) by 2035
with 2% inflation, 2035 price = $192.44/bbl
Reference price for Henry Hub natural gas price is $4.50/MMBTU and rising to $8.00/MMBTU ($2010)
with 2% inflation, 2035 price = $13.39/MMBTU 26

Henry Hub (LA) Natural Gas Prices –Actual and Expected
Natural gas prices, while currently low, are forecast to increase in nominal and real terms - $6/MMBTU (2012$)
$0.00
$2.00
$4.00
$6.00
$8.00
$10.00
$12.00
$14.00
US$/M
MBT
U
Henry Hub Gulf Coast Natural Gas Spot Price ($/MMBTU) ‐ EIA
Henry Hub McDaniel & Associates Nominal Forecast (Jan 1, 2012) ($/MMBTU)NominalHenry Hub GLJ Consultants Nominal Forecast (Jan 1, 2012) ($/MMBTU) Nominal
$0.00
$2.00
$4.00
$6.00
$8.00
$10.00
1997
2000
2003
2006
2009
2012
2015
2018
2021
2024
2027
2030
2033
2036
2039
2042
2045
2048
2051
US $/MMBT
U
Henry Hub Gulf Coast Natural Gas Spot Price ($/MMBTU) ‐ EIA
Henry Hub GLJ Consultants (Jan 1, 2012) Forecast ($/MMBTU) Real
Data Source: http://www.eia.gov/dnav/ng/ng_pri_fut_s1_a.htm , http://www.gljpc.com/pricing-forecast, http://www.mcdan.com/pricing_forecasts.html27

EIA 2011 Natural Gas Forecast for Henry Hub Prices(2009$)
28
4.48
4.5
4.56
4.57
4.66
4.74
4.76
4.81
4.87
5.05
5.24
5.39
5.58
5.8
5.97
6.1
6.24
6.31
6.35
6.4
6.49
6.62
6.74
6.87
7.07
$0.00
$1.00
$2.00
$3.00
$4.00
$5.00
$6.00
$7.00
$8.00
2011
2012
2013
2014
2015
2016
2017
2018
2019
2020
2021
2022
2023
2024
2025
2026
2027
2028
2029
2030
2031
2032
2033
2034
2035
US $/MMBtu (2009 $)
Data Source: http://www.eia.gov/oiaf/aeo/tablebrowser/#release=AEO2011&subject=0-AEO2011&table=14-AEO2011®ion=0-0&cases=ref2011-d020911a
EIA 2011 energy outlook forecast Henry Hub natural gas prices to reach $7.07/MMBtu by 2035 that would be over $12/MMBtu when inflation is taken into account.
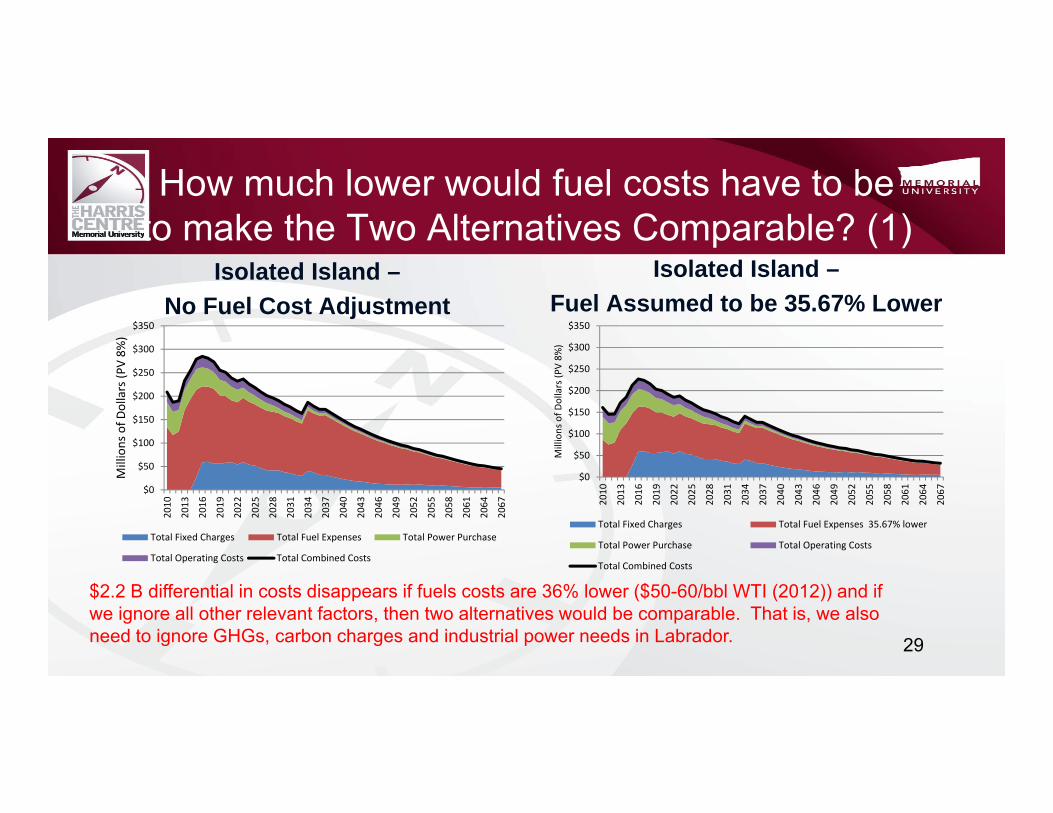
How much lower would fuel costs have to be to make the Two Alternatives Comparable? (1)
Isolated Island –No Fuel Cost Adjustment
Isolated Island –Fuel Assumed to be 35.67% Lower
29
$0
$50
$100
$150
$200
$250
$300
$350
2010
2013
2016
2019
2022
2025
2028
2031
2034
2037
2040
2043
2046
2049
2052
2055
2058
2061
2064
2067
Millions of D
ollars (P
V 8%
)
Total Fixed Charges Total Fuel Expenses Total Power Purchase
Total Operating Costs Total Combined Costs
$0
$50
$100
$150
$200
$250
$300
$350
2010
2013
2016
2019
2022
2025
2028
2031
2034
2037
2040
2043
2046
2049
2052
2055
2058
2061
2064
2067
Millions of D
ollars (P
V 8%
)
Total Fixed Charges Total Fuel Expenses 35.67% lower
Total Power Purchase Total Operating Costs
Total Combined Costs
$2.2 B differential in costs disappears if fuels costs are 36% lower ($50-60/bbl WTI (2012)) and if we ignore all other relevant factors, then two alternatives would be comparable. That is, we also need to ignore GHGs, carbon charges and industrial power needs in Labrador.

How much lower would fuel costs have to be to make the Two Alternatives Comparable? (2)
Muskrat Falls InfeedIsolated Island –Fuel Assumed to be 35.67% Lower
30
$0
$50
$100
$150
$200
$250
$300
$350
2010
2012
2014
2016
2018
2020
2022
2024
2026
2028
2030
2032
2034
2036
2038
2040
2042
2044
2046
2048
2050
2052
2054
2056
2058
2060
2062
2064
2066
Millions of D
ollars (P
V 8%
)
Total Fixed Charges Total Fuel Expenses 35.67% lower
Total Power Purchase Total Operating Costs
Total Combined Costs
$2.2 B differential in costs disappears if fuels costs are 36% lower and if we ignore all other relevant factors, then two alternatives would be comparable. In other words, it is possible, even though unlikely or incredible.
$0
$50
$100
$150
$200
$250
$300
$350
2010
2013
2016
2019
2022
2025
2028
2031
2034
2037
2040
2043
2046
2049
2052
2055
2058
2061
2064
2067
Millions of D
ollars (P
V 8%
)
Total Fixed Charges Total Fuel Expenses Total Power Purchase
Total Operating Costs Total Combined Costs

Comparison of Monthly Oil and Gas Prices
- Ratio around 8.5 prior to 2009
- With ratios of 20 and 30 instead of 6, natural gas could be an attractive fuel source for isolated island
- NEB (2011) expects this ratio to be 14:1 by 2035
$0
$4
$8
$12
$16
$0
$40
$80
$120
$160
1993
‐11‐01
1994
‐10‐01
1995
‐09‐01
1996
‐08‐01
1997
‐07‐01
1998
‐06‐01
1999
‐05‐01
2000
‐04‐01
2001
‐03‐01
2002
‐02‐01
2003
‐01‐01
2003
‐12‐01
2004
‐11‐01
2005
‐10‐01
2006
‐09‐01
2007
‐08‐01
2008
‐07‐01
2009
‐06‐01
2010
‐05‐01
2011
‐04‐01
Natural Gas ‐US $/MMBT
U
Oil Price ‐U
S$/barrel
WTI ‐ Cushiing OK Natural Gas ‐ Henry Hub
- Prices diverge after 2008
- The diversion is explained by the impact of shale gas on supply
- On a BTU basis, we would expect the price of a barrel of oil to be approximately 6 times higher than the price of a MMBTU (or MCF) of natural gas
0
5
10
15
20
25
30
35
1993
‐11‐01
1994
‐09‐01
1995
‐07‐01
1996
‐05‐01
1997
‐03‐01
1998
‐01‐01
1998
‐11‐01
1999
‐09‐01
2000
‐07‐01
2001
‐05‐01
2002
‐03‐01
2003
‐01‐01
2003
‐11‐01
2004
‐09‐01
2005
‐07‐01
2006
‐05‐01
2007
‐03‐01
2008
‐01‐01
2008
‐11‐01
2009
‐09‐01
2010
‐07‐01
2011
‐05‐01
Ratio
($ per barrel to $ pe
r MMBT
U) In last two years, the ratio average 21.3
and reached 31.1 at end of 2011
31

Natural Gas as an Alternative Fuel
• If the prices of the fuels, adjusted for energy content, were identical, then, other than the environmental effects (GHGs), there would be nothing to chose between No 6 (Bunker C) fuel oil and natural gas
• The question would be which is the lowest cost of the energy content delivered to NL
• Of course, one would also have to take into account the different impacts on the environment (GHGs and emissions) 32
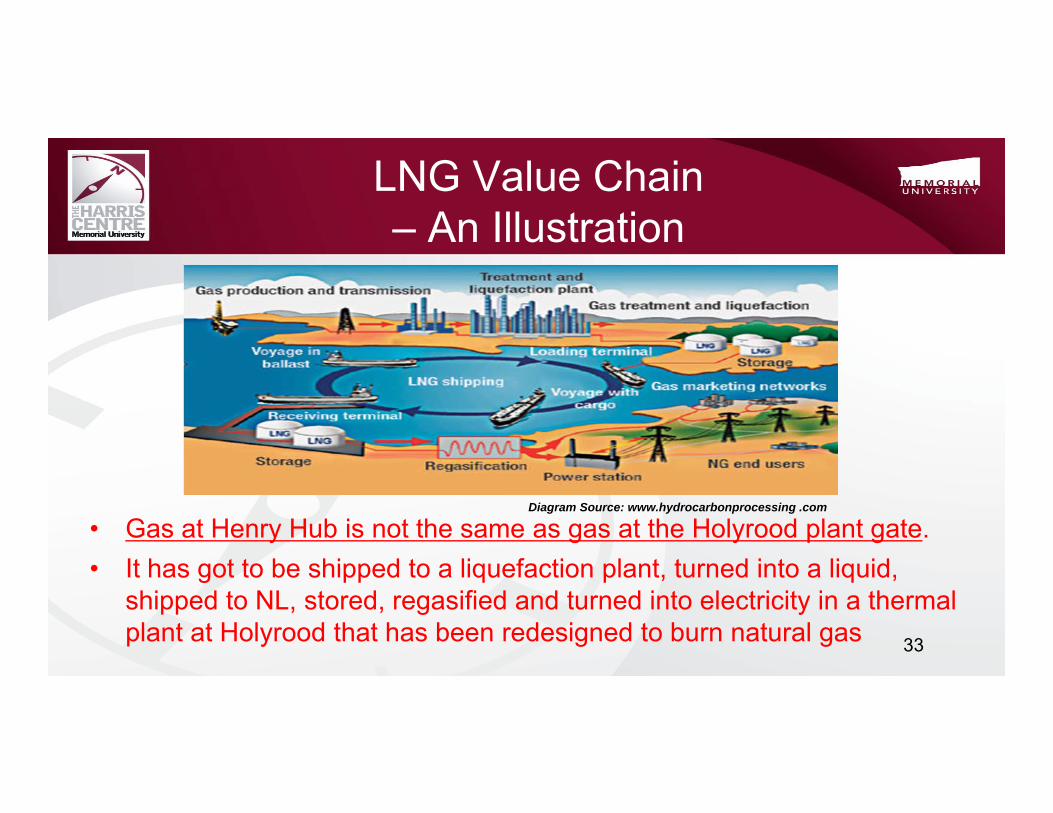
LNG Value Chain – An Illustration
Diagram Source: www.hydrocarbonprocessing .com
• Gas at Henry Hub is not the same as gas at the Holyrood plant gate.• It has got to be shipped to a liquefaction plant, turned into a liquid,
shipped to NL, stored, regasified and turned into electricity in a thermal plant at Holyrood that has been redesigned to burn natural gas 33

LNG prices• LNG spot prices to Asia and Europe were $16.50/MMBTU and
$13.00/MMBTU for October and November deliveries, respectively (NEB – Winter Energy Outlook 2011-2012: Adjusting to Economic Uncertainty Nov 2011)
• The LNG price into Japan Oct 2011 was $16.59/MMBTU (Scotiabank Commodity Price Index Dec 21, 2011)
• Henry Hub prices in Oct and Nov 2011, according to FRED data, were $3.57/MMBTU and $3.24/MMBTU, respectively
• Henry Hub prices are not LNG prices delivered to Holyrood
34

LNG Prices and Demand Expected to Increase
• Germany to phase out all the country's nuclear power plants by 2022 (http://www.bbc.co.uk/news/world-europe-13592208 )
• The Fukushima nuclear power plant accident in Japan in 2011 has increased the demand for LNG
• LNG demand expected to double by 2030 from 30 BCF/day in 2010 to nearly 70 BCF/day - 4.4% annual growth rate – it is expected to increase its share of global gas supply from 9% in 2010 to 15% in 2030 http://www.bp.com/liveassets/bp_internet/globalbp/globalbp_uk_english/reports_and_publications/statistical_energy_review_2011/STAGING/local_assets/pdf/2030_energy_outlook_booklet.pdf
• Global LNG demand was expected to grow by 5.1% to 31.1BCF per day in 2011 (http://energybusinessdaily.com/power/nuclear-power-2/lng-shipping-rates-increases-by-67-as-japan-replaces-nuclear-power/)
35
How low would the price of natural gas have to be to set the cost differential on isolated island alternative? (1)
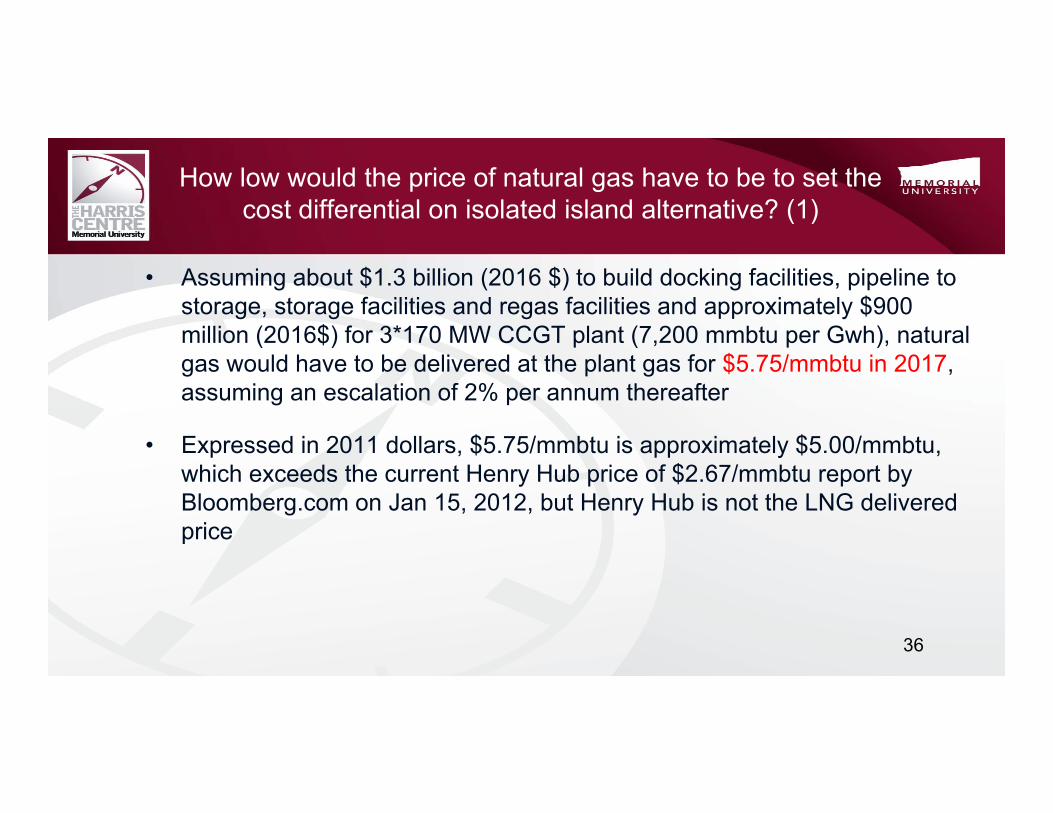
• Assuming about $1.3 billion (2016 $) to build docking facilities, pipeline to storage, storage facilities and regas facilities and approximately $900 million (2016$) for 3*170 MW CCGT plant (7,200 mmbtu per Gwh), natural gas would have to be delivered at the plant gas for $5.75/mmbtu in 2017, assuming an escalation of 2% per annum thereafter
• Expressed in 2011 dollars, $5.75/mmbtu is approximately $5.00/mmbtu, which exceeds the current Henry Hub price of $2.67/mmbtu report by Bloomberg.com on Jan 15, 2012, but Henry Hub is not the LNG delivered price
36
How low would the price of natural gas have to be to set the cost differential on isolated island alternative? (2)
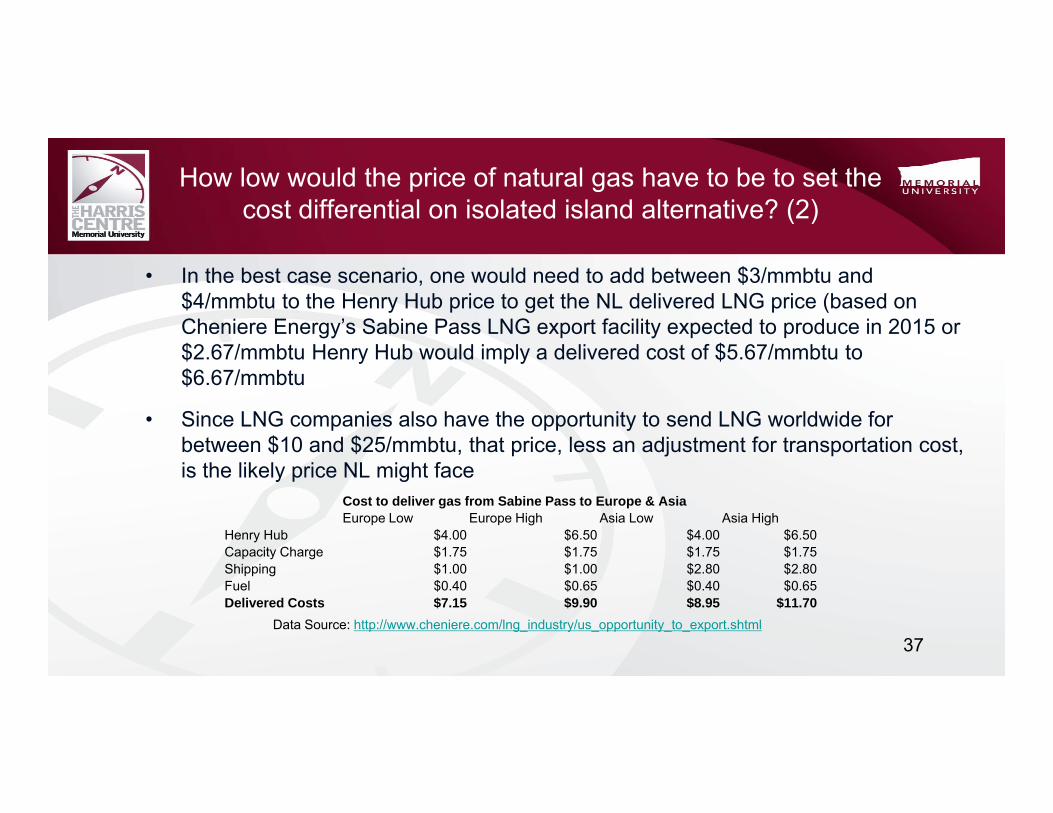
• In the best case scenario, one would need to add between $3/mmbtu and $4/mmbtu to the Henry Hub price to get the NL delivered LNG price (based on Cheniere Energy’s Sabine Pass LNG export facility expected to produce in 2015 or $2.67/mmbtu Henry Hub would imply a delivered cost of $5.67/mmbtu to $6.67/mmbtu
• Since LNG companies also have the opportunity to send LNG worldwide for between $10 and $25/mmbtu, that price, less an adjustment for transportation cost, is the likely price NL might face
37
Cost to deliver gas from Sabine Pass to Europe & AsiaEurope Low Europe High Asia Low Asia High
Henry Hub $4.00 $6.50 $4.00 $6.50Capacity Charge $1.75 $1.75 $1.75 $1.75Shipping $1.00 $1.00 $2.80 $2.80Fuel $0.40 $0.65 $0.40 $0.65Delivered Costs $7.15 $9.90 $8.95 $11.70
Data Source: http://www.cheniere.com/lng_industry/us_opportunity_to_export.shtml
Domestic Natural Gas• There is no domestic gas industry at this point and there are no public plans to develop Grand Bank gas for use at Holyrood
or for an LNG export opportunity or for a pipeline export opportunity.
• There is not even a natural gas royalty in place at this time.
• Natural gas is currently being used for energy on the rigs and for pressure maintenance to enhance oil recovery
• None of the currently available studies on natural gas can be used to definitely say that domestic natural gas is viable to use as a fuel source for producing electricity at Holyrood. (That is, neither the 2001 pipeline study on the PUB website nor any of the Brunneau presentations that were given around 2005-06 can be used to definitely to decide this issue).
• With the expected increase in the LNG market, domestic natural gas will be viable to develop someday, but not in time for consideration as a fuel source to meet NL’s energy needs and maybe, not at the prices that would be needed.
• At $5.00 to $6.00 per MMBTU, domestic fields may not be viable to develop, but at $8 to $10 per MMBTU, they may be.
• In any event, much more study is needed before one can say definitely that this is ok to hope that domestic natural gas will be the cheaper alternative fuel that will avoid the need to build Muskrat Falls.
• Also, with thermal production, we are likely to have to add a value for GHGs. This could add another $50 M to the cost associated with gas (assuming $50/tonne of carbon).
38

Monthly Electricity Bill and Implied Rates for Average Customers
Bills expected to rise from $217/month in 2016 to $246/month in 2030 with interconnected (13.4%) and to $279/month with isolated island (28.6%). Even if nothing is done, average monthly bills will rise by 21.2% between 2011 ($179/month) and 2016 ($217/month) because of oil prices.
Rates expected to rise from 14.3 cents/Kwh in 2016 to 16.2 cents/Kwh in 2030 with interconnected and to 18.4 cents/Kwh with isolated island.
39
$179
$188
$192$206
$217$232
$239
$235 $236 $241 $246$222
$236
$242$257 $270
$279
$50
$100
$150
$200
$250
$300
$350
$400
2000
2002
2004
2006
2008
2010
2012
2014
2016
2018
2020
2022
2024
2026
2028
2030
Mon
thly Bill ($
)
Actual ‐ 1517 kWh Expected ‐ 1517 kWh
Interconnected ‐ 1571 kWh Isolated Island ‐ 1517 kWh
$0.162$0.143
$0.184
$0.080
$0.120
$0.160
$0.200
$0.240
2000
2002
2004
2006
2008
2010
2012
2014
2016
2018
2020
2022
2024
2026
2028
2030
Implied Ce
nts p
er KWh
Actual ‐ 1517 kWh Expected ‐ 1517 kWh
Interconnected‐ 1571 kWh Isolated Island ‐ 1517 kWh
Data Source: GNL, Department of Natural Resources

Shale Gas• In 2008 shale gas delivered between 6-8 bcf/d (10-12% of US demand). Estimated reserves 250-750 tcf, production is
expected to reach 15-20 bcf/d over the next decade. (Petroleum Economist, North American gas’ reversal of fortune, April 2009).
• Potential Gas Committee (June 18, 2009) increased estimated resource base by 35% to 1,836 Tcf of natural gas… highest resource evaluation in the Committee’s 44-year history. Most of the increase…arose from reevaluation of shale-gas plays… shale gas accounts for 616 Tcf (33%).
• Shale gas deposits adjacent to New York & Pennsylvania can turn the area into net exporter of gas (www.PIRA.com 2009).
• Could be 100 years of supplies available. Shale gas production expected to increase from 1.4Tcf (2007) to 4.8 Tcf (2020) (www.api.org).
• Maybe economic to produce at $4-6/MCF, and would constrain NL’s options.
• “Without shale gas, oil and gas prices would rise fivefold by 2050; with shale gas, they would only double” (Neil Reynolds, Globe and Mail Report on Business, January 11, 2012)
• In the short term, lower natural gas prices, which will compete with hydroelectric imports and reduce the revenue potential fromexported hydro electric projects such as Muskrat Falls and Gull Island. In fact, this will have implications for our ability todevelop Gull for the export market (at least in the near term).

Shale Gas –A Relatively New Phenomenon
41Data Source: Potential Gas Committee (2011)

EIA 2011 Natural Gas Production Forecast US
42
0
5
10
15
20
25
30
2008
2009
2010
2011
2012
2013
2014
2015
2016
2017
2018
2019
2020
2021
2022
2023
2024
2025
2026
2027
2028
2029
2030
2031
2032
2033
2034
2035
Dry Gas Produ
ction (TCF)
Associated‐Dissolved Gas Tight Gas Shale Gas Coalbed Methane Other Lower 48 Offshore Alaska
Data Source: http://www.eia.gov/oiaf/aeo/tablebrowser/#release=AEO2011&subject=0-AEO2011&table=14-AEO2011®ion=0-0&cases=ref2011-d020911a
EIA 2011 energy outlook forecast shale production to increase from 4.8 Tcf in 2010 (22.6% of production) to 12.3 Tcf in 2035 (46.5% of production)

Debt Implications of Borrowing Set Principal for 30 Years at Various Interest Rates – Annual Payments
43
$3 B $4 B $5 B $6 B $7 B $8 B
5% $195 M $260 M $325 M $390 M $455 M $520 M
6% $218 M $291 M $363 M $436 M $509 M $581 M
7% $242 M $322 M $403 M $484 M $564 M $645 M
8% $267 M $355 M $444 M $533 M $622 M $711 M
9% $292 M $389 M $487 M $584 M $681 M $779 M
10% $318 M $424 M $530 M $637 M $743 M $849 M
If the one could borrow between $5 billion to fund Muskrat Falls at between 7% and 8% over a 30 year term, then a cash flow of $400 and $450 million would be needed.
If the cash flow from the project exceed these numbers, then the project will able you pay off the interest and principal and still have extra money left over to retire other provincial debt, to fund other public services or to reduce taxes.
A loan guarantee that reduces your rate by 2 percentage points would save $80 per year and result in lower required rates or a higher return to equity
Is Debt a Problem? – How Much Net Cash Flow Can be expected at $75.82/Mwh?
• The average net cash flow, without taking into account the extra revenue from the residual energy is in the order of $550 per year. This could support $5 B in debt at 8% and still have about $100 M per year for other expenditures
• The residual energy at the prices used by NALCOR (7.58 cents per Kwh), would give an extra $60 M per year and about $30 M per year if the energy were sold for 4 cents per Kwh.
• So it is unlikely that the debt implications of Muskrat Falls will create an extra burden on the taxpayers.
44

Lower Churchill Project• Lower Churchill is about more than the export of power or the reduction in
GHGs
• It serves an enabling function
• Without connection to the North American grid, other energy developments will not be possible.
• This would include the onshore wind potential on the island and Labrador
• It would include the development of alternative energies for anything but research and development initiatives
• It may remove one avenue through which temporarily stranded natural gas can be monetized through gas-to-wire, but not likely. This is more likely an LNG to Europe at some point further into the future

Conclusion (1)• On the balance of probabilities, it seems reasonable to assume that the Muskrat Falls is the best
option for the province.
• While there are scenarios that can turn this around, they require assumptions that strain credibility. A long term price of oil between $50 and $60 per barrel is not credible.
• Not extending the PUB public review creates an air of suspicion that can be avoided. If I were asked, I would recommend that sufficient time be provided to fully assess this project.
• You do not have to force a benefit on someone, but you may have to explain it so that they fully understand the nature and extent of the benefit.
• Assuming that the rate of return does not fall below a level to permit borrowing at some particular debt servicing level, it is a public policy decision whether to accept a lower return for taxpayers in order to provide a lower price to ratepayers.
46

Conclusion (2)• Without the extra energy made available by Muskrat Falls, there is serious questions whether or not
the mining projects expected in Labrador within the next 10 years can proceed. Currently, we do not have sufficient recall power. If all these projects proceed as expected, we may need another 400 to 500 MW of power. This may require the development of additional resources on the island (hydro, wind, etc.)
• The export link increases the chance that alternative energy resources on the island (such as wind) will get developed.
• Finally, the energy is needed and we should not be afraid to make a fully informed decision to proceed if it is in our best option to proceed. This remain true even if we can point to decisions in the past, like the Upper Churchill contract, that was not in our interest.
• We should learn from our history but not be slaves to it.
Thank You
47


