27
Mutual Fund Investments are subject to market risks, read all scheme related documents carefully
Mutual Fund Investments are subject to market risks, read all scheme related documents carefully
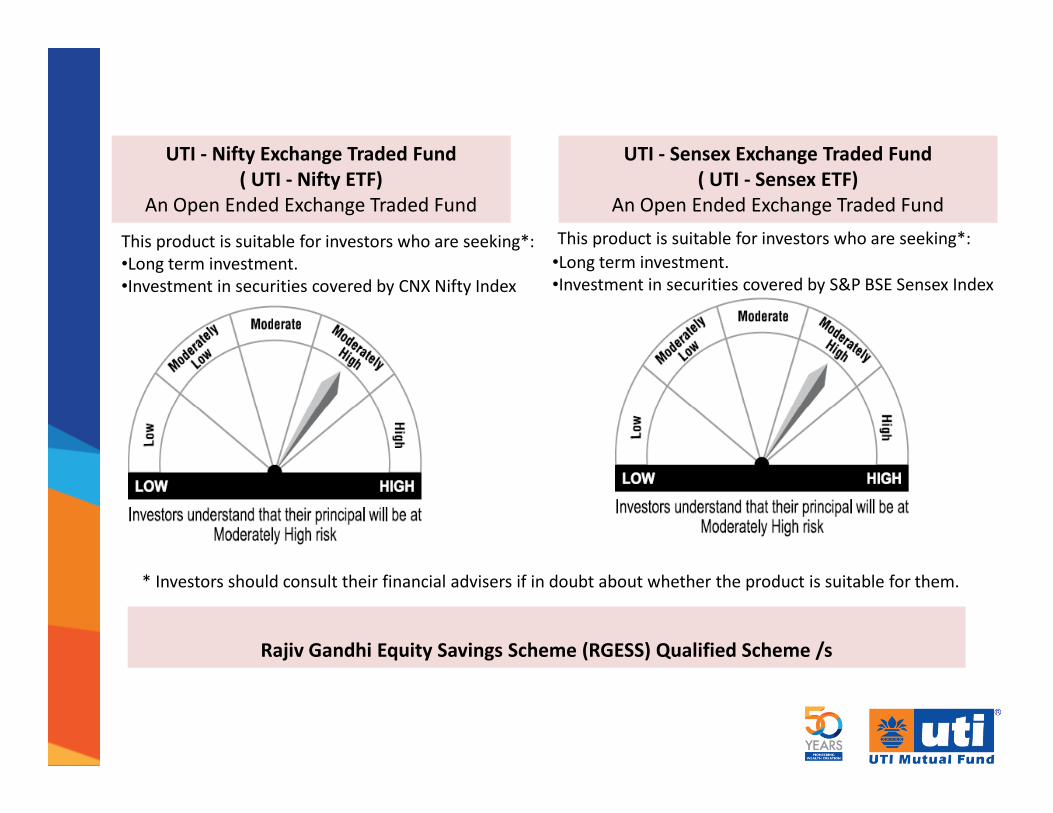
This product is suitable for investors who are seeking*:
•Long term investment.
•Investment in securities covered by CNX Nifty Index
UTI - Nifty Exchange Traded Fund
( UTI - Nifty ETF)
An Open Ended Exchange Traded Fund
UTI - Sensex Exchange Traded Fund
( UTI - Sensex ETF)
An Open Ended Exchange Traded Fund
This product is suitable for investors who are seeking*:
•Long term investment.
•Investment in securities covered by S&P BSE Sensex Index
Rajiv Gandhi Equity Savings Scheme (RGESS) Qualified Scheme /s
* Investors should consult their financial advisers if in doubt about whether the product is suitable for them.
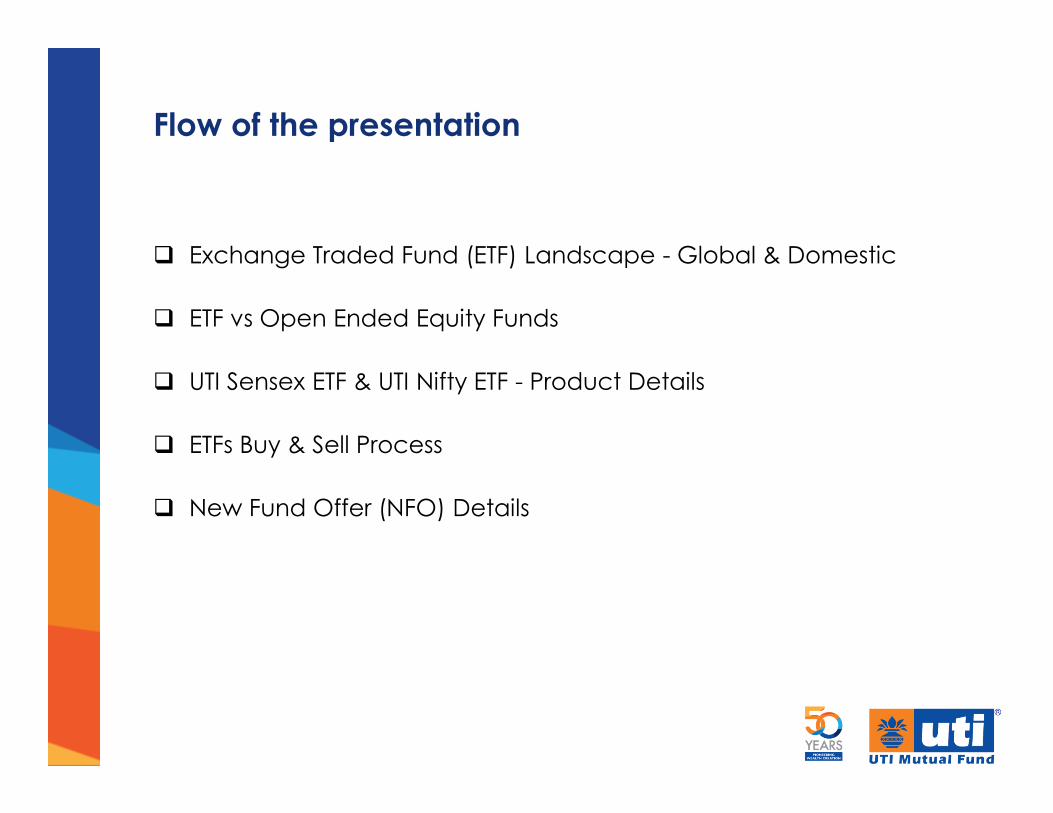
Flow of the presentation
� Exchange Traded Fund (ETF) Landscape - Global & Domestic
� ETF vs Open Ended Equity Funds
� UTI Sensex ETF & UTI Nifty ETF - Product Details
� ETFs Buy & Sell Process
� New Fund Offer (NFO) Details
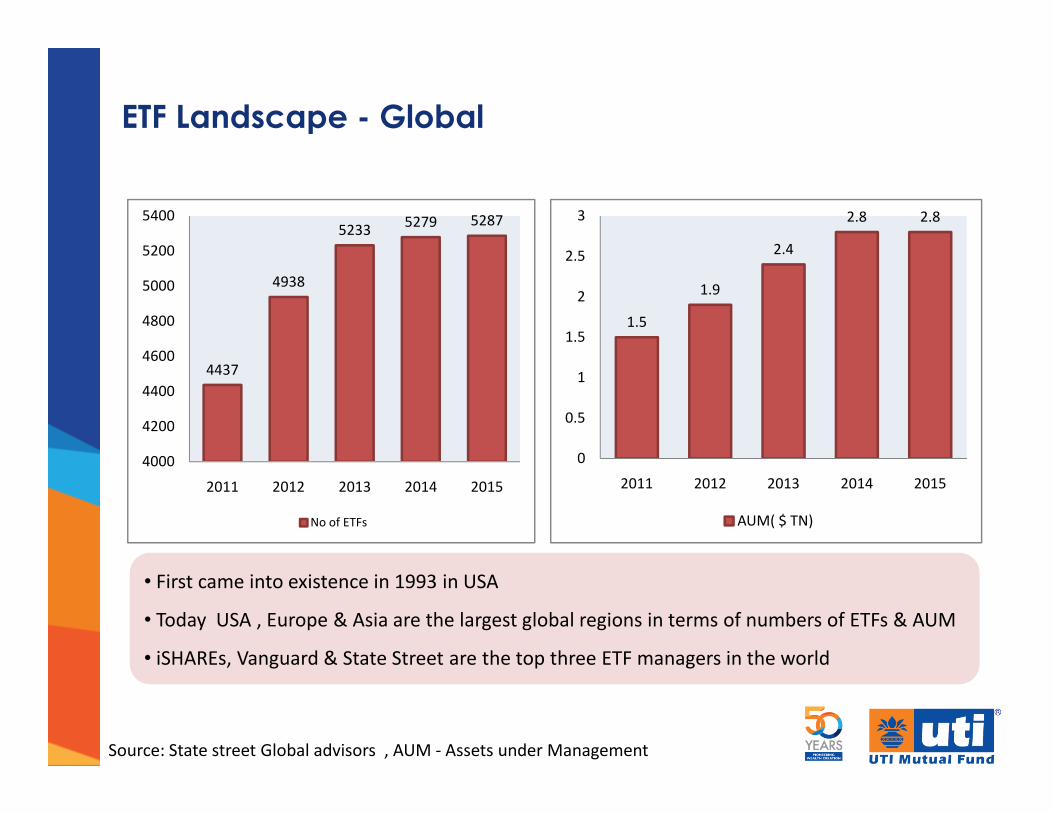
ETF Landscape - Global
4437
4938
52335279 5287
4400
4600
4800
5000
5200
5400
1.5
1.9
2.4
2.8 2.8
1
1.5
2
2.5
3
4000
4200
2011 2012 2013 2014 2015
No of ETFs
0
0.5
2011 2012 2013 2014 2015
AUM( $ TN)
• First came into existence in 1993 in USA
• Today USA , Europe & Asia are the largest global regions in terms of numbers of ETFs & AUM
• iSHAREs, Vanguard & State Street are the top three ETF managers in the world
Source: State street Global advisors , AUM - Assets under Management
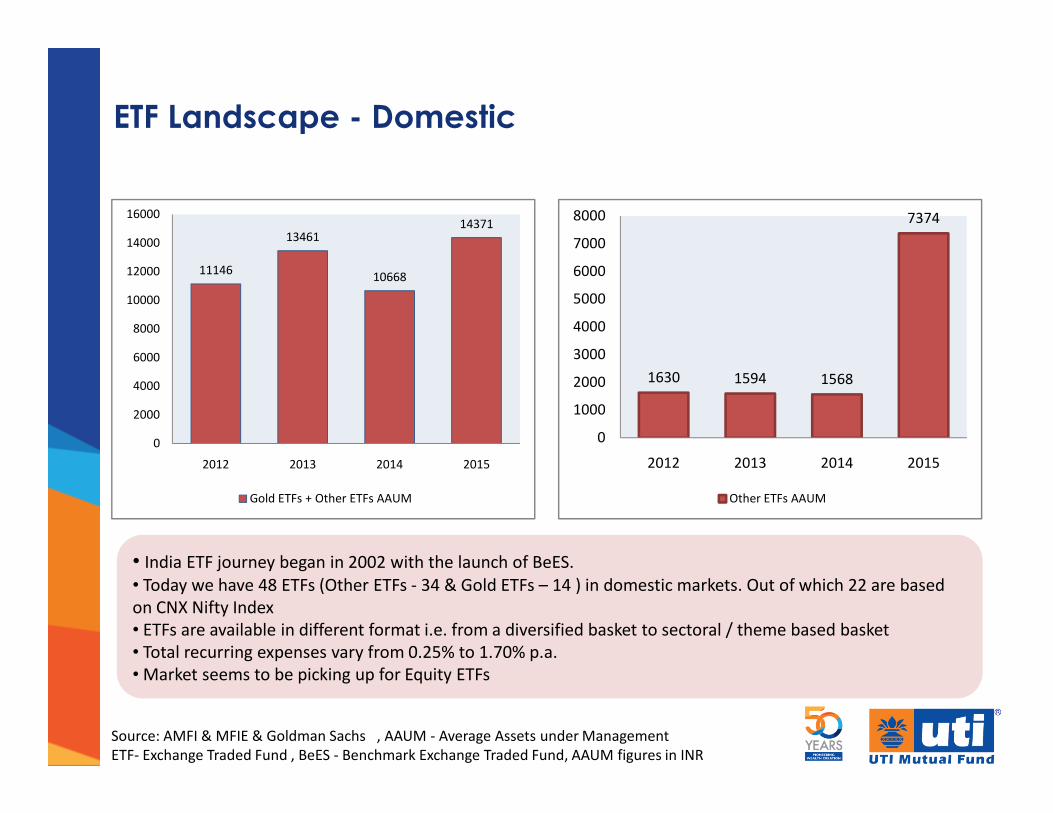
ETF Landscape - Domestic
1630 1594 1568
7374
1000
2000
3000
4000
5000
6000
7000
8000
11146
13461
10668
14371
2000
4000
6000
8000
10000
12000
14000
16000
0
1000
2012 2013 2014 2015
Other ETFs AAUM
• India ETF journey began in 2002 with the launch of BeES.
• Today we have 48 ETFs (Other ETFs - 34 & Gold ETFs – 14 ) in domestic markets. Out of which 22 are based
on CNX Nifty Index
• ETFs are available in different format i.e. from a diversified basket to sectoral / theme based basket
• Total recurring expenses vary from 0.25% to 1.70% p.a.
• Market seems to be picking up for Equity ETFs
Source: AMFI & MFIE & Goldman Sachs , AAUM - Average Assets under Management
ETF- Exchange Traded Fund , BeES - Benchmark Exchange Traded Fund, AAUM figures in INR
0
2000
2012 2013 2014 2015
Gold ETFs + Other ETFs AAUM
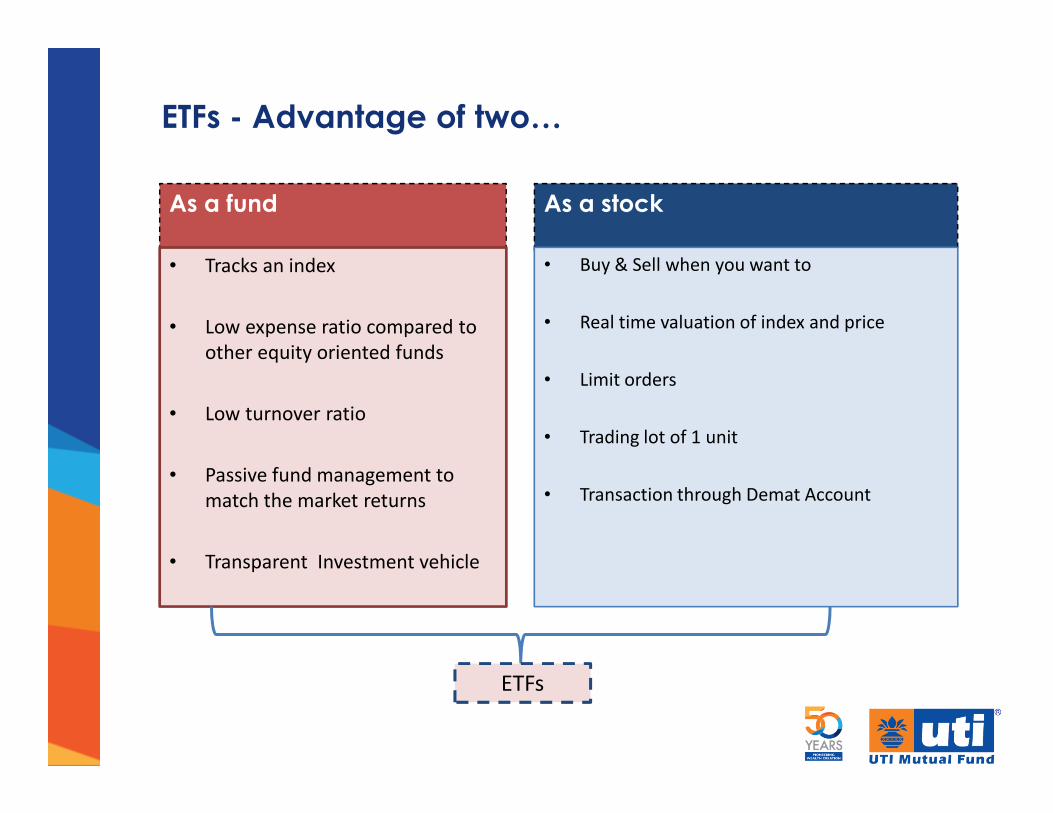
ETFs - Advantage of two…
As a fund
• Tracks an index
• Low expense ratio compared to
other equity oriented funds
• Low turnover ratio
As a stock
• Buy & Sell when you want to
• Real time valuation of index and price
• Limit orders
• Low turnover ratio
• Passive fund management to
match the market returns
• Transparent Investment vehicle
• Trading lot of 1 unit
• Transaction through Demat Account
ETFs
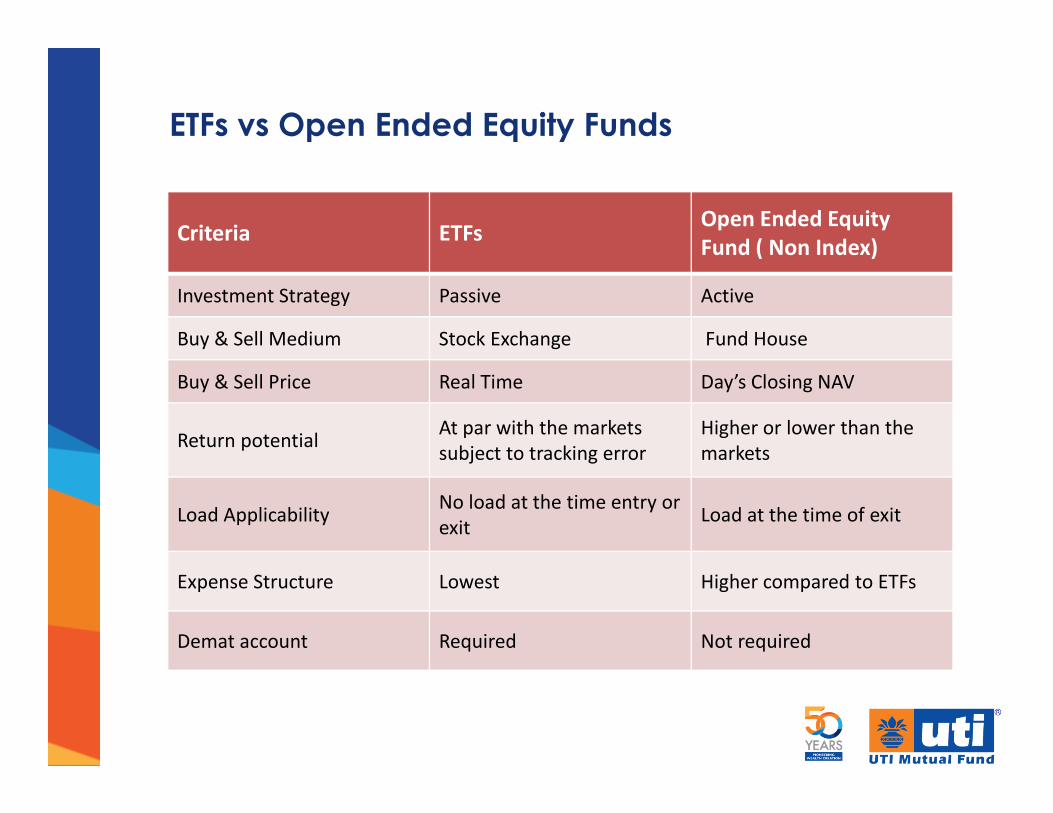
ETFs vs Open Ended Equity Funds
Criteria ETFsOpen Ended Equity
Fund ( Non Index)
Investment Strategy Passive Active
Buy & Sell Medium Stock Exchange Fund House
Buy & Sell Price Real Time Day’s Closing NAV
Return potentialAt par with the markets
subject to tracking error
Higher or lower than the
markets
Load Applicability No load at the time entry or
exitLoad at the time of exit
Expense Structure Lowest Higher compared to ETFs
Demat account Required Not required
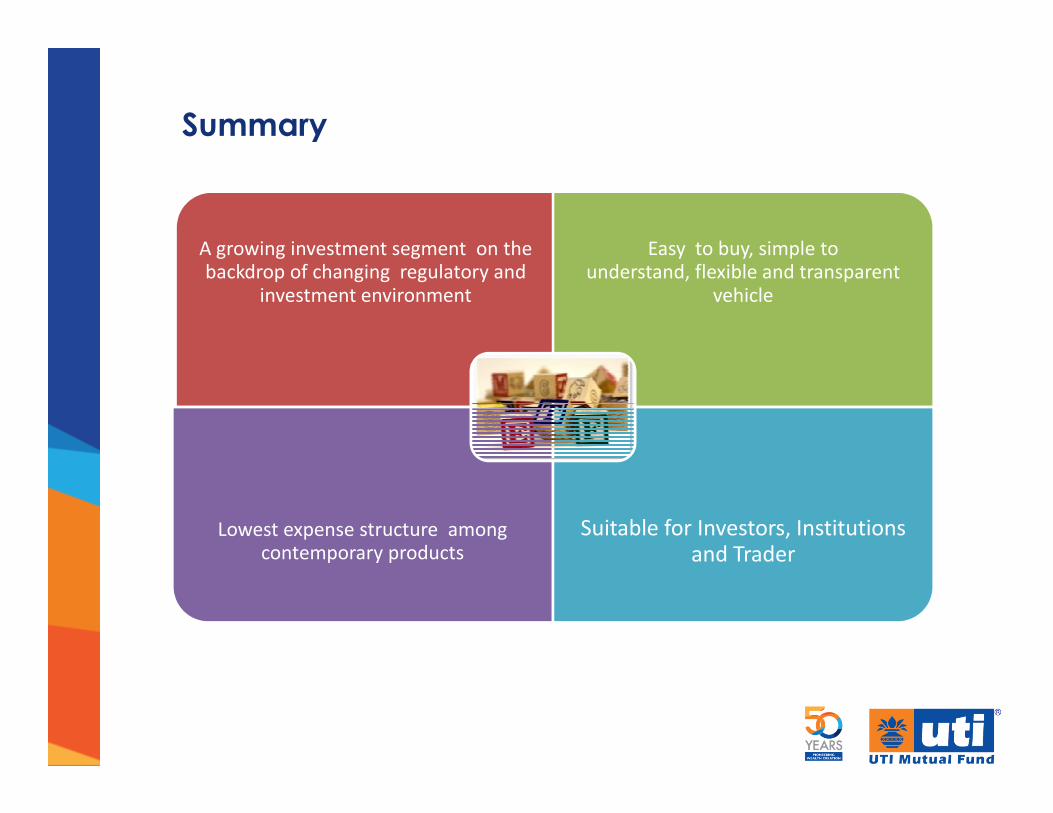
Summary
A growing investment segment on the backdrop of changing regulatory and
investment environment
Easy to buy, simple to understand, flexible and transparent
vehicle
Lowest expense structure among contemporary products
Suitable for Investors, Institutions and Trader

Presenting
UTI - Nifty Exchange
Traded Fund
New Fund Offer opens on : Monday , August 24, 2015
New Fund Offer closes on : Wednesday , August 26, 2015
Trading on Stock Exchange : September 03, 2015
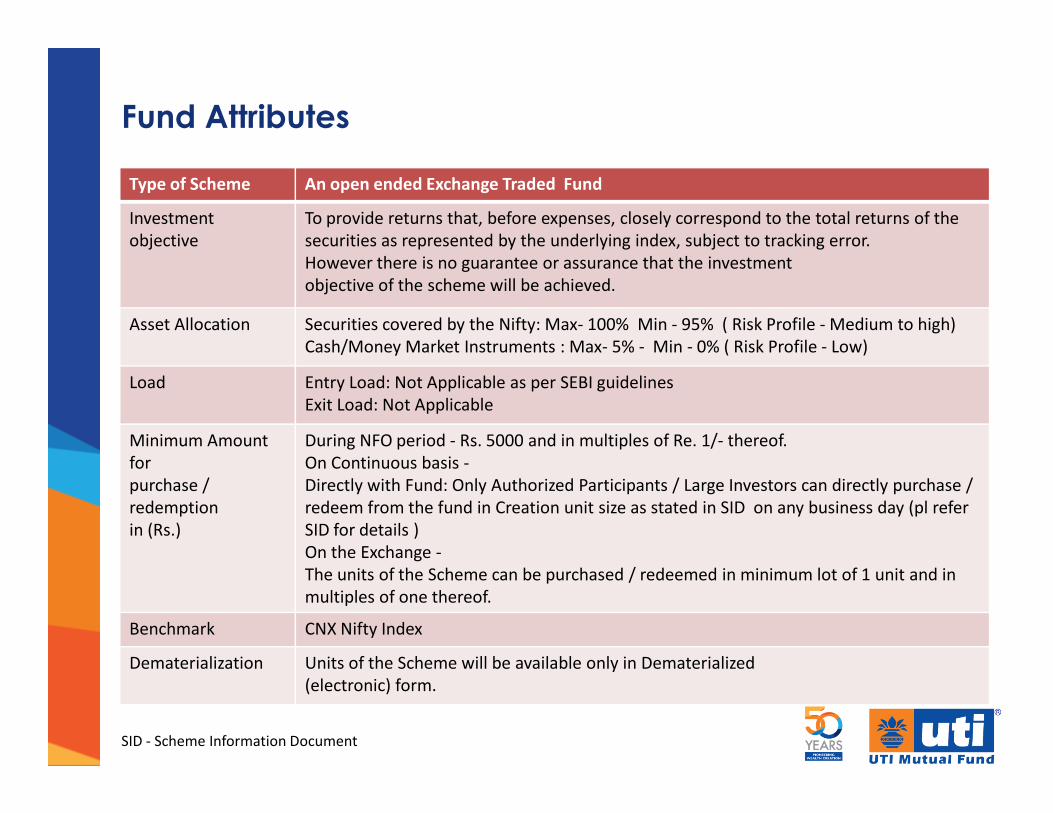
Fund Attributes
Type of Scheme An open ended Exchange Traded Fund
Investment
objective
To provide returns that, before expenses, closely correspond to the total returns of the
securities as represented by the underlying index, subject to tracking error.
However there is no guarantee or assurance that the investment
objective of the scheme will be achieved.
Asset Allocation Securities covered by the Nifty: Max- 100% Min - 95% ( Risk Profile - Medium to high)
Cash/Money Market Instruments : Max- 5% - Min - 0% ( Risk Profile - Low)
Load Entry Load: Not Applicable as per SEBI guidelines
Exit Load: Not ApplicableExit Load: Not Applicable
Minimum Amount
for
purchase /
redemption
in (Rs.)
During NFO period - Rs. 5000 and in multiples of Re. 1/- thereof.
On Continuous basis -
Directly with Fund: Only Authorized Participants / Large Investors can directly purchase /
redeem from the fund in Creation unit size as stated in SID on any business day (pl refer
SID for details )
On the Exchange -
The units of the Scheme can be purchased / redeemed in minimum lot of 1 unit and in
multiples of one thereof.
Benchmark CNX Nifty Index
Dematerialization Units of the Scheme will be available only in Dematerialized
(electronic) form.
SID - Scheme Information Document
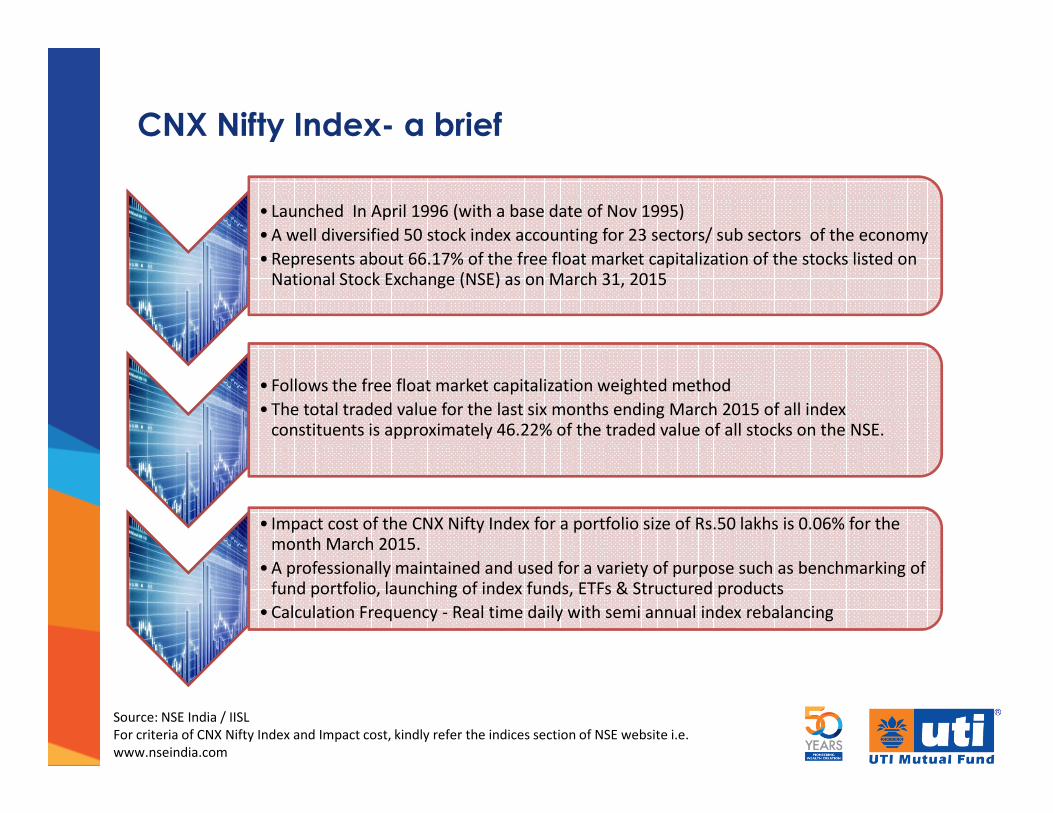
CNX Nifty Index- a brief
• Launched In April 1996 (with a base date of Nov 1995)
• A well diversified 50 stock index accounting for 23 sectors/ sub sectors of the economy
• Represents about 66.17% of the free float market capitalization of the stocks listed on National Stock Exchange (NSE) as on March 31, 2015
• Follows the free float market capitalization weighted method
• The total traded value for the last six months ending March 2015 of all index • The total traded value for the last six months ending March 2015 of all index constituents is approximately 46.22% of the traded value of all stocks on the NSE.
• Impact cost of the CNX Nifty Index for a portfolio size of Rs.50 lakhs is 0.06% for the month March 2015.
• A professionally maintained and used for a variety of purpose such as benchmarking of fund portfolio, launching of index funds, ETFs & Structured products
• Calculation Frequency - Real time daily with semi annual index rebalancing
Source: NSE India / IISL
For criteria of CNX Nifty Index and Impact cost, kindly refer the indices section of NSE website i.e.
www.nseindia.com
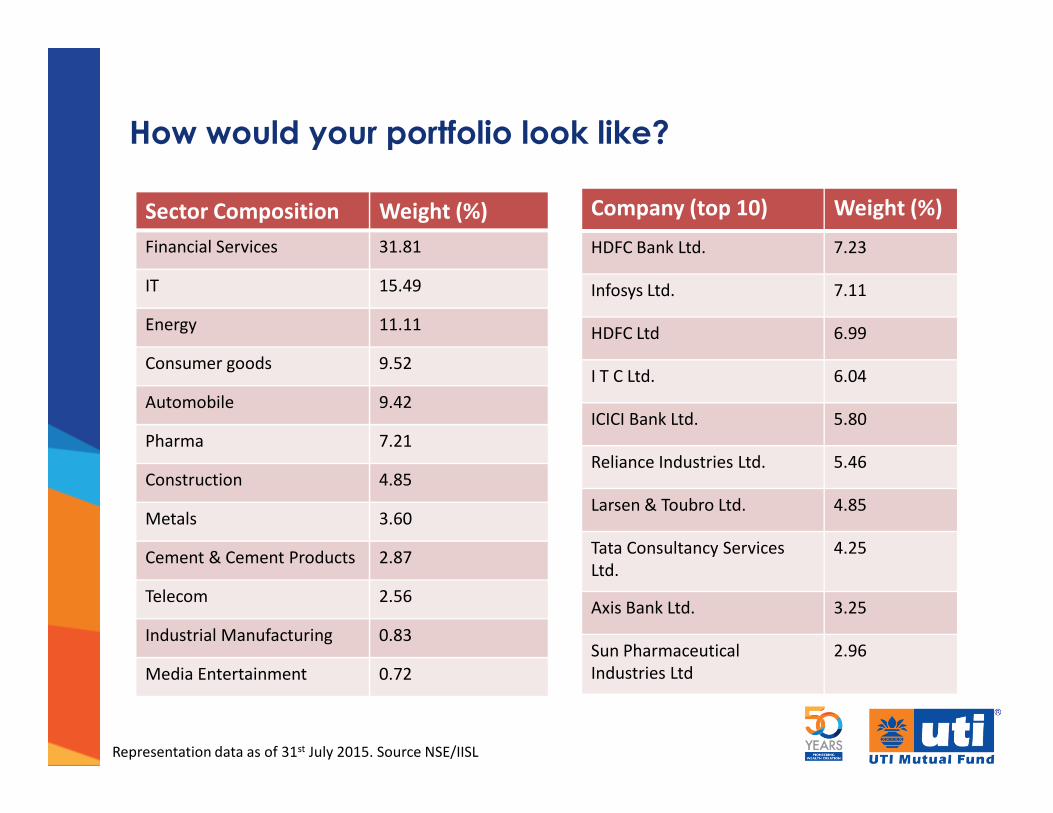
How would your portfolio look like?
Sector Composition Weight (%)
Financial Services 31.81
IT 15.49
Energy 11.11
Consumer goods 9.52
Automobile 9.42
Company (top 10) Weight (%)
HDFC Bank Ltd. 7.23
Infosys Ltd. 7.11
HDFC Ltd 6.99
I T C Ltd. 6.04
Automobile 9.42
Pharma 7.21
Construction 4.85
Metals 3.60
Cement & Cement Products 2.87
Telecom 2.56
Industrial Manufacturing 0.83
Media Entertainment 0.72
ICICI Bank Ltd. 5.80
Reliance Industries Ltd. 5.46
Larsen & Toubro Ltd. 4.85
Tata Consultancy Services
Ltd.
4.25
Axis Bank Ltd. 3.25
Sun Pharmaceutical
Industries Ltd
2.96
Representation data as of 31st July 2015. Source NSE/IISL
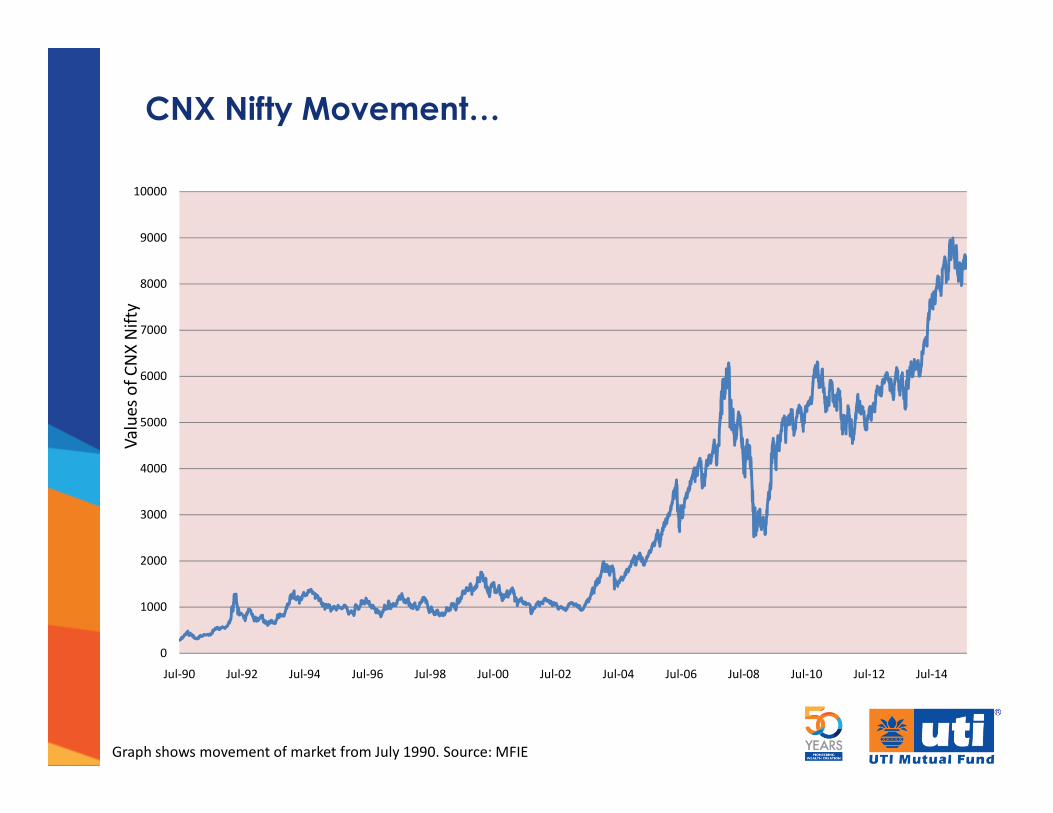
CNX Nifty Movement…V
alu
es
of
CN
X N
ifty
6000
7000
8000
9000
10000
Va
lue
s o
f C
NX
Nif
ty
Graph shows movement of market from July 1990. Source: MFIE
0
1000
2000
3000
4000
5000
Jul-90 Jul-92 Jul-94 Jul-96 Jul-98 Jul-00 Jul-02 Jul-04 Jul-06 Jul-08 Jul-10 Jul-12 Jul-14
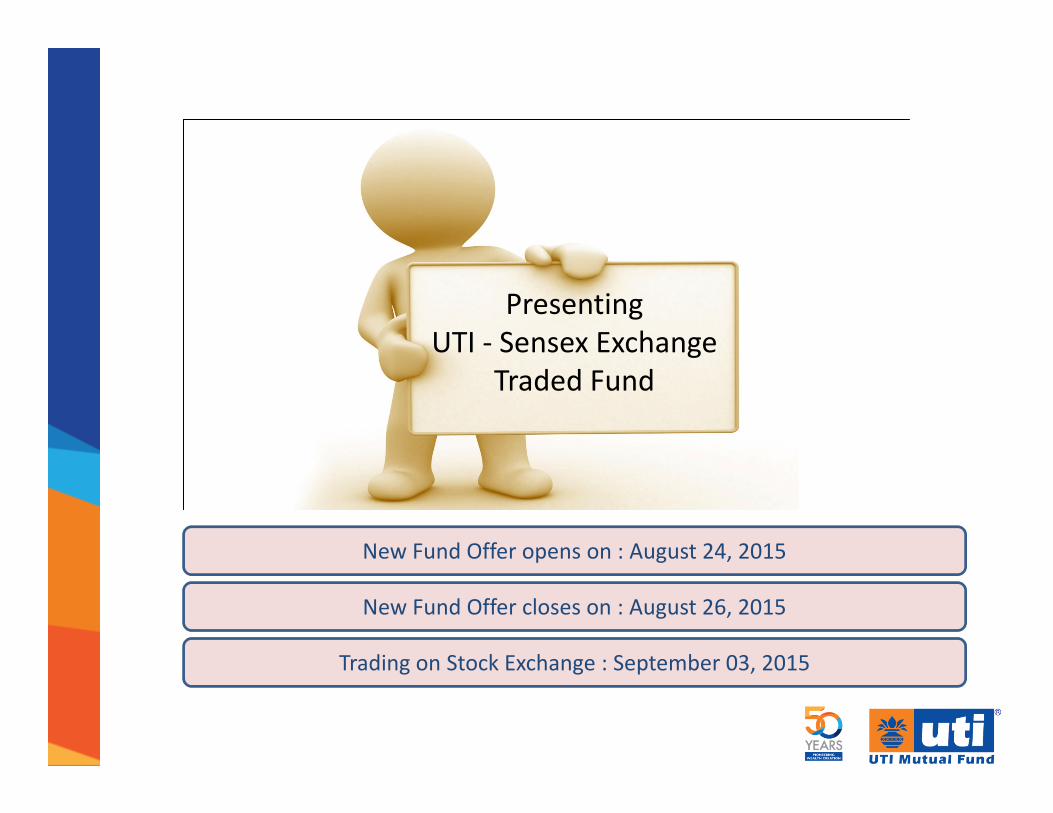
Presenting
UTI - Sensex Exchange
Traded Fund
New Fund Offer closes on : August 26, 2015
New Fund Offer opens on : August 24, 2015
Trading on Stock Exchange : September 03, 2015
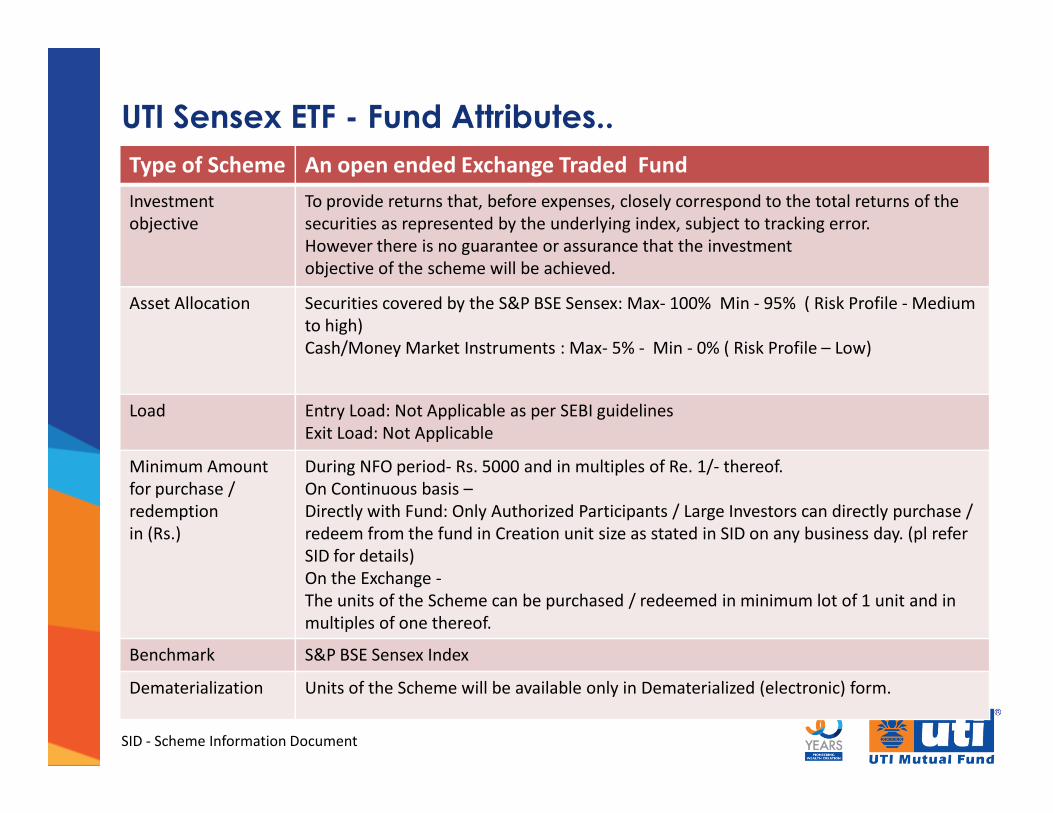
UTI Sensex ETF - Fund Attributes..
Type of Scheme An open ended Exchange Traded Fund
Investment
objective
To provide returns that, before expenses, closely correspond to the total returns of the
securities as represented by the underlying index, subject to tracking error.
However there is no guarantee or assurance that the investment
objective of the scheme will be achieved.
Asset Allocation Securities covered by the S&P BSE Sensex: Max- 100% Min - 95% ( Risk Profile - Medium
to high)
Cash/Money Market Instruments : Max- 5% - Min - 0% ( Risk Profile – Low)
Load Entry Load: Not Applicable as per SEBI guidelinesLoad Entry Load: Not Applicable as per SEBI guidelines
Exit Load: Not Applicable
Minimum Amount
for purchase /
redemption
in (Rs.)
During NFO period- Rs. 5000 and in multiples of Re. 1/- thereof.
On Continuous basis –
Directly with Fund: Only Authorized Participants / Large Investors can directly purchase /
redeem from the fund in Creation unit size as stated in SID on any business day. (pl refer
SID for details)
On the Exchange -
The units of the Scheme can be purchased / redeemed in minimum lot of 1 unit and in
multiples of one thereof.
Benchmark S&P BSE Sensex Index
Dematerialization Units of the Scheme will be available only in Dematerialized (electronic) form.
SID - Scheme Information Document
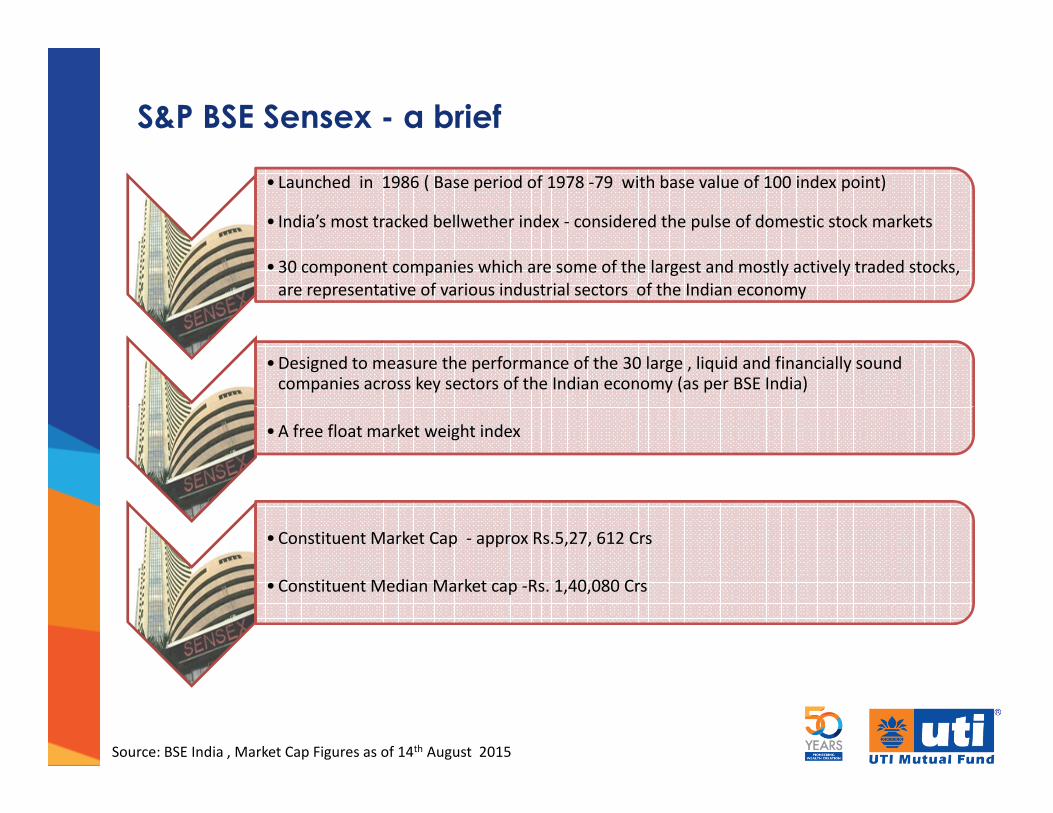
S&P BSE Sensex - a brief
• Launched in 1986 ( Base period of 1978 -79 with base value of 100 index point)
• India’s most tracked bellwether index - considered the pulse of domestic stock markets
• 30 component companies which are some of the largest and mostly actively traded stocks,
are representative of various industrial sectors of the Indian economy
• Designed to measure the performance of the 30 large , liquid and financially sound companies across key sectors of the Indian economy (as per BSE India)
• A free float market weight index
• Constituent Market Cap - approx Rs.5,27, 612 Crs
• Constituent Median Market cap -Rs. 1,40,080 Crs
Source: BSE India , Market Cap Figures as of 14th August 2015
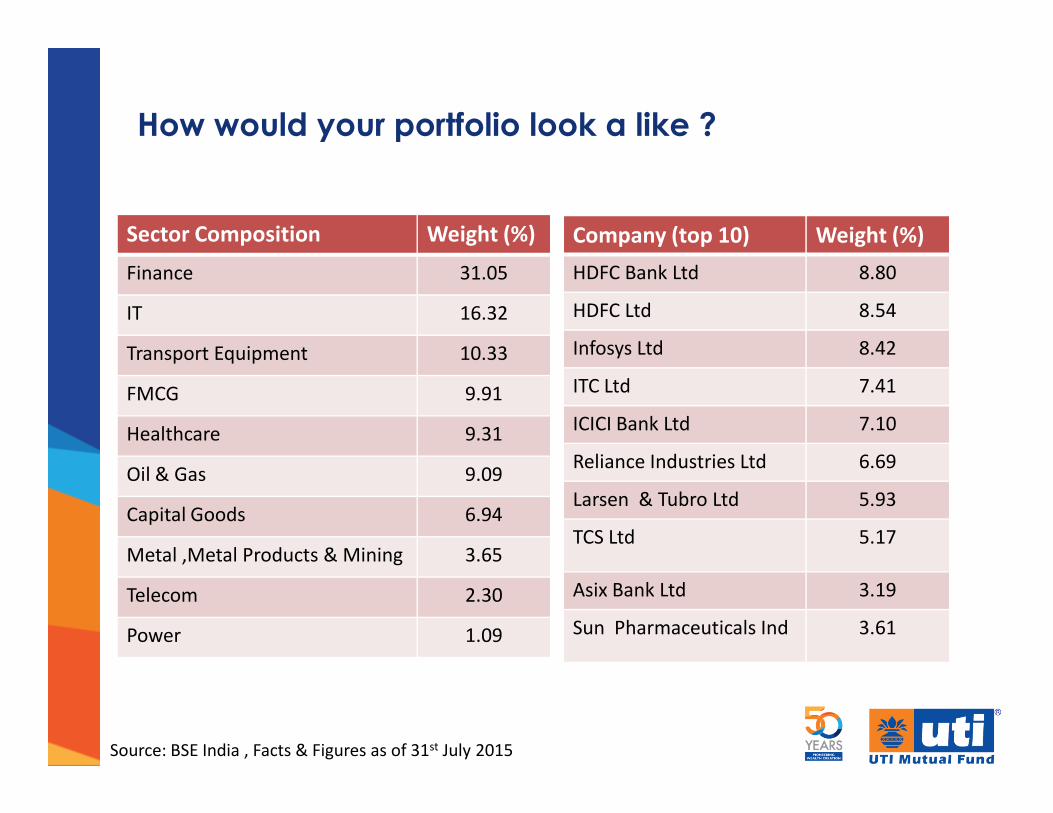
How would your portfolio look a like ?
Sector Composition Weight (%)
Finance 31.05
IT 16.32
Transport Equipment 10.33
FMCG 9.91
Company (top 10) Weight (%)
HDFC Bank Ltd 8.80
HDFC Ltd 8.54
Infosys Ltd 8.42
ITC Ltd 7.41
Healthcare 9.31
Oil & Gas 9.09
Capital Goods 6.94
Metal ,Metal Products & Mining 3.65
Telecom 2.30
Power 1.09
ICICI Bank Ltd 7.10
Reliance Industries Ltd 6.69
Larsen & Tubro Ltd 5.93
TCS Ltd 5.17
Asix Bank Ltd 3.19
Sun Pharmaceuticals Ind 3.61
Source: BSE India , Facts & Figures as of 31st July 2015
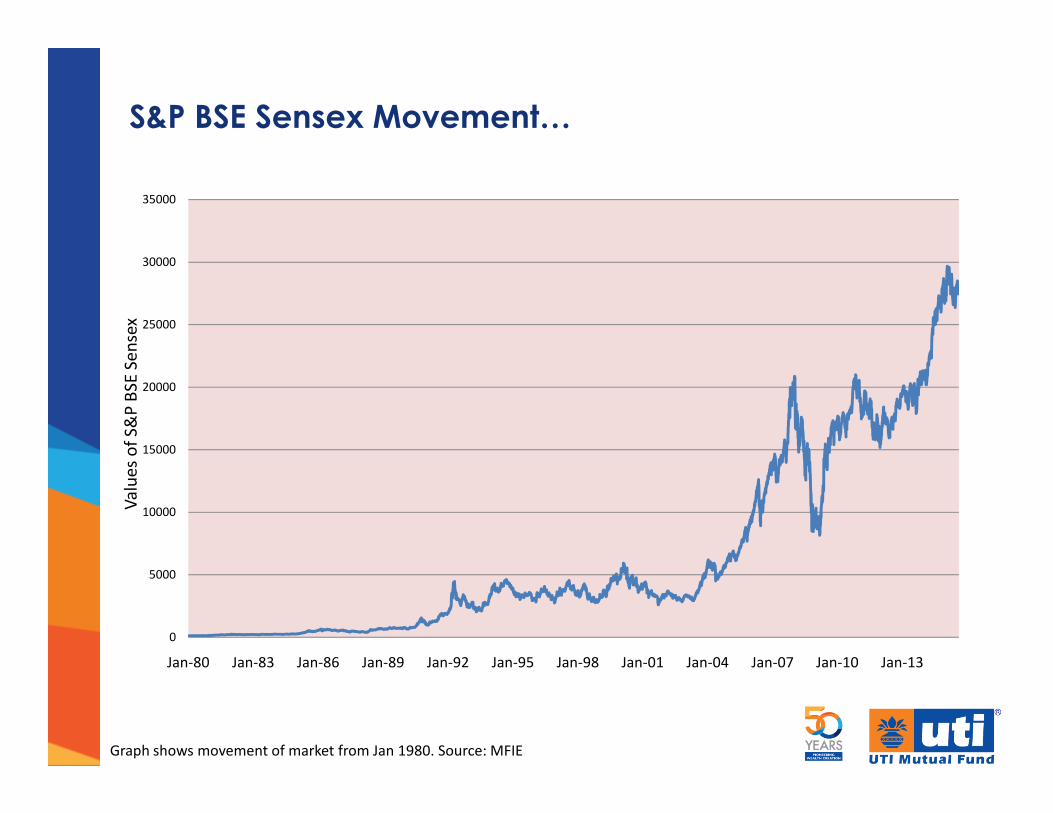
S&P BSE Sensex Movement…V
alu
es
of
S&
P B
SE
Se
nse
x
20000
25000
30000
35000
Graph shows movement of market from Jan 1980. Source: MFIE
Va
lue
s o
f S
&P
BS
E S
en
sex
0
5000
10000
15000
Jan-80 Jan-83 Jan-86 Jan-89 Jan-92 Jan-95 Jan-98 Jan-01 Jan-04 Jan-07 Jan-10 Jan-13

Buy & Sell Process - Post NFO
Cash UTI ETF
Units
Seller
Buy /sell
Creation in
kind
Redemption
in kindCash
UTI ETF
Units
Market making
Authorized
Participants / Brokers
Fund
Stock Exchange
Buyer
Buy /sell
For illustration purpose only
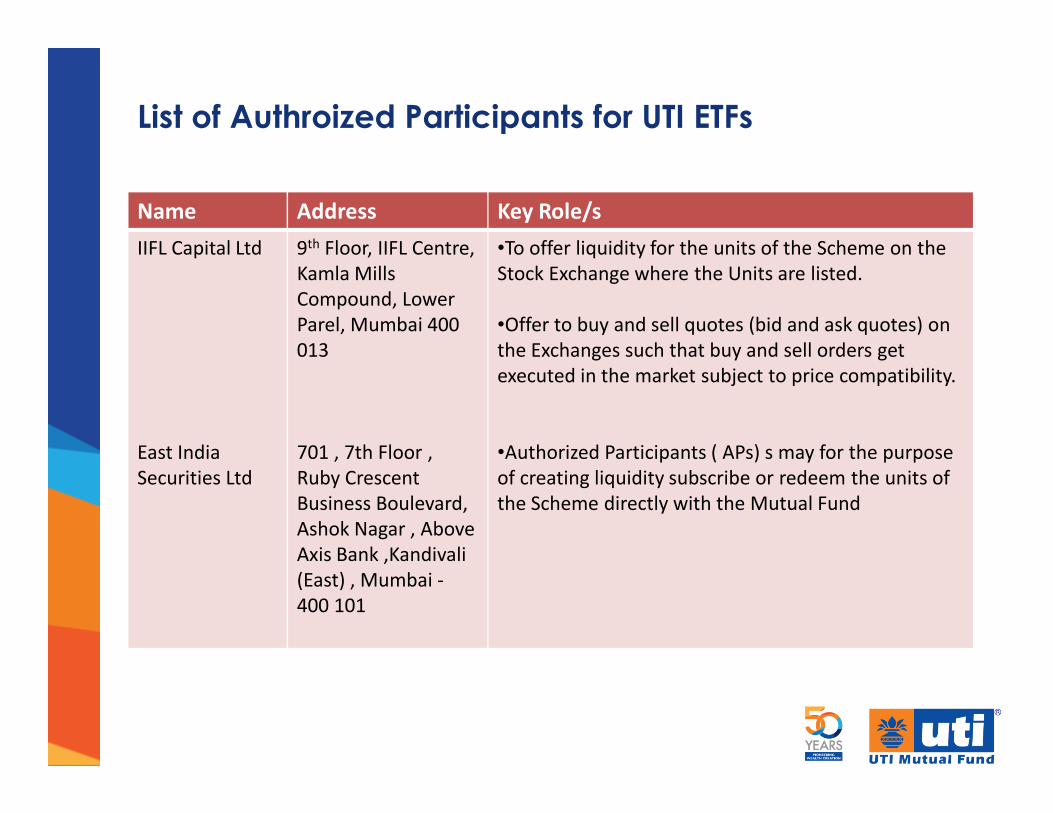
List of Authroized Participants for UTI ETFs
Name Address Key Role/s
IIFL Capital Ltd 9th Floor, IIFL Centre,
Kamla Mills
Compound, Lower
Parel, Mumbai 400
013
•To offer liquidity for the units of the Scheme on the
Stock Exchange where the Units are listed.
•Offer to buy and sell quotes (bid and ask quotes) on
the Exchanges such that buy and sell orders get
executed in the market subject to price compatibility.
East India
Securities Ltd
701 , 7th Floor ,
Ruby Crescent
Business Boulevard,
Ashok Nagar , Above
Axis Bank ,Kandivali
(East) , Mumbai -
400 101
•Authorized Participants ( APs) s may for the purpose
of creating liquidity subscribe or redeem the units of
the Scheme directly with the Mutual Fund
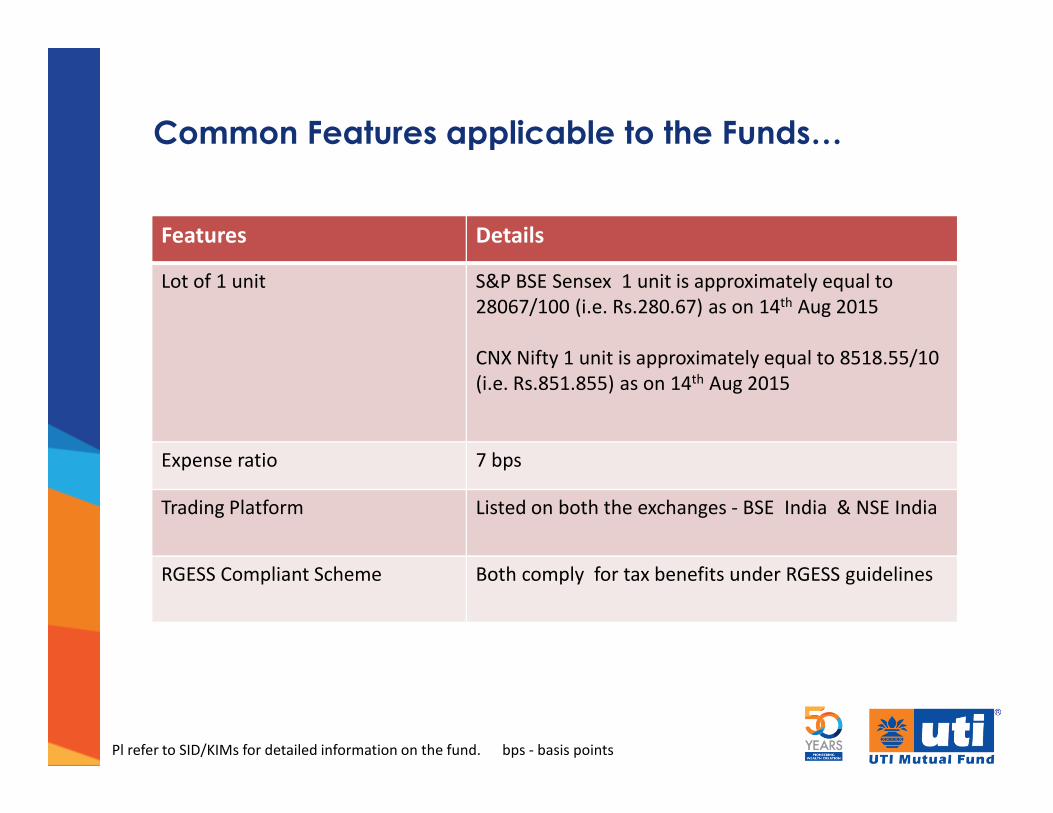
Common Features applicable to the Funds…
Features Details
Lot of 1 unit S&P BSE Sensex 1 unit is approximately equal to
28067/100 (i.e. Rs.280.67) as on 14th Aug 2015
CNX Nifty 1 unit is approximately equal to 8518.55/10
(i.e. Rs.851.855) as on 14th Aug 2015
Expense ratio 7 bps
Trading Platform Listed on both the exchanges - BSE India & NSE India
RGESS Compliant Scheme Both comply for tax benefits under RGESS guidelines
Pl refer to SID/KIMs for detailed information on the fund. bps - basis points
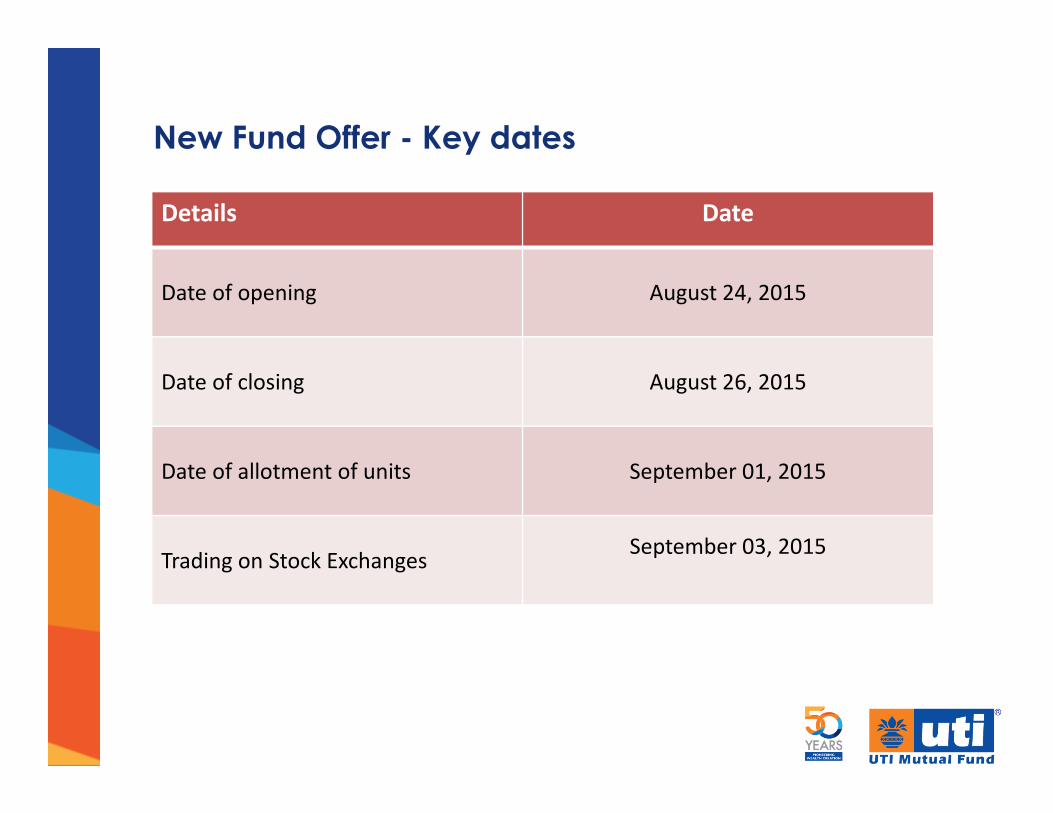
New Fund Offer - Key dates
Details Date
Date of opening August 24, 2015
Date of closing August 26, 2015
Date of allotment of units September 01, 2015
Trading on Stock ExchangesSeptember 03, 2015
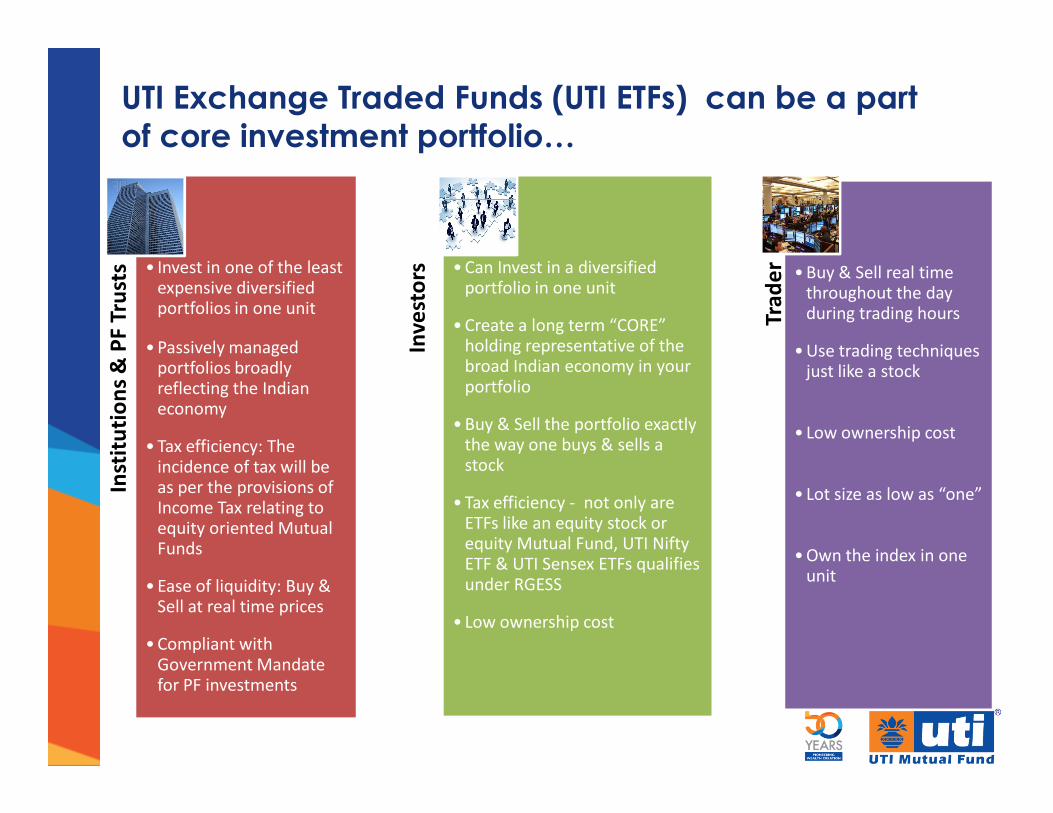
UTI Exchange Traded Funds (UTI ETFs) can be a part
of core investment portfolio…In
stit
uti
on
s &
PF
Tru
sts • Invest in one of the least
expensive diversified portfolios in one unit
• Passively managed portfolios broadly reflecting the Indian economy
Inv
est
ors • Can Invest in a diversified
portfolio in one unit
• Create a long term “CORE” holding representative of the broad Indian economy in your portfolio
Tra
de
r • Buy & Sell real time throughout the day during trading hours
• Use trading techniques just like a stock
Inst
itu
tio
ns
& P
F T
rust
s
economy
• Tax efficiency: The incidence of tax will be as per the provisions of Income Tax relating to equity oriented Mutual Funds
• Ease of liquidity: Buy & Sell at real time prices
• Compliant with Government Mandate for PF investments
• Buy & Sell the portfolio exactly the way one buys & sells a stock
• Tax efficiency - not only are ETFs like an equity stock or equity Mutual Fund, UTI Nifty ETF & UTI Sensex ETFs qualifies under RGESS
• Low ownership cost
• Low ownership cost
• Lot size as low as “one”
• Own the index in one unit
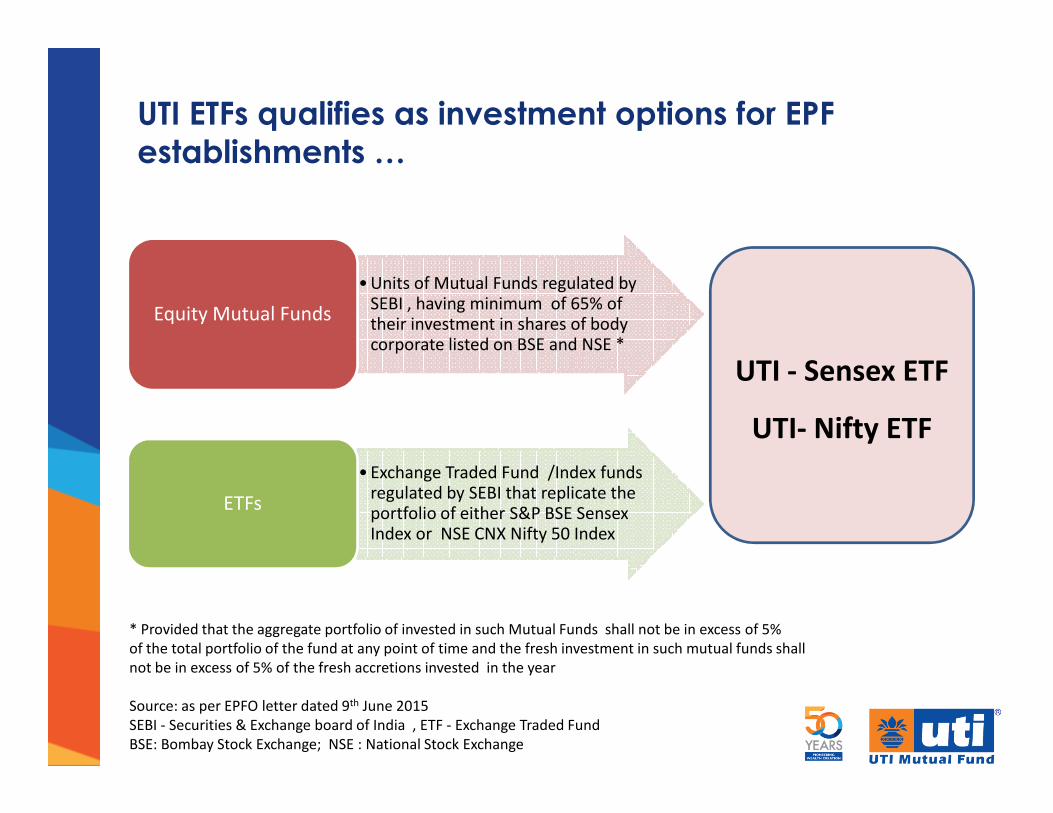
UTI ETFs qualifies as investment options for EPF
establishments …
• Units of Mutual Funds regulated by SEBI , having minimum of 65% of their investment in shares of body corporate listed on BSE and NSE *
Equity Mutual Funds
UTI - Sensex ETF
• Exchange Traded Fund /Index funds regulated by SEBI that replicate the portfolio of either S&P BSE Sensex Index or NSE CNX Nifty 50 Index
ETFs
* Provided that the aggregate portfolio of invested in such Mutual Funds shall not be in excess of 5%
of the total portfolio of the fund at any point of time and the fresh investment in such mutual funds shall
not be in excess of 5% of the fresh accretions invested in the year
Source: as per EPFO letter dated 9th June 2015
SEBI - Securities & Exchange board of India , ETF - Exchange Traded Fund
BSE: Bombay Stock Exchange; NSE : National Stock Exchange
UTI- Nifty ETF
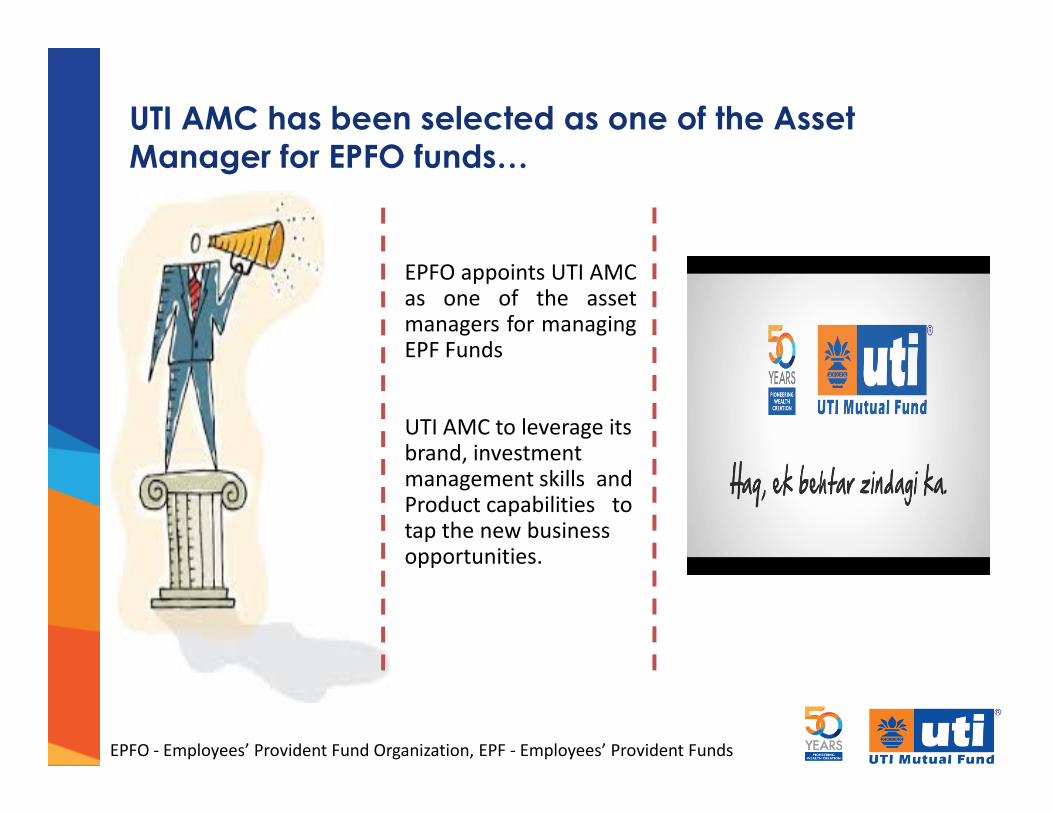
UTI AMC has been selected as one of the Asset
Manager for EPFO funds…
• EPFO appoints UTI AMCas one of the assetmanagers for managingEPF Funds
• UTI AMC to leverage its brand, investment management skills and Product capabilities to tap the new business opportunities.
EPFO - Employees’ Provident Fund Organization, EPF - Employees’ Provident Funds
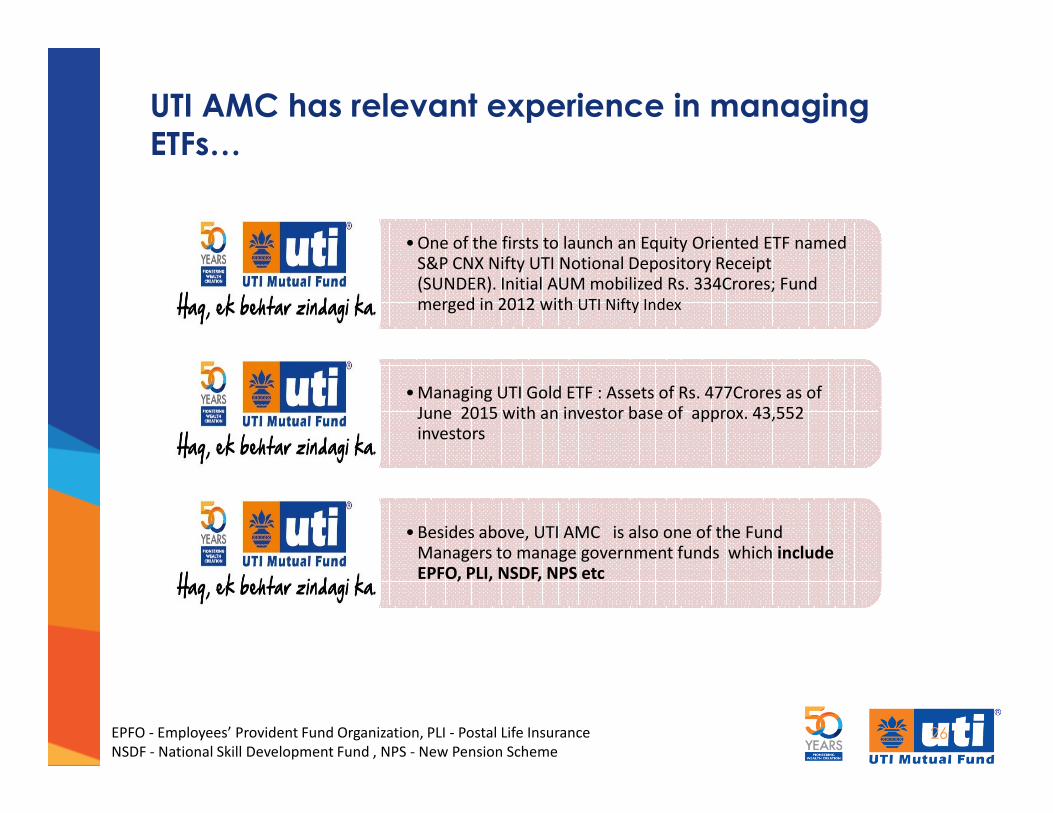
UTI AMC has relevant experience in managing
ETFs…
• One of the firsts to launch an Equity Oriented ETF named S&P CNX Nifty UTI Notional Depository Receipt (SUNDER). Initial AUM mobilized Rs. 334Crores; Fund merged in 2012 with UTI Nifty Index
• Managing UTI Gold ETF : Assets of Rs. 477Crores as of June 2015 with an investor base of approx. 43,552
26EPFO - Employees’ Provident Fund Organization, PLI - Postal Life Insurance
NSDF - National Skill Development Fund , NPS - New Pension Scheme
June 2015 with an investor base of approx. 43,552 investors
• Besides above, UTI AMC is also one of the Fund Managers to manage government funds which include EPFO, PLI, NSDF, NPS etc
Thank You
Registered Office: UTI Tower, 'Gn' Block, Bandra Kurla Complex, Bandra (E), Mumbai - 400051. Phone: 022 – 66786666. UTI Asset
Management Company Ltd. (Investment Manager for UTI Mutual Fund) E-mail: [email protected], (CIN-U65991 MH2002GOI137867).
For more information, please contact the nearest UTI Financial Centre or your AMFI/NISM certified UTI Mutual Fund Independent
Financial Advisor, for a copy of Statement of Additional Information, Scheme Information Document and Key Information
Memorandum cum Application Form.
Disclaimers: The information on this document is provided for information purposes only. It does not constitute anyoffer, recommendation or solicitation to any person to enter into any transaction or adopt any hedging, trading or investmentoffer, recommendation or solicitation to any person to enter into any transaction or adopt any hedging, trading or investmentstrategy, nor does it constitute any prediction of likely future movements in rates or prices or any representation that any suchfuture movements will not exceed those shown in any illustration. Users of this document should seek advice regarding theappropriateness of investing in any securities, financial instruments or investment strategies referred to on this document andshould understand that statements regarding future prospects may not be realized. The recipient of this material is solelyresponsible for any action taken based on this material. Opinions, projections and estimates are subject to change withoutnotice.
UTI AMC Ltd is not an investment adviser, and is not purporting to provide you with investment, legal or tax advice. UTI AMC Ltdor UTI Mutual Fund (acting through UTI Trustee Company Pvt. Ltd) accepts no liability and will not be liable for any loss ordamage arising directly or indirectly (including special, incidental or consequential loss or damage) from your use of thisdocument, howsoever arising, and including any loss, damage or expense arising from, but not limited to, any defect, error,imperfection, fault, mistake or inaccuracy with this document, its contents or associated services, or due to any unavailability ofthe document or any part thereof or any contents or associated services.
Mutual Fund Investments are subject to market risks, read all scheme related documents carefully


