40
Unit 5 Research Project Worthing College Sports Science [Kristian Hoem-Simmons] 2015
| Date post: | 07-Aug-2015 |
| Category: |
Sports |
| Upload: | kristianhoem |
| View: | 51 times |
| Download: | 1 times |

Unit 5 Research Project
Worthing College Sports Science[Kristian Hoem-Simmons]
2015

Assessment Criteria Pages 3-17 & 27-38
• P2: carry out sport science or exercise science-based research
• P3: collect and record data from the research project conducted
• M2: correctly analyse collected data, describing techniques used
• D1: correctly analyse data, explaining techniques used
• P4: produce a full research report using a standard scientific structure

To research the importance of height in a premier league striker to see if it has an affect
on the total goals scored
P2: Carry out / P4: Produce
AbstractI have researched premier league strikers height and the goals they scored to find out if there are any trends between them. I have done this by taking the top 12 teams strikers that have played more than 10 league games. Looking at the physiological statures of players to see if it affects how they play in football is an important piece of research as football is always looking to see what the best way to improve there team is and my research can show them whether height has an important factor on whether strikers will score more goals in a season or not. I looked at the top 12 teams in the premier league season 2013/14 and looked at all the strikers that played more than 10 games and worked out the amount of goals scored per game they have achieved, the amount of goals scored by head and the amount of goals scored by feet. From this I found out that there is no trend with height and goals scored per game and this was the aim to my research so my research wouldn’t be able to be used for scouting for new players however I have found that there is a significant trend that players that are taller will score more goals with there head and my other graph showed that the smaller the player the more goals scored by feet will be scored (see Figures and Tables 2,3,4).
P2: Carry out / P4: Produce

Contents: General• Page 5 - Contents: General • Page 6 - Contents: Appendices • Page 7 - Contents: Figures and tables • Page 8 - Acknowledgement • Page 9 - Introduction • Page 10 –Project hypothesis • Page 11 – Literature review and references • Page 12 – Method • Page 13 – Data Collection • Page 14 – Data Analysis • Page 15 – Results • Page 16 – Discussion • Page 17 – Conclusion • Page 18 - Assessment Criteria Pages • Page 19 – Review 1/3 • Page 20 – Review 2/3 • Page 21 – Review 3/3 • Page 22 – Further recommendation 1/5 • Page 23 - Further recommendation 2/5 • Page 24 - Further recommendation 3/5 • Page 25 - Further recommendation 4/5 • Page 26 - Further recommendation 5/5
P2: Carry out / P4: Produce

Contents: AppendicesPage 27 - Research Project AppendicesPage 28 – Appendix 1Page 29 – Appendix 2Page 30 - Appendix 3Page 31 – Appendix 4Page 32 – Appendix 5
P2: Carry out / P4: Produce

Contents: Figures and Tables
Page 33 - Research Project Figures and TablesPage 34 - Figures and Tables 1Page 35 – Figures and Tables 2Page 36 - Figures and Tables 3Page 37 - Figures and Tables 4
P2: Carry out / P4: Produce

Acknowledgements
I would like to Paul Cox for helping me out with the questions that I had asked him throughout this work, an example being of him helping me out with using excel.I would also like to thank Luke Howard for giving me advice on my introduction.
P2: Carry out / P4: Produce

Introduction
To research the importance of height in a premier league strikers from the top 12 teams in the 2013/14 league to see if it has an affect on the total goals scoredI chose this aim as football is something that I'm interesting in so to find out the aim would help me to understand the game further and it would be interesting to see if there was any trend between the height and the goals scored in total and the total goals scored with the head and feet.The project timescale for this project was 8 weeks and this was for me to get all the information that I needed.
P2: Carry out / P4: Produce

Project Hypothesis
1. Height will not have an affect on the total number of goals scored
2. Players of a below average height will score a higher proportion of goals with their feet than players above the average height.
3. Players above the average height will score a higher proportion of goals with their head than the players below the average height.
P2: Carry out / P4: Produce

Literature Review and References
https://worthingsportscience.wordpress.com/2015/02/27/unit-5-literature-review-kristian-hoem/
P2: Carry out / P4: Produce

Method1) I carried out the research by going through data online and plotting it all down to create my own research.2) I started this by making a table where I would be able to plot down the data that I collect (see Appendix 1 ) this involved all the areas I needed to look at like height, player name, total games played, goals scored total, goals scored with head, goals scored by feet.3) After I had somewhere to put the data I collect into I went and gathered what I needed to gather the data this included a pen and paper.4) I then went and looked through the strikers of the top 12 teams from the 2013/14 season and put them into the chart.5) When this was done I looked at the total number of appearances to see if they can be used as a part of my research if they had played more than 10 games and then researched the goals they scored in the season I got this information from a data website called soccer base and another website called sportsmole. (see Appendix 4)6) Once I collected the data for this I had to use the premier league website a look at each match played from the top 12 teams to find out who scored a goal using there head or feet and this is what took the longest to do (see Appendix 5)7) After this I then took the research that I had collected and worked out average percentages on excel of the total goals per game, total goals scored by head per game and the total goals scored by feet per game.8) After this had been found out I used excel to make a scatter graph with my information and found a trend line for each graph that I had to find any trends.
P3: Collect and record / M2: Correctly analyse & describe techniques / D1: Correctly analyse & explain techniques

Data CollectionThe data that I am collecting is from using secondary, I got my sources by googling what I needed to find out e.g. Liverpool vs. Man City 2013/14 match report, and then chose a reliable source that I could trust and for this I used the premierleague.com.I then used the information from the sources to put it together and put it into charts. I will do this by going on to the internet and finding information first on the top 12 teams strikers that had played more than 10 games in the season of 2013/14.
I then took the height of each player to put them into categories and to then find out how many goals each of these players have scored. I then found out how many goals were scored by either the feet or the head of the players and this is what will give me the data that I need to get results for my aim and hypothesis.
P3: Collect and record / M2: Correctly analyse & describe techniques / D1: Correctly analyse & explain techniques

Data AnalysisFirst I will be looking at the table that I have created and look at the data I have collected, I will then proceed to analyse my data by taking the height and the goals scored compared to games played percentage to then create a graph and then find a correlation between them to see if there is anything to find out from it.I will then be doing to same but comparing the height with the amount of headed goals scored per game and I’ll then find a correlation and a graph to work out if there is any link between them so I will have analysed that bit of data in this way as well and then the same would be done for height and the amount of goals scored with feet per game. The graph that I will be using to analyse my different bits of data will be a scatter graph where I can put a trend line into it and find out some trends that are within my work, the graph will be made through excel and with use of my I.C.T skills.
P3: Collect and record / M2: Correctly analyse & describe techniques / D1: Correctly analyse & explain techniques

ResultsI have found that there is not a trend with the height of a player and the amount of goals that they score and you can see this from my trend line and the spearman's rank correlation also backed this up as I didn’t really get any correlation at all with it not even making the very weak negative correlation with it coming to a correlation of -0.00988 which isn't significant what so ever so you can see from this that the hypothesis was correct as there was no significant trend or correlation. (see Figures and Tables 2 and 5)
I have also found that height does affect the amount of goals scored with the player using his head and there was a slightly positive trend line suggesting the taller the player the more headed goals they will score however in my spearman's rank correlation it showed that it was a very strong negative correlation with a correlation of -1.17867 that suggests that height does have an effect on the strikers that the more they gain in height the less goals they score. (see Figures and Tables 3 and 6)
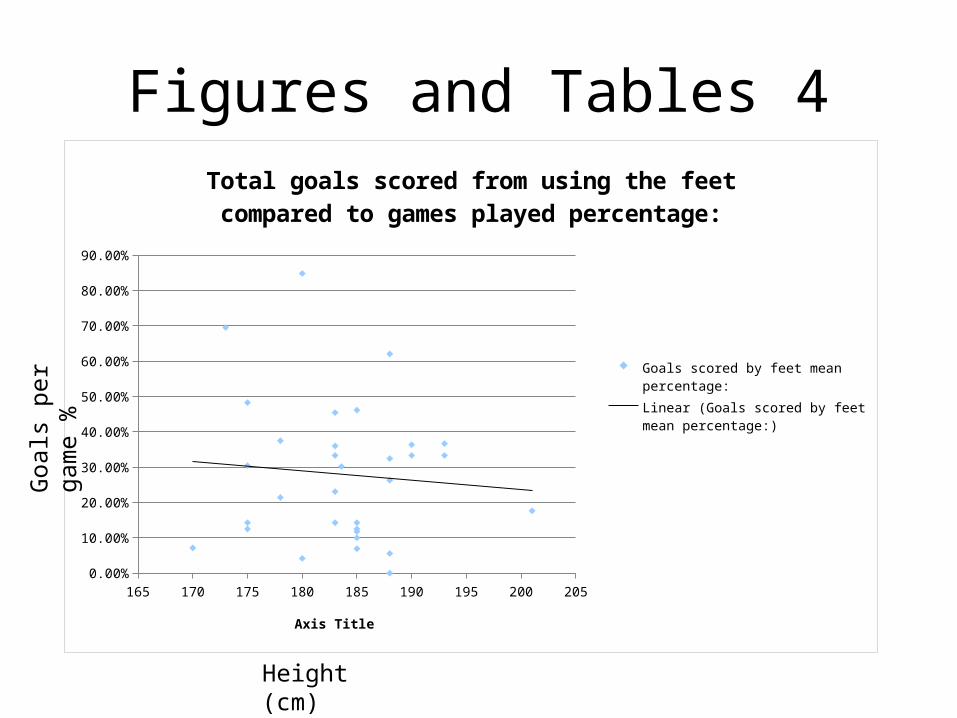
One last trend that I have found is that the smaller the player the more goals a player will have scored with there feet and this is backed up with my trend line (see figures and Tables 4) this isn’t a very strong trend line but it is still there and still suggests the smaller players score more goals with their feet then the taller players, however the spearman's rank correlation showed that it was also a very strong negative correlation, -1.05101, suggesting that the smaller the player the more goals with feet are scored. (see Figures and Tables 7)
P3: Collect and record / M2: Correctly analyse & describe techniques / D1: Correctly analyse & explain techniques

DiscussionMy results back up my hypothesis quite well as there doesn’t isn't any trend lines on the chart that shows if there is a difference with the amount of goals scored and the height of the players and my correlation backs this up as well with it not even making a very weak negative correlation. (see figures and tables 2 and 5)
Another hypothesis of mine was that the taller the player the more headed goals will be scored and the very strong negative seemed to show that the taller the player the less headed goals per game was scored which was the opposite to my hypothesis. (see figures and tables 6)
Another hypothesis of mine was that the smaller the player there would be more goals scored with feet and this also came through in my results as there was a very strong negative correlation and negative trend line suggesting that the smaller the player the more goals score by the feet there will be. (see figures and tables 4 and 7)
P2: Carry out / P4: Produce

Conclusion‘To research the importance of height in a premier league striker to see if it has an affect on the total goals scored’ here I have managed to find out that my aim hasn’t actually got any beneficial data from it and what I have got from my results is me finding out I that there isn't an importance of height with the amount of goals that get scored, however two of my objectives which are ‘Objective 1: Does the height affect the amount of goals scored by the head in a season?Objective 2: Does the height affect the total goals scored by the feet in a season?’ actually do show that being smaller means you will score a lot more goals with your feet and being taller means you will score a lot less goals with your head so you can come to the conclusion that strikers should be bought due to there skill rather than there height.The key trends from my literacy review were that there wasn’t such a large sample size that I had used so I could have got a larger sample size to make my research more reliable. My work was done recently so that is different to the key trends of my literacy review where a lot of the research was done quite along time ago so my research is quite accurate. Another similarity with my work which was looking at the strikers height which some of the research I had looked at had also done but not in the way I needed to reach my aim and objectives.
My results and discussion do support my hypotheses and it shows that my predictions were quite accurate as I was able to predict some trends that came up in my results so I believe the research I carried out was good research. I believe that they do support my hypotheses mainly because of the results that came up with from doing my research and it gave me the trends in my charts to be able to prove my hypotheses that is why they support it.
P2: Carry out / P4: Produce

Assessment Criteria Pages 19-26
• P5: carry out a review of the research project conducted, describing strengths, areas for improvement and future recommendations.
• M3: carry out a review of the research project, explaining strengths, areas for improvement and future recommendations.
• D2: carry out a review of the research project, justifying future recommendations for further research.

Review (1/3)Project conclusions met project aims well because it let me explain what I had found out from my original aim of ‘to research the importance of height in a premier league striker to see if it has an affect on the total goals scored’ as I was able to link back to my research (see figures and tables 1,2,3,4) to show what I had found out in this project to be able to compare it to my hypotheses. I was able to draw conclusions from my project aim and objectives and example of this is ‘if you want the best striking force then you should go for one small and one tall striker so that it is possible to make the most out of the chances that come in a game’ this examples shows how my project conclusion's met my project aims. How did my conclusion meet project aims? It met them by me conducting research on premier league strikers and finding out crucial information such as the height, games played, amount of goals scored, amount of goals with head and feet and from gaining this research I could then reach project aims by finding out percentages to then put into graphs and get a correlation to find out if height had an affect or not. Why did it meet project aims? It met project aims because the research that I conducted was reliable and from reliable sources such as the premierleague.com and this allowed me to collect the information that I needed.
P5: Describe / M3: Explain / D2: Justify

Review (2/3)The strengths of the research project was that I was able to gather all the information that I needed from doing desk research and this allowed me to be able to do the project from just a computer as it was all secondary data that I was collecting because I wasn’t doing any testing. This is a strength because I could use reliable websites to be able to gather my research as reliability is such an important issue with research as it will change whether your data is valid so it wouldn’t even be worth doing if it isn't valid so ticking this area off with ease from doing secondary research is a strong strength. Another strength would be that the research I did actually came up with some trends and correlations that is quite possibly beneficial (see figures and tables 1,2,3,4, 5, 6, 7) my figures and tables showed that my correlations ruled out that height has any affect with the amount of goals that are scored in general or with head or feet so that now teams now know this information they will know that it isn't necessary to have players of different heights that it is just more important that they base there recruitment of new players purely by how skilful they are as players and not anything to do with the height of these players how and why this is a strength is because of its beneficial.
P5: Describe / M3: Explain / D2: Justify

Review (3/3)The areas for improvement were that I could have put my data that I was collecting in excel first instead of putting it into word first as I wasted a lot of time doing the calculations on word (see Appendix 1) and I would have been able to get on with this project a lot quicker had I put it in excel in the first place. How and why would this improvement help me if I was to do it again? It would help me because I would be able to have possibly gained more research then I did on different seasons as I would have had more time to do it as I had wasted time on and I would have had even better research that showed more credibility due to it being a larger project. This is a weakness as it slowed down the amount of work that I could have done extra on this project that I couldn’t.Another weakness and area for improvement would be that I only looked at one league at one season, to have gained more of a reliable research I would have looked at 4 different leagues in 4 different seasons so a total of 16 seasons would be looked at which would show that this is the case for every football league and it is a reoccurring case to come with a more definitive answer that height doesn’t affect total goals scored. This is a weakness as it reduces reliable and valid data.
P5: Describe / M3: Explain / D2: Justify

Future Recommendations (1/5)If this project was to be completed again and it was to be a more reliable research then I would take data from all the teams in the league and then look at it from more than 4 seasons and also look at 4 different leagues instead of what I did with just doing 1 league 1 season of the top 12 teams (see Appendix 2).This would improve the reliability of this research which would make my projects weakness of it possibly not having a large enough sample size which was one of the weaknesses in my literacy review. The future benefits of this would be that the research would be looked at with more credibility so people wouldn’t be able to just say it was a coincidence that the results came in like that. It would benefit people that would be looking to use the information as they would be able to have more trust in it due to its better reliability as it would have eliminated some of the trust issues with the data that people may have had before.
P4: Produce / P5: Describe / M3: Explain / D2: Justify

Future Recommendations (2/5)
I believe that the research that get observers to look through my data is that it would improve the reliability of the results to avoid human error so that I am able to gain more reliability and validity in the data that I collect helping my projects weakness of it not possibly being as reliable as it can be so reducing human error will improve the reliability of my work which was a weakness in the literacy review. The future benefits of this is that the work wont have any human errors being made so that the reliability is really good making the work more credible. This will benefit people that are looking to use the information so that they know that the information is worth using and they can trust it so managers and teams can use it.
P4: Produce / P5: Describe / M3: Explain / D2: Justify

Future Recommendations (3/5)I recommend that strikers should be looked into more detail so we can get an in depth look into different aspects of a striker that will make him more prolific as a goal scorer or not so a possible one is to look at the BMI of strikers and see there goals scored per game ratio and see if there is a correlation. This would improve the depth of different striker traits and how that would effect performance improving my projects weakness of it only looking at height which means I am able to get a larger base of information and it links in with my literacy review where some of the research from that didn’t have a large sample size so looking into more characteristics of strikers will inevitably increase the sample size. The future benefit of this research is to possibly gain more of an understanding with what affects strikers to them being more prolific or not or if there isn't a correlation there at all which would then mean that I have ruled out a factor. This would eventually benefit managers and teams that are looking to scouting new strikers to look for certain traits that they have.
P4: Produce / P5: Describe / M3: Explain / D2: Justify

Future Recommendations (4/5)A future proposal would be for strikers to be looked into more detail so we can get a better look at a striker and see what traits will make him more prolific as a goal scorer or not so a possible one is to look at the power of strikers and look at whether this has an effect on the amount of goals scored per game. This would improve the depth of different striker traits and how that would effect performance improving my projects weakness as only looking at the height of a striker isn't a large enough base of information and it links in with my literacy review where some of the research from that didn’t have a large sample size so looking into more characteristics of strikers will inevitably increase the sample size. The future benefit of this research is to possibly gain more of an understanding of what traits benefit a striker more or less or if they benefit them at all helping the scouting for football strikers out. This would eventually benefit managers and teams that are looking to scouting new strikers to look for certain traits that they have.
P4: Produce / P5: Describe / M3: Explain / D2: Justify
Future Recommendations (5/5)Another proposal for further research is to look at speed and how that would affect the goals per game ratio to see if it makes the a more prolific goal scorer. This would improve the depth of different striker traits and how that would effect performance improving my projects weakness as only looking at the height of a striker isn't a large enough base of information and it links in with my literacy review where some of the research from that didn’t have a large sample size so looking into more characteristics of strikers will inevitably increase the sample size. This would improve the research into the different striker traits and whether it would effect the performance that they give if they are more quick or not which would improve my projects weakness as it wouldn’t be only looking at one trait and it links in with the literacy review where a weakness was the sample size so this would get increased with this. The benefits of this would be that there would be a good amount of research into traits and how they affect performance and things like height and speed can be looked at to see if that has an effect which will help for scouting purposes. This will benefit the managers and teams by allowing them to get a better idea of what striker they will need.
P4: Produce / P5: Describe / M3: Explain / D2: Justify

Research Project Appendices

Appendix 1

Appendix 2

Appendix 3
http://www.soccerbythenumbers.com/2012/07/height-discrimination-in-football-are.html

Appendix 4
http://www.soccerbase.com/players/ http://www.sportsmole.co.uk/football/premier-league/2013-14/top-goal-scorers.html

Appendix 5
http://www.premierleague.com/

Research Project Figures and Tables

Figures and Tables 1

Figures and Tables 2
165 170 175 180 185 190 195 200 2050.00%
10.00%
20.00%
30.00%
40.00%
50.00%
60.00%
70.00%
80.00%
90.00%
100.00%
Goals per game percentage:
Goals per game percentage:Linear (Goals per game percentage:)
Height (cm)
Goa
ls p
er g
ame
%

Figures and Tables 3
165 170 175 180 185 190 195 200 2050.00%
5.00%
10.00%
15.00%
20.00%
25.00%
Total goals scored from using the head compared to games played percentage:
Goals scored by head in the number of ap-pearancesLinear (Goals scored by head in the number of appearances)
Height (cm)
Goa
ls p
er g
ame
%
Figures and Tables 4
165 170 175 180 185 190 195 200 2050.00%
10.00%
20.00%
30.00%
40.00%
50.00%
60.00%
70.00%
80.00%
90.00%
Total goals scored from using the feet compared to games played percentage:
Goals scored by feet mean percentage:Linear (Goals scored by feet mean percentage:)
Axis Title
Height (cm)
Goa
ls p
er g
ame
%

Figures and Tables 5

Figures and Tables 6

Figures and Tables 7


