My twenty-five years of cloze testing research: So what?
James Dean BROWN, University of Hawai‘i at Manoa, USA
This paper examines one strand of my research (a dozen or so studies on cloze testing) published between 1978 and 2002 in terms of: (a) the results of these studies, (b) the questions each raised that led to further studies, and (c) the answers I now have to the following questions: (1) How do score distributions generally affect cloze results? (2) How do score distributions affect cloze reliability and validity statistics? (3) Does tailoring cloze, using item analysis, lead to a more reliable and valid test? (4) Are cloze tests basically sentential or intersentential? (5) Why does K-R21 consistently underestimate cloze reliability? (6) Are there cloze items that are not contributing at all to test variance? (7) How do cloze tests administered to low and high proficiency groups differ overall? (8) How many items are not functioning well in cloze tests administered to low and high proficiency groups? (9) Are different items functioning well in cloze tests administered to low and high proficiency groups? The discussion summarizes answers to those nine questions, and the conclusion considers how (a) I learned from my mistakes, (b) I learned more than I set out to learn, and (c) the whole is greater than the sum of the parts.
Cloze procedure first appeared in 1953 when Wilson Taylor researched its effectiveness as a procedure for estimating the readability of textbooks for school children in the United States. A decade later, research began to appear on the usefulness of cloze for testing the reading proficiency of native speakers of English (e.g., Bormuth, 1965, 1967; Crawford, 1970; Gallant, 1965; or Ruddell, 1964). In the 1960s and 1970s, a number of studies emerged on the usefulness of cloze procedure as a measure of overall ESL
2 J. D. Brown
proficiency (see Alderson 1978; Cohen 1980; Oller 1979 for summaries of this early ESL research).
As I first noted in Brown (1984), the literature on cloze as a measure of overall ESL proficiency has produced results that can at best be called inconsistent. Specifically, the reliability and validity of cloze have vacillated tremendously both within and among the studies. For example, reliability estimates for various cloze tests have extended from a very low .31 to a highly respectable .96 (Alderson, 1979a; Bachman, 1985; Brown, 1980, 1983, 1984, 1988b, 1989, 1993, 1994; Brown, Yamashiro, & Ogane, 1999, 2001; Darnell, 1970; Hinofotis, 1980; Jonz, 1976; Mullen, 1979; Oller 1972b; Pike 1973). Similarly, criterion-related validity coefficients have extended from .43 to .91 with the corresponding coefficients of determination ranging form .18 to .83 (Alderson, 1979a, 1980; Bachman, 1985; Brown, 1980, 1984, 1988b, 1994, 1998; Conrad, 1970; Darnell, 1970; Hinofotis, 1980; Irvine, Atai, & Oller, 1974; Mullen, 1979; Oller, 1972a & b; Oller & Inal, 1971; Revard, 1990; and Stubbs & Tucker, 1974).
Many of the studies mentioned above were designed to investigate how different approaches to creating, scoring, and interpreting cloze tests could be used to maximize their reliability and validity. In the process, the following eight variables were often manipulated: (a) deletion frequencies (e.g., 5th, 7th, & 9th word deletions), (b) deletion patterns (particularly every nth word vs. rational deletion), (c) starting point of deletions, (d) scoring methods, (e) length of blanks, (f) text difficulty, (g) native versus non-native performance, and (h) number of items. While all of this research was going on, a difference in viewpoints heated up. Some researchers argued that cloze items were primarily tapping student abilities to handle clause or sentence level grammar (e.g., Alderson, 1979a; Markham, 1985; Porter, 1983), while other researchers were arguing that cloze items measure at the intersentential level (e.g., Bachman, 1985, Brown, 1983, 1994; Chavez-Oller, Chihara, Weaver, & Oller, 1985; Chihara, Oller, Weaver, & Chavez-Oller, 1977; and Jonz, 1987, 1990).
2. Purpose of this Paper
At this point, I think I can safely say that the research on cloze tests has been fairly inconclusive in terms of their reliability and validity, and even in terms of what cloze tests are measuring. The purpose of this paper is to look back over the last twenty-five years at the cloze testing strand of my own research with the goal of trying to better understand cloze testing.
From the outset, I was fascinated by cloze tests because I believed that they function well as overall ESL proficiency tests even though we have very little idea how they work. Starting in 1978 with my master’s thesis, the results of
3 International Journal of Language Studies, 7(1), 1-32
each of my studies raised questions in my mind that led to the next study as, step by step, I learned more and more about cloze tests. In retrospect, the main questions that arose in this line of research were the following:
1. How do score distributions generally affect cloze results (Brown 1978, 1980)?
2. How do score distributions affect cloze reliability and validity statistics (first noticed in Brown 1978, 1980, & 1983, but understood in Brown 1984)?
3. Does tailoring cloze, using item analysis, lead to a more reliable and valid test (as I proposed in Brown 1984, and first demonstrated in Brown 1988)?
4. Are cloze tests basically sentential or intersentential (as discussed in Brown 1989 and elsewhere)?
5. Why does K-R21 consistently underestimate cloze reliability (as first noticed in Brown 1983)?
6. Are there cloze items that are not contributing at all to test variance (as I began to realize in conducting Brown 1989, 1992, & 1993)?
7. How do cloze tests administered to low and high proficiency groups differ overall (Brown, Yamashiro, & Ogane 1999, 2001)?
8. How many items are not functioning well in cloze tests administered to low and high proficiency groups (Brown 2002)?
9. Are different items functioning well in cloze tests administered to low and high proficiency groups (Brown 2002)?
I will organize the next section by using those nine questions as headings.
3. Twenty-five years of wondering about cloze tests
3.1. How Do Score Distributions Affect Cloze Results?
As mentioned above, my interest in cloze testing began with my master’s thesis at UCLA (Brown, 1978; published as an article in 1980). In retrospect, I see that research as the work of a naïve, sincere, fledgling researcher, who was idealistically investigating the relative efficacy of the exact-answer, acceptable-answer, clozentropy, and multiple-choice methods for scoring cloze tests. I concluded that the acceptable-answer scoring method was the best overall scoring method. I know now that my study was fundamentally flawed because I interpreted the differences among the four scoring methods (in terms of item facility, item discrimination, reliability, standard error of estimate, and validity statistics) without considering the marked way in which the distributions of scores varied for each scoring method and how those distributions would affect the relative values of my statistics.
4 J. D. Brown
For instance, as shown in Table 1, the acceptable-answer method produced a near perfect distribution with a mean that was nearly perfectly centered (M = 25.58 out of 50) and space for almost precisely two standard deviations (SD = 12.45) above and below that mean. In contrast, the distributions for the other scoring methods had means and standard deviations that indicated they were all either positively or negatively skewed. It should not be a surprise then that the acceptable-answer scoring method scores ended up being the most reliable (as indicated by both the K-R20 and split-half adjusted estimates)?
Table 1 Descriptive, Reliability, and Validity Statistics for Four Methods of Scoring Cloze Tests (compiled from Brown, 1978, 1980)
Statistic Exact-answer
Acceptable-answer
Clozentropy Multiple-Choice
Number of examinees 55 55 55 57
Number of items 50 50 50 50
Mean 15.00 25.58 33.40 31.84
Standard Deviation 8.56 12.45 16.78 8.99
Range 0-33 0-46 0-65 13-48
K-R20 Reliability .90 .95 .93 .89
Split-half (adj) Reliability .90 .94 .93 .90
SEM (based on K-R20) 2.68 3.06 4.48 2.81
Validity Coefficient .88 .90 .91 .89
Coef. Of determination .77 .81 .83 .79
I have since realized that my results would have turned out very differently if, by chance, I had based my cloze test on a passage that was easier (or more difficult) than the one I did use: the relative normality or skewedness of the four distributions would have been entirely different, and therefore would have produced very different item facility, item discrimination, reliability, standard error of estimate, and validity statistics for the four scoring methods. In turn, those differences might have led me to entirely different conclusions. In short, I had overlooked a very important variable, passage difficulty, in setting up my study. Learning from the flaws of that study has made me keenly aware of the great importance of examining descriptive statistics and the distributions they represent whenever interpreting any statistical results in my own work and that of my students.
3.2. How Do Score Distributions Affect Cloze Reliability and Validity Statistics?
By the time I published Brown (1984), I had begun to appreciate the importance of what I had learned in Brown (1978, 1980) about score
5 International Journal of Language Studies, 7(1), 1-32
distributions. In the 1984 study, I systematically examined the effects of score distributions on the reliability and validity of cloze test scores. Table 2 from that study shows eight sets of cloze test results arranged from the most widely dispersed scores (as revealed by the standard deviations and ranges) to the most narrowly dispersed. The related reliability estimates and validity coefficients ranged in magnitude in direct relationship to the degree of score dispersion. Put another way, those cloze test scores that had the highest reliability estimates and validity coefficients also had the widest distributions, and those test scores that had the lowest reliability and validity coefficients also had the narrowest distributions.
Table 2 Ranges of Talent in Relationship to Cloze Test Reliability and Validity (adapted from Brown, 1984)
Sample SD Range Reliability Estimate Validity Coefficient
1978a 12.45 46 0.95 0.90
1978b 8.56 33 0.90 0.88
1981a 6.71 29 0.83 0.79
1981b 5.59 22 0.73 0.74
1982a 4.84 22 0.68 0.59
1982b 4.48 20 0.66 0.51
1982c 4.07 21 0.53 0.40
1982d 3.38 14 0.31 0.43
The important thing to note in Table 2 is that all eight sets of statistics were produced by exactly the same cloze test administered to different groups of students with differing ranges of ability: from the widely dispersed 1978a group (including the entire range of students who took the UCLA ESLPE ranging from low level adult education level to near-native graduate student level) down to the narrowly dispersed 1982d group (which included only Chinese students who had been placed in a single level of EFL study).
The results in Table 2 reveal that a single cloze test can simultaneously appear to be one of the best cloze tests ever reported in the literature (reliability = .95 and validity = .90) and one of the worst (reliability = .31 and validity = .43) depending on the extent of variation in abilities in the particular group of students being tested. Thus in Brown (1984), I began to understand that statements about cloze reliability and validity could only be generalized to the particular group involved or perhaps to any groups of students very much like those in the validation sample (in language backgrounds, range of abilities, etc.). As shown next, this conclusion naturally led me to study the importance of item analysis to developing cloze tests.
6 J. D. Brown
3.3. Does Tailoring Cloze, Using Item Analysis, Lead to a More Reliable and Valid Test?
In Brown (1984), I introduced a technique that I labeled ‘well-tailored cloze’, and later in Brown (1988), I finally applied the idea by tailoring an actual cloze passage. The well-tailored cloze technique involved using traditional item analysis statistics (i.e., item facility and item discrimination) in a pilot cloze test to select items for a final revised version of the cloze test much in the same way testers normally pilot and revise multiple-choice or discrete-point tests by choosing those items that discriminate well and also have suitable difficulty for the students being tested. In Brown (1988), I began by administering a 399 word every 7th word deletion 50-item cloze test (labeled the “original” cloze test) to 89 Chinese EFL students from a single relatively homogeneous level at the Guangzhou English Language Center. As expected (based on the Brown 1984 results), I found that this cloze test did not function very well as a norm-referenced measure. As shown in Table 3, the mean for this original cloze test was 21.99, which is fairly low at three points below the center point between 0 and 50 items of 25. In addition, the standard deviation (SD) was only 3.31 and the range was a mere 15, indicating that the scores on the test were not very widely dispersed. In addition, the reliability estimates, which ranged from .00 to .27, and validity coefficient (criterion-related with the Guangzhou English Language Center, or GELC, test) of .25, were all very low.
Table 3 Original and Tailored Cloze Results (simplified from Brown, 1988)
Statistic Original Cloze Tailored Cloze
K 50 50
N 89 89
M 21.99 26.74
SD 3.31 4.92
Range 15 23
Split-half (adj) .26 .68
Cronbach alpha .27 .70
K-R21 .00 .50
rxy with GELC .25 .54
Next, I developed 250 potential items in five 50-item versions of the same passage, each of which had a different starting point. I piloted these five versions with randomly selected subgroups of the same students. Then, I used the resulting item facility and discrimination statistics to select the “best” items from the 250 pilot items for a final 50-item tailored cloze. Finally, I
7 International Journal of Language Studies, 7(1), 1-32
administered the revised 50-item cloze without warning a few weeks later to the whole group. This whole process is described in more detail for developing a 30-item cloze in Appendix A. The statistics for the tailored version are shown in Table 3. Note that the mean (26.74) for the tailored cloze is higher and better-centered than the mean for the original cloze and that the standard deviation (4.92) and range (23) for the tailored cloze are considerably larger than the same statistics for the original cloze test. The reliability estimates and validity coefficient (criterion-related with GELC test) were also substantially improved by the tailoring process. Evidently, the cloze tailoring process succeeded reasonably well in creating a more effective test given that the score distribution turned out to be better centered and dispersed, and both the reliability and validity coefficients increased.
While doing this research, I realized that only a small proportion of the 250 items was actually functioning well from the item facility and discrimination perspectives, at least in comparison with what I had become accustomed to over the years in developing pools of multiple-choice items. Thus I began to wonder about this issue. I will return to it below.
3.4. Are Cloze Tests Basically Sentential or Intersentential?
When I wrote Brown (1983), I was in part reacting to a statement in Alderson (1979b, p. 225) to the effect that, in his research, cloze appeared to be chiefly testing at the sentence or clause level and was therefore measuring lower-order skills. In his words:
The finding in Alderson (1978) that closure seems to be based on a small amount of context, on average, suggests that the cloze is sentence—or indeed clause—bound, in which case one would expect a cloze test to be capable, of measuring, not higher-order skills, but rather much lower-order skills. … This is not to assert that cloze items are in principle incapable of testing more than the comprehension of the immediate environment, but that as a test, the cloze is largely confined to the immediate environment of a blank. The fact that the procedure does not delete phrases or clauses must limit its ability to test more than the immediate environment, since individual words do not usually carry textual cohesion and discourse coherence (with the obvious exception of cohesive devices like anaphora, lexical repetition and logical connectors).
Brown (1983) was designed to tackle this issue by investigating the degree to which cohesive devices as defined by Halliday and Hasan (1976) (i.e., intersentential reference, substitution, ellipsis, lexical cohesion, and conjunction) were represented in cloze test items, in the passage itself, and in
8 J. D. Brown
various other deletion patterns for the same passage. By extension, since cohesive devices were by definition intersentential, my study was designed to determine the degree to which cloze test items primarily measure higher-order skills based on influences across sentence boundaries as opposed to lower-order sentence or clause level skills.
The results compiled from that study are given in Table 4. Note that no instances of ellipsis or substitution occurred in the passage being investigated. Notice also that 52.25% of the words in the passage and 56%, 70%, 66%, and 62% of the items in the four different deletion patterns involved some type of cohesion. This would seem to be a clear demonstration that at least a substantial number of cloze test items are intersentential in nature. Similar research has been done by others (e.g., Jonz 1987, 1990) with similar results.
Table 4 Analysis of Cohesive Devices (in Percents) for the Whole Cloze Passage, and Various 7th Word Deletion Patterns and Random Deletion (compiled from Brown, 1983)
Cohesive Device Whole Passage
Original deletion
“Word-before” deletion
“Word-after” deletion
Random Deletion
Ellipsis 0 0 0 0 0
Substitution 0 0 0 0 0
Reference items 14 16 16 22 14
Conjunction items 2.25 0 10 2 6
Lexical items 12 12 14 18 14
Collocation items 24 28 30 24 28
Total cohesive items 52.25 56 70 66 62
Total non-cohesive items 47.75 44 30 34 38
Since I published that 1983 study, I have recognized that my interpretation had a flaw: it ignores the possibility that the existence of items involved in cohesion, even a substantial presence, does not mean that those items were necessarily doing anything. Consider the possibility that the items involved in cohesion might be much more difficult than the other sentence level items, and that therefore, in some groups of students, such items might not be answered correctly by a single student. In such a case, the cohesion items would be present in the test, but they would not be contributing any variance to the test.
In Brown 1989, I pointed out that it is possible for those researchers who argue that cloze items are basically testing lower-order sentence or clause level skills to be correct at the same time that researchers who argue that
9 International Journal of Language Studies, 7(1), 1-32
cloze items are basically testing higher-order intersentential skill are also correct. I argued that cloze tests may be testing lower-order skills when applied to low-level students who can only handle sentence level grammar because those will be the only items that are discriminating, but also that cloze tests are more likely to be testing higher-order intersentential skills with advanced students who can handle both sentence level grammar and intersentential level cohesion, coherence, pragmatics, etc. because those will be the items that discriminate and therefore contribute to test variance. I further pointed out that potential for both lower-order sentential and higher-order intersentential items probably existed in most passages of at least moderate difficulty simply because that potential exists everywhere in the written language. Nonetheless, potential means nothing on a norm-referenced cloze test if the items produced by that potential are not discriminating. I will also return to this issue below.
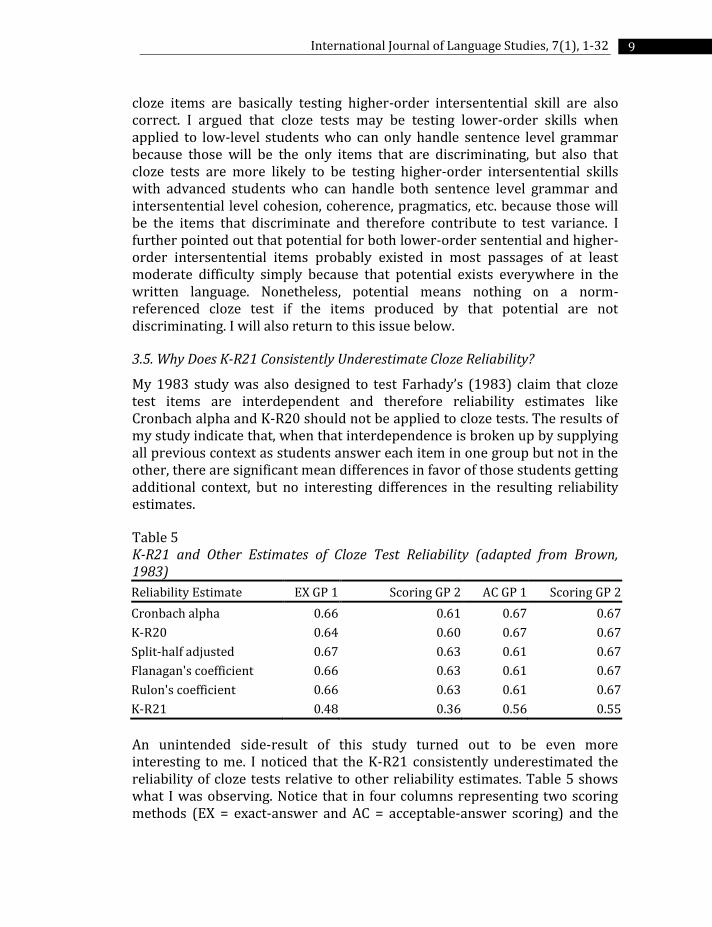
3.5. Why Does K-R21 Consistently Underestimate Cloze Reliability?
My 1983 study was also designed to test Farhady’s (1983) claim that cloze test items are interdependent and therefore reliability estimates like Cronbach alpha and K-R20 should not be applied to cloze tests. The results of my study indicate that, when that interdependence is broken up by supplying all previous context as students answer each item in one group but not in the other, there are significant mean differences in favor of those students getting additional context, but no interesting differences in the resulting reliability estimates.
Table 5 K-R21 and Other Estimates of Cloze Test Reliability (adapted from Brown, 1983)
Reliability Estimate EX GP 1 Scoring GP 2 AC GP 1 Scoring GP 2
Cronbach alpha 0.66 0.61 0.67 0.67
K-R20 0.64 0.60 0.67 0.67
Split-half adjusted 0.67 0.63 0.61 0.67
Flanagan's coefficient 0.66 0.63 0.61 0.67
Rulon's coefficient 0.66 0.63 0.61 0.67
K-R21 0.48 0.36 0.56 0.55
An unintended side-result of this study turned out to be even more interesting to me. I noticed that the K-R21 consistently underestimated the reliability of cloze tests relative to other reliability estimates. Table 5 shows what I was observing. Notice that in four columns representing two scoring methods (EX = exact-answer and AC = acceptable-answer scoring) and the
10 J. D. Brown
two different groups (one with all previous context provided and the other without that context), reliability estimates fairly consistently range from .60 to .67 when using Cronbach alpha, K-R20, split-half adjusted, Flanagan’s, and Rulon’s coefficients. However, notice at the bottom of the table that the K-R21 estimates, which range from .36 to .56, consistently provide underestimates of the other coefficients (by .05 to .27 points). Because I was curious about this underestimation problem, I continued to calculate K-R21 in all my subsequent cloze studies. The resulting K-R21 estimates were almost always aberrant and usually considerably lower than Cronbach alpha and K-R20 (for more examples, see Table 6, which is taken from Brown 1993).
It eventually dawned on me that I should look at the original Kuder and Richardson (1937) paper. I was particularly interested in the technical differences between their formulas 20 and 21 and found that one assumption underlying K-R21 (that does not apply to K-R20) is that items must be equal in difficulty. I realized that, while it was reasonable to expect K-R21 to provide good reliability estimates for normal multiple-choice tests (wherein we revise the test by keeping those items which discriminate and have fairly equal item facility values ranging from .30 to .70), it might not be so reasonable to expect the same level of accuracy from cloze tests, where I had found item facility values to range from .00 to 1.00. Thus the serious underestimates of K-R21 could be accounted for by the fact that some cloze items violate the equal difficulty assumption that underlies that formula. The set of results in Brown (1983) had started me wondering about K-R21 and cloze items, and ultimately led to the studies below that look at how item difficulty varies in cloze tests and how well items in cloze tests function.
3.6. Are There Cloze Items That Are Not Contributing at All to Test Variance?
Brown (1989) was a study of what happens when 50 different cloze tests are created from passages randomly selected from a public library and administered to randomly selected groups of Japanese university students (n = 2298). While analyzing those results, I again noticed that many of the items were not functioning at all. Many of the items were so difficult that every single student was answering them incorrectly or leaving them blank.
In Brown (1993), I began to see and understand the effects of such non-functioning items on the distributions of scores for the 50 cloze tests as well as on the reliability and validity statistics associated with those tests. It turned out that many of the 50 cloze tests themselves were not functioning well at all in terms of reliability and validity (as shown in Table 6)—a fact that was due, in no small part, I hypothesized, to the large numbers of items that were not contributing anything to the test variance.
11 International Journal of Language Studies, 7(1), 1-32
Table 6 50 Natural Cloze Tests: Descriptive, Reliability, and Validity Statistics (two tables combined from Brown 1993) Cloze N M SD Min Max IF rpbi Alpha K-R21 rxy
Notice in Table 6 that these fifty 30-item passages (scored for EX answers) were generally difficult for the students with the highest mean being 9.92 out of 30 for Cloze 21, and that the means ranged considerably from a very low 1.02 for Cloze 18 up to that high of 9.92. In terms of dispersion, these cloze passages ranged from the very narrow variability that resulted for Cloze 18 with its SD of 1.09 and range from 0 to 3 to the broader variability for cloze tests 12 and 15 with their SDs of 8.98 and 9.18 and ranges from 0 to 21 and 0 to 18, respectively. Note that the maximum scores indicate that many items may not have been functioning at all. I confirmed this observation by going back and looking at the data. Sure enough, many of the items were being answered incorrectly or left blank by all students.
Naturally the difficulty of these cloze tests is also reflected in the average item facility (IF) which ranged from a low of .03 for Cloze 18 to a high of .33 for Cloze 21. The average point-biserial correlation coefficients (rpbi) which are being used here as an indication of item discrimination, are no higher than .38 for Cloze 21 and go as low as .13 and .14 for cloze tests 17 and 18, respectively. On average these are not tests that discriminate very well.
3.7. How Do Cloze Tests Administered to Low and High Proficiency Groups Differ Overall?
Brown, Yamashiro, and Ogane (1999) examined what happens when a cloze test is tailored for a group of Japanese students at a relatively high proficiency level (n = 193), and Brown, Yamashiro, and Ogane (2001) did the same for a group of Japanese students with relatively low proficiency (n = 143). In each of these studies, five different 11th word random deletion 30-item cloze tests were created, each with a different starting point. The passage, deletion pattern, and indeed one of the forms were taken from Bachman’s (1985) passage entitled ‘The Science of Automatic Control’. Then, EX and AC answer keys were created, the tests were piloted, and tailored cloze tests were made up of those items functioning best in terms of item facility and item discrimination. It is no surprise (given the findings in Brown 1988) that the resulting tailored cloze had better testing characteristics than any of the original piloted versions.
In Brown (2002), I combined the data from Brown, Yamashiro, and Ogane (1999 & 2001) and reanalyzed them in order to explore what happens when cloze tests are administered to two separate groups of low and high proficiency Japanese university. Table 7 shows descriptive and reliability statistics for the five cloze versions and two scoring methods for the low proficiency group on the left and the high proficiency group on the right.
Notice for the low proficiency group that the means are generally very low for 30-item tests, ranging for the EX scoring from 0.72 to 3.50 and for the AC
13 International Journal of Language Studies, 7(1), 1-32
scoring from 1.64 to 4.05. Notice also that, in all cases, the standard deviations are nearly as large or larger than the means, which probably indicates positively skewed distributions in all cases. The Cronbach α and K-R21 reliability statistics indicate low to moderate reliabilities.
Table 7 Descriptive Statistics for Five Cloze Versions and Two Scoring Methods for the Low Proficiency Students (N = 193) and High Proficiency Students (N = 143) (compiled from tables in Brown, 2002)
Low Proficiency High Proficiency
SCORING FORM n M SD K-R21 N M SD K-R21
EXACT
EX A 40 1.58 2.26 .762 .731 29 8.59 3.41 .645 .489
EX B 38 2.53 2.27 .664 .569 30 9.33 3.76 .757 .564
EX C 39 0.72 1.32 .641 .617 29 9.59 3.89 .751 .588
EX D 38 1.53 1.67 .559 .496 28 7.79 3.11 .640 .418
EX E 38 3.50 3.22 .793 .726 27 11.44 3.39 .636 .397
ACCEPTABLE
AC A 40 1.80 2.33 .738 .712 29 10.90 4.12 .738 .612
AC B 38 2.92 2.45 .657 .580 30 12.23 3.86 .715 .532
AC C 39 1.64 1.71 .525 .486 29 14.76 5.19 .832 .747
AC D 38 2.13 1.76 .478 .374 28 11.32 4.35 .768 .649
AC E 38 4.05 3.32 .769 .706 27 15.26 4.22 .718 .599
For the high proficiency group, the means are much higher than those for the low proficiency group, ranging for the EX scoring from 7.79 to 11.44 and for the AC scoring from 10.20 to 15.26. Notice also that all the standard deviations are higher than those for the low proficiency group, but also that, in all cases, there is enough room below and above the mean for two or three standard deviations, which probably indicates the distributions are more or less normal. The Cronbach α and K-R21 reliability statistics are again low to moderate in magnitude for the high proficiency group. However, it is worth noting that in 7 out of 10 cases alpha is higher for the high proficiency group than it was for the low group.
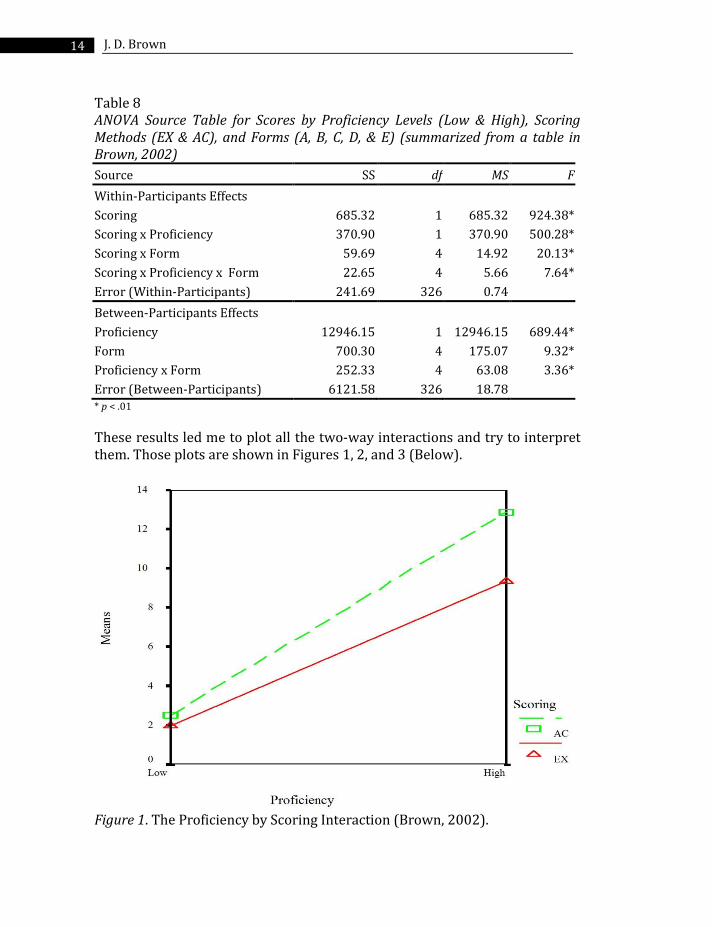
I began to wonder if any of the mean differences were statistically significant and, if so, what that would mean. Table 8 shows the results of a three-way (2 x 2 x 5) repeated-measures ANOVA with one dependent variable (scores) and three independent variables: proficiency levels (low & high) and scoring methods (EX & AC), and forms (A, B, C, D, & E). Notice that all the main effects and interactions are significant.
14 J. D. Brown
Table 8 ANOVA Source Table for Scores by Proficiency Levels (Low & High), Scoring Methods (EX & AC), and Forms (A, B, C, D, & E) (summarized from a table in Brown, 2002)
Source SS df MS F
Within-Participants Effects
Scoring 685.32 1 685.32 924.38*
Scoring x Proficiency 370.90 1 370.90 500.28*
Scoring x Form 59.69 4 14.92 20.13*
Scoring x Proficiency x Form 22.65 4 5.66 7.64*
Error (Within-Participants) 241.69 326 0.74
Between-Participants Effects
Proficiency 12946.15 1 12946.15 689.44*
Form 700.30 4 175.07 9.32*
Proficiency x Form 252.33 4 63.08 3.36*
Error (Between-Participants) 6121.58 326 18.78 * p < .01
These results led me to plot all the two-way interactions and try to interpret them. Those plots are shown in Figures 1, 2, and 3 (Below).
Figure 1. The Proficiency by Scoring Interaction (Brown, 2002).
15 International Journal of Language Studies, 7(1), 1-32
Figure 1 shows the interaction of proficiency groups and scoring methods. Notice that the mean scores for both proficiency groups are low and fairly similar for the EX scoring and the means are much higher for both groups when the AC scoring is applied. Note also that the means are much further apart in the latter case. Thus the high proficiency group appears to be gaining more advantage from the AC scoring than the low proficiency group.
Figure 2. The Proficiency by Form Interaction (Brown, 2002).
Figure 2 shows the interaction of proficiency groups and forms. Notice that the mean scores for the high proficiency group are generally much higher than those for the low proficiency group and that both the low and high proficiency group means range considerably across the five forms. Note also that the lines representing forms A and C are not parallel to the others indicating that the means of the different passages are in different orders for the two groups (i.e., the two groups found different cloze passages difficult or easy relative to each other).
16 J. D. Brown
Figure 3. The Scoring by Form Interaction (Brown, 2002).
Figure 3 shows the interaction of scoring methods and forms. Notice that the mean scores for the EX scoring method are generally lower than those for the AC scoring and that both the EX and AC scoring means range considerably across the five forms. Note also that the lines representing forms C and D cross others, indicating that the means of the different passages are in different orders for the two scoring methods (i.e., changing from EX to AC scoring made more of a difference for some forms than for others.
In short, considerable, though inconsistent, mean differences were found in these results for proficiency levels (low & high), scoring methods (EX & AC), and forms (A, B, C, D, & E created by simply altering the starting point).
Cloze tests appear to differ considerably in terms of central tendency, dispersion, and reliability depending on the proficiency levels of the students, the scoring method used, and even depending on forms (i.e., depending on the starting point of the cloze test). All in all, these results are similar to what I would expect to find in any series of raw test forms that I would develop, say multiple-choice forms developed from a bank of items. Such test forms would certainly differ somewhat if administered to students at different proficiency
17 International Journal of Language Studies, 7(1), 1-32
levels, and would produce different (even significantly different) means. Is there any reason for us to expect cloze tests to produce equivalent forms automatically? No, of course not. In fact, it appears that cloze test items are no different from any other item pool.
3.8. How Many Items Are Not Functioning Well in Cloze Tests Administered to Low and High Proficiency Groups?
The differences I found in comparing the overall results of Brown, Yamashiro, and Ogane (1999, 2001) led me to wonder how cloze tests administered to low and high proficiency groups would be different in terms of item facility and item discrimination.
I will consider item facility first (note that the information in Tables 9a and b is compiled from tables in Brown 2002). The last four columns of numbers in Table 9a show the frequency of items in four item difficulty ranges for the low proficiency group. Notice that only 0 to 5 items out of 30 in these cloze tests fell between .30 and .70, which could be considered the moderate difficulty range appropriate for developing norm-referenced tests with classical theory item statistics. Typically, norm-referenced test designers keep items ranging in IF from .30 to .70 and discard those outside that range. Thus, from an IF perspective alone, these cloze items are not very effective for this low proficiency group regardless of scoring method.
Table 9a Item Facility for Five Cloze Versions and Two Scoring Methods for the Low Proficiency Students (compiled from tables in Brown, 2002)
SCORING FORM Mean IF Range of IFs IF.00 IF.03-.29 IF.30-.70 IF.71-1.00
EXACT
EX A .05 .00-.28 12 18 0 0
EX B .08 .00-.53 13 14 3 0
EX C .02 .00-.18 17 13 0 0
EX D .05 .00-.32 18 11 1 0
EX E .12 .00-.53 7 19 4 0
All 150 items .034 .00-.53 67 75 8 0
ACCEPTABLE
AC A .06 .00-.28 9 21 0 0
AC B .10 .00-.53 11 16 3 0
AC C .05 .00-.28 10 20 0 0
AC D .07 .00-.47 16 12 2 0
AC E .14 .00-.53 5 20 5 0
All 150 items .084 .00-.53 51 89 10 0
18 J. D. Brown
Table 9b Item Facility for Five Cloze Versions and Two Scoring Methods for the High Proficiency Students (compiled from tables in Brown, 2002)
SCORING FORMS Mean IF Low IF IF.00 IF.03-.29 IF.30-.70 IF.71-1.00
EXACT
EX A .29 .00-.76 7 11 12 0
EX B .31 .00-.93 9 7 11 3
EX C .32 .00-.93 8 6 13 3
EX D .26 .00-.86 11 8 7 4
EX E .38 .00-.93 6 6 13 5
All 150 items .312 .00-.93 41 38 56 15
ACCEPTABLE
AC A .36 .00-.86 7 9 8 6
AC B .41 .00-.97 6 7 12 5
AC C .49 .00-.93 3 7 12 8
AC D .38 .00-.93 5 8 13 4
AC E .51 .04-.93 3 4 15 8
All 150 items .430 .00-.93 24 35 60 31
For the high proficiency group (Table 9b), 7 to 15 items out of 30 fell in the moderate difficulty range. Clearly, more of the items are falling in the range of .30 to .70 that test designers would like to have on a norm-referenced test. Thus, from an IF viewpoint, these cloze items are more appropriate for this high proficiency group than they were for the low proficiency group. However, it is also true that only one-quarter to one-half of the items for any given cloze test is falling in that .30 to .70 range. Thus, half to three-quarters of the items are not suitable norm-referenced items.
Next I will turn to item discrimination (note that Tables 10a and 10b are new, but are based on the data used in Brown 2002). The last four columns of Table 10a show frequencies of items that had very good ID values (.40 or higher), good ID (.30 - .39), marginal ID (.20 - .29), poor ID (.01 - .19), or were completely switched off with ID values of .00. Notice that these results indicate that approximately three-quarters of the items on these cloze tests were either poor discriminators or completely switched off when administered to the low proficiency group (for EX scoring, 49 + 67 = 116 and 116/150 =.773, or about 77.3%; for AC scoring 58 + 51 = 109 and 109/150 = .727 or about 72.7%). Table 10b shows the same statistics for the high proficiency group. Notice that about half to one-third of the items were poor discriminators or switched off for the high proficiency group: 46% for EX scoring (28 + 41 = 69 and 69/150 =.46) and about 35% for AC scoring (28 + 24 = 52 and 52/150 = .3467 ≈ .35). Such high proportions of non-
19 International Journal of Language Studies, 7(1), 1-32
discriminating items would never be tolerated in a well-developed norm-referenced multiple-choice test.
Table 10a Item Discrimination for Five Cloze Versions and Two Scoring Methods for the Low Proficiency Students (compiled from Brown, 2002 data)
SCORING FORM Mean ID
ID .40+
Very Good
ID .30-.39
Good
ID .20-.29
Marginal
ID .01-.19
Poor
ID .00
Switched Off
EXACT
EX A .12 2 3 2 11 12
EX B .15 3 4 2 8 13
EX C .07 2 0 1 10 17
EX D .11 3 2 0 7 18
EX E .17 4 4 2 13 7
All 150 items .124 14 13 7 49 67
ACCEPTABLE
AC A .13 3 2 1 15 9
AC B .16 2 7 1 9 11
AC C .12 3 3 0 14 10
AC D .12 2 3 1 8 16
AC E .19 3 7 3 12 5
All 150 items .144 13 22 6 58 51
Table 10b Item Discrimination for Five Cloze Versions and Two Scoring Methods for the High Proficiency Students (compiled from Brown, 2002 data)
SCORING FORM Mean ID
ID .40+
Very Good
ID .30-.39
Good
ID .20-.29
Marginal
ID .01-.19
Poor
ID .00
Switched Off
EXACT
EX A 0.23 10 2 4 7 7
EX B 0.26 10 6 2 3 9
EX C 0.29 12 2 2 6 8
EX D 0.23 9 3 3 4 11
EX E 0.22 5 6 5 8 6
All 150 items 0.246 46 19 16 28 41
ACCEPTABLE
AC A 0.28 12 5 2 4 7
AC B 0.26 10 5 2 7 6
AC C 0.38 20 0 2 5 3
AC D 0.30 12 2 4 7 5
AC E 0.29 4 10 8 5 3
All 150 items 0.302 58 22 18 28 24
20 J. D. Brown
Generally speaking, then, the IF and ID statistics in Brown (2002) indicate that many of these cloze items were terrible norm-referenced items even though the descriptive and reliability statistics for the whole cloze tests were encouraging for some of the forms, especially for the high proficiency group. If these cloze items had been typical multiple-choice items, they would have needed much revision and many items would have been eliminated before most testers would be willing to use them for making decisions.
3.9. Are Different Items Functioning Well in Cloze Tests Administered to Low and High Proficiency Groups?
The results discussed in the previous three sections, quite naturally led me to wonder if it was the same or different items that were functioning well in the two groups. So I looked at the item level results overall in terms of how many items were discriminating and how many of those items were the same or unique for the low and high proficiency groups.
Table 11a EX Scoring - Frequency and Percent of Common and Unique Items in Terms of Discrimination for Low and High Proficiency Groups (compiled from Brown, 2002 data)
EX Scoring Frequency
Low Group
Frequency
High Group
Percent
Low Group
Percent
High Group
Total Items 150 150 100% 100%
Items Not Discriminating 116 69 77% 46%
Items Discriminating 34 81 23% 54%
Of Those Discrmininating:
Items Common 25 25 74% 31%
Items Unique 9 56 26% 69%
Table 11b AC Scoring - Frequency and Percent of Common and Unique Items in Terms of Discrimination for Low and High Proficiency Groups (compiled from Brown, 2002 data)
AC Scoring Frequency
Low Group
Frequency
High Group
Percent
Low Group
Percent
High Group
Total Items 150 150 100% 100%
Items Not Discriminating 109 52 73% 35%
Items Discriminating 41 98 27% 65%
Of Those Discrmininating:
Items Common 31 31 76% 32%
Items Unique 10 67 24% 68%
21 International Journal of Language Studies, 7(1), 1-32
Among other things, Tables 11a and 11b (again, new tables based on the data used in Brown 2002) show that those items that were discriminating for the low and high groups were not exactly the same. In fact, the proportions of the discriminating items that were unique (i.e., discriminating with one group but not the other) ranged from 24% to 69% depending on scoring method and group. In short, the two groups were receiving the same items, but different sets of items within the pool of all cloze items were actually contributing to the test variances for the two groups.
4. Discussion
In this paper, I set out to examine the whole body of my cloze testing research in terms of the results of the studies and the questions each raised that led to further studies. Here, I will give short and direct answers to those questions without citations and other clutter.
4.1. How Do Score Distributions Generally Affect Cloze Results?
In the process of writing my first few cloze test studies, I came to understand the importance of score distributions to research design and statistical interpretation. I now believe that all cloze test studies, especially any focusing on the relative efficacy of scoring methods, deletion patters, etc. must take into account what happens when those passages are of varying difficulty and administered to students of varying ability.
4.2. How Do Score Distributions Affect Cloze Reliability and Validity Statistics?
Cloze test score distributions radically affect the magnitudes of any reliability or validity statistics that are reported. A single cloze test may look very unreliable and invalid when used with a group whose scores are tightly clustered, but highly reliable and valid with another group whose scores are widely dispersed. As in all testing, cloze test reliability and validity are not characteristics of the test itself, and certainly not characteristics of the testing type, but rather are characteristics of the particular test when administered to a particular group of examinees for a particular purpose.
4.3. Does Tailoring Cloze, Using Item Analysis, Lead to a More Reliable and Valid Test?
I can state unequivocally that the tailoring process works as it would in any test to improve the measurement characteristics in terms of central tendency, dispersion, reliability, and validity. However, it appears that the proportion of items that is functioning well in a typical untailored cloze test is likely to be smaller than I would expect in a pool of items that ESL professionals might write for multiple-choice tests.
22 J. D. Brown
4.4. Are Cloze Tests Basically Sentential or Intersentential?
Cloze tests can be sentential and intersentential at the same time depending on the passage difficulty and the proficiency of the students. The potential for both sentential and intersentential items must exist in most passages because that potential exists in the written language. But, potential items are not testing anything if they are switched off. Maybe we should instead be asking what balance of sentential and intersentential items is a particular cloze test assessing with a specific group.
4.5. Why Does K-R21 Consistently Underestimate Cloze Reliability?
I think it is clear that the K-R21 formula underestimates cloze test reliability largely because cloze tests have large numbers of items that are either switched off or very difficult. As a result, cloze tests have many items outside the .30 to .70 range of item facility that we typically use to select items for multiple-choice tests. Hence, cloze tests have many violations of the assumption of equal item difficulty that underlies the K-R21 formula.
4.6. Are There Cloze Items That Are Not Contributing at All to Test Variance?
Gradually, I have come to understand the magnitude of the problem of switched off items, and realized how poorly the items in my cloze tests have been functioning on average, even though many of my cloze tests have produced moderately high reliability estimates. When I have found weak reliability and validity coefficients, it now appears to me that these weak results were due in large part to the many items that were not contributing anything to the test variance usually because they were too difficult.
4.7. How Do Cloze Tests Administered to Low and High Proficiency Groups Differ Overall?
Cloze tests differ considerably in terms of central tendency, dispersion, and reliability depending on the proficiency levels of the students, passage difficulty, scoring methods, and even depending on the starting points of forms created from one passage. I would expect the same sorts of differences from any series of raw test forms that I would develop. No item pool can be expected to automatically work equally well for low and high proficiency groups, so why would we expect that to occur with cloze items?
4.8. How many items are not functioning well in cloze tests administered to low and high proficiency groups?
All in all, detailed item analyses in my studies indicated that my raw cloze test items were functioning only poorly for norm-referenced purposes with low proficiency students and only marginally better with high proficiency
23 International Journal of Language Studies, 7(1), 1-32
students. Good test development practices would never allow us to use tests with such high percentages of multiple-choice test items that were producing no variance or discriminating poorly to marginally.
4.9. Are different items functioning well in cloze tests administered to low and high proficiency groups?
Looking only at those few items that were discriminating well for the low and high proficiency groups, I found that they are not exactly the same items. The low and high proficiency groups were probably receiving substantially different tests in the sense that different sets of items within the pool of all cloze items were functioning well for the two groups.
5. Some clozing thoughts
I would like to reflect here on (a) how I learned from my mistakes, (b) how I often learned more than I set out to learn, and (c) how the whole is truly greater than the sum of the parts.
5.1. Learning from my mistakes
In the process of doing my cloze research, I have made a number of mistakes. Typically, these mistakes have taught me important lessons in a way that insures I will never forget them.
First, my mistakes have taught me ways to improve my research designs in the future studies. For example, in Brown (1978, 1980), I ignored an important variable in setting up my study: passage difficulty. I concluded that AC scoring was the best scoring method from among four in terms of item statistics, reliability, validity, and practicality. Unfortunately, I now understand that it was only the best scoring method for that particular passage. If the passage had been easier or more difficult another scoring method would have appeared to be better. From that time forward, I have been very sensitive to the need for considering passage difficulty (and many other variables) in my research designs and those of my graduate students.
Second, my mistakes have taught me some of the nuances of correctly interpreting statistics. Again, learning from the flaws of Brown (1978, 1980), I have become keenly aware of the supreme importance of carefully considering descriptive statistics and the distributions they represent in interpreting any other statistical results in my own studies and in those of my students. I have also noticed (as did UHM students Norris and Ortega 2000) that many studies in our professional journals fail to provide basic descriptive statistics and reliability information, making their fancy ANOVAs, multiple regressions, factor analyses, etc. impossible to interpret properly.
24 J. D. Brown
Third, my mistakes have taught me to be wary of theoretical blinders that I might unconsciously be wearing because of my own pre-formed belief systems about language learning and language testing. For instance, in Brown 1983, based on the observation that many of the blanks were involved in cohesion in one way or another, I concluded that cloze tests at least have a substantial number of items that are intersentential in nature. In retrospect, I realize that I was very much influenced by John Oller (who was indeed very influential in language testing circles back then) and that I was not at all unhappy to find that my results supported his view of cloze tests. In addition, my interpretation somehow satisfied my need to see cloze as wonderful all-powerful truly ‘integrative’ test of everything. I have since realized that my interpretation ignored the quite obvious possibility that the presence of cohesion blanks in a cloze test means nothing if those cohesion items are not contributing at all to the test variance. That realization, in turn, led me to other studies that ultimately helped me to demonstrate in Brown (2002) the peculiar nature of the problem of cloze items that are switched completely off.
Fourth, my mistakes have taught me many things I didn’t previously know about my field. Because of the mistakes in Brown (1978, 1980) and how I later came to understand them, I lost a good deal of my faith in the professors at UCLA who had been guiding me in my research. As a result, I took numerous research and statistics courses outside of my department. Then, I began to wonder how on earth an article as weak as my 1980 article ever got published in The Modern Language Journal. Reflecting on that question led me to rethink my view of the quality of that journal, indeed, my view of the quality of all the journals in our field. This skepticism inevitably led me to notice similar problems in almost every statistical study I read in our field. Among other problems, crucial variables remain unaccounted for in many, if not most, studies, descriptive statistics and reliability statistics are absent from most studies, and theoretical blinders appear everywhere I look.
Thus mistakes in my own research have reshaped my thinking about research design, about statistical interpretations, about the danger of wearing theoretical blinders, and indeed about my whole profession, but they reshaped my thinking only because I recognized them as mistakes, because I was willing to think about the meaning of those mistakes, and because I chose to learn from my mistakes. Perhaps that is the most important message of this paper.
5.2. Learning more than I set out to learn
Careful examination of the nine questions addressed in this paper and comparison of those questions to the research questions in the original
25 International Journal of Language Studies, 7(1), 1-32
studies will reveal that all nine arose from aspects of my research that I had not anticipated, aspects I had simply noticed along the way.
A clear example occurred while I was conducting Brown (1983). I had set out to test Farhady’s (1983) claim that cloze items are interdependent and therefore application of standard reliability estimates is inappropriate. Farhady’s original theoretical hypothesis turned out to be of little concern. However, an unintended side-result was more important, at least to me: I noticed for the first time that the K-R21 formula consistently underestimated the reliability of cloze tests relative to Cronbach alpha, K-R20, and other estimates. In trying to figure out why that was true, I finally learned that the assumption of equal item difficulty was probably being violated. That fact led me to more carefully examine all my subsequent cloze tests in terms of item facility. Almost every other study has led to similar unexpected observations.
Qualitative researchers sometimes complain that quantitative research can only answer those questions it asks. I think my research illustrates that they are wrong, at least in some cases. In fact, I think it is incumbent on all of us who do quantitative research to always be on the lookout for oddities, unexpected observations, or anomalies in our data, and then for us to try to understand and explain them on the spot or in later research. My experience is that, sometimes, such unexpected findings will turn out to be more interesting than our original research questions.
5.3. The whole is greater than the sum of the parts
The process of writing this article reviewing all my cloze research has helped me to understand the cumulative nature of my own research and to see that the whole picture of my work and the work of others is much more important than any one of the pieces or even the sum of those pieces. In this last section, I will reflect on the implications that I have drawn from looking back across this whole procession of cloze testing research in terms of the implications for cloze testing itself, but also in terms of the broader implications for research in our field.
I will turn first to the narrower cloze testing implications of this study. I started out my cloze research career wondering what it is that cloze is testing. But I now know that was the wrong question. I should instead have been asking: what is this particular cloze passage testing when it is administered to this specific type of students. We have no business making claims that cloze is this or cloze is that. When we do so, we ignore one of the basic tenets of psychometrics, which is that a test is only reliable and valid for a particular population of examinees. Thus the only claims we can make are that a particular cloze passage (of such and such readability, length, topic, genre, etc.) under particular circumstances (deletion type and pattern, number of
26 J. D. Brown
deletions, passage length, etc.) with a particular type of student (ESL/EFL, nationality a, b, or c, and ability level x, y, or z) is testing this and that. Cloze tests are no different from any other item pool, and there is no reason to expect that they would be. Mullen (1979) was right to refer to cloze tests as a ‘family of item types’ and Alderson (1979) was correct to refer to cloze tests as ‘merely a technique for producing tests, like any other technique’. However, I think I can now take their notions one step further and say that, yes, cloze tests are just another technique for creating contextualized test items, but it is a technique that is not very efficient in terms of developing items at the appropriate level of difficulty that discriminate well in second language populations.
We are realistic enough in developing multiple-choice tests to select those items that are working well for the final version of a test and even to let those items help us define and name the appropriate subtests for our particular group of students. Why then are we not willing to do the same with cloze tests? Why do we think that cloze tests are somehow different from other tests?
To frame these issues in terms of the sentential/intersentential controversy reviewed at the top of this article, cloze is not necessarily a test of sentence level grammar, nor is it necessarily a test of higher level constraints sometimes represented by cohesion. It has the potential to be both, but potential does not mean anything with regard to cloze items because potential may remain completely unrealized if the particular items representing that potential are producing absolutely no variance on the test.
In my own cloze research, I appear to have come full circle in the sense that I now believe that developing a successful norm-referenced cloze test should definitely involve using the same steps (shown in Appendix A) used in developing a multiple-choice norm-referenced test. These procedures are what I was taught as a novice language tester and what I called well-tailored cloze in my 1984 study, and demonstrated in my 1988 paper. Since then, however, I have discovered that cloze tests by definition involve a sort of tailoring process. Either you will do it on purpose through some sort of rational well-tailored cloze item analysis process or it will occur naturally with tremendous inefficiency because many items will naturally be switched off or discriminating poorly/marginally. Sure, some items will be discriminating well on virtually any cloze test because they happen to be well-suited to the students, but many will not be functioning at all.
It seems to me that using such a raw cloze test operationally without tailoring it is professionally irresponsible—very much like developing a pool of multiple-choice items and using them without any piloting, item analysis, selection, or revision processes and hoping some of those items will
27 International Journal of Language Studies, 7(1), 1-32
discriminate. In other words, a cloze test that is not tailored is just an inefficient collection of unpiloted items. Do you really want to administer such a raw test to your students when you are making the important sorts of high-stakes proficiency and placement decisions you make with norm-referenced tests?
Turning now to the broader research implications of this study, I think my experiences may contain some valuable lessons for all researchers. Whether or not we are doing research on cloze tests, I think it is crucial that we stop thinking about research as a one shot affair that is completed once-and-for-all. As a field, we need to stop relying on the research of people who do some ‘small-scale study’ and then say, ‘Whew! My MA thesis is finished; I’m never doing research again’. To that end, we may need to rely more heavily on professional researchers, perhaps encouraging one-shot researchers to do much-needed replication studies or to work within carefully defined research agendas established by more experienced researchers.
As a field, we may also need to encourage older, more-experienced researchers to continue doing primary empirical research over longer periods of time. I for one find increasing demands on my time to: (a) perform administrative functions within my department, (b) seek and get grants, (c) do plenary addresses and other invited presentations, and (d) write invited ‘think papers’, literature reviews, etc. I also find increasing road blocks to my doing empirical research in the human-subjects requirements, needless paperwork, and review committees that I must deal with, as well as in the declining budgets at my university that make it impossible to do sound empirical research. I therefore find myself too busy and too tired to do primary empirical research and, in any case, more prone to doing other (easier) and more prestigious activities. As this paper illustrates, I am still interested in empirical research, but, as this paper also illustrates, it is much easier to look back at existing data than to start from scratch. I suspect that I am not alone among senior academics.
What can be done to address the issues raised here? I would suggest that, much in the same way an organization like TESOL claims to be an advocate for ESL teachers, perhaps an organization like AAAL could take on the role of shaping how and who is doing research in our field. Perhaps by formulating policies or setting standards for research such an organization could encourage longer term professional research and find ways to keep senior researchers at it for longer periods of their careers (perhaps through grants, collaborations, solicited studies, and other forms of encouragement). Strategies could also be worked out for encouraging one-shot researchers to do replications that many may avoid because they are so hard to get published (e.g., journals like Applied Linguistics could be encouraged to
28 J. D. Brown
publish (perhaps in a special section) brief reports of replication studies and papers studies with null results).
Whatever strategies are used, in the long run, all researchers in applied linguistics, young or old, need to think of research as a procession of less-than-perfect studies over a period of years, influenced by the research of others, and based on learning from our mistakes, expecting the unexpected, addressing new questions that arise, taking the longer view of our own work, and understanding the progress of the field to be a process of consensus over time.
The Author
James Dean ("JD") Brown (Email: [email protected]) is Professor of Second Language Studies at the University of Hawai‘i at Manoa. He has spoken and taught in places as divers as Brazil, China, Cuba, Egypt, France, Indonesia, Japan, Mexico, Morocco, New Zealand, Oman, Russia, Saudi Arabia, Thailand, Tunisia, Turkey, UAE, Venezuela, and the former Yugoslavia. He has published numerous articles on language testing, curriculum design, and research methods, and books on: reading statistical language studies (Cambridge U. Press), language curriculum (Heinle & Heinle), language testing (2nd ed. with McGraw-Hill), language testing in Japan (edited with Yamashita for JALT), testing pragmatics (two books with Hudson and Detmer, UH Press), performance testing (two books with Norris & Hudson, UH Press), criterion-referenced language testing (with Hudson, Cambridge U. Press), using surveys in language programs (Cambridge U. Press), doing applied linguistics research (with Rodgers, Oxford U. Press), language test development (edited with Hudson, UH Press), as well as edited collections of modules for classroom assessment (TESOL), of articles on teaching connected speech to L2 speakers (with Kondo-Brown, UH Press), and of studies on teaching Chinese, Japanese, and Korean heritage students (with Kondo-Brown, LEA).
References
Alderson, J. C. (1978). A study of the cloze procedure with native and non-native speakers of English (doctoral dissertation, University of Edinburgh).
Alderson, J. C. (1979a). Scoring procedures for use on cloze tests. In C. A. Yorio, K. Perkins, & J. Schachter (Eds.), On TESOL '79 (pp. 193-205). Washington, DC: TESOL.
Alderson, J. C. (1979b). The cloze procedure and proficiency in English as a foreign language. TESOL Quarterly, 13(2), 219-227.
29 International Journal of Language Studies, 7(1), 1-32
Alderson, J. C. (1980). Native and non-native speaker performance on cloze tests. Language Learning, 30, 59-76.
Bachman, L. F. (1985). Performance on cloze tests with fixed-ratio and rational deletions. TESOL Quarterly, 19, 535-555.
Bormuth, J. R. (1965). Validities of grammatical and semantic classifications of cloze test scores. In J. A. Figurel (Ed.), Reading and inquiry (pp. 283-285). Newark, DE: International Reading Associates.
Bormuth, J. R. (1967). Comparable cloze and multiple-choice comprehension tests scores. Journal of Reading, 10, 291-299.
Brown, J. D. (1978). Correlational study of four methods for scoring cloze tests. MA Thesis, University of California at Los Angeles.
Brown, J. D. (1980). Relative merits of four methods for scoring cloze tests. Modern Language Journal, 64, 311-317.
Brown, J. D. (1983). A closer look at cloze: Validity and reliability. In J. W. Oller, Jr. (Ed.), Issues in language testing research (pp. 237-250). Rowley, MA: Newbury House.
Brown, J. D. (1984). A cloze is a cloze is a cloze? In J. Handscombe, R. A. Orem, & B. P. Taylor (Eds.), On TESOL '83 (pp. 109-119). Washington, DC: TESOL.
Brown, J. D. (1988). Tailored cloze: Improved with classical item analysis techniques. Language Testing, 5, 19-31.
Brown, J. D. (1989). Cloze item difficulty. JALT Journal, 11, 46-67.
Brown, J. D. (1992). What text characteristics predict human performance on cloze test items. In the Proceedings of the Third Conference on Language Research in Japan (pp. 1-26). Urasa, Japan: International University Japan.
Brown, J. D. (1993). What are the characteristics of natural cloze tests? Language Testing, 10, 93-116.
Brown, J. D. (1994). A closer look at cloze: Validity and reliability. In J. W. Oller, Jr., & J. Jonz (Eds.), Cloze and coherence (pp. 189-196). Lewisburg, PA: Associated University Presses. [Reprinted by permission from the original: Brown, J. D. (1983).]
Brown, J. D. (1998). An EFL readability index. JALT Journal, 20(2), 7-36.
Brown, J. D. (2002). Do cloze tests work, or is it just an illusion? Second Language Studies: Working Papers of the Department of Second Language Studies, University of Hawai‘i, 20(2), 79-125.
30 J. D. Brown
Brown, J. D., Yamashiro, A. D., & Ogane, E. (1999). Tailored cloze: Three ways to improve cloze tests. University of Hawaii Working Papers in ESL, 17(2), 107-129.
Brown, J. D., Yamashiro, A. D., & Ogane, E. (2001). The Emperor’s new cloze: Strategies for revising cloze tests. In T. Hudson & J. D. Brown (Eds.), A focus on language test development (pp. 143-161). Honolulu, HI: University of Hawai‘i Press.
Chavez-Oller, M. A., Chihara, T., Weaver, K. A., & Oller, J. W., Jr. (1985). When are cloze items sensitive to constraints across sentences? Language Learning, 35, 181-206.
Chihara, T., Oller, J. W., Jr., Weaver, K. A., & Chavez-Oller, M. A. (1977). Are cloze items sensitive to constraints across sentences? Language Learning, 27, 63-73.
Cohen, A. D. (1980). Testing language ability in the classroom. Rowley, MA: Newbury House.
Conrad, C. (1970). The cloze procedure as a measure of English proficiency. Unpublished master's thesis, University of California Los Angeles.
Crawford, A. (1970). The cloze procedure as a measure of reading comprehension of elementary level Mexican-American and Anglo-American children. Unpublished doctoral dissertation, University of California Los Angeles.
Darnell, D. K. (1970). Clozentropy: a procedure for testing English language proficiency of foreign students. Speech Monographs, 37, 36-46.
Farhady, H. (1983). New directions for ESL proficiency testing. In J. W. Oller, Jr. (Ed.), Issues in language testing research (pp. 253-269). Rowley, MA: Newbury House.
Gallant, R. (1965). Use of cloze tests as a measure of readability in the primary grades. In J. A. Figurel (Ed.), Reading and inquiry (pp. 286-287). Newark, Delaware: International Reading Associates.
Halliday, M.A.K., & Hasan, R. (1976). Cohesion in English. London: Longman.
Hinofotis, F. B. (1980). Cloze as an alternative method of ESL placement and proficiency testing. In J. W. Oller Jr. & K. Perkins (Eds.), Research in language testing (pp. 121-128). Rowley, MA: Newbury House.
Irvine, P., Atai, P., & Oller, J.W. Jr., (1974). Cloze, dictation, and the Test of English as a Foreign Language. Language Learning, 24, 245-252.
Jonz, J. (1976). Improving on the basic egg: the M-C cloze. Language Learning, 26, 255-256.
31 International Journal of Language Studies, 7(1), 1-32
Jonz, J. (1987). Textual cohesion and second language comprehension. Language Learning, 37, 409-38.
Jonz, J. (1990). Another turn in the conversation: What does cloze measure? TESOL Quarterly, 24(1), 61-83.
Kuder, G. F., & Richardson, M. W. (1937). The theory of estimation of test reliability. Psychometirika, 2, 151-160.
Markham, P. L. (1985). The rational deletion cloze and global comprehension in German. Language Learning, 35, 423-430.
Mullen, K. (1979). More on cloze tests as tests of proficiency in English as a second language. In E.J. Briere, & F.B. Hinofotis (Eds.), Concepts in language testing: Some recent studies (pp. 21-32). Washington, DC: TESOL.
Norris, J. M., & Ortega, L. (2000). Effectiveness of L2 instruction: A research synthesis and quantitative meta-analysis. Language Learning, 50(3), 417-528.
Oller, J. W., Jr. (1972a). Dictation as a test of ESL proficiency. In H. B. Allen, & R. N. Campbell (Eds.), Teaching English as a second language: A book of readings (pp. 346-354). New York: McGraw-Hill.
Oller, J. W., Jr. (1972b). Scoring methods and difficulty levels for cloze tests of proficiency in English as a second language. Modern Language Journal, 56, 151-158.
Oller, J. W., Jr. (1979). Language tests at school: A pragmatic approach. London: Longman.
Oller, J. W., Jr., & Inal, N. (1971). A cloze test of English prepositions. TESOL Quarterly, 5, 315-326.
Pike, L. W. (1973). An evaluation of present and alternative item formats for use in the Test of English as a Foreign Language. Princeton, NJ: Educational Testing Service.
Porter, D. (1983). The effect of quantity of context on the ability to make linguistic predictions: A flaw in a measure of general proficiency. In A. Hughes, & D. Porter (Eds.), Current developments in language testing (pp. 63-74). London: Academic Press.
Revard, D. (1990). Tailoring the cloze to fit: Improvement of cloze tests through classical item analysis. Unpublished scholarly paper. Honolulu, HI: University of Hawaii at Manoa.
32 J. D. Brown
Ruddell, R. B. (1964). A study of the cloze comprehension technique in relation to structurally controlled reading material. Improvement of Reading Through Classroom Practice, 9, 298-303.
Stubbs, J. B., & Tucker, G. R. (1974). The cloze test as a measure of ESL proficiency for Arab students. Modern Language Journal, 58, 239-241.
Taylor, W. L. (1953). Cloze procedure: A new tool for measuring readability. Journalism Quarterly, 30, 414-438.
Appendix A: Steps for Creating Tailored Cloze
1) Create a large pool of say 150 items by finding a passage of roughly appropriate length, topic, and difficulty for the average student in the population to which it is to be applied and creating say 30 blanks at every nth word intervals, where n is determined by the amount of context the students will need and the length of the passage; then create four additional forms with different starting points for at total of five 30 item forms including 150 items
2) Pilot the items by randomly distributing them in a fairly large group of students similar to the target population
3) After the students have taken the test, perform item analysis to estimate item facility and item discrimination.
4) In each set of five items eliminate those that are switched off (ID = .00) or are discriminating only poorly (.01 to .19). If possible also eliminate items that are discriminating only marginally (ID = .20 to .29) or are outside of the IF range from .30 to .70. To preserve a fairly even spread of items across the passage, you may want to keep the best item in each set of five items, that is from the five items constituting the first item in the five forms, the five making up the second item in the five forms, etc.
5) Retype the cloze passage with blanks only for the items that are not working well and reprint the new cloze test.
6) Administer the new, shorter cloze test that has been tailored such that it presents only those items that discriminate well for the particular group in question.
7) Investigate the newly tailored cloze for reliability and validity.