Myanmar Data Collection Survey on State-Owned Enterprises in Myanmar Final Report February 2013 Japan International Cooperation Agency (JICA) Japan Economic Research Institute Inc. Daiwa Institute of Research Ltd. IL JR 13-018
Transcript
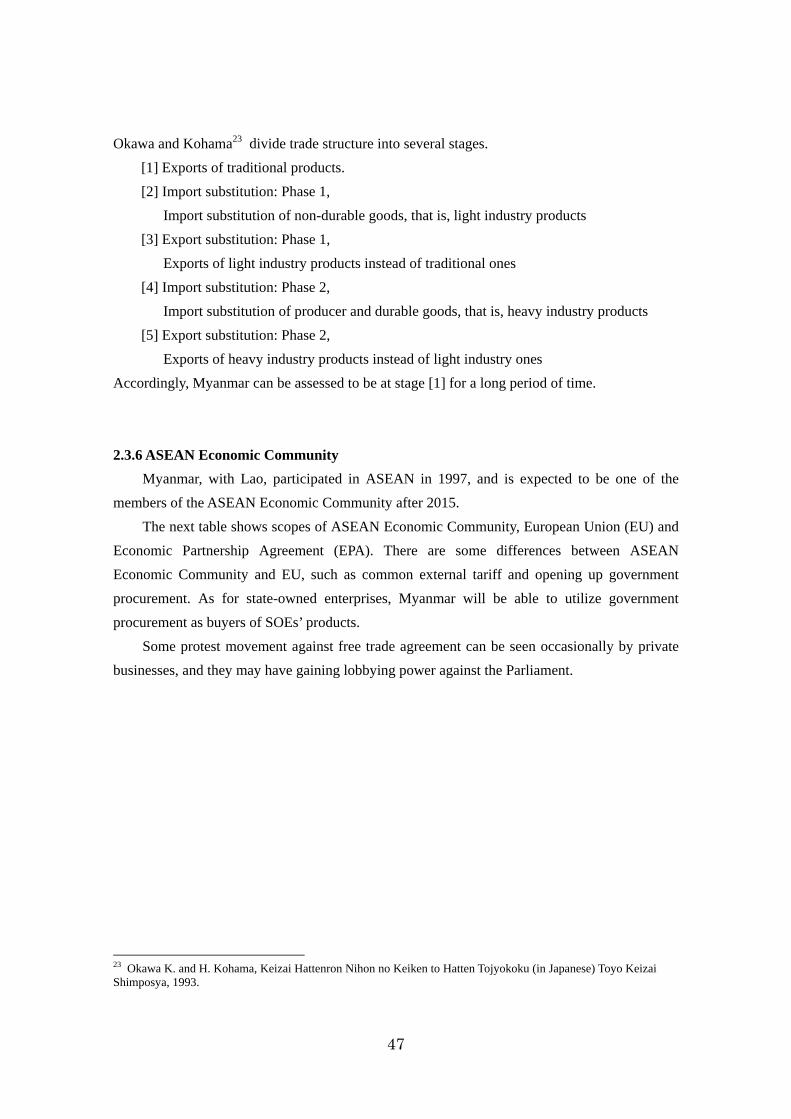
Myanmar Data Collection Survey on
State-Owned Enterprises in Myanmar Final Report
February 2013
Japan International Cooperation Agency (JICA)
Japan Economic Research Institute Inc. Daiwa Institute of Research Ltd. IL
JR
13-018
Myanm
ar Data C
ollection Survey on State-Ow
ned Enterprises in M
yanmar Final R
eport February 2013
Table of contents
1. Project Objective and Scope .............................................................................................................................................1
1.3 Study team.............................................................................................................................................................................4
2. Industrial Structure and Manufacturing Sector................................................................................................................5
2.1.1 Transitions of economic systems in Myanmar (colonial → social democracy → Burmese way to
socialism → market economy under military rule → open and free market policy)..................................5
2.1.1.1 Economy under British rule, a period of foreign exploitation.......................................................................6 2.1.1.2 Social democratic system (from 1948 to 1962): Nationalization of foreign assets and fostering of
private capital .................................................................................................................................................................7 2.1.1.3 First half of Burmese way to Socialism (from 1962 to 1974): Nationalization and isolation....................8 2.1.1.4 Second half of Burmese way to Socialism (from 1974 to 1988): Relaxation of isolation policy..............8 2.1.1.5 First half of market oriented reform under military rule (from 1988 to 1997) : Expansion of the private
sector .............................................................................................................................................................................10 2.1.1.6 Second half of market oriented reform under military rule (from 1997 to 2011) :Strengthened control
over economy and import restriction .........................................................................................................................11 2.1.1.7 Political and economic liberalization (from 2011 to present): Free competition and free trade...............14
2.1.2 Statistical analysis of industry structure .................................................................................................................15
2.1.3 Position of SOEs in the economy of Myanmar. ...................................................................................................18
2.2 Overview of manufacturing sector ...................................................................................................................................19
2.2.1 Current status of manufacturing sector ..................................................................................................................19
2.2.2 Current status of products to be surveyed..............................................................................................................22
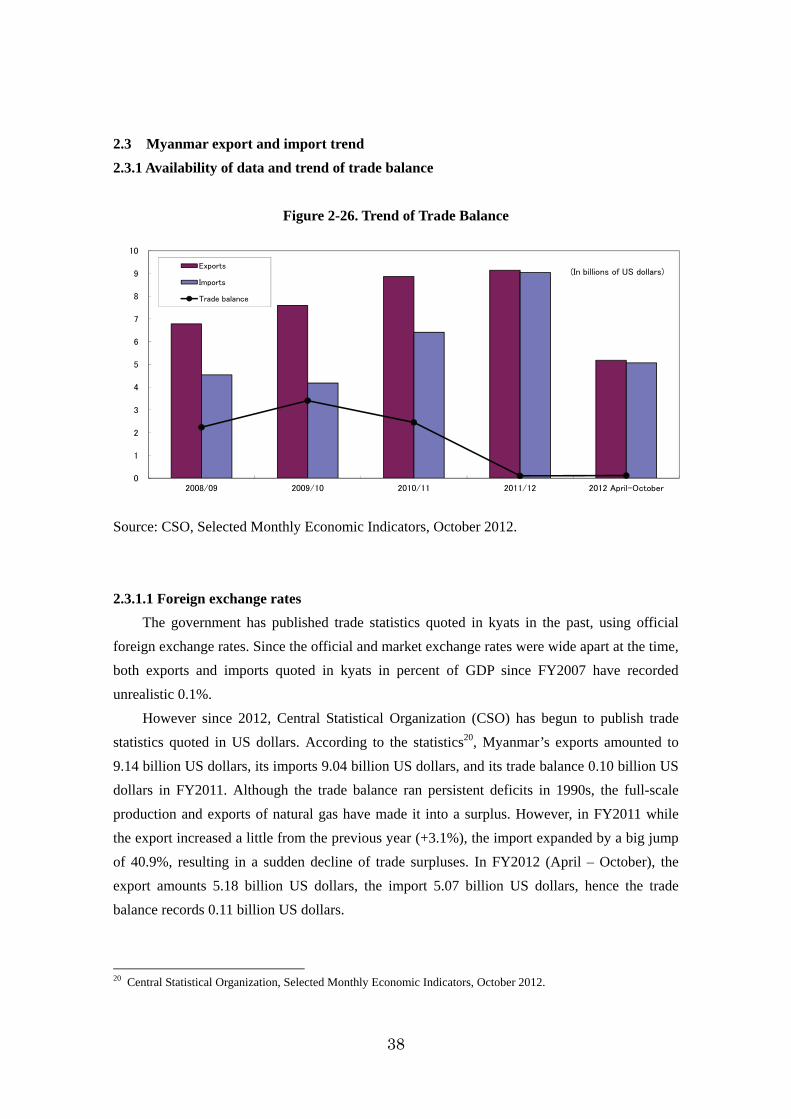
2.3 Myanmar export and import trend.................................................................................................................................38
2.3.1 Availability of data and trend of trade balance ......................................................................................................38
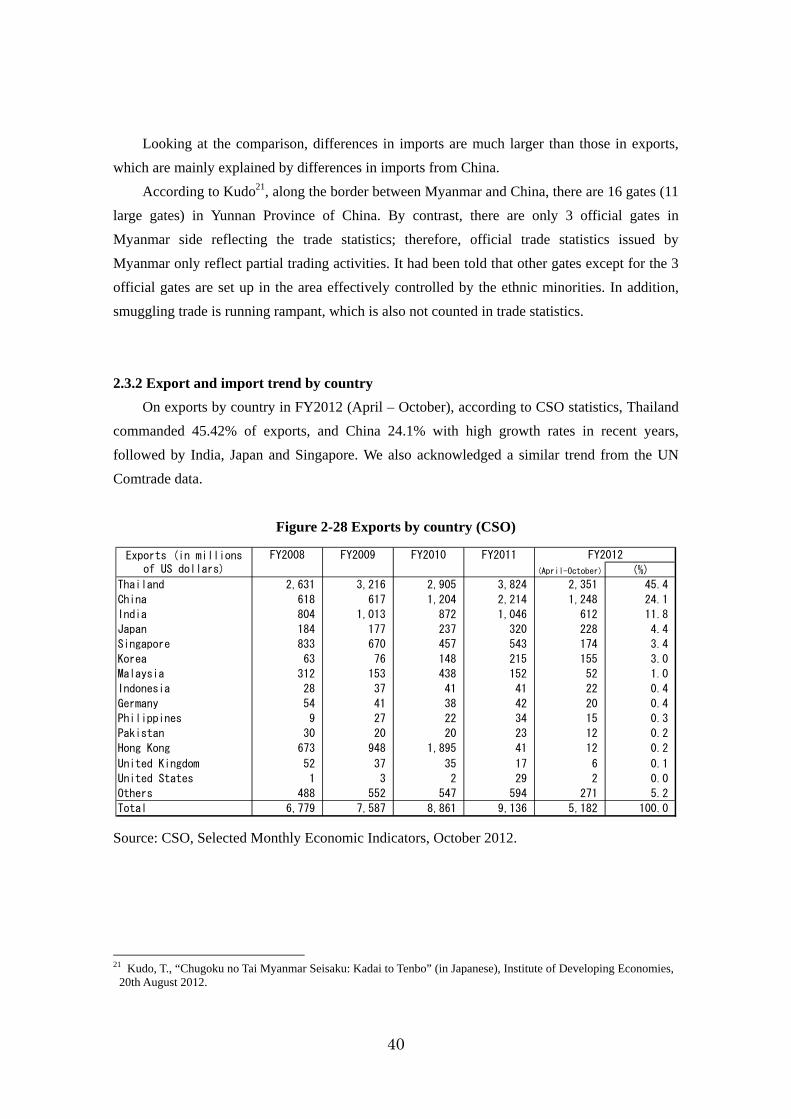
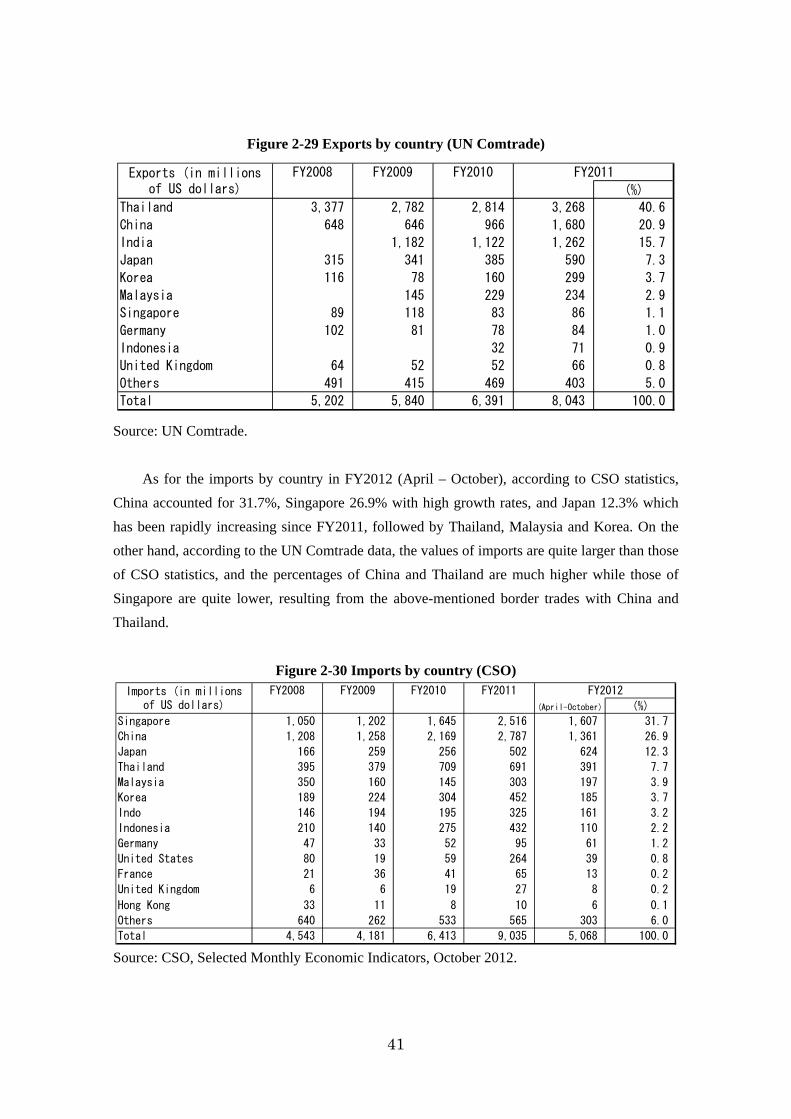
2.3.2 Export and import trend by country.......................................................................................................................40
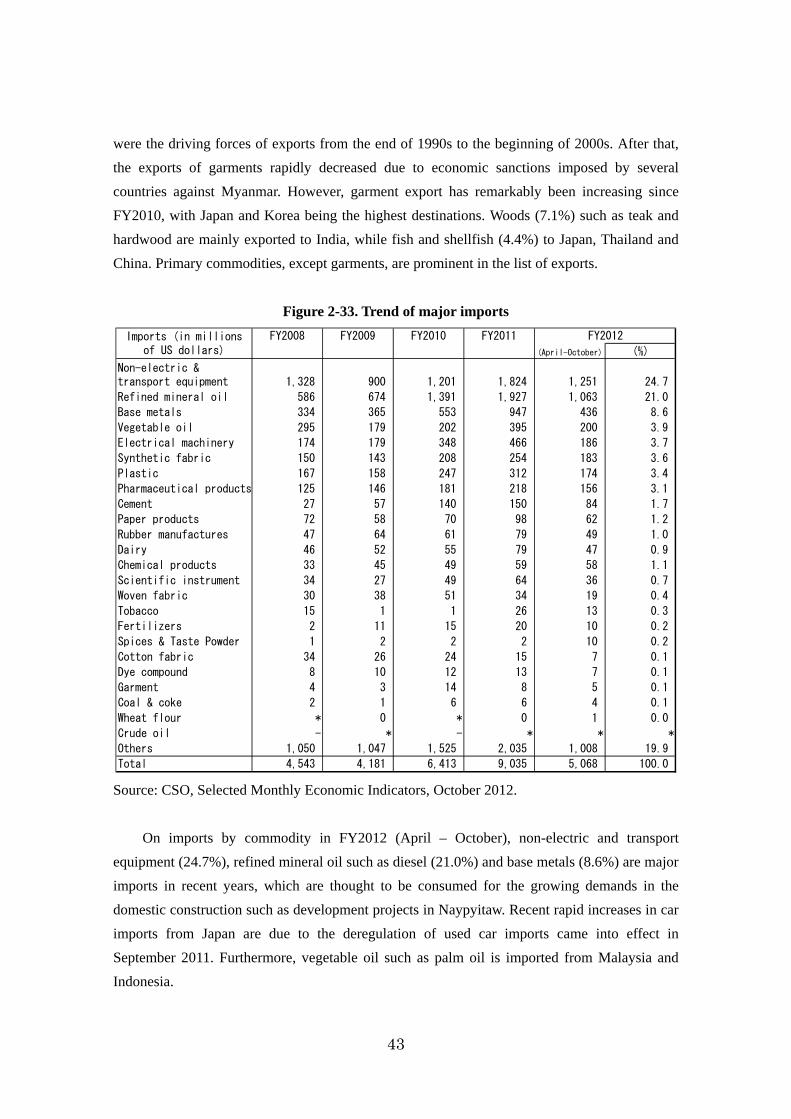
2.3.3 Major Imports and Exports.....................................................................................................................................42
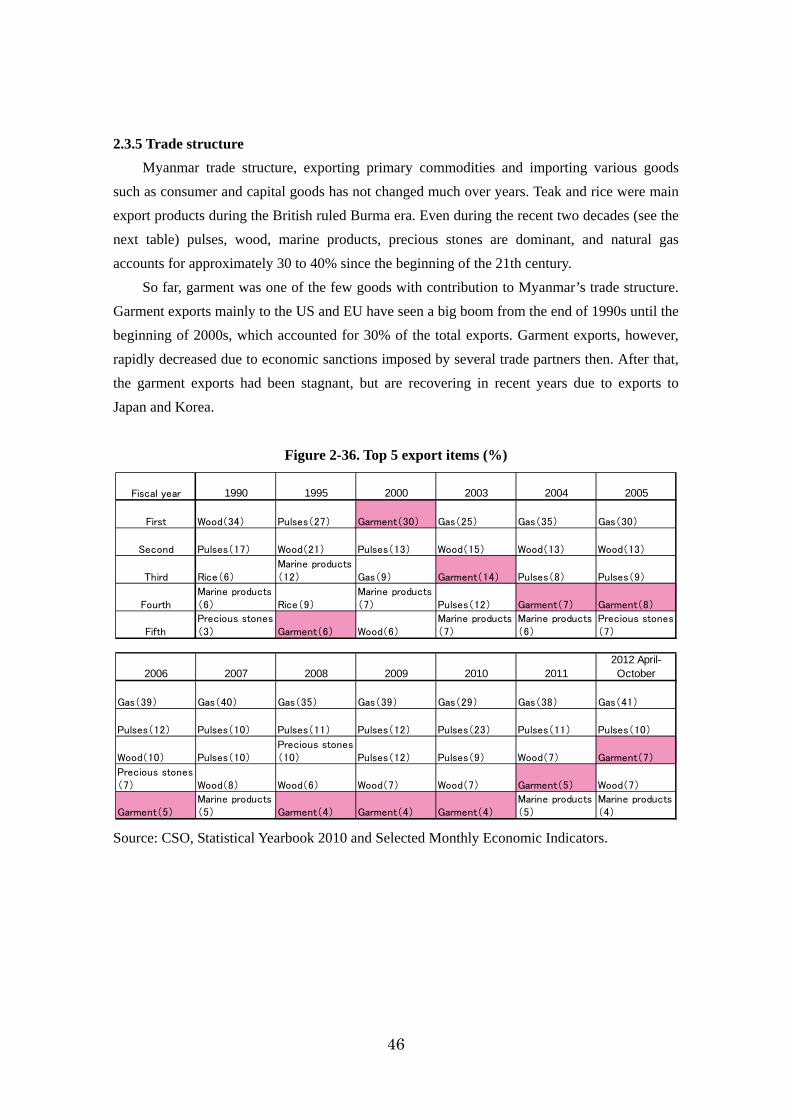
2.3.4 Export and import trend by sector..........................................................................................................................45
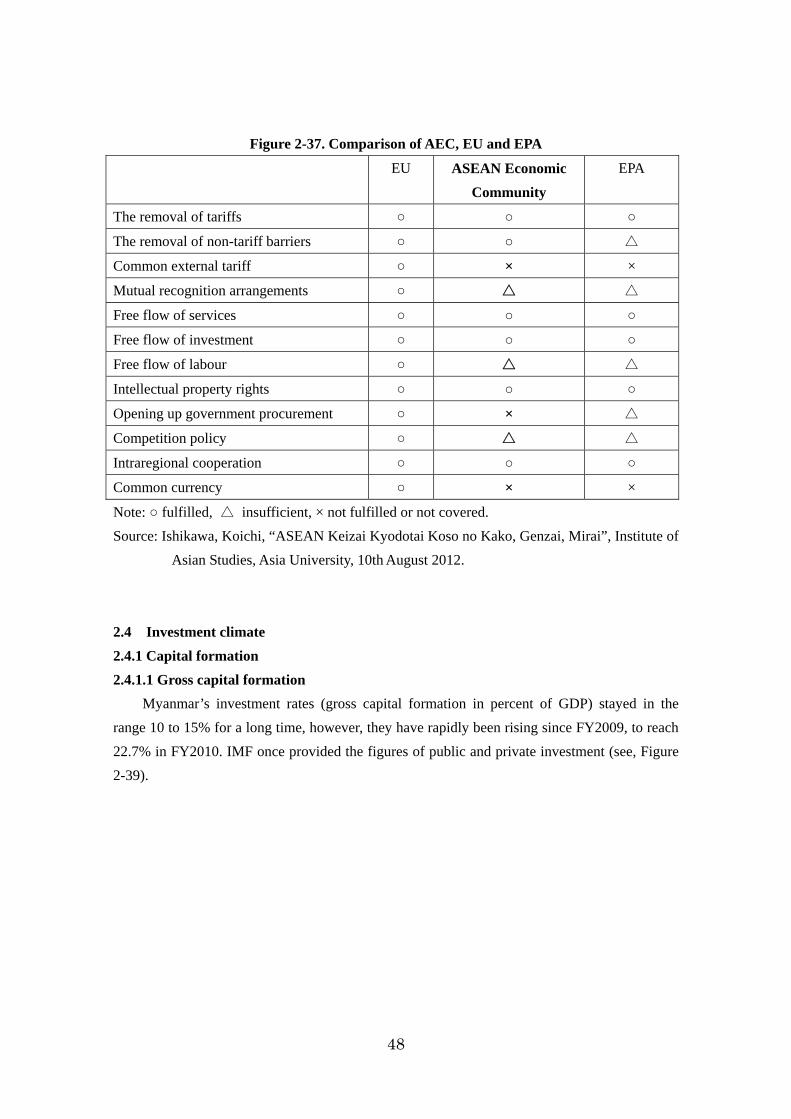
2.4.1 Capital formation .....................................................................................................................................................48
2.4.1.1 Gross capital formation...................................................................................................................................48 2.4.1.2 Government capital investment .....................................................................................................................50
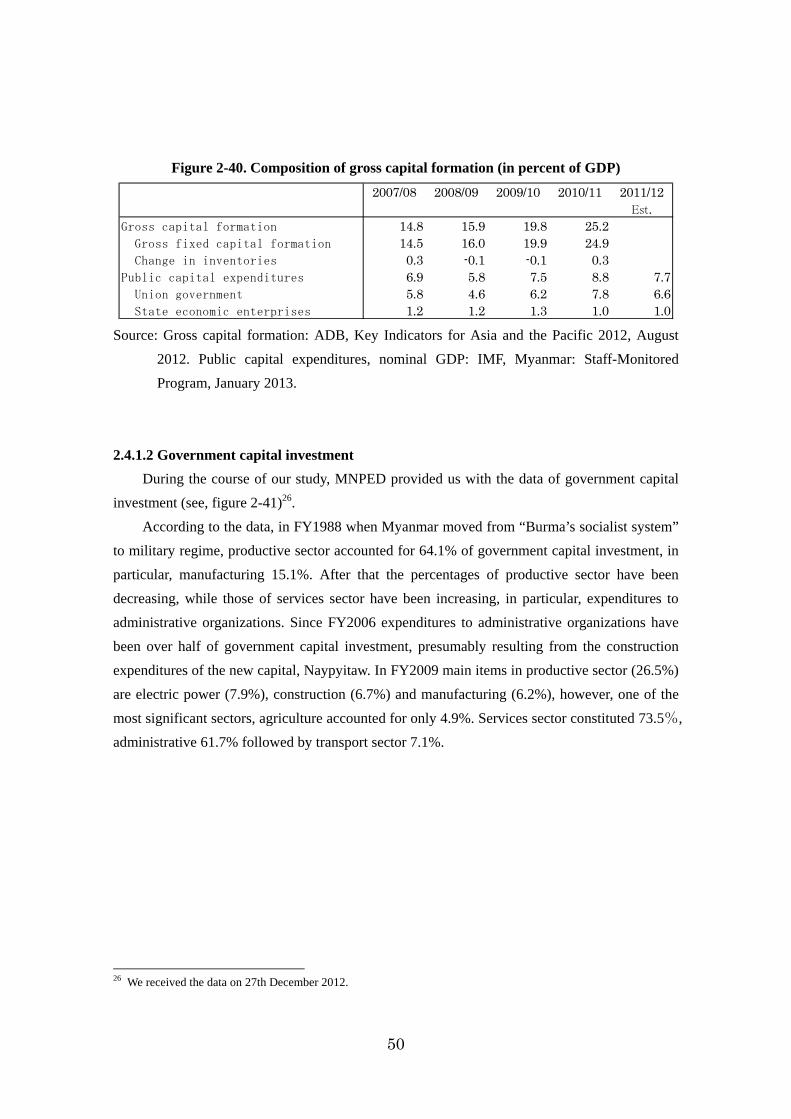
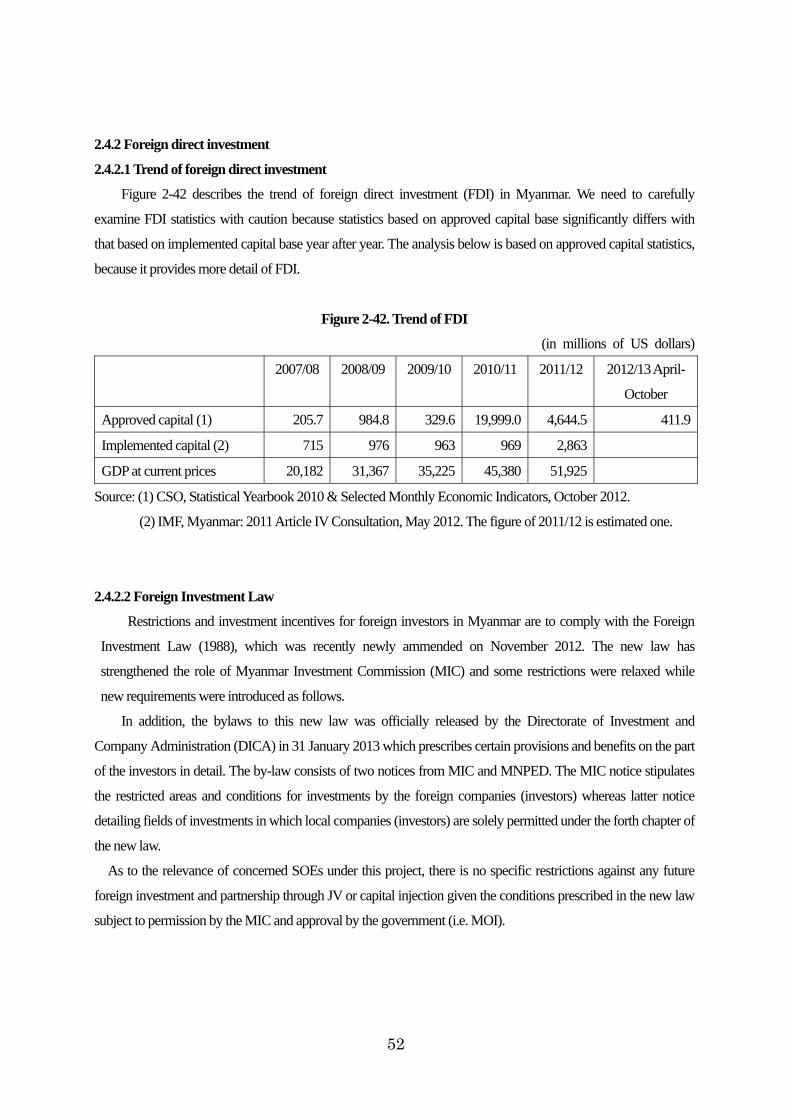
2.4.2 Foreign direct investment........................................................................................................................................52
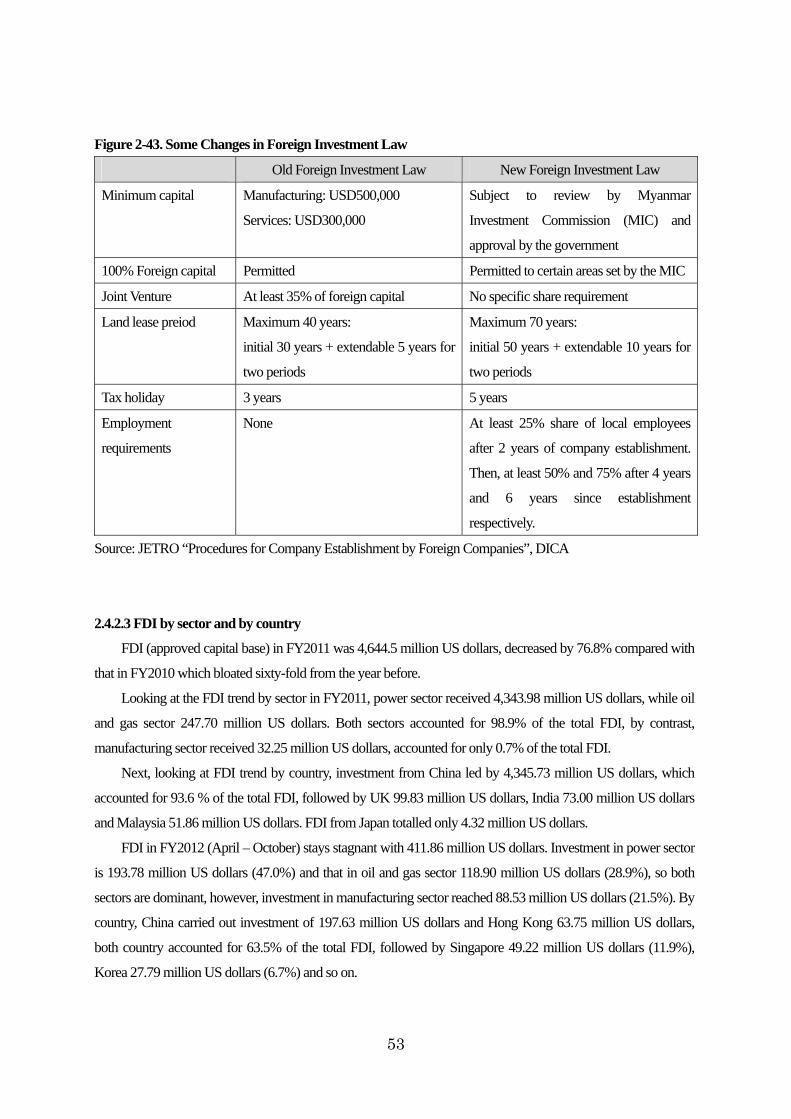
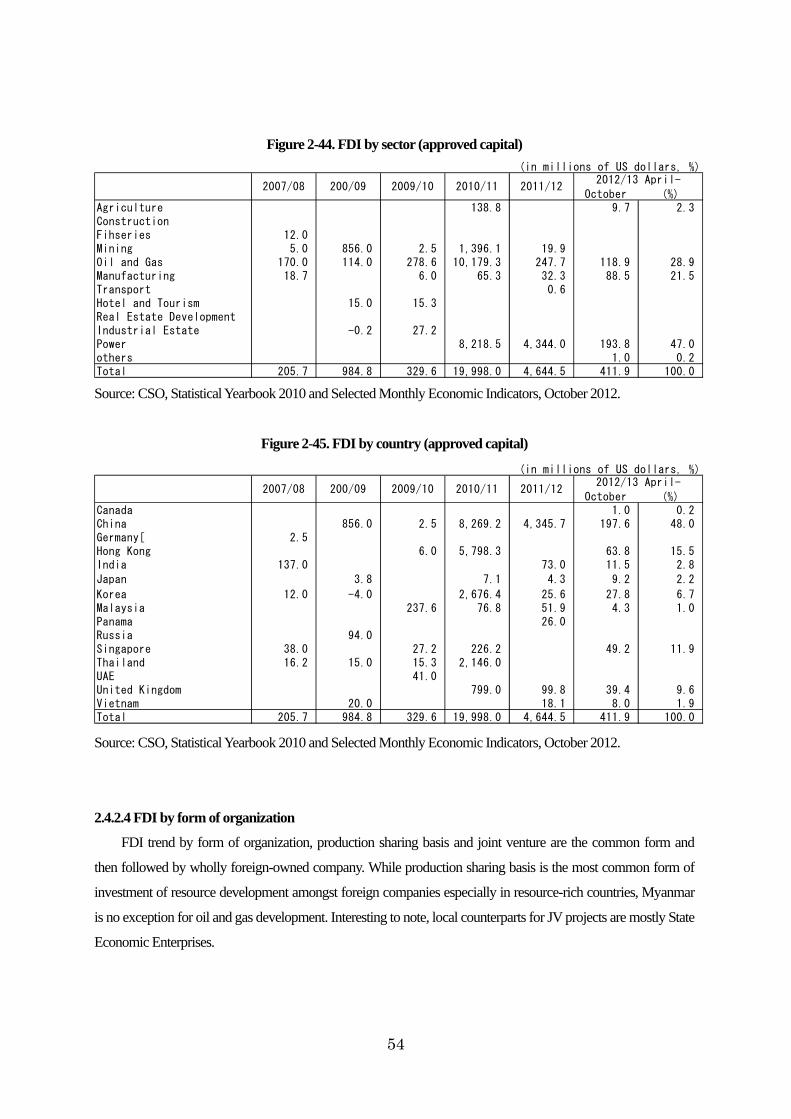
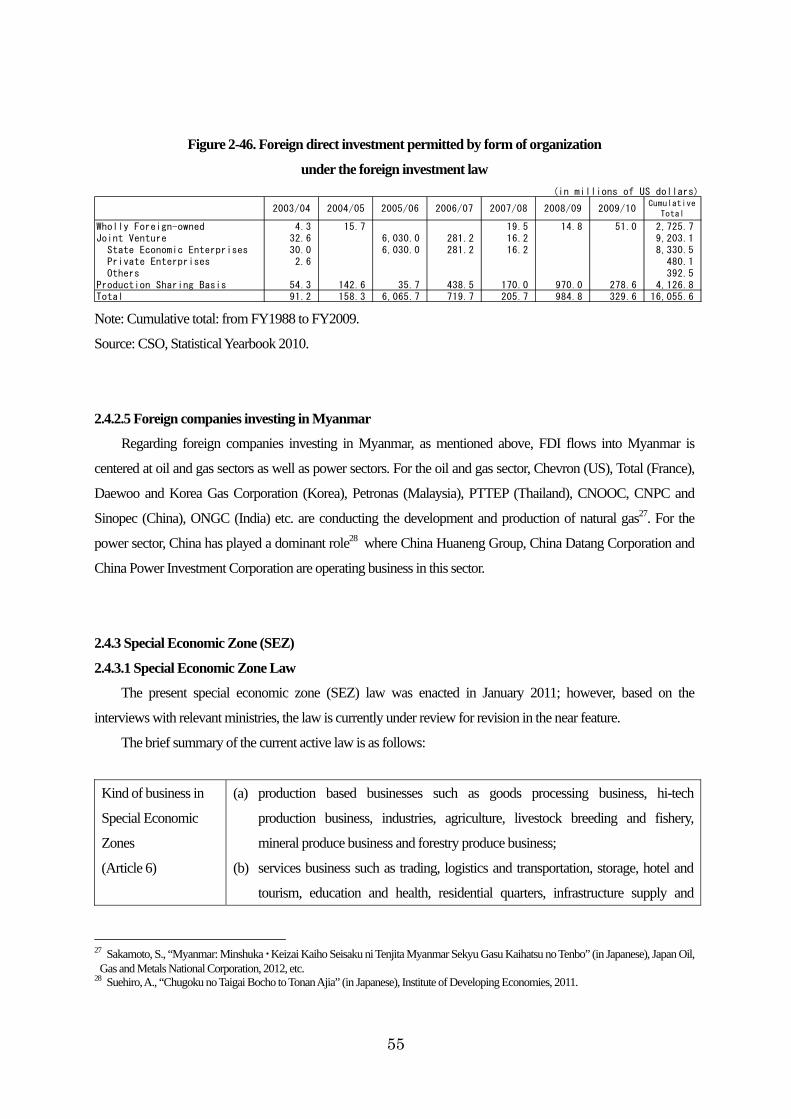
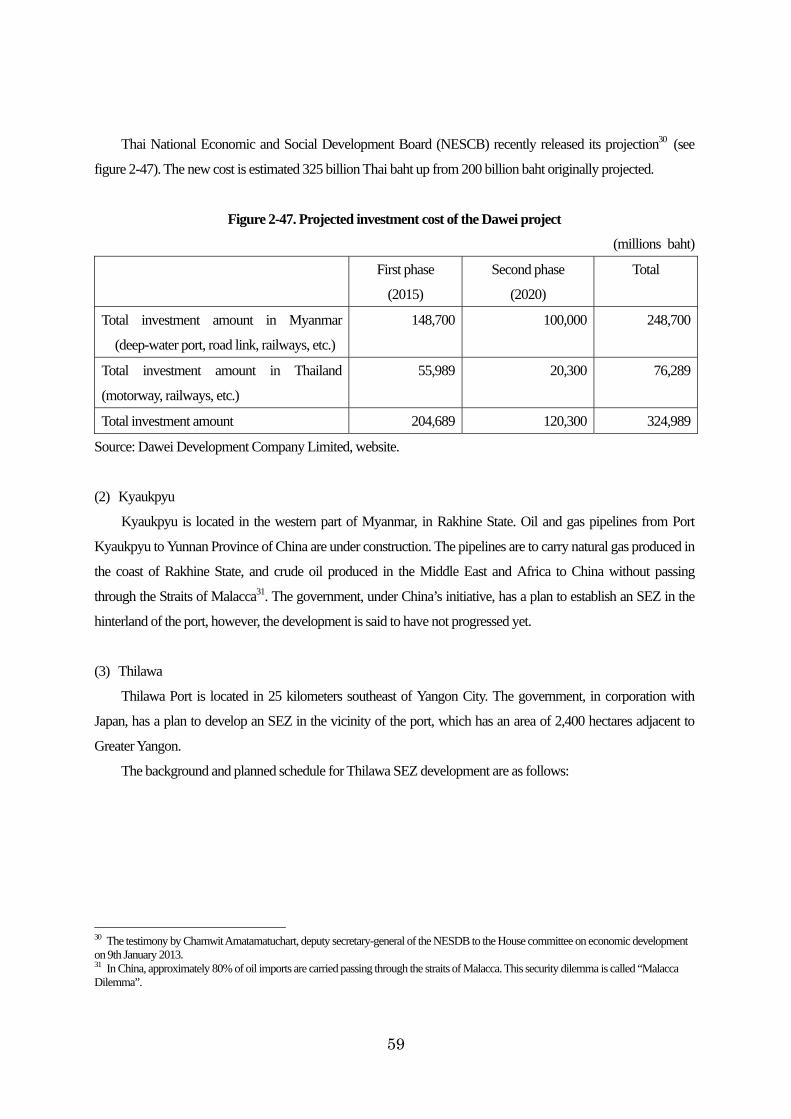
2.4.2.1 Trend of foreign direct investment.................................................................................................................52 2.4.2.2 Foreign Investment Law.................................................................................................................................52 2.4.2.3 FDI by sector and by country.........................................................................................................................53 2.4.2.4 FDI by form of organization ..........................................................................................................................54 2.4.2.5 Foreign companies investing in Myanmar ...................................................................................................55
2.4.3 Special Economic Zone (SEZ)...............................................................................................................................55
2.4.3.1 Special Economic Zone Law.........................................................................................................................55 2.4.3.2 Existing SEZs..................................................................................................................................................57
3. Policies, laws and regulations on SOEs.........................................................................................................................62
3.1 Laws and regulations on SOEs .........................................................................................................................................62
3.1.1 Legal background of SOEs.....................................................................................................................................62
3.1.2 Regulations on the organizational structures of SOEs..........................................................................................64
3.1.3 Investment permits for SOEs..................................................................................................................................65
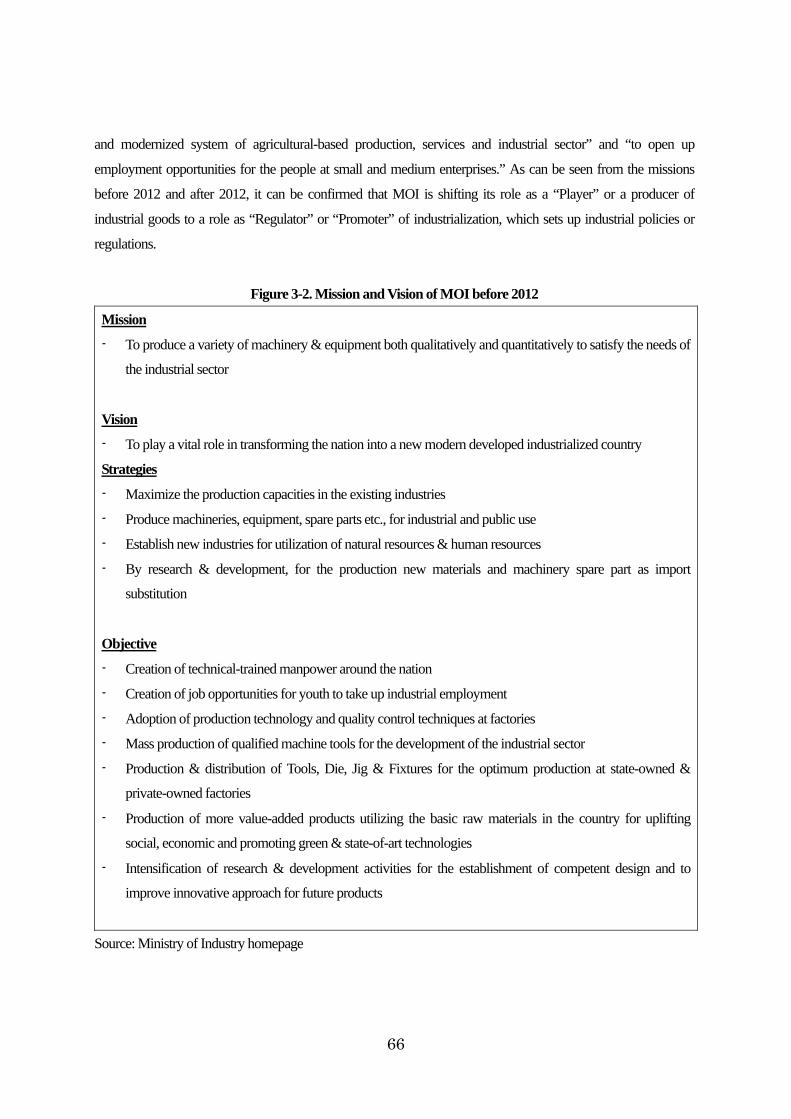
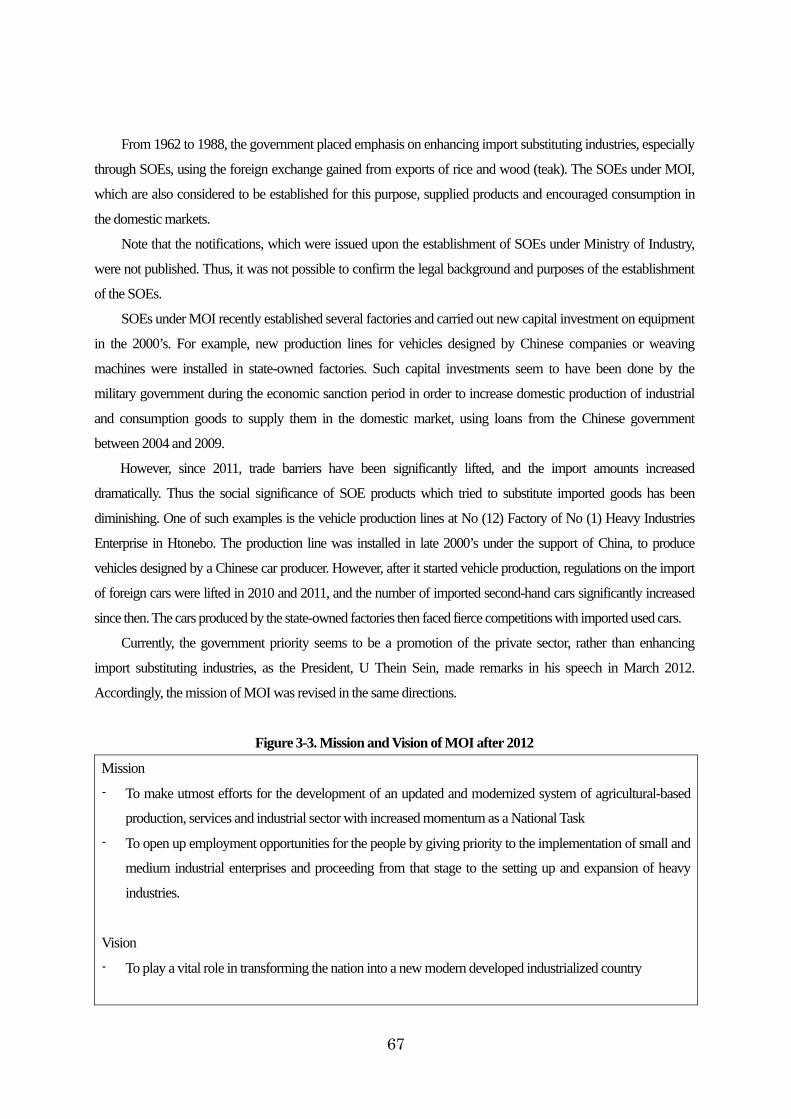
3.2 Background of SOEs under Ministry of Industry ...........................................................................................................65
3.3 Organization structure of SOEs under Ministry of Industry...........................................................................................68
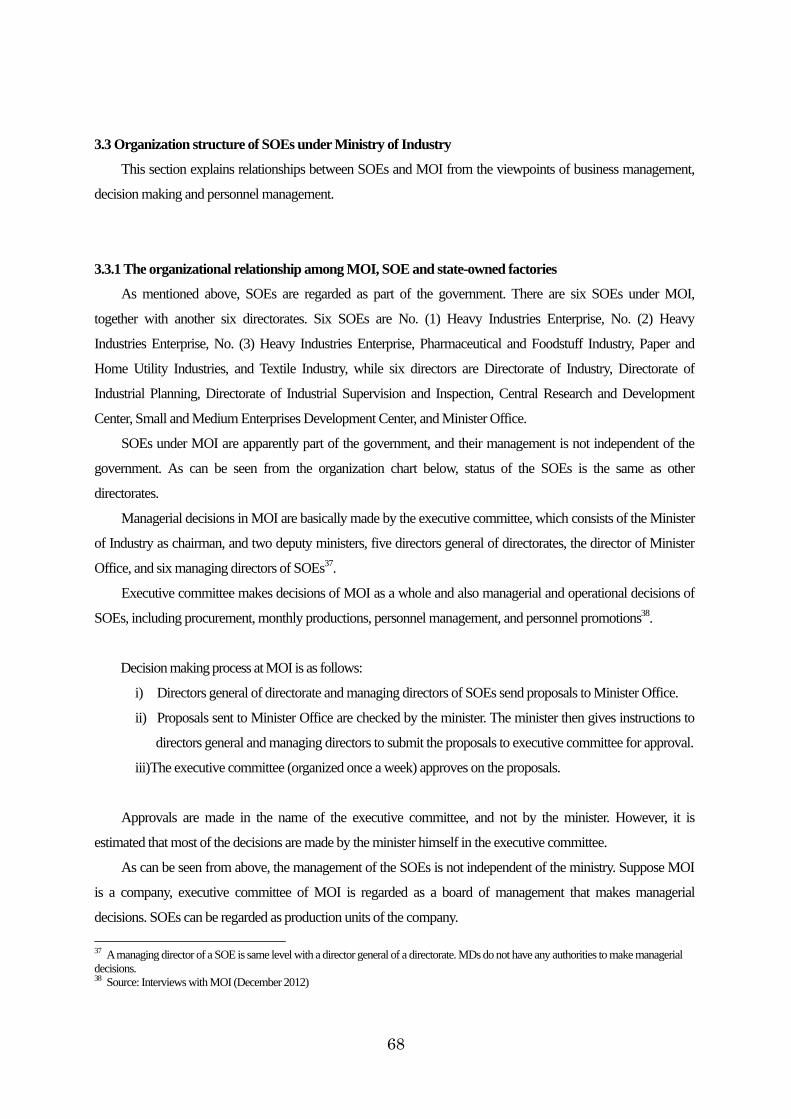
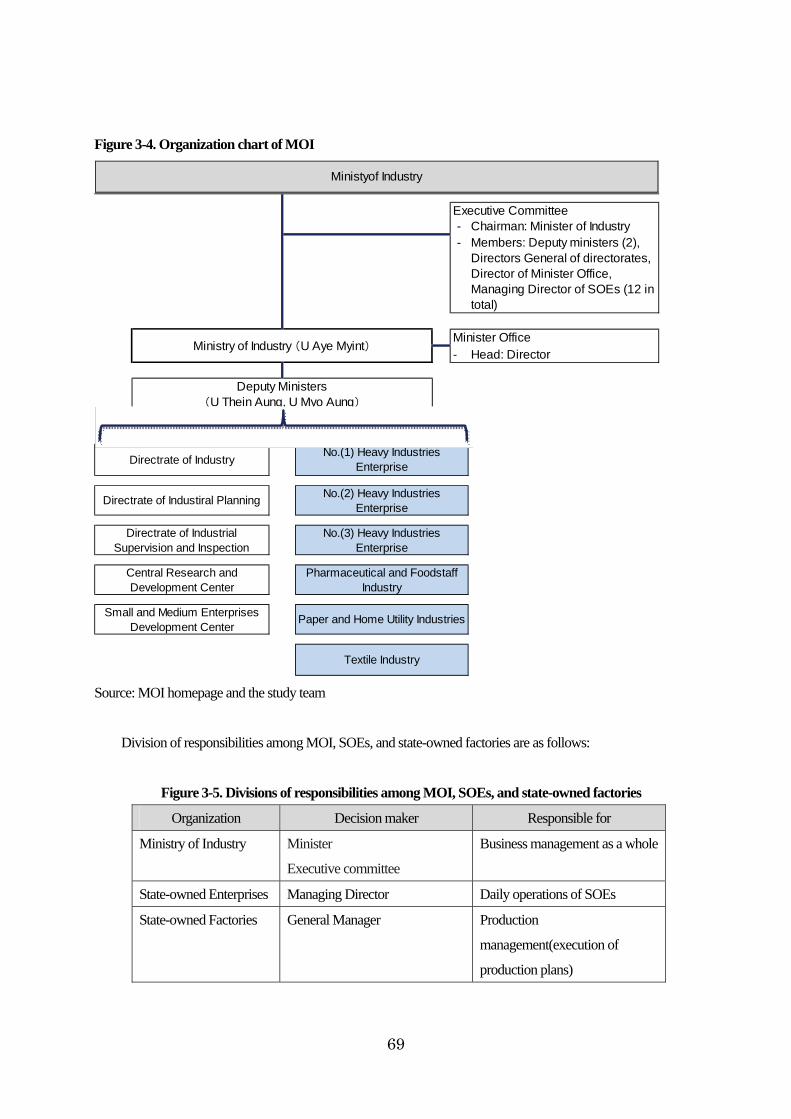
3.3.1 The organizational relationship among MOI, SOE and state-owned factories..................................................68
3.3.2. The personnel management among MOI, SOE and state-owned factories......................................................71
3.3.3 Transformation of SOEs to Corporation Units .....................................................................................................71
3.4 Financial relationship between SOEs and the government............................................................................................73
3.4.1 Financial relationship between state account, state budget and SOEs................................................................73
3.4.1.1 Overview of the state fund account system until FY 2011-12....................................................................73 3.4.1.2 New account system from FY 2012-13........................................................................................................74 3.4.1.3 Taxations on SOEs..........................................................................................................................................75
4. Progress of Privatization of SOEs ..................................................................................................................................76
4.1 Policy framework of Privatization....................................................................................................................................76
4.1.1 Policies on privatization ..........................................................................................................................................76
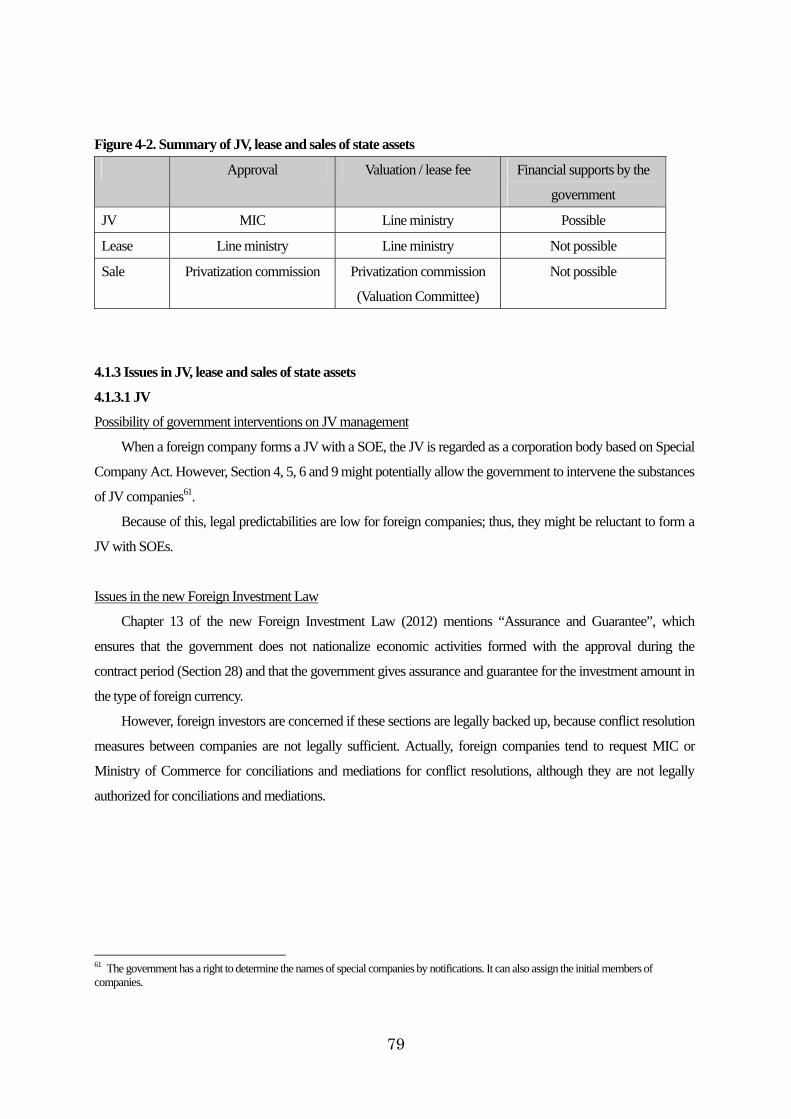
4.1.2 Official process of JV, lease and asset sales...........................................................................................................77
4.1.2.1 JV......................................................................................................................................................................77 4.1.2.2 Lease.................................................................................................................................................................78 4.1.2.3 Sales of state assets..........................................................................................................................................78
4.1.3 Issues in JV, lease and sales of state assets.............................................................................................................79
4.1.3.1 JV......................................................................................................................................................................79 4.1.3.2 Lease.................................................................................................................................................................80 4.1.3.3 Sales of state assets..........................................................................................................................................80
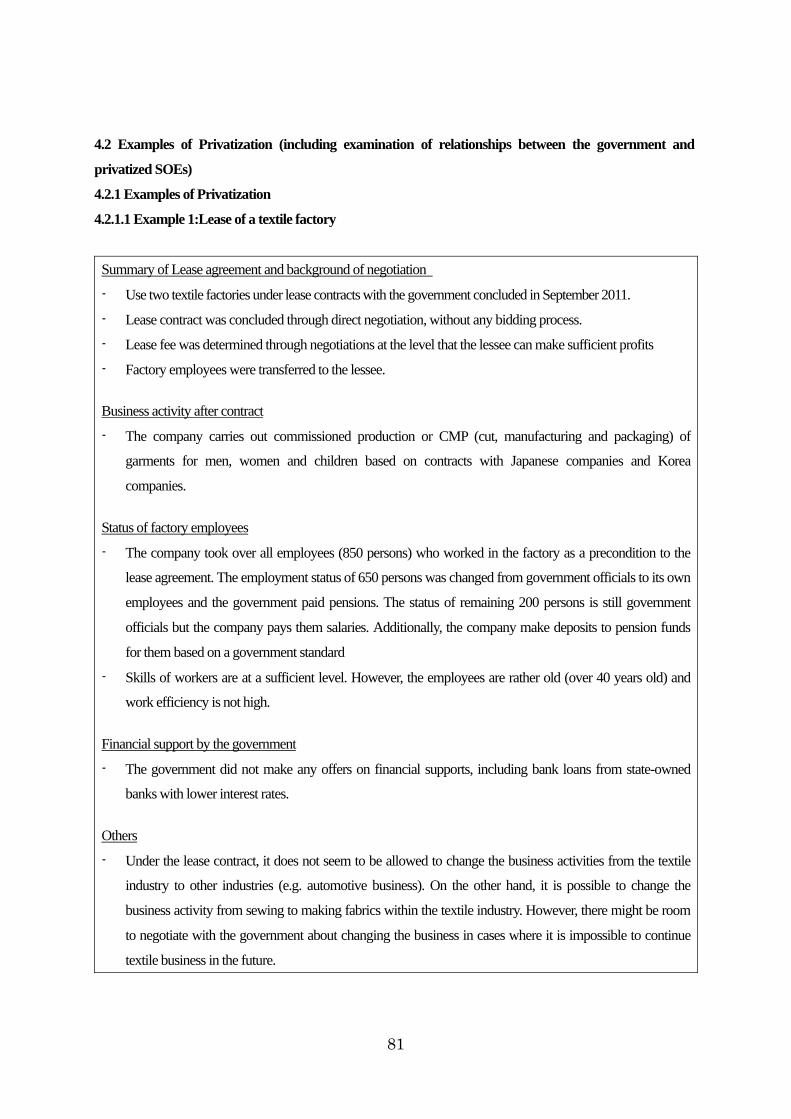
4.2 Examples of Privatization (including examination of relationships between the government and privatized SOEs)81
4.2.1 Examples of Privatization .......................................................................................................................................81
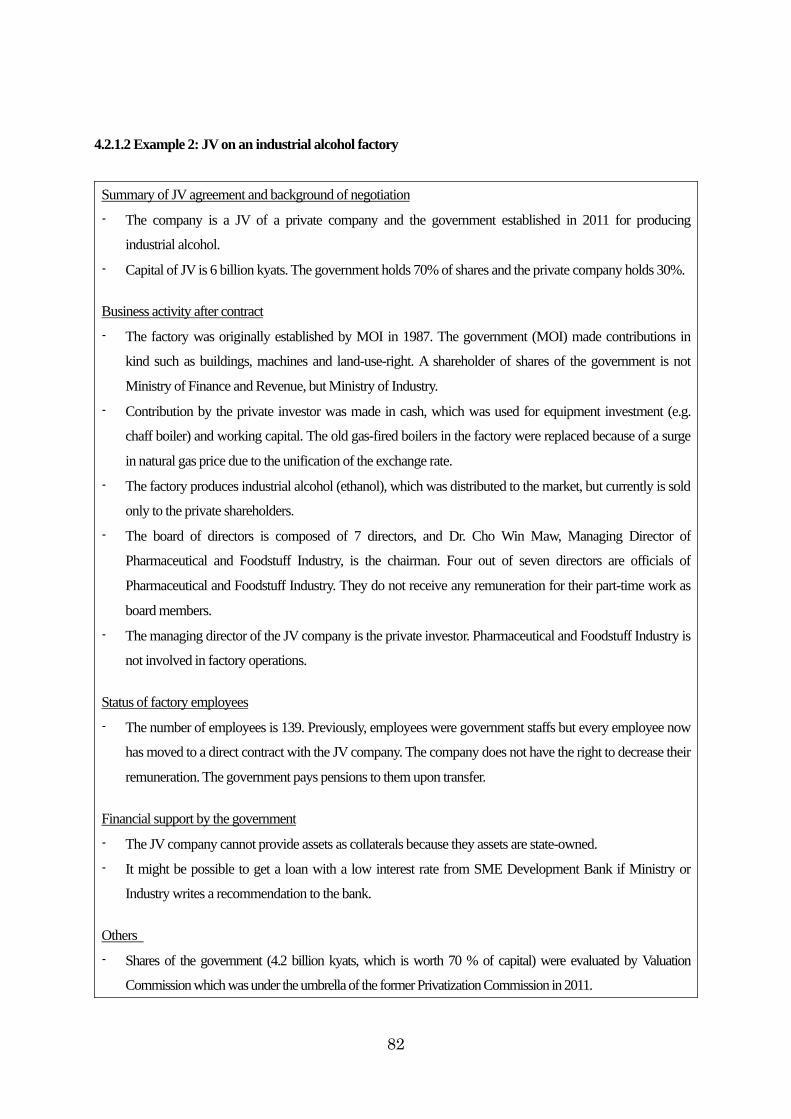
4.2.1.1 Example 1:Lease of a textile factory .............................................................................................................81 4.2.1.2 Example 2: JV on an industrial alcohol factory............................................................................................82 4.2.1.3 Example 3: Lease of a beverage factory (in 1995).......................................................................................83
4.2.2 Examination of relationships between the government and privatized SOEs ...................................................84
4.2.2.1 Financial relationships between the government and privatized SOEs .....................................................84 4.2.2.2 Managerial and personnel relationship between privatized SOEs and the government...........................86
5. Business Conditions and Issues of State-owned Economic Enterprises.....................................................................87
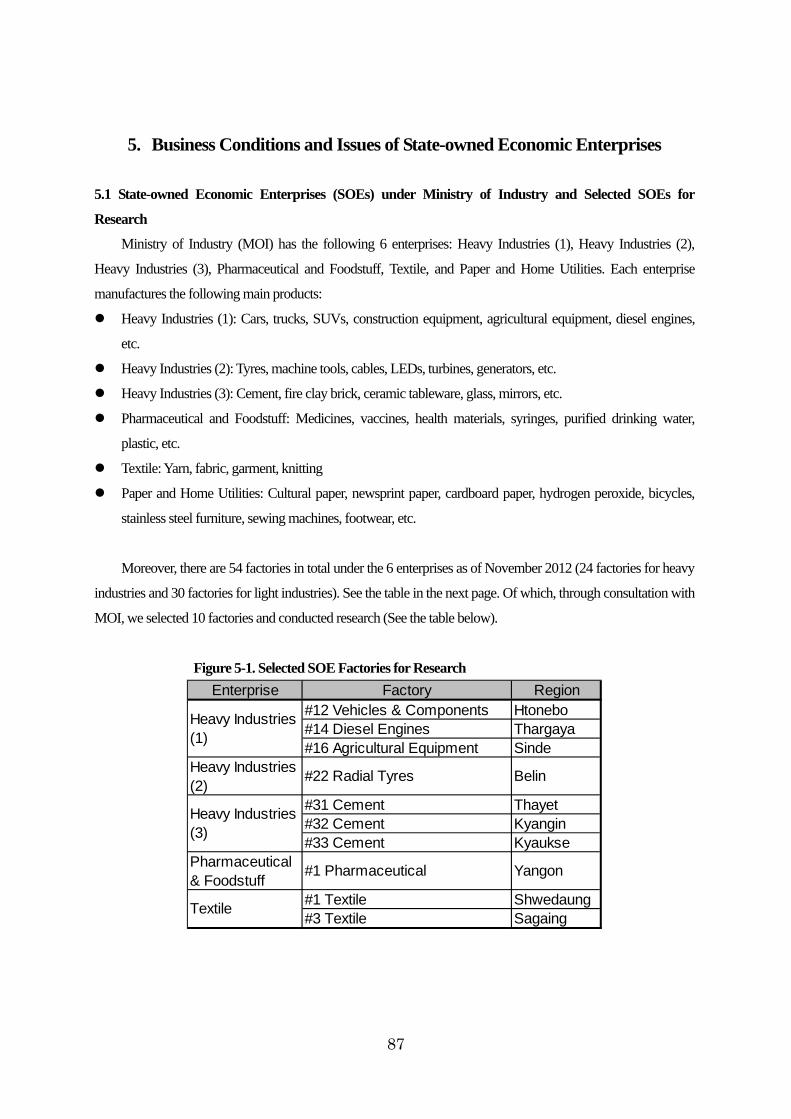
5.1 State-owned Economic Enterprises (SOEs) under Ministry of Industry and Selected SOEs for Research ..............87
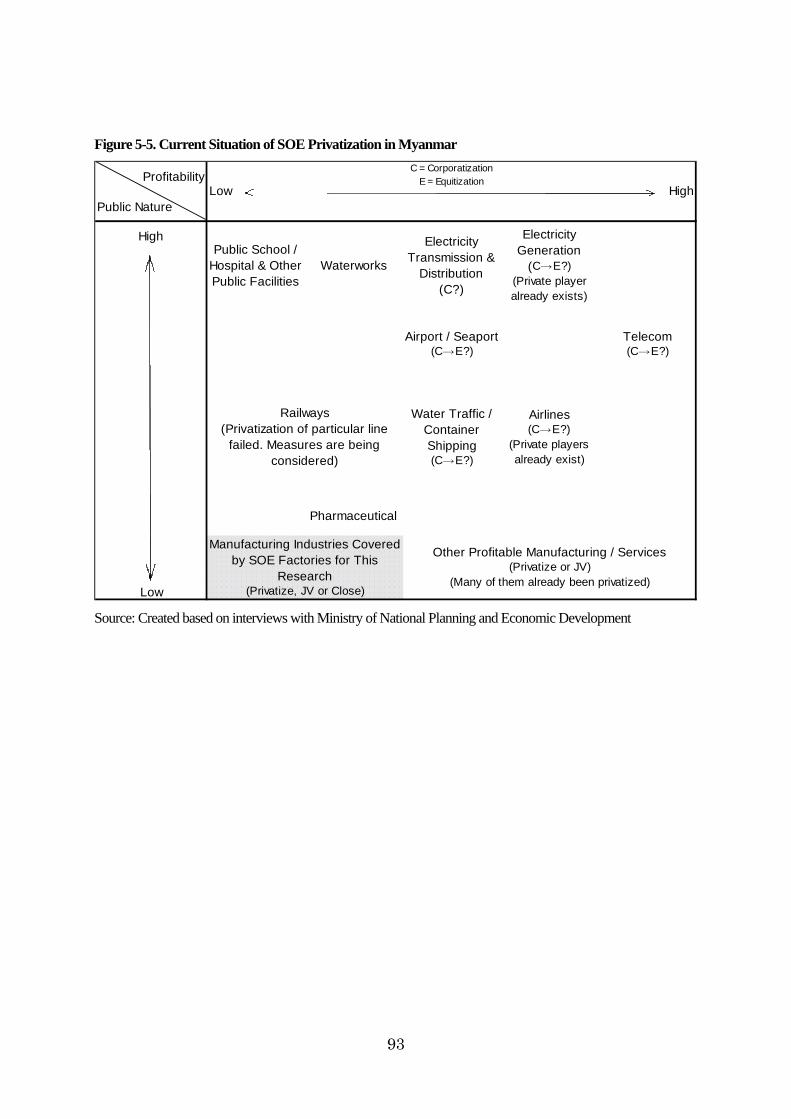
5.2 Business Conditions and Issues of Selected State-owned Economic Enterprises........................................................92
5.2.1 Heavy Industries (1) Factory #12 (Vehicles and Components; Htonebo)..........................................................94
5.2.1.1 Overview of the Factory.................................................................................................................................94 5.2.1.2 Observations on Management .......................................................................................................................94 5.2.1.3 Observations on Finance ................................................................................................................................96 5.2.1.4 Observations on Production...........................................................................................................................98 5.2.1.5 Observations on Distribution .........................................................................................................................99 5.2.1.6 Issues ............................................................................................................................................................. 100
5.2.2.1 Overview of the Factory.............................................................................................................................. 103 5.2.2.2 Observations on Management .................................................................................................................... 104 5.2.2.3 Observations on Finance ............................................................................................................................. 105 5.2.2.4 Observations on Production........................................................................................................................ 107 5.2.2.5 Observations on Distribution ...................................................................................................................... 109 5.2.2.6 Issues ..............................................................................................................................................................110
5.2.3 Heavy Industries (1) Factory #16 (Agricultural Equipment; Sinde).................................................................112
5.2.3.1 Overview of the Factory...............................................................................................................................112 5.2.3.2 Observations on Management .....................................................................................................................112 5.2.3.3 Observations on Finance ..............................................................................................................................114 5.2.3.4 Observations on Production.........................................................................................................................115 5.2.3.5 Observations on Distribution .......................................................................................................................117 5.2.3.6 Issues ..............................................................................................................................................................118
5.2.4 Heavy Industries (2) Factory #22 (Radial Tyres; Belin).................................................................................... 120
5.2.4.1 Overview of the Factory.............................................................................................................................. 120 5.2.4.2 Observations on Management .................................................................................................................... 121 5.2.4.3 Observations on Finance ............................................................................................................................. 123 5.2.4.4 Observations on Production........................................................................................................................ 124 5.2.4.5 Observations on Distribution ...................................................................................................................... 126
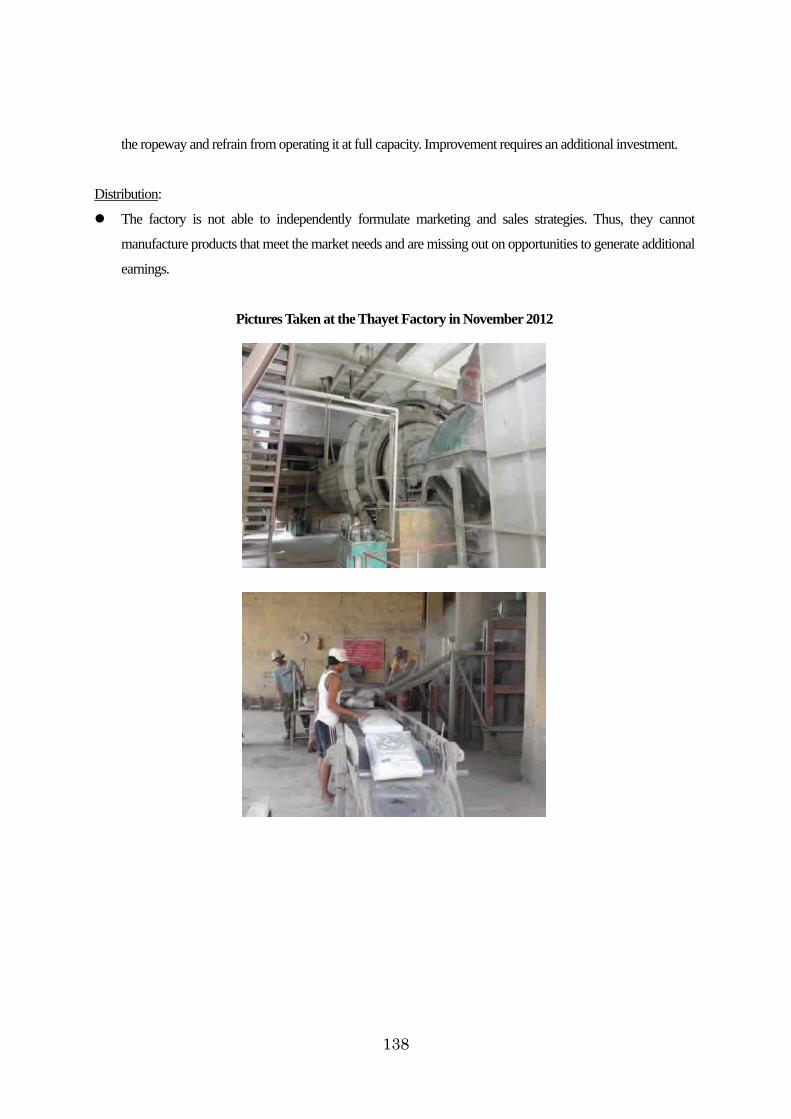
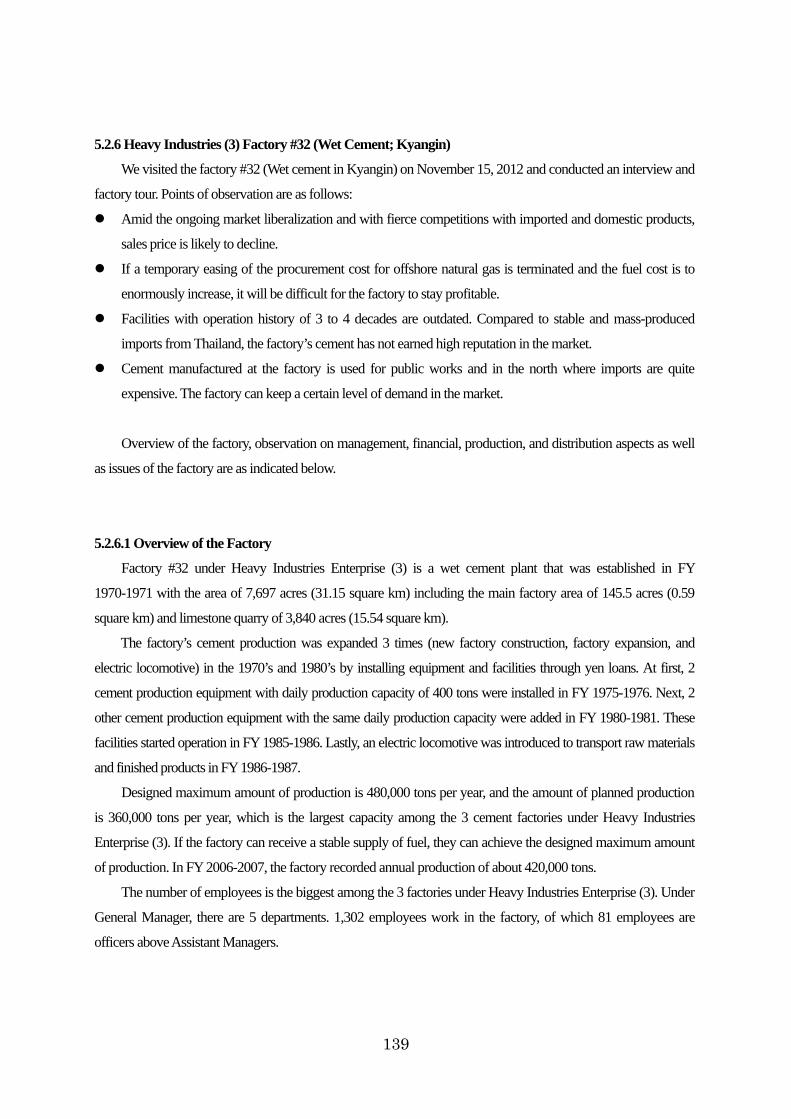
5.2.5 Heavy Industries (3) Factory #31 (Wet Cement; Thayet)................................................................................. 130
5.2.5.1 Overview of the Factory.............................................................................................................................. 130 5.2.5.2 Observations on Management .................................................................................................................... 131 5.2.5.3 Observations on Finance ............................................................................................................................. 132 5.2.5.4 Observations on Production........................................................................................................................ 134 5.2.5.5 Observations on Distribution ...................................................................................................................... 136 5.2.5.6 Issues ............................................................................................................................................................. 137
5.2.6 Heavy Industries (3) Factory #32 (Wet Cement; Kyangin).............................................................................. 139
5.2.6.1 Overview of the Factory.............................................................................................................................. 139 5.2.6.2 Observations on Management .................................................................................................................... 140 5.2.6.3 Observations on Finance ............................................................................................................................. 142 5.2.6.4 Observations on Production........................................................................................................................ 143 5.2.6.5 Observations on Distribution ...................................................................................................................... 145 5.2.6.6 Issues ............................................................................................................................................................. 146
5.2.7 Heavy Industries (3) Factory #33 (Dry Cement; Kyaukse).............................................................................. 148
5.2.7.1 Overview of the Factory.............................................................................................................................. 148 5.2.7.2 Observations on Management .................................................................................................................... 149 5.2.7.3 Observations on Finance ............................................................................................................................. 150 5.2.7.4 Observations on Production........................................................................................................................ 152 5.2.7.5 Observations on Distribution ...................................................................................................................... 154 5.2.7.6 Issues ............................................................................................................................................................. 155
5.2.8.1 Overview of the Factory.............................................................................................................................. 157 5.2.8.2 Observations on Management .................................................................................................................... 158 5.2.8.3 Observations on Finance ............................................................................................................................. 160 5.2.8.4 Observations on Production........................................................................................................................ 161 5.2.8.5 Observations on Distribution ...................................................................................................................... 163 5.2.8.6 Issues ............................................................................................................................................................. 163
5.2.9.1 Overview of the Factory.............................................................................................................................. 165 5.2.9.2 Observations on Management .................................................................................................................... 165 5.2.9.3 Observations on Finance ............................................................................................................................. 167 5.2.9.4 Observations on Production........................................................................................................................ 168 5.2.9.5 Observations on Distribution ...................................................................................................................... 170 5.2.9.6 Issues ............................................................................................................................................................. 171
5.2.10.1 Overview of the Factory............................................................................................................................ 173 5.2.10.2 Observations on Management.................................................................................................................. 174 5.2.10.3 Observations on Finance........................................................................................................................... 176 5.2.10.4 Observations on Production...................................................................................................................... 177 5.2.10.5 Observations on Distribution .................................................................................................................... 179
5.3 Examination of Investment Possibilities ....................................................................................................................... 182
5.3.1 Assumptions used for financial simulations....................................................................................................... 182
5.3.2 Investment possibility of each SOE factory ....................................................................................................... 182
6. Options for Improvement and Recommendations of Privatization by State-owned Economic Enterprise
6.1 Recommendations from institutional and policy perspectives.................................................................................... 184
6.1.1 Classification of SOEs / factories and restructuring plans based on classification ......................................... 184
6.1.2 Enhancement of legislations for corporate governance and SOEs .................................................................. 184
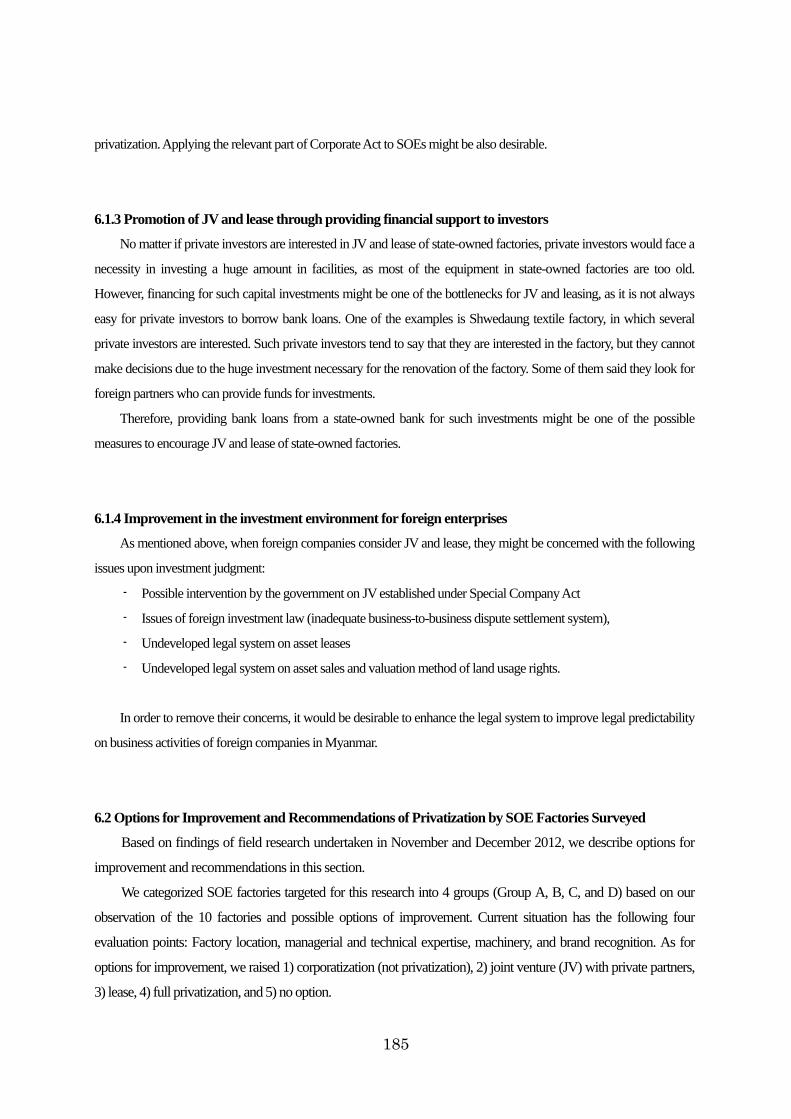
6.1.3 Promotion of JV and lease through providing financial support to investors.................................................. 185
6.1.4 Improvement in the investment environment for foreign enterprises.............................................................. 185
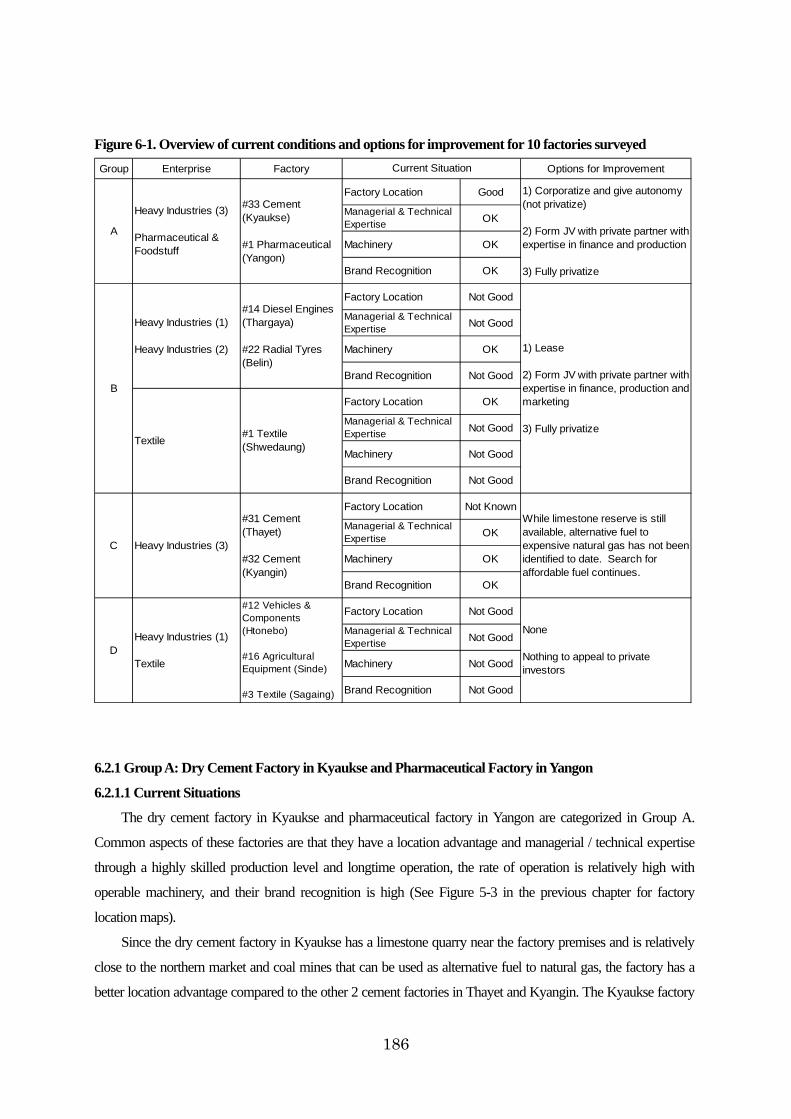
6.2 Options for Improvement and Recommendations of Privatization by SOE Factories Surveyed............................ 185
6.2.1 Group A: Dry Cement Factory in Kyaukse and Pharmaceutical Factory in Yangon..................................... 186
6.2.1.1 Current Situations......................................................................................................................................... 186 6.2.1.2 Options for Improvement and Recommendations for Privatization ....................................................... 187
6.2.2 Group B: Diesel Engine Factory in Thargaya, Radial Tyre Factory in Belin, and Textile Factory in Shwedaung187
6.2.2.1 Current Situations......................................................................................................................................... 188 6.2.2.2 Options for Improvement and Recommendations for Privatization ....................................................... 188
6.2.3 Group C: Wet Cement Factories in Thayet and Kyangin......................................................................................... 189
6.2.3.1 Current Situations......................................................................................................................................... 189 6.2.3.2 Options for Improvement and Recommendations for Privatization ....................................................... 190
6.2.4 Group D: Vehicles and Components Factory in Htonebo, Agricultural Equipment Factory in Sinde, and Textile
Factory in Sagaing................................................................................................................................................................. 190
6.2.4.1 Current Situations......................................................................................................................................... 190 6.2.4.2 Options for Improvement and Recommendations for Privatization ....................................................... 191
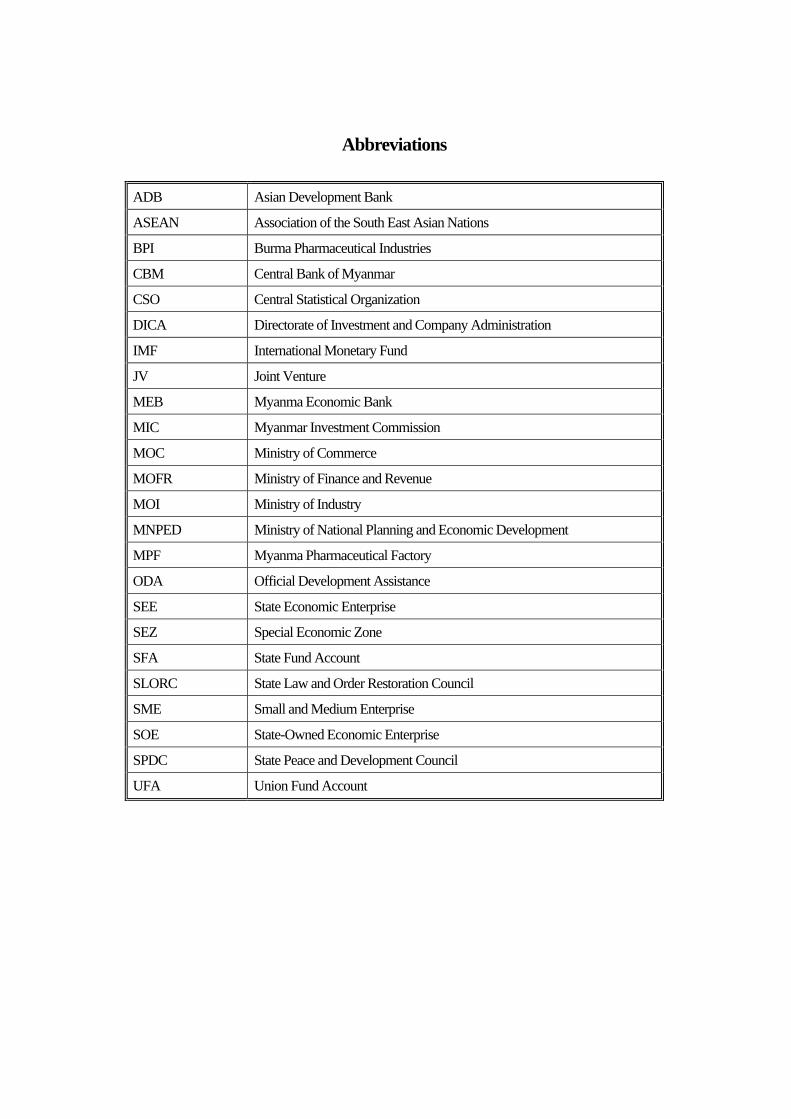
Abbreviations
ADB Asian Development Bank
ASEAN Association of the South East Asian Nations
BPI Burma Pharmaceutical Industries
CBM Central Bank of Myanmar
CSO Central Statistical Organization
DICA Directorate of Investment and Company Administration
IMF International Monetary Fund
JV Joint Venture
MEB Myanma Economic Bank
MIC Myanmar Investment Commission
MOC Ministry of Commerce
MOFR Ministry of Finance and Revenue
MOI Ministry of Industry
MNPED Ministry of National Planning and Economic Development
MPF Myanma Pharmaceutical Factory
ODA Official Development Assistance
SEE State Economic Enterprise
SEZ Special Economic Zone
SFA State Fund Account
SLORC State Law and Order Restoration Council
SME Small and Medium Enterprise
SOE State-Owned Economic Enterprise
SPDC State Peace and Development Council
UFA Union Fund Account
1
1. Project Objective and Scope
1.1 Project objective Since 1988, the Republic of the Union of Myanmar (hereafter Myanmar) has adopted
market oriented economic system and the share of economic contribution by the state-owned
economic enterprises (hereafter SOEs) out of the total national account is on a declining trend.
Nevertheless, there are yet a number of SOEs that remain non-privatized even those that are not
designated as state-owned specified by the State-owned Economic Enterprises Law of 1989,
rejuvenation and efficiency of such remaining SOEs are essential. Under the newly established
government in March 2011, further reforms are expected in the coming future with firm
intention of opening up policies initiated by President Thein Sein.
This project aimed to understand the current situation surrounding the SOEs in Myanmar
and to propose policy recommendations as well as several reform plans including privatization
given intensive analysis on overall business management of particular SOEs under the Ministry
of Industry (hereafter MOI).
The following specific achievements were expected as an outcome of this project.
(1) Sort out relevant laws and regulations, privatization plans, statistical data and roles of
concerned institutions regarding SOEs, especially focusing those under MOI.
(2) Select about 10 SOEs under MOI and conduct corporate analysis for each individual
SOEs to sort out current issues such as business management, financial, production and
distribution, then consider ways to mitigate and improve businesses via utilizing private
capital or privatization.
Figure 1-1. Image on possible SOE reform utilizing private capital and privatization
Competitive and makingprofits without governmentsupport
a) Transfer its business to private sector at a high price orb) Covert to a joint stock corporation and offer stocks to public orc) Convert to a joint venture with private sector, enhance profitablity and offer stocks to public
Possible to improvecompetitiveness viaprivate capital injection
d) Transfer its business to private sector at a low price (transformation of risks to a private entity) ore) Form a joint venture with a private entity and offer stocks to public after it turns profitable. (the government gains upside profit)
f) Discontinue its business and sell or lease its remaining assets
Yes
No
Yes
No
2
(3) Propose several options for future business improvements as well as necessary reform
plans on relevant laws and regulations to relevant government officials and
stakeholders in Myanmar.
1.2 Project scope To meet above objective, we conducted study and analysis in line with the following scope.
(1) Relevant laws and regulations, privatization plans, statistical data and roles of
concerned institutions regarding SOEs and gathered information will be classified
systematically to those at the national level and those relevant to MOI. Together with
the analysis for individual SOEs, we will consult improvement and reform measures at
a short to medium term range.
Figure 1-2. Selected SOEs under MOI
No. Factory Name,
Location
Enterprise Main Product
1 No. (12), Htonebo Vehicles and components
2 No. (14), Thargaya Engines
3 No. (16), Sinde
No.1 Heavy Industries
Enterprise
Agricultural equipment
4 No. (22), Belin No.2 Heavy Industries
Enterprise
Radial tyres
5 No. (31), Thayet Cement
6 No. (32), Kyangin Cement
7 No. (33), Kyaukse
No.3 Heavy Industries
Enterprise
Cement
8 No. (1), Shwedaung Textile
9 No. (3), Sagain
Myanmar Textile Industries
Textile
10 No. (1), Yangon Myanmar Pharmaceutical &
Foodstuff Industries
Pharmaceutical
(2) With the prospect of business climate, global competitiveness, industrial development
policies and possible business opportunities with Japanese companies, 10 selected
SOEs will be analyzed from various perspectives such as business management, finance,
production and distribution.
3
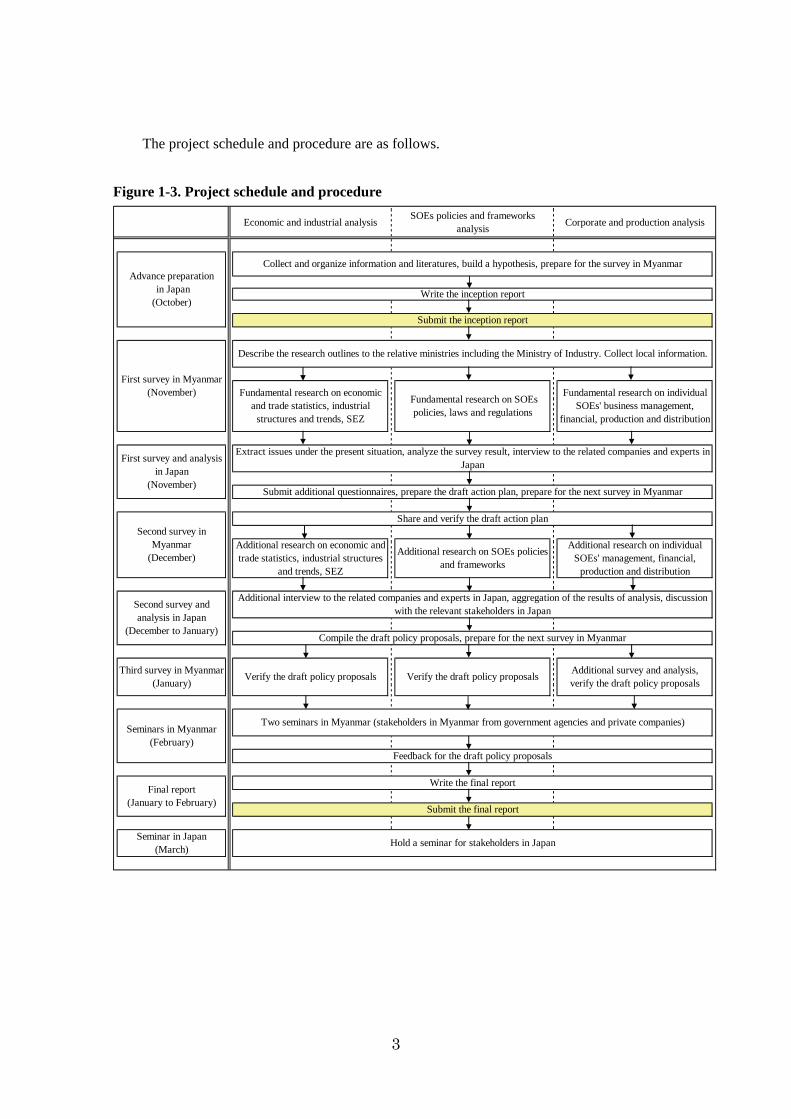
The project schedule and procedure are as follows.
Figure 1-3. Project schedule and procedure
Economic and industrial analysisSOEs policies and frameworks
analysisCorporate and production analysis
Submit the final report
Third survey in Myanmar(January)
Fundamental research on SOEspolicies, laws and regulations
Seminars in Myanmar(February)
Submit additional questionnaires, prepare the draft action plan, prepare for the next survey in Myanmar
First survey and analysisin Japan
(November)
Fundamental research on individualSOEs' business management,
financial, production and distribution
Extract issues under the present situation, analyze the survey result, interview to the related companies and experts inJapan
First survey in Myanmar(November)
Additional interview to the related companies and experts in Japan, aggregation of the results of analysis, discussionwith the relevant stakeholders in Japan
Advance preparation in Japan(October)
Fundamental research on economicand trade statistics, industrial
structures and trends, SEZ
Write the inception report
Collect and organize information and literatures, build a hypothesis, prepare for the survey in Myanmar
Submit the inception report
Describe the research outlines to the relative ministries including the Ministry of Industry. Collect local information.
Seminar in Japan(March)
Hold a seminar for stakeholders in Japan
Feedback for the draft policy proposals
Compile the draft policy proposals, prepare for the next survey in Myanmar
Verify the draft policy proposals Verify the draft policy proposalsAdditional survey and analysis,verify the draft policy proposals
Write the final reportFinal report
(January to February)
Second survey andanalysis in Japan
(December to January)
Second survey inMyanmar
(December)
Two seminars in Myanmar (stakeholders in Myanmar from government agencies and private companies)
Additional research on individualSOEs' management, financial,
production and distribution
Additional research on SOEs policiesand frameworks
Additional research on economic andtrade statistics, industrial structures
and trends, SEZ
Share and verify the draft action plan
4
1.3 Study team This project was conducted jointly by Japan Economic Research Institute Inc. (JERI) and
Daiwa Institute of Research Ltd. (DIR)
JERI conducts research mainly on finance, industrial development and infrastructure
improvement inside and outside of Japan. It has continuously engaged in research and
consulting in the realm of financial sector, industrial policy and human resource development.
Also, JERI has achievements in privatization of state-owned enterprises in Vietnam and Lao
PDR.
DIR conducts research and analysis on various issues such as economy, capital market, and
legal frameworks in Japan and other countries. Assigned by the Japanese government and
international organizations, DIR has been conducting a number of projects concerning Myanmar
such as technical assistance programs on economic and financial development, research and
consulting projects on industrial development and human resource development.
5
2. Industrial Structure and Manufacturing Sector
2.1 Industrial structure This section examines the bird-eye-view of Myanmar economy based on industry, such as
agriculture, mining or manufacturing, and, ownership, government or private. We approach this
subject through statistics of Myanmar government and international organizations, past
literatures and interviews to government officials and private business people. While we
obtained the newest available copy of Statistical Yearbook and Monthly Economic Indicators
from Central Statistical Office of Myanmar, weak coverage and low credibility of such make
our analysis inevitably qualitative.
2.1.1 Transitions of economic systems in Myanmar (colonial → social democracy → Burmese way to socialism → market economy under military rule → open and free market policy)
Common misperception about Myanmar’s economic regime is to align it to former
communist countries such as China or Vietnam. For the study of state-owned-enterprises, or
“SOEs”, in Myanmar, it is especially important to recognize that Myanmar had never adopted
communism as its ideology and private ownership of production facilities existed even during
the Socialist period.
As described by Odaka (2012) as “economic management without ideology”, none of
various military regimes since 1962 has had any track of economic ideology, such as capitalism
or socialism, and were all pragmatic. Policies toward private sector and foreign direct invest
have been swinging between accommodation/promotion for the sake of economic development
and regulation/discouragement for the sake of strengthened government control. At this point,
Myanmar is in “accommodation/promotion” mode for private and foreign investments as tight
military control over economy was relaxed since 2011 and free competition between private
players had become the cornerstone of the country’s economic policy.
Ten factories that we visited during the study can be divided into three groups based on the
time of establishment.
1) Those established by British interests and nationalized in the process following the
independence (from late 1930s to 50s)
Out of the ten factories visited, a cement factory in Thayet (established in 1937) and a
pharmaceutical factory in Yangon (established in 1958) fall into this category. Both of them
6
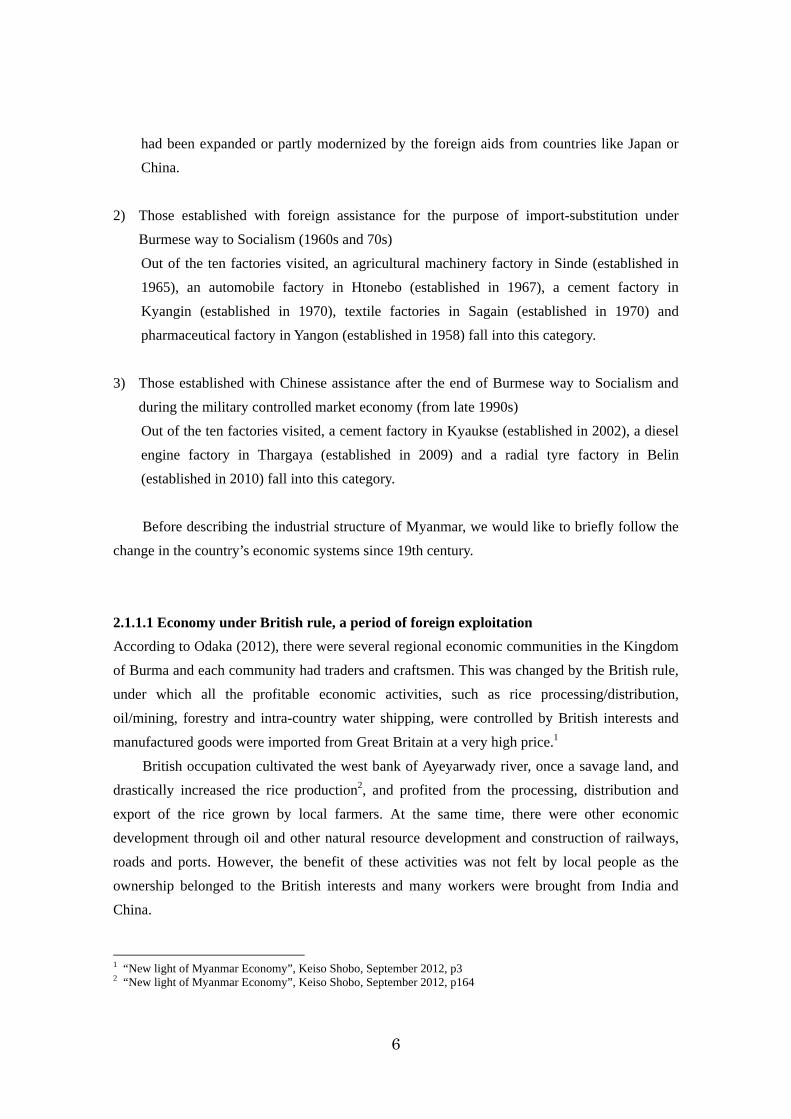
had been expanded or partly modernized by the foreign aids from countries like Japan or
China.
2) Those established with foreign assistance for the purpose of import-substitution under
Burmese way to Socialism (1960s and 70s)
Out of the ten factories visited, an agricultural machinery factory in Sinde (established in
1965), an automobile factory in Htonebo (established in 1967), a cement factory in
Kyangin (established in 1970), textile factories in Sagain (established in 1970) and
pharmaceutical factory in Yangon (established in 1958) fall into this category.
3) Those established with Chinese assistance after the end of Burmese way to Socialism and
during the military controlled market economy (from late 1990s)
Out of the ten factories visited, a cement factory in Kyaukse (established in 2002), a diesel
engine factory in Thargaya (established in 2009) and a radial tyre factory in Belin
(established in 2010) fall into this category.
Before describing the industrial structure of Myanmar, we would like to briefly follow the
change in the country’s economic systems since 19th century.
2.1.1.1 Economy under British rule, a period of foreign exploitation According to Odaka (2012), there were several regional economic communities in the Kingdom
of Burma and each community had traders and craftsmen. This was changed by the British rule,
under which all the profitable economic activities, such as rice processing/distribution,
oil/mining, forestry and intra-country water shipping, were controlled by British interests and
manufactured goods were imported from Great Britain at a very high price.1
British occupation cultivated the west bank of Ayeyarwady river, once a savage land, and
drastically increased the rice production2, and profited from the processing, distribution and
export of the rice grown by local farmers. At the same time, there were other economic
development through oil and other natural resource development and construction of railways,
roads and ports. However, the benefit of these activities was not felt by local people as the
ownership belonged to the British interests and many workers were brought from India and
China.
1 “New light of Myanmar Economy”, Keiso Shobo, September 2012, p3 2 “New light of Myanmar Economy”, Keiso Shobo, September 2012, p164
7
2.1.1.2 Social democratic system (from 1948 to 1962): Nationalization of foreign assets and fostering of private capital
As a backlash to British exploitation, leaders of independent movements such as Aung San
and U Nu embraced an image of “Socialist Burma”. They advocated “ultimate national ownership
of all the lands and gradual nationalization of all the important industries including agriculture”.
Right after the independence, British-owned economic infrastructures and key industries were
nationalized and, in 1950s, electricity and movie companies and markets under British interests
were nationalized one after another.3
However, the concept of socialism at this time was quite modest and the primary policy
objective was protection of the rights of farmers and laborers. At this point, the market
mechanism was accepted as they are. In his “basis of Burmese democracy” speech, Aung San
mentioned that “there is no use of worrying about the construction of socialist country because
we do not even have capitalists. Therefore, we still need to support private enterprises.”4 U Nu
regime also supported private investments by announcing the official principle of promoting
foreign direct investments in areas other than natural resource development and military related
industries. It was considered that U Nu had to rely on foreign capital to make up for the fiscal
constraints imposed by fighting against minorities.5
3 “New light of Myanmar Economy”, Keiso Shobo, September 2012, p61 4 “New light of Myanmar Economy”, Keiso Shobo, September 2012, p45 5 “New light of Myanmar Economy”, Keiso Shobo, September 2012, p62
8
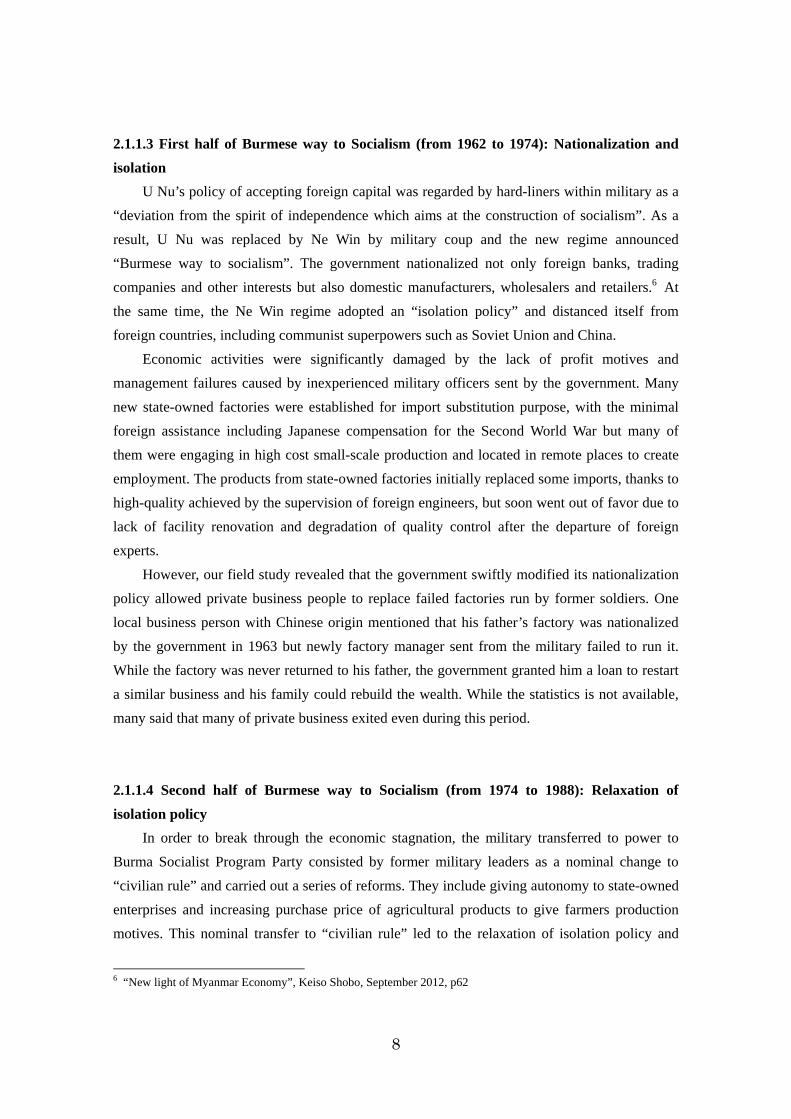
2.1.1.3 First half of Burmese way to Socialism (from 1962 to 1974): Nationalization and isolation
U Nu’s policy of accepting foreign capital was regarded by hard-liners within military as a
“deviation from the spirit of independence which aims at the construction of socialism”. As a
result, U Nu was replaced by Ne Win by military coup and the new regime announced
“Burmese way to socialism”. The government nationalized not only foreign banks, trading
companies and other interests but also domestic manufacturers, wholesalers and retailers.6 At
the same time, the Ne Win regime adopted an “isolation policy” and distanced itself from
foreign countries, including communist superpowers such as Soviet Union and China.
Economic activities were significantly damaged by the lack of profit motives and
management failures caused by inexperienced military officers sent by the government. Many
new state-owned factories were established for import substitution purpose, with the minimal
foreign assistance including Japanese compensation for the Second World War but many of
them were engaging in high cost small-scale production and located in remote places to create
employment. The products from state-owned factories initially replaced some imports, thanks to
high-quality achieved by the supervision of foreign engineers, but soon went out of favor due to
lack of facility renovation and degradation of quality control after the departure of foreign
experts.
However, our field study revealed that the government swiftly modified its nationalization
policy allowed private business people to replace failed factories run by former soldiers. One
local business person with Chinese origin mentioned that his father’s factory was nationalized
by the government in 1963 but newly factory manager sent from the military failed to run it.
While the factory was never returned to his father, the government granted him a loan to restart
a similar business and his family could rebuild the wealth. While the statistics is not available,
many said that many of private business exited even during this period.
2.1.1.4 Second half of Burmese way to Socialism (from 1974 to 1988): Relaxation of isolation policy
In order to break through the economic stagnation, the military transferred to power to
Burma Socialist Program Party consisted by former military leaders as a nominal change to
“civilian rule” and carried out a series of reforms. They include giving autonomy to state-owned
enterprises and increasing purchase price of agricultural products to give farmers production
motives. This nominal transfer to “civilian rule” led to the relaxation of isolation policy and
6 “New light of Myanmar Economy”, Keiso Shobo, September 2012, p62
9
resumption of foreign aids. As a result, the economy grew for a short period of time, but, by late
1980s, economy became stagnant again and, the external debt incurred from foreign aid became
an additional burden.
There is an official statistic which shows the existence of many private businesses at the
end of 1980s, while many of them are small and medium sized enterprises. Figure 2-1 shows
that, as of 1986, 54% of manufacturing sector and 59% of transport sector GDP were generated
by the private sector and more than half of services and trading sectors were also private. On the
other hand, while agriculture, cattle breeding and fishery were predominantly owned by the
private, Kudo (2012) mentions that their production and marketing activities were severely
controlled by the government and free market mechanism was not functioning.7 “Cooperative”
in the figure 2-1 means a group consisted by more than five Burmese grown-up citizens, aged
18 or above, to achieve certain economic goals.8
Figure 2-1. Share of production for each industry FY 1986 (%)
State Cooperative Private
Agriculture 0.1 6.4 93.4
Cattle Breeding
・Fishery1.3 2.6 96.1
Forestry 38.0 4.4 57.6
Energy na na Na
Mining 89.8 2.2 8.0
Manufacturing 41.6 4.2 54.2
Electricity 100.0 0.0 0.0
Construction 88.3 1.0 10.8
Transportation 36.0 4.9 59.1
Telecom 100.0 0.0 0.0
Finance 98.9 1.1 0.0
Commerce 33.9 135 52.6
Excerpt from Kudo “Industrial Development under Military Rule” 2012
7 “New light of Myanmar Economy”, Keiso Shobo, September 2012, p172 8 www.myancoop.gov.mn
10
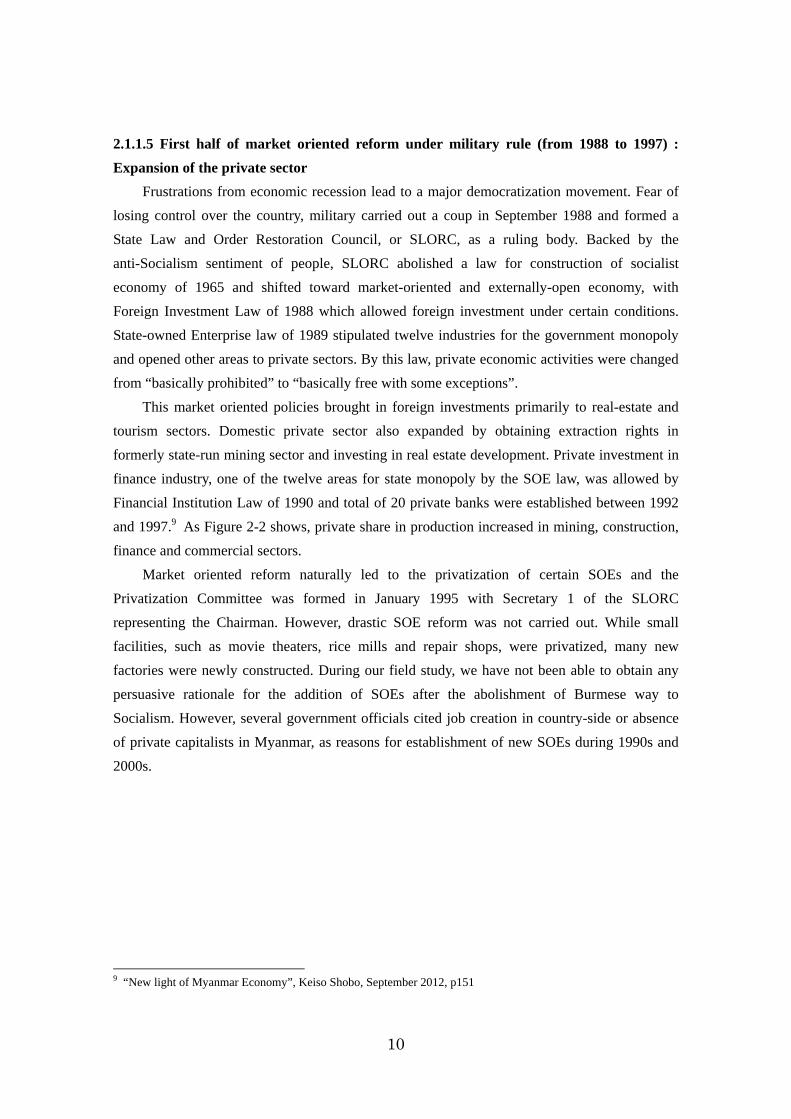
2.1.1.5 First half of market oriented reform under military rule (from 1988 to 1997) : Expansion of the private sector
Frustrations from economic recession lead to a major democratization movement. Fear of
losing control over the country, military carried out a coup in September 1988 and formed a
State Law and Order Restoration Council, or SLORC, as a ruling body. Backed by the
anti-Socialism sentiment of people, SLORC abolished a law for construction of socialist
economy of 1965 and shifted toward market-oriented and externally-open economy, with
Foreign Investment Law of 1988 which allowed foreign investment under certain conditions.
State-owned Enterprise law of 1989 stipulated twelve industries for the government monopoly
and opened other areas to private sectors. By this law, private economic activities were changed
from “basically prohibited” to “basically free with some exceptions”.
This market oriented policies brought in foreign investments primarily to real-estate and
tourism sectors. Domestic private sector also expanded by obtaining extraction rights in
formerly state-run mining sector and investing in real estate development. Private investment in
finance industry, one of the twelve areas for state monopoly by the SOE law, was allowed by
Financial Institution Law of 1990 and total of 20 private banks were established between 1992
and 1997.9 As Figure 2-2 shows, private share in production increased in mining, construction,
finance and commercial sectors.
Market oriented reform naturally led to the privatization of certain SOEs and the
Privatization Committee was formed in January 1995 with Secretary 1 of the SLORC
representing the Chairman. However, drastic SOE reform was not carried out. While small
facilities, such as movie theaters, rice mills and repair shops, were privatized, many new
factories were newly constructed. During our field study, we have not been able to obtain any
persuasive rationale for the addition of SOEs after the abolishment of Burmese way to
Socialism. However, several government officials cited job creation in country-side or absence
of private capitalists in Myanmar, as reasons for establishment of new SOEs during 1990s and
2000s.
9 “New light of Myanmar Economy”, Keiso Shobo, September 2012, p151
11
Figure 2-2. Share of production for each industry as of FY 1998 and change in private share from FY1986 (%)
State Cooperative Private Change in private
from FY1986
Agriculture 0.2 1.9 97.9 4.5
Cattle Breeding, Fishery 0.3 1.1 98.6 2.5
Forestry 46.2 0.6 53.2 -4.4
Energy 99.9 0.1 0.0 n.a
Mining 10.8 1.0 88.2 80.2
Manufacturing 28.2 0.9 70.8 16.7
Electricity 99.9 0.1 0.0 0.0
Construction 45.8 0.2 54.0 43.2
Transportation 29.8 1.0 69.2 10.1
Telecom 100.0 0.0 0.0 0.0
Finance 54.8 14.4 30.7 30.7
Commerce 21.3 2.4 76.3 23.7
Excerpt from Kudo “Industrial Development under Military Rule” 2012
2.1.1.6 Second half of market oriented reform under military rule (from 1997 to 2011) :Strengthened control over economy and import restriction
Market oriented economic growth receded after the Asian financial crisis in 1997. The
setback was partially caused by the drop in foreign direct investments but many people point out
that the fear of foreign intervention felt by the military leaders after they witnessed severe
restrictions imposed by IMF and foreign creditors on Thailand or Indonesia during the crisis.
During our interviews to private business people, many respondents pointed out that, while
the market mechanism still remained on surface, the government intervened to almost every
aspects of private economic activities and had full control over the economy. State Peace and
Development Council (SPDC), governing body renamed from SLORC in 1997, established
Trade Policy Council and carried out policies to reduce the outflow of hard currency and
concentrate foreign reserve to the government. Such policies include restriction of unessential
goods import “Export First Policy” or imposition of 10% “export duty” (8% commercial tax +
2% income tax). While the hard currency income was greatly increased by the export of natural
gas started in the year 2000, the military government maintained tight control over economy as
informal control of economy brought in a large profit. The idea of import substitution was also
maintained and, according to the article in Myanmar times in 2010, then Minister of Industry (1)
12
was complaining that “despite import-substitution policy of the government, some consumers
prefer imported goods and weaken GDP”.10
Figure 2-3. Approved Foreign Direct Investments in Myanmar
Excerpt from Kudo “Industrial Development under Military Rule” 2012
In pursuit of rent seeking, the military government revised State Owned Enterprise Law in
1997 to enable itself to own businesses through wholly owned subsidiaries, MEC (Myanmar
Economic Corporation) and UMHCR (Union of Myanmar Economic Holdings). Some of the
profitable businesses were transferred from the government to MEC or UMHCR and those
companies also established new companies with various privileges. New private business
groups with strong ties with the military, called Cronies, were also formed since late 1990s.
While the controlled economy at this time has commonalities with Burmese way to Socialism,
the level of corruption had become much worse. KUDO (2010) points out that “cleanliness that
Burmese people had been proud of during socialist period was lost during this period.”11
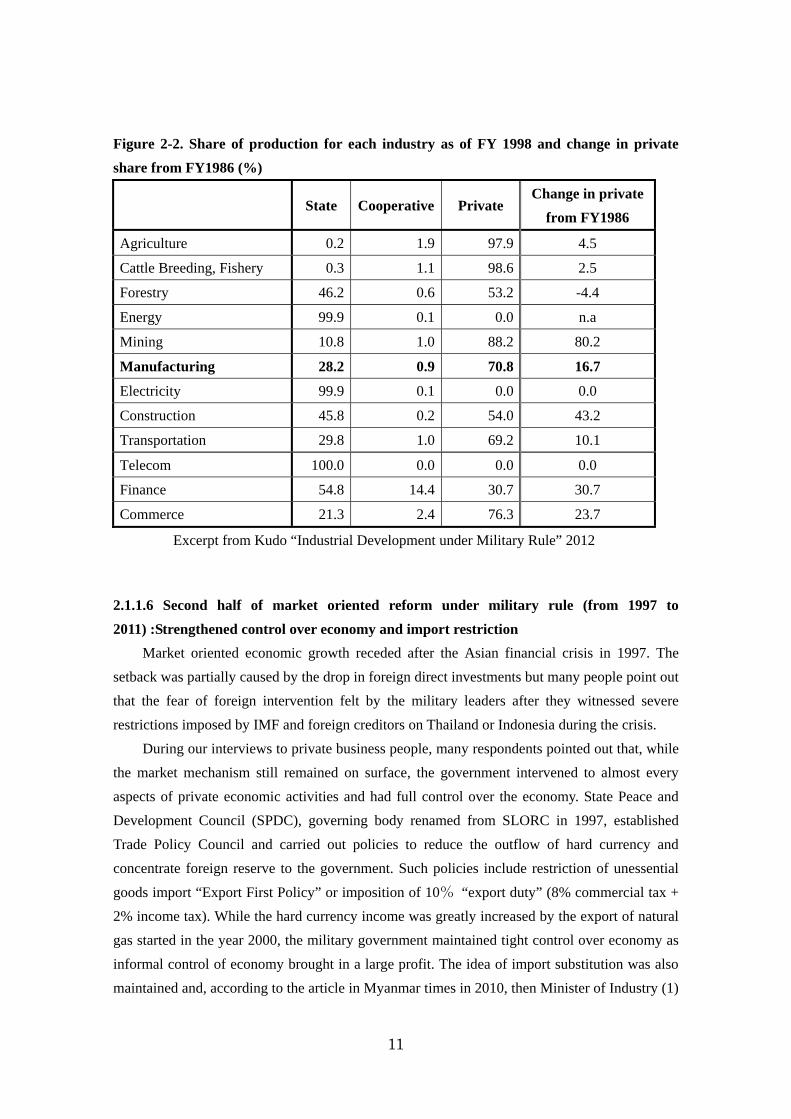
Figure 2-4 shows the change of private share in GDP between the first half of
market-economy, or SLORC period, and the latter half, or SPDC period. It shows the shrinking
private sector in the construction and finance sector and expansion in manufacturing, electricity,
transportation, services and commerce. While the increase in private manufacturers was mostly
10 “Minister urges local firms to register”, Myanmar Times Vol.26, No.514, 2010, mmtimes.com 11 Industrial Policy, Structure and Locations during the Transition toward a Market-oriented Economy in Myanmar, Toshihiro Kudo, IDE-JETRO 2010
Others
Transport/Telecom
Electricity
Oil/Gas
Construction
Hotel/Tourism
Real Estate
Manufacturing
Agriculture Fishery
($ million)
13
from small and medium food processors, we should also bear in mind that former government
factories transferred to MEC and UMEHL were also counted in the private sector. At the same
time, there is a possibility of overestimation in manufacturing sector as it could include natural
gas production, which had become one of the largest exporting items since year 2000.12
Figure 2-4. Share of production for each industry as of FY 2007 and change in private share from FY1998 (%)
State Cooperative Private Change in private
from FY1998
Agriculture 0.4 2.4 97.2 -0.7
Cattle Breeding, Fishery 0.1 0.7 99.2 0.6
Forestry 50.0 0.3 49.7 -3.5
Energy 76.3 9.3 14.4 14.4
Mining 2.9 0.2 96.9 8.7
Manufacturing 9.2 0.2 90.6 19.7
Electricity 79.5 0.3 20.2 20.2
Construction 60.1 0.0 39.9 -14.1
Transportation 1.5 0.1 98.4 29.3
Telecom 100.0 0.0 0.0 0.0
Finance 68.9 3.8 27.3 -3.4
Commerce 5.0 2.4 92.7 16.4
Excerpt from Kudo「Industrial Development under military rule」2012
Private share of 92.7% in commerce sector coincides with our interview to the Ministry of
commerce and growth in private transport matches the prevailing bus services by private
providers. However, telecom is still a monopoly by the government and certain sectors, such as
domestic airlines, river transports and railways are still dominated by the state. Electric sector
shows entrance by private sector because Chinese companies invested in electricity generations.
As mentioned earlier, despite the formation of privatization commission in 1995 and sale
of over 100 government properties, such as small factories, land plots, buildings and rice mills,
total number of SOEs continued to grow until 2008. However, the privatization was suddenly
accelerated since 2009 and, in 2010 alone, over 110 SOEs, 32 buildings and 246 gas stations
and 8 wharfs at Yangon port were reported to be privatized. Sector-by-sector analysis reveals
that the privatization was concentrated on certain sectors such as transport vehicles and food
12 “New light of Myanmar Economy”, Keiso Shobo, September 2012, p296
14
processing, while there has not been any change in other sectors.
Figure 2-5. Number of State-Owned-Enterprises (as of March-end)
Some observers saw this accelerated sale of privatization favorably as a “prelude for free
market economy”, while many criticized it as “the last minute sale of precious government
assets to people related to the militaries in non-transparent manner”.
2.1.1.7 Political and economic liberalization (from 2011 to present): Free competition and free trade
Following a approval of new constitution 2008, SPDC transferred the power to civilian
regime led by President Thein Sein, a former 4th ranked general of the military. The new regime
initiated a series of political liberalizations, including the release of Aung San Suu Kyi and other
political prisoners, and also loosened control over economy by relaxing import restrictions and
lowering the level of intervention to private business activities. As most private business people
appreciated the policies of the present regime during our interview, we also witnessed the
progress toward economic liberalization, as well as freedom of expression. In September 2011,
the government relaxed an import restriction of Automobiles (further described in “2.2.2.2
Automobile” section) and, in April 2012, multiple exchange rates were unified and
export-first-policy was abolished. Officials at the Ministry of Commerce mentioned that import
15
tariffs for 80% of major items had already been lowered to 5% or below, and certain items, such
as agricultural machinery, already enjoyed zero tariff and automatic import licensing. These
open and free economic policies led to influx of foreign businesses, which is fueling a boom in
office, hotel and high-end residential markets. Relaxation of car imports gave birth to the car
distribution industry and improved image of the country benefits tourism industry by attracting
a large number of foreigners. On the other hand, domestic manufacturers including state-owned
factories are concerned about increase competition with imported goods and some private
business people are lobbying elected law makers against free trade and FDI policies.
The government is also trying to improve the process for SOE privatization by reshaping
the Privatization Commission with a Vice President being a chairman and economic ministers
being members. While the privatization is a part of overall policy framework of converting the
government role from a player to a referee, it also stems from more pressing need of reduction
in fiscal deficits. However, many of senior government officials only talk about theoretical
methodologies, such as joint venture with private entities or leasing of government assets but do
not seem to have considered how to dispose loss making SOEs with limited hope for turn
around.
2.1.2 Statistical analysis of industry structure According to Statistical Yearbook issued by Central Statistical Office, agriculture was the
largest industrial sector in the composition of GDP as of March 2011, followed by commerce,
manufacturing and processing and transportations. When compared to the industrial
composition to GDP as of March 2007, or five years ago, the share of agriculture has decreased
and that of manufacturing and processing increased.
16
Figure 2-6. Composition of GDP by industry in Myanmar
However, it must be noted that flaws of statistics in Myanmar have been pointed out by
many observers. In our study, we noticed that the cement production of private manufacturers,
which is more than 5 times bigger than that of SOEs, is not captured in the GDP. On the other
hand, some of the state-owned factories have admitted to report much higher production figures
for GDP calculation than actual. Therefore, we should take the chart above with caution.
There are other possibilities that the 18.8% share of manufacturing sector is overestimated.
Potentially the largest impact is from the application of official exchange rate for international
trade, which was less than 6 kyats/$ while market rate as of now is around 850 kyats/$.
Manufacturing SOEs benefit from cheap kyat denominated import costs while export by
forestry and mining SOEs can be underestimated. At the same time, trading sector may be
underestimated due to the existence of many trades that are not captured by GDPs, including
border trades with China and Thailand
When we interviewed private business people or business consultants in Myanmar about
industrial structure, most respondents say “Myanmar is a country which exports primary goods
such as natural gas, agricultural products and precious stones and imports industrial products.
Due to ad hoc economic management by the military and lack of economic infrastructure,
Myanmar is not a good place for manufacturing business.” In fact, many of the products in the
supermarkets, such as soft drinks of snacks, are imported from Thailand or Singapore and the
situation is the same for stores of electric appliances, agricultural machineries and tyres.
17
These findings from the field survey coincide with the statistics of United Nations, which
is exhibited in Figure 2-7 and 2-8.
Figure 2-7. Major imports of Myanmar in 2011 ($ million)
Items Value Top Exporters
Gas 3,075 Thailand 3,075
Cork/Wood 969 India 590, China 278
Vegetable/Fruit 905 India 586, China 72
Apparel/ Clothing 845 Japan 346, South Korea 233
Non-metallic Mineral 798 China 777
Seafood 286 Japan 67, Thailand 61, China 58
Metalliferous Ores/Scraps 248 China 229
Rubber 217 China 105, Malaysia 96
Cereals 155 Côte d'Ivoire 59, Indonesia 20
Footwear 102 Japan 88, South Korea 5
Source: UN Comtrade
Figure 2-8. Major imports of Myanmar in 2011 ($ million)
Items Value Top Exporters
Road Vehicle 1,306 China 762, Japan 214, Thailand 83
Iron/Steel 1,119 China 670, India 154, Korea 144
Specialized Machinery 1,019China 352, Thailand 229, South Korea 164,
Japan 113
Textile Yarn 930 China 591, Thailand 150, Korea 80, Japan 54
Petroleum 920 Thailand 408, Singapore 289, China 141
Manufactures of Metal 530 China 221, Russia 144
Vegetable Fats 492 Malaysia 296, Indonesia 147
General Machinery 449 China 253, Singapore 65, Thailand 48
Electrical Machinery 412 China 178, Thailand 83, Singapore 48
Generator 355 China 230, Russia 39, Singapore 38
Source: UN Comtrade
Top of the export categories by far was the natural gas to Thailand which alone accounted
for 38% of total exports in 2011. The runner-ups were wood to India/China, 12% of exports,
vegetables to India, 11%, apparel products to Japan/Europe, 11%, and precious stones to China,
10%. If the gas pipeline to China is completed in 2013, the natural gas import will be even
18
larger. The export is concentrated to certain items as top ten categories combined account for
95% of all the trade.
On the other hand, composition of $12.2 billion import in 2011 was very diverse. The sum
of top ten categories constitutes 62% of total and the largest category of “road vehicle”
represents only 11% to the total, followed by steel, specialized machinery, textile products and
oil, each accounts for 9%. While Myanmar produces sufficient food for domestic consumption,
it also imports $600million of edible products and beverages. It is expected that the import will
continue to increase as a result of a series of import liberalization measures introduced in 2011.
2.1.3 Position of SOEs in the economy of Myanmar. In the modern history of Myanmar, the government had repeatedly tried to modernize the
industry and substitute imports through establishment of state-owned factories but with little track
record of success. The first trial was by King Mindon in late 19th century as he tried to modernize
the country to counter British aggression. He established state-owned factories of silk/cotton fabrics,
sugar and weapon/ammunitions with technical assistance from France and Italy. However, these
factories could not compete with imports and losses put a pressure on the countries fiscal position.13
The same plight as current SOEs struggling to complete with imports existed over 100 years ago.
Figure 2-9 shows the share of production in each industry based on the ownership in2007.
SOEs are playing predominant roles in energy, electricity, construction and finance and Telecom
is a state monopoly. The government is also a major player in domestic airlines and a sole
provider of inland shipping and railway services. On the other hand, less-than 10% share of
SOEs in manufacturing sector is considered to be smaller today as private sector has been
growing in the last several years. Of the factories that we visited, cement and pharmacy are the
only areas that SOEs may have 10% share in the market and other products’ market share is
considered to be minimal.
13 “New light of Myanmar Economy”, Keiso Shobo, September 2012,p6
19
Figure 2-9. Share of production for each industry as of FY 2007 (%)
State Cooperative Private
Agriculture 0.4 2.4 97.2
Cattle Breeding
・Fishery0.1 0.7 99.2
Forestry 50.0 0.3 49.7
Energy 76.3 9.3 14.4
Mining 2.9 0.2 96.9
Manufacturing 9.2 0.2 90.6
Electricity 79.5 0.3 20.2
Construction 60.1 0.0 39.9
Transportation 1.5 0.1 98.4
Telecom 100.0 0.0 0.0
Finance 68.9 3.8 27.3
Commerce 5.0 2.4 92.7
Excerpt from Kudo “Industrial Development under military rule” 2012
Regarding the issue of SOE privatization, government officials of Myanmar and foreign
aid agencies only talk about corporatization or equitization because they tend to think only
about monopoly or dominant SOEs such as telecom, electricity and finance. However, the
government of Myanmar will also have to consider the serious downsizing of SOEs with low
importance to the country, such as less than 10% share in GDP, and with low economic value.
2.2 Overview of manufacturing sector 2.2.1 Current status of manufacturing sector
We could not identify any detailed statistics regarding manufacturing industry. Responding
to our interview, a major local industrial research firm commented that it also had to rely on
interviews because government statistics was insufficient and not reliable. We used relatively
reliable corporate registration data, as well as literature search and interviews.
In Myanmar, the registration to Directorate of Industry Supervision and Inspection (DISI)
is required for all the private companies with machinery with three horse powers or more, as
well as employee of 10 people or more. Registration statistics are published on ad hoc basis and,
according to 2007 data, about 44,000 companies are registered. However, Myanmar times
reported in 2010 the possibility of mass violation of this requirement, citing a comment from
then Minister of Industry (1) that true number of companies was 120,000 and 55,000 companies
20
were not fulfilling the responsibility. Based on this article, about 65,000 companies are
registered in 2010, which would be equivalent to 47% increase from 2007. Registered
companies are divided into three categories, small, medium and large, based on the number of
employees. Small company is less than 50 employees, medium less than 100 employees, and
large being over 100 employees or machine with 50 horse powers or more. Therefore, many of
large companies can be a size of SMEs by other countries’ standard.
In terms of industry, food/beverage was the largest with 29,000 companies registered and
most of them were small companies. Transport vehicle and electric appliance industry had
smaller number of registrations but with higher ratio of large companies. Many of “transport
vehicle manufacturers” are considered to be established for the purpose of evading the import
restriction of cars and engage in assembly of cars dismantled in a foreign country and shipped
as separate parts to Myanmar.
Figure 2-10. Industrial and size distribution of registered enterprises
Size No. Industry
Large Medium Small Total
Share in
registered (%)
1 Food and beverages 1,867 3,931 23,053 28,851 65.89
2 Construction materials 446 499 2,117 3,062 7.00
3 Clothing 275 370 1,256 1,901 4.34
4 Mineral and petrochemicals 174 310 1,200 1,684 3.85
5 Personal goods 267 299 452 1,018 2.32
6 Household goods 113 69 125 307 0.70
7 Printing and publishing 18 69 190 277 0.63
8 Industrial raw materials 92 254 407 753 1.72
9 Agricultural equipment 13 27 45 85 0.19
10 Machinery and equipment 12 82 170 264 0.60
11 Transport vehicles 139 12 78 229 0.52
12 Electric appliances 29 10 21 60 0.14
13 Others 165 809 4,324 5,298 12.10
Total 3,610 6,741 33,438 43,789 100.0
Source: Quoted from “Business and investment environment of Myanmar”, JETRO Yangon,
September2009
21
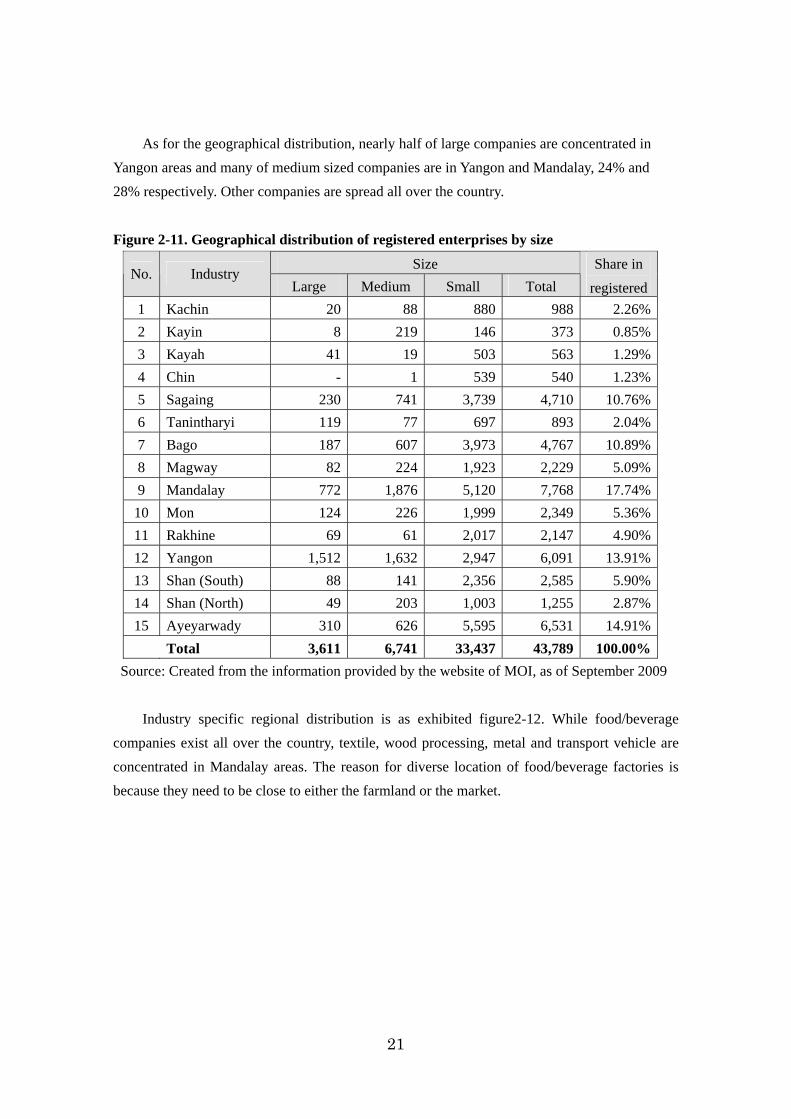
As for the geographical distribution, nearly half of large companies are concentrated in
Yangon areas and many of medium sized companies are in Yangon and Mandalay, 24% and
28% respectively. Other companies are spread all over the country.
Figure 2-11. Geographical distribution of registered enterprises by size
Size No. Industry
Large Medium Small Total
Share in
registered
1 Kachin 20 88 880 988 2.26%
2 Kayin 8 219 146 373 0.85%
3 Kayah 41 19 503 563 1.29%
4 Chin - 1 539 540 1.23%
5 Sagaing 230 741 3,739 4,710 10.76%
6 Tanintharyi 119 77 697 893 2.04%
7 Bago 187 607 3,973 4,767 10.89%
8 Magway 82 224 1,923 2,229 5.09%
9 Mandalay 772 1,876 5,120 7,768 17.74%
10 Mon 124 226 1,999 2,349 5.36%
11 Rakhine 69 61 2,017 2,147 4.90%
12 Yangon 1,512 1,632 2,947 6,091 13.91%
13 Shan (South) 88 141 2,356 2,585 5.90%
14 Shan (North) 49 203 1,003 1,255 2.87%
15 Ayeyarwady 310 626 5,595 6,531 14.91%
Total 3,611 6,741 33,437 43,789 100.00% Source: Created from the information provided by the website of MOI, as of September 2009
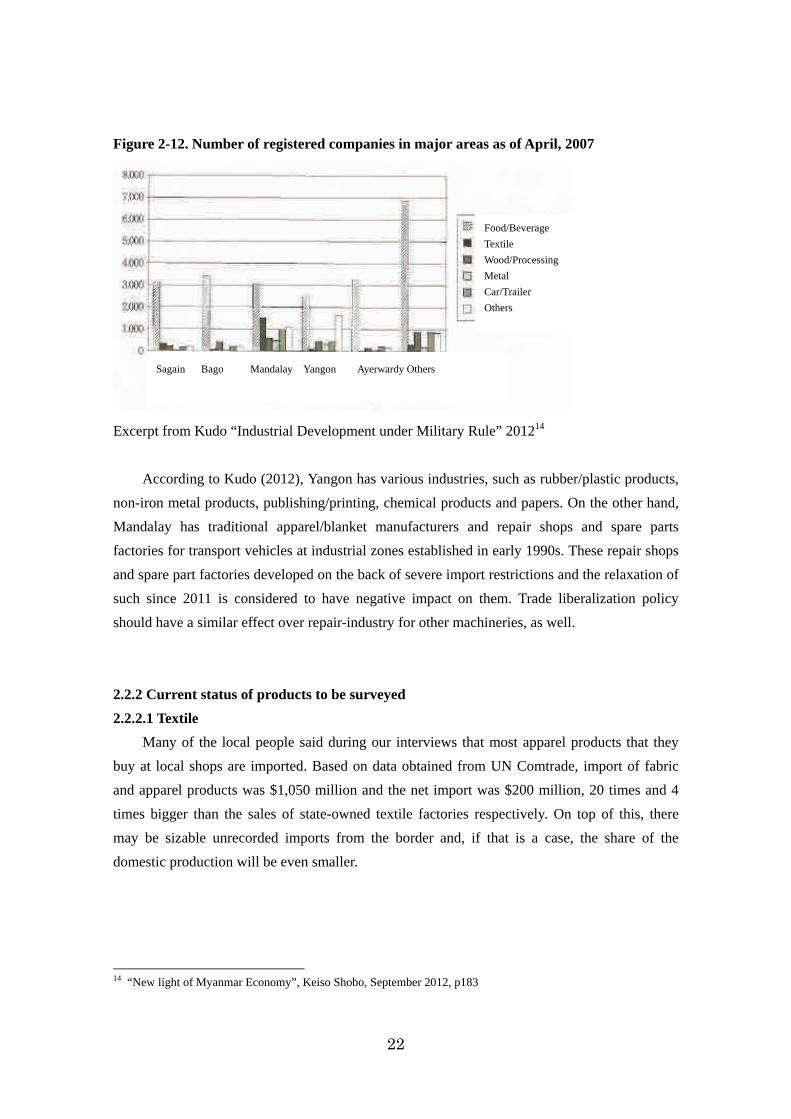
Industry specific regional distribution is as exhibited figure2-12. While food/beverage
companies exist all over the country, textile, wood processing, metal and transport vehicle are
concentrated in Mandalay areas. The reason for diverse location of food/beverage factories is
because they need to be close to either the farmland or the market.
22
Figure 2-12. Number of registered companies in major areas as of April, 2007
Excerpt from Kudo “Industrial Development under Military Rule” 201214
According to Kudo (2012), Yangon has various industries, such as rubber/plastic products,
non-iron metal products, publishing/printing, chemical products and papers. On the other hand,
Mandalay has traditional apparel/blanket manufacturers and repair shops and spare parts
factories for transport vehicles at industrial zones established in early 1990s. These repair shops
and spare part factories developed on the back of severe import restrictions and the relaxation of
such since 2011 is considered to have negative impact on them. Trade liberalization policy
should have a similar effect over repair-industry for other machineries, as well.
2.2.2 Current status of products to be surveyed 2.2.2.1 Textile
Many of the local people said during our interviews that most apparel products that they
buy at local shops are imported. Based on data obtained from UN Comtrade, import of fabric
and apparel products was $1,050 million and the net import was $200 million, 20 times and 4
times bigger than the sales of state-owned textile factories respectively. On top of this, there
may be sizable unrecorded imports from the border and, if that is a case, the share of the
domestic production will be even smaller.
14 “New light of Myanmar Economy”, Keiso Shobo, September 2012, p183
Sagain Bago Mandalay Yangon Ayerwardy Others
Food/Beverage
Textile
Wood/Processing
Metal
Car/Trailer
Others
23
Figure 2-13. Textile related trade in 2011 (thousand USD)
Import Export Net Import
Yarn , Fabric 930,458 9,806 920,652
Textile fiber 22,360 825 21,535
Apparel closing 97,446 844,580 -747,134
Total 1,050,264 855,212 195,052
Source: UN Comtrade
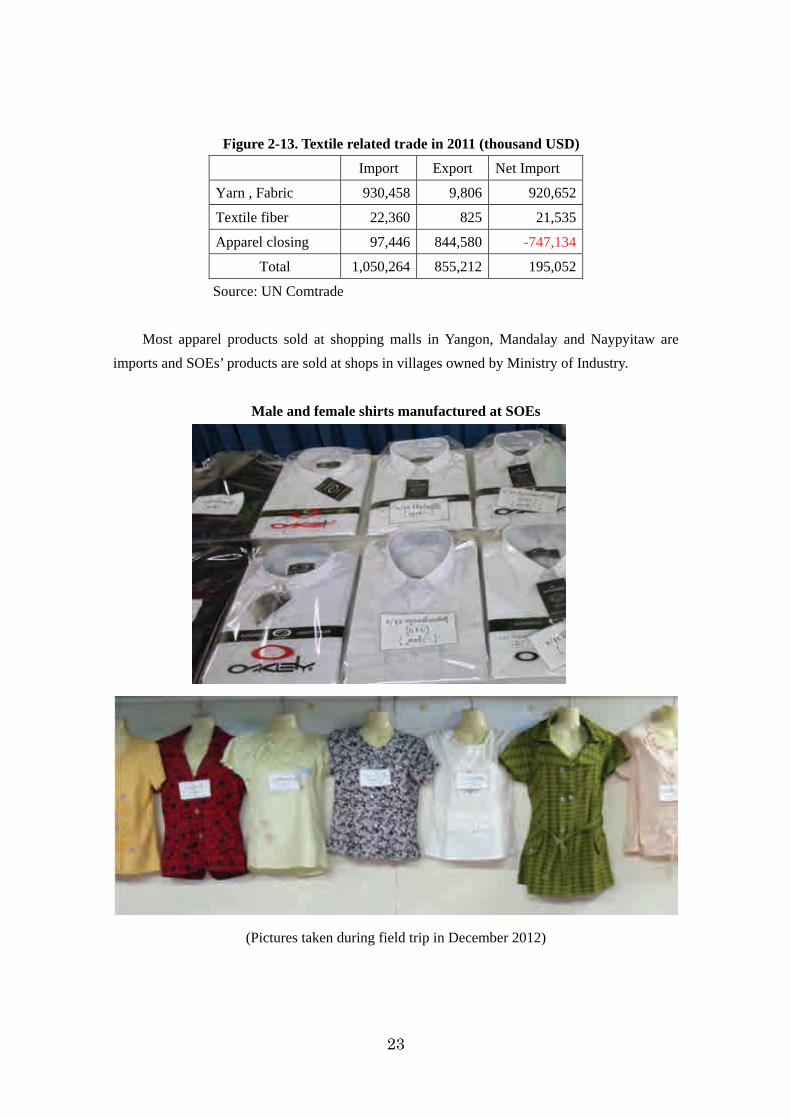
Most apparel products sold at shopping malls in Yangon, Mandalay and Naypyitaw are
imports and SOEs’ products are sold at shops in villages owned by Ministry of Industry.
Male and female shirts manufactured at SOEs
(Pictures taken during field trip in December 2012)
24
Cotton yarn and fabric are one of the major import items to Myanmar with the value of
$930 million and 63% of them are from China and 16% are from Thailand.
Figure 2-14. Major fabric exporters to Myanmar in 2011 (thousand USD)
Country Value
China 591,232
Thailand 149,868
Rep. of Korea 80,420
Japan 57,812
Indonesia 15,712
Hong Kong 11,275
India 10,355
Singapore 4,712
Malaysia 2,837
Italy 2,276
Source: UN Comtrade
2.2.2.2 Passenger cars Several business people mentioned jokingly during our interview that there were over 300
automobile manufacturers in Myanmar. Those “automobile manufacturers” are engaged in
Dismantled Knock Down, or DKD, in which their partners in foreign country dismantled a
passenger car and ship the parts of the cars separately to Myanmar, and then DKD companies
reassembled imported parts and obtain “made-in-Myanmar” certification. This kind of business
developed on the back of severe import restriction of passenger cars and cars could be imported
only by a limited kind of people, such as sailors and Myanmar citizens working abroad. Due to
the scarcity of cars in good condition, prices of cars in Myanmar were more than 10 times
higher than those of “free trade countries”. However, the government relaxed the import
restriction in September 2011 by allowing owners of twenty to forty years old cars to replace it
with newly imported vehicles. As a result, the domestic price of cars dropped significantly and
DKD companies lost its meaning.
25
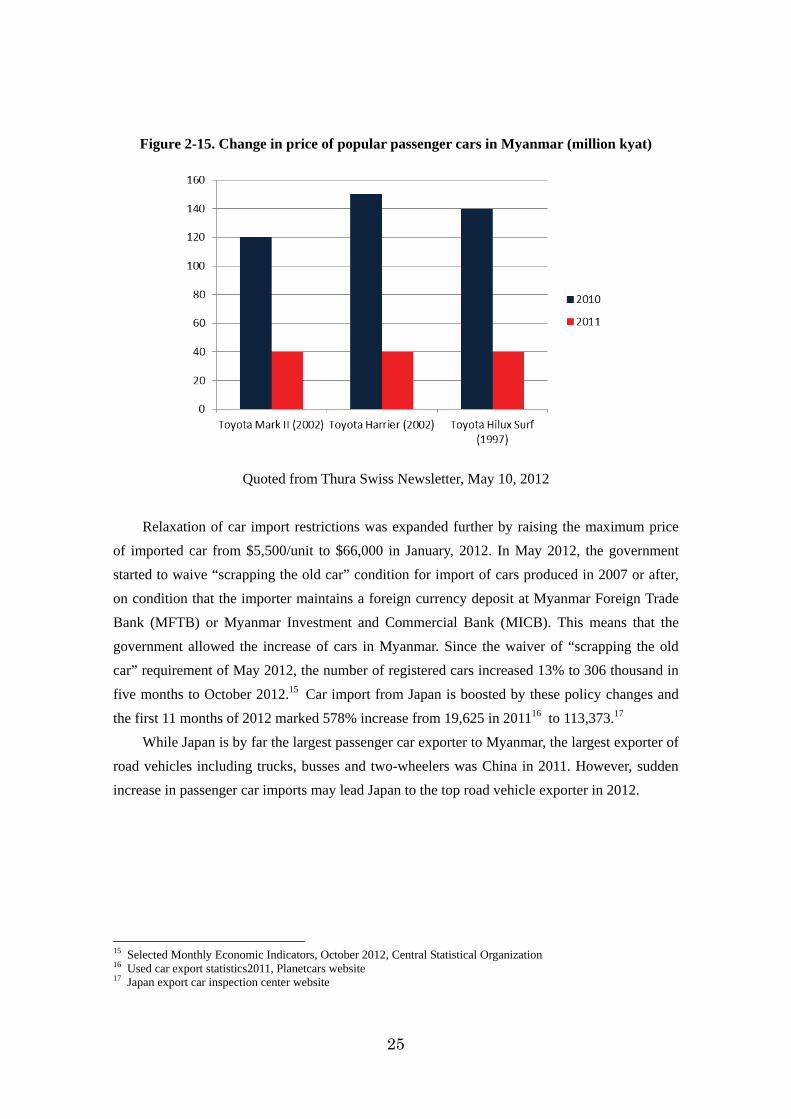
Figure 2-15. Change in price of popular passenger cars in Myanmar (million kyat)
Quoted from Thura Swiss Newsletter, May 10, 2012
Relaxation of car import restrictions was expanded further by raising the maximum price
of imported car from $5,500/unit to $66,000 in January, 2012. In May 2012, the government
started to waive “scrapping the old car” condition for import of cars produced in 2007 or after,
on condition that the importer maintains a foreign currency deposit at Myanmar Foreign Trade
Bank (MFTB) or Myanmar Investment and Commercial Bank (MICB). This means that the
government allowed the increase of cars in Myanmar. Since the waiver of “scrapping the old
car” requirement of May 2012, the number of registered cars increased 13% to 306 thousand in
five months to October 2012.15 Car import from Japan is boosted by these policy changes and
the first 11 months of 2012 marked 578% increase from 19,625 in 201116 to 113,373.17
While Japan is by far the largest passenger car exporter to Myanmar, the largest exporter of
road vehicles including trucks, busses and two-wheelers was China in 2011. However, sudden
increase in passenger car imports may lead Japan to the top road vehicle exporter in 2012.
15 Selected Monthly Economic Indicators, October 2012, Central Statistical Organization 16 Used car export statistics2011, Planetcars website 17 Japan export car inspection center website
26
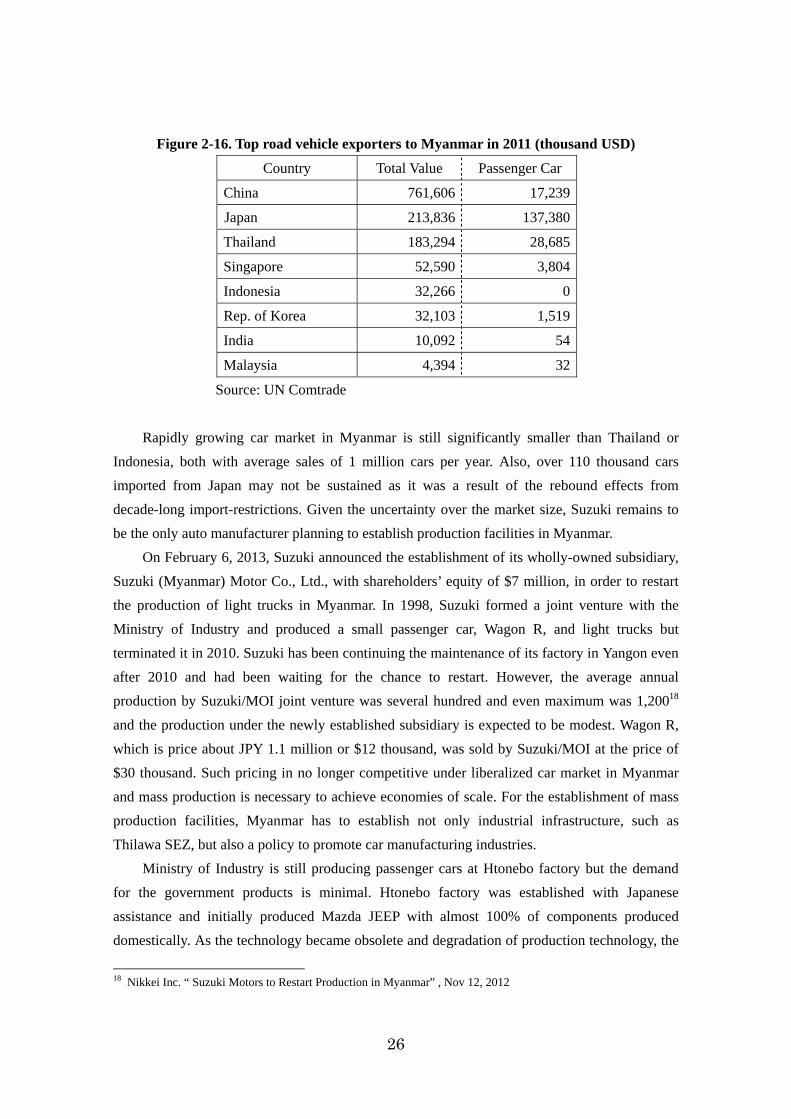
Figure 2-16. Top road vehicle exporters to Myanmar in 2011 (thousand USD)
Country Total Value Passenger Car
China 761,606 17,239
Japan 213,836 137,380
Thailand 183,294 28,685
Singapore 52,590 3,804
Indonesia 32,266 0
Rep. of Korea 32,103 1,519
India 10,092 54
Malaysia 4,394 32
Source: UN Comtrade
Rapidly growing car market in Myanmar is still significantly smaller than Thailand or
Indonesia, both with average sales of 1 million cars per year. Also, over 110 thousand cars
imported from Japan may not be sustained as it was a result of the rebound effects from
decade-long import-restrictions. Given the uncertainty over the market size, Suzuki remains to
be the only auto manufacturer planning to establish production facilities in Myanmar.
On February 6, 2013, Suzuki announced the establishment of its wholly-owned subsidiary,
Suzuki (Myanmar) Motor Co., Ltd., with shareholders’ equity of $7 million, in order to restart
the production of light trucks in Myanmar. In 1998, Suzuki formed a joint venture with the
Ministry of Industry and produced a small passenger car, Wagon R, and light trucks but
terminated it in 2010. Suzuki has been continuing the maintenance of its factory in Yangon even
after 2010 and had been waiting for the chance to restart. However, the average annual
production by Suzuki/MOI joint venture was several hundred and even maximum was 1,20018
and the production under the newly established subsidiary is expected to be modest. Wagon R,
which is price about JPY 1.1 million or $12 thousand, was sold by Suzuki/MOI at the price of
$30 thousand. Such pricing in no longer competitive under liberalized car market in Myanmar
and mass production is necessary to achieve economies of scale. For the establishment of mass
production facilities, Myanmar has to establish not only industrial infrastructure, such as
Thilawa SEZ, but also a policy to promote car manufacturing industries.
Ministry of Industry is still producing passenger cars at Htonebo factory but the demand
for the government products is minimal. Htonebo factory was established with Japanese
assistance and initially produced Mazda JEEP with almost 100% of components produced
domestically. As the technology became obsolete and degradation of production technology, the
18 Nikkei Inc. “ Suzuki Motors to Restart Production in Myanmar” , Nov 12, 2012
27
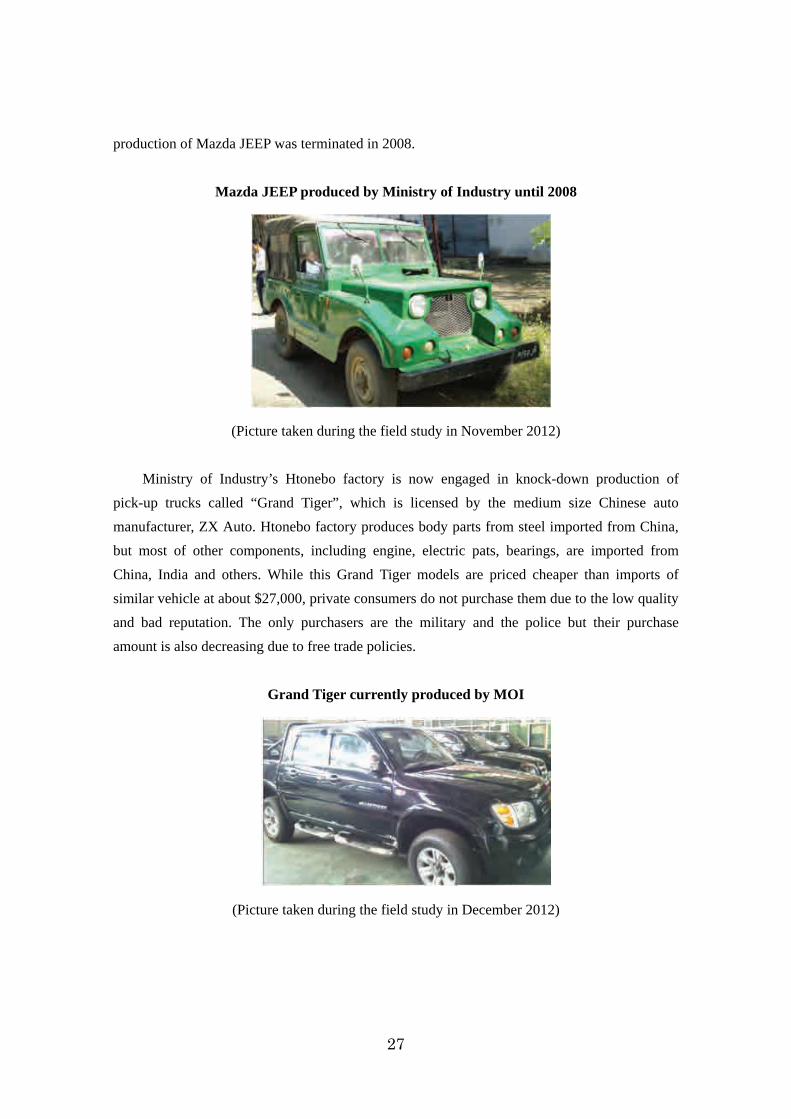
production of Mazda JEEP was terminated in 2008.
Mazda JEEP produced by Ministry of Industry until 2008
(Picture taken during the field study in November 2012)
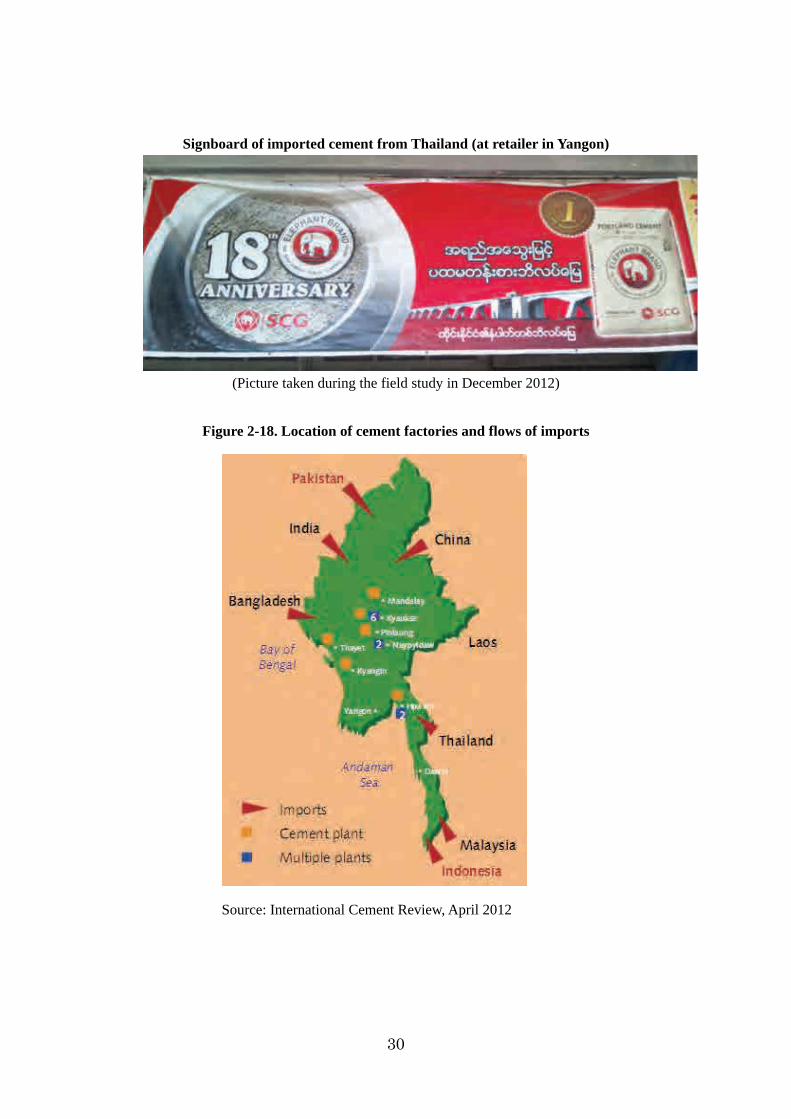
Ministry of Industry’s Htonebo factory is now engaged in knock-down production of
pick-up trucks called “Grand Tiger”, which is licensed by the medium size Chinese auto
manufacturer, ZX Auto. Htonebo factory produces body parts from steel imported from China,
but most of other components, including engine, electric pats, bearings, are imported from
China, India and others. While this Grand Tiger models are priced cheaper than imports of
similar vehicle at about $27,000, private consumers do not purchase them due to the low quality
and bad reputation. The only purchasers are the military and the police but their purchase
amount is also decreasing due to free trade policies.
Grand Tiger currently produced by MOI
(Picture taken during the field study in December 2012)
28
2.2.2.3 Tyre Tyre purchasers can be divided into auto manufactures and car owners. Since Myanmar
does not have a large auto manufacturing industry, most sales are for replacement purposes.
While inferior road condition requires frequent replacement of tyres, the market size is not large
as there are only 300,000 passenger cars exist in Myanmar, as of October 2012.
Domestic production of tyres is carried out by MOI’s Thaton (bias tyre) and Belin (radial
tyre) and a private manufacturer, Yangon Tyre, which started production last year. However,
domestic market is dominated by imports.
Products of Yangon tyre, the first private manufacturer
(Picture taken during the field study in December 2012)
According to UN Comtrade, tyres are mostly imported from neighboring countries with
large auto industries, such as China, Thailand and India and European brands are imported
through Singapore. We visited tyre retailers in Yangon, Mandalay and Pyay and confirmed that
global manufacturers like Bridgestone and Michelin are not as popular as cheaper brands from
emerging countries.
29
Figure 2-17 Tyre exporters to Myanmar in 2011 (thousand USD)
Country Value
China 78,064
Thailand 60,908
Singapore 12,460
India 12,360
Indonesia 6,167
Korea 4,376
Japan 1,340
Source: UN Comtrade
Belin factory’s production size is very small when compared to imports. Belin factory’s
sales in 2011-2012 was Kyat 1,450 million, which is about $1.7 million or less than 1% of total
tyre imports.
2.2.2.4 Cement While the statistics is not available for domestic private production, we estimated from our
interview to Ministry of Industry and a private cement manufacturer that current cement
consumption is considered to be 5 million tons per year. This estimated figure is consisted by 2
million tons from private manufacturers, 0.6 million tons from Ministry of Industry and 2.4
million from imports. Cement is a bulky product and freight cost is very important factor of
market competitiveness. This is especially true for Myanmar where the transport infrastructure
is still poor and transport cost is very expensive. As a result, domestic market is divided into two,
the southern market, which is closer to Yangon port and dominated by imports, and the northern
market, which is dominated by domestic products.
Figure 2-18 shows the flow of cement imports and locations of domestic cement plants.
Domestic plants are concentrated near Mandalay, the largest city in the north, and there are two
plants in Naypyitaw, where the demand for cement consumption is high. The largest plant is
MEC plants in Hpa An. The locations of two MOI factories that we visited are on Ayeyarwady
River.
30
Signboard of imported cement from Thailand (at retailer in Yangon)
(Picture taken during the field study in December 2012)
Figure 2-18. Location of cement factories and flows of imports
Source: International Cement Review, April 2012
31
Based on UN Comtrade, Thailand is by far the largest cement exporter to Myanmar with
the export value of $130 million in 2011, followed by China with $28 million and Malaysia with
much $1 million. Due to high transport costs, other countries with long distances to Myanmar
are not exporting much to Myanmar and all the wholesalers and retailers that we visited in
Yangon and Mandalay carried only Thai imports and domestic products. Figure 2-18 also
suggests import from Bangladesh but Bangladeshi export statistics does not show any cement
exports in UN Comtrade. However, there was a news report that the port of Teknaf was
booming from exports to Myanmar, including cement, aluminum products and others.19
Figure 2-19. Major cement exporting countries in 2011 (thousand USD)
Country Value
Thailand 128,742
China 27,955
Malaysia 1,135
Pakistan 602
Korea 248
Indonesia 225
Singapore 64
India 60
Source: UN Comtrade
Most existing cement factories, except for MEC’s Hpa An plant with production capacity
of 4,800 tons/day, are small in scale with production capacity of 500 tons/day or smaller. This is
because of the poor road infrastructure which makes it difficult for mass transportation of fuel
and final products. Many small plants employ wet production method as it is easy to operate and
the cost disadvantage over dry-method is not significant for a small plant. Smaller scale of
production results in higher cost than mass productions in Thailand.
19 BBC News “ Bangladesh bids to boost trade with Burma” , Dec 18, 2012
32
Figure 2-20. Domestic cement factories (tons/day)
Company Name Factory location Process Production
Capacity
Expansion
Plan
Ministry of Industry Thayet, Magway 700
Ministry of Industry Kyangin, Ayeyarwady Wet
1,600
Ministry of Industry 500
Mandalay Cement Ind Dry
250
AAA 800 *400
Tiger Head 300 700
UMEHL
Kyaukse, Mandalay
1100
YCDC Thazi, Mandalay 500 1,500
NDC 500 1,000
Max Cement Laeway, Napyitaw
Wet
500 1,500
Dragon Cement Pinlaung, Shan Wet 400
MEC Hpa An, Kayin Dry 4,800
Total production capacity 11,950 4,700
*AAA has already obtained permission for expansion from MIC
Source: MOI factories; Field Study, Others; International Cement Review, April 2012
Reflecting a rapid economic growth, several new factories are under construction and their
production capacities are bigger than existing ones with 1,000 tons/day. The new factories
employ dry process and most of them are located near Mandalay, which is the center of
upper-Myanmar market and close to coal mines in Shan and Chin states.
Figure 2-21. New cement plants approved or under consideration by MIC (as of April 2012) Approved (tons/day)
Company Name Factory location ProcessProduction
Capacity Construction
Shwe-Taung 1,000 Started
Htoo Pyinyaung, Thazi
1,000 Started
KBZ Pangpet, Taungyi 1,000 Started
Yuzana Tharabwin, Tanasary
Dry
1,000
Total production capacity per day 4,000
33
Under consideration
Myanmar Cowntone Banmaw 1,000
Thandawmyat Kyaukse 1,000
Tatluyinn Thazi 1,000
Minn Anawrahta Pinlaung 1,000
Ngwey Yi Pale Mining Naungcho 1,000
Nyinyar Swan-arr Kalaw 1,000
June Satmu Kyake-maraw
Dry
1,000
Total production capacity per day 7,000
Source: International Cement Review, April 2012
On top of these, many more plans for new cement factories have been reported to be
submitted to the government for review. The domestic production capacities may double in the
next several years.
Figure 2-22. Plans for new cement factories submitted to the government(April, 2012) (tons/day)
Company Name Factory location Process Production
Capacity
Sun Lin Int Wai Maw, Kandaw Yan 1,000
Jade Land Myanmar Banmaw, Sinn-Khann 1,000
Tun Thwin Kalay, Indine-gyi 1,000
Asia Phyo Zinn village, Kant-balu 1,000
IGE Kyaukse, Taung-daw 1,000
Group of four 1,000
Green Asia 1,000
Edin
Pyinyaung, Thazi
1,000
Tarmoe Nye Larsho, Mal-han 1,000
Pacific Link Kyake-maraw, Kawt-panaw 1,000
Zay Kabar Kyake-maraw, Ni-tonn 3,300
Farmar Phoyazar Kyake-maraw, Mayangon 1,000
United Cement Hpa An, Kaw-pyin
Dry
1,000
Total production capacity per day 15,300
Source: International Cement Review, April 2012
34
Also, there have been news reports that cement producer in other ASEAN countries, such
as Thailand and Indonesia, are planning to establish their own factories in Myanmar. Local
business people predict that their factories shall be located in Tanintharyi Division, which faces
Andaman sea and easy to import cheap coal from Indonesia.
2.2.2.5 Agricultural machines Based on date from UN Comtrade, Total exports of agricultural machinery excluding
tractors was about $32million in 2011, which is 25 times bigger than the tillers sales of MOI’s
Sinde factory in FY2011-2012. Since the government has abolished import tariff for the import
of agricultural machinery, the import value is expected to have been increased in 2012. The
liberalization of agricultural machinery was designed to promote agriculture by lowering the
price of advanced machineries.
Figure 2-23. Major exporters of agricultural machinery, excluding tractors in 2011 (thousand USD)
Country Value
China 14,179
Thailand 11,977
Korea 2,652
Singapore 1,019
India 895
Malaysia 526
Japan 247
Source: UN Comtrade
As for tractors, there is no domestic production and Thailand is the largest exporter,
followed by China. Many of Japanese companies are trying to expand export of tractors to
Myanmar and many of the Japanese branded machines that we witnessed in retail shops in
Yangon and Mandalay were made in Thailand.
35
Tiller produced at Sinde factory
(Picture taken during the field study in November 2012)
Figure 2-24. Major tractor exporters to Myanmar 2011 (thousand USD)
Country Value
Thailand 8,303
China 5,651
Korea 3,950
India 2,948
Japan 1,508
Source: UN Comtrade
Japanese brand tractor on display at a retail shop in Mandalay
(Picture taken during the field study in December 2012)
36
2.2.2.6 Pharmaceutical products Pharmaceutical products are also dominated by imports. According to some MOI staffs, its
“market share is about ten percent”, but we have not been able to verify this statistically. When
we compare the total import of medicine, $233 million in 2011, and the sales of No.1
Pharmaceutical factory, Kyat 6,594 million in FY2011-2012, the factory’s share is only 3%,
based on 850 kyat/$. While we heard that several private supplements manufacturers exist,
private business people complained that MOI is blocking the private entry into manufacturing of
pharmaceutical products to protect its market share.
India, a major manufacturer of generic drugs and the neighbor, was the largest exporter of
medicine in 2011, with the market share of 32%, followed by Thailand with 24% market share
and China with 11% share.
Figure 2-25 Major medicine exporter to Myanmar in 2011 (thousand USD)
Country Value
India 75,090
Thailand 56,256
China 25,549
Belgium 15,740
Indonesia 10,885
France 8,421
Malaysia 7,346
Singapore 7,009
Korea 5,250
Germany 4,402
Source: UN Comtrade
37
Supplement and Medicine produced by Ministry of Industry on display at retail shop in Mandalay
(Pictures taken during the field study in December 2012)
38
2.3 Myanmar export and import trend 2.3.1 Availability of data and trend of trade balance
Source: IMF, Myanmar: Statistical Appendix, January 2001.
Original source: Data provided by the Myanmar authorities.
In this study we were not able to obtain items of gross capital formation and gross national
saving from relevant government agencies such as the Ministry of National Planning and
Economic Development (MNPED), Ministry of Finance and Revenue (MOFR) and Central
Bank of Myanmar (CBM)24.
The recently published IMF report25 provides the data of public capital expenditures by
union government and by state economic enterprises (SEEs). According to it, union
government’s capital expenditures have been staying in the range of 6 to 8% of GDP, and SEEs’
only 1% in recent years.
24 According to Ministry of National Planning and Economic Development, Myanmar’s statistical system is very backward, and on systems of national accounts SNA68 is used even now instead of SNA93. (an interview on 8th November 2012) 25 IMF, Myanmar: Staff-Monitored Program, January 2013.
50
Figure 2-40. Composition of gross capital formation (in percent of GDP)
2007/08 2008/09 2009/10 2010/11 2011/12Est.
Gross capital formation 14.8 15.9 19.8 25.2 Gross fixed capital formation 14.5 16.0 19.9 24.9 Change in inventories 0.3 -0.1 -0.1 0.3Public capital expenditures 6.9 5.8 7.5 8.8 7.7 Union government 5.8 4.6 6.2 7.8 6.6 State economic enterprises 1.2 1.2 1.3 1.0 1.0
Source: Gross capital formation: ADB, Key Indicators for Asia and the Pacific 2012, August
2012. Public capital expenditures, nominal GDP: IMF, Myanmar: Staff-Monitored
Program, January 2013.
2.4.1.2 Government capital investment During the course of our study, MNPED provided us with the data of government capital
investment (see, figure 2-41)26.
According to the data, in FY1988 when Myanmar moved from “Burma’s socialist system”
to military regime, productive sector accounted for 64.1% of government capital investment, in
particular, manufacturing 15.1%. After that the percentages of productive sector have been
decreasing, while those of services sector have been increasing, in particular, expenditures to
administrative organizations. Since FY2006 expenditures to administrative organizations have
been over half of government capital investment, presumably resulting from the construction
expenditures of the new capital, Naypyitaw. In FY2009 main items in productive sector (26.5%)
are electric power (7.9%), construction (6.7%) and manufacturing (6.2%), however, one of the
most significant sectors, agriculture accounted for only 4.9%. Services sector constituted 73.5%,
administrative 61.7% followed by transport sector 7.1%.
26 We received the data on 27th December 2012.
51
Figu
re 2
-41.
Gov
ernm
ent c
apita
l inv
estm
ent b
y se
ctor
(%)
Fis
cal y
ear
1988
1989
1990
1991
1992
1993
1994
1995
1996
1997
1998
1999
2000
2001
2002
2003
2004
2005
2006
2007
2008
2009
Productive Sectors
64.
14
9.7
33.
13
1.8
33.
62
8.2
33.
83
4.8
30.8
43.8
43.8
43.6
49.8
52.6
45.6
41.7
40.9
34.7
28.9
27.6
35.
62
6.5
Agriculture
8.9
7.6
5.3
4.3
6.7
7.5
11.1
16.7
10.9
11.6
13.6
12.1
21.5
10.2
10.6
8.5
6.9
7.8
5.6
5.3
8.2
4.9
Livestock and Fishery
2.6
1.2
1.0
1.3
1.0
0.5
0.2
0.3
0.4
0.2
0.3
0.1
0.2
0.3
0.3
0.5
0.4
0.3
0.3
0.2
0.1
0.2
Forestry
4.0
3.3
1.9
1.1
1.4
1.3
0.7
0.8
1.0
0.9
0.8
1.0
0.9
0.8
0.6
0.4
0.3
0.2
0.2
0.2
0.4
0.3
Energy
4.8
2.0
0.7
0.6
0.5
0.3
0.5
**0.
40.
40.
60.
71.
51.
20.
10.
10.
10.
10.
30.
20.
30.
3
Mining
7.8
4.8
1.1
0.8
0.7
0.9
0.3
0.3
0.2
0.1
****
0.1
0.1
0.1
0.1
0.1
0.1
****
****
Processing and Manufacturing
15.1
10.7
6.1
3.9
4.9
2.3
1.2
1.3
1.9
4.0
8.9
7.5
9.0
11.4
14.3
12.8
12.5
6.5
6.3
7.0
8.8
6.2
Electric Power
11.0
9.8
6.9
4.5
5.0
3.7
3.7
3.3
4.1
6.1
3.9
4.2
2.8
4.3
4.3
4.5
7.5
8.0
8.6
9.6
12.9
7.9
Construction
9.9
10.3
10.1
15.3
13.4
11.7
16.1
12.1
11.9
20.5
15.7
18.0
13.8
24.3
15.3
14.8
13.1
11.7
7.6
5.1
4.9
6.7
Services
33.
84
6.8
64.
26
4.1
62.
66
9.2
63.
96
3.2
68.0
55.3
55.6
55.9
49.7
46.6
53.7
58.1
58.7
65.1
70.9
72.3
64.
47
3.5
Transport
12.7
11.8
8.3
8.6
8.0
9.5
11.0
13.5
15.5
14.7
13.8
11.3
5.5
9.6
12.2
12.6
11.9
16.6
7.3
6.7
6.3
7.1
Communications
2.4
1.3
3.8
1.5
1.5
1.6
1.5
1.9
1.9
1.9
1.6
1.1
1.1
1.3
1.6
1.1
2.5
1.1
1.4
2.3
1.9
1.5
Social Services
7.9
8.8
21.0
24.7
22.1
13.8
11.3
11.7
16.9
12.4
7.7
9.2
13.1
12.3
20.3
12.2
12.9
4.6
5.0
4.2
3.6
3.1
Financial Institutions
0.6
0.6
1.5
1.3
1.6
1.8
1.8
1.1
0.5
0.7
0.3
0.3
0.5
0.5
0.5
0.2
0.3
0.3
0.2
0.1
0.1
0.1
Administrative Organizations*
7.6
14.5
22.2
20.8
29.4
42.5
38.3
35.0
33.2
25.6
32.2
34.0
29.5
22.9
19.1
32.0
31.1
42.5
57.0
59.0
52.5
61.7
Municipalities
2.6
9.8
7.4
7.2
--
--
Trade
2.1
3.5
2.7
4.1
3.8
2.6
2.3
2.0
1.2
0.9
0.6
0.5
0.5
0.8
0.7
0.2
0.4
0.2
0.2
0.1
****
Total
100.
010
0.0
100.
010
0.0
100.
010
0.0
100.
010
0.0
100
.01
00.0
100
.01
00.0
100
.01
00.0
100
.01
00.0
100
.01
00.0
100
.01
00.0
100.
010
0.0
Sou
rce:
Dat
a pr
ovid
ed b
y M
inis
try
of N
atio
nal P
lann
ing
and
Eco
nom
ic D
evel
opm
ent (
MN
PE
D)
51
52
2.4.2 Foreign direct investment
2.4.2.1 Trend of foreign direct investment
Figure 2-42 describes the trend of foreign direct investment (FDI) in Myanmar. We need to carefully
examine FDI statistics with caution because statistics based on approved capital base significantly differs with
that based on implemented capital base year after year. The analysis below is based on approved capital statistics,
Regarding foreign companies investing in Myanmar, as mentioned above, FDI flows into Myanmar is
centered at oil and gas sectors as well as power sectors. For the oil and gas sector, Chevron (US), Total (France),
Daewoo and Korea Gas Corporation (Korea), Petronas (Malaysia), PTTEP (Thailand), CNOOC, CNPC and
Sinopec (China), ONGC (India) etc. are conducting the development and production of natural gas27. For the
power sector, China has played a dominant role28 where China Huaneng Group, China Datang Corporation and
China Power Investment Corporation are operating business in this sector.
2.4.3 Special Economic Zone (SEZ)
2.4.3.1 Special Economic Zone Law
The present special economic zone (SEZ) law was enacted in January 2011; however, based on the
interviews with relevant ministries, the law is currently under review for revision in the near feature.
The brief summary of the current active law is as follows:
Kind of business in
Special Economic
Zones
(Article 6)
(a) production based businesses such as goods processing business, hi-tech
production business, industries, agriculture, livestock breeding and fishery,
mineral produce business and forestry produce business;
(b) services business such as trading, logistics and transportation, storage, hotel and
tourism, education and health, residential quarters, infrastructure supply and
27 Sakamoto, S., “Myanmar: Minshuka・Keizai Kaiho Seisaku ni Tenjita Myanmar Sekyu Gasu Kaihatsu no Tenbo” (in Japanese), Japan Oil, Gas and Metals National Corporation, 2012, etc.
28 Suehiro, A., “Chugoku no Taigai Bocho to Tonan Ajia” (in Japanese), Institute of Developing Economies, 2011.
56
support centers, green areas which conserves and protects the natural
environment, recreating and resort centres;
(c) infrastructure construction businesses such as road, bridge, airport, port, electricity,
communication and water supply environment conservation and protection, and
wastes control;
(d) other businesses determined by the Central Body, with the approval of the
Government.
Income tax
exemption
(Article 17)
The investor who invests and operates business in the Special Economic Zone:
(a) may apply for income tax exemption on the proceeds of overseas sale for the first
five years from the day of commencement of the production or service;
(b) may apply for fifty percent relief on the income tax rate stipulated under existing
Law for the second five years on the overseas sale proceeds;
(c) for the third five years, if the profit obtained from export sale is re-invested, may
apply for fifty percent relief on the income tax rate stipulated under existing Law
on such invested profit;
Exemption from
customs duty and
other revenues
(Article 24)
The investor may be allowed to:
(a) import raw materials, machineries, equipment from foreign country which are
imported for export-oriented processing enterprises established in Export
Processing Zone, with exemption from customs duty and other revenues;
(b) import, with stipulations, machineries and motor vehicles from foreign countries
which are to be used in investment enterprises with exemption from customs duty
and other revenues, for five years commencing from the year of operation, and
relief of fifty percent of customs duty and other revenues for the next five
consecutive years;
(c) except Export Processing Zone, other zones in Special Economic Zone have the
right of exemption and relief of tax and revenue in respect of the importation of
materials related to investment business from local and foreign countries, in
accord with the existing Law.
Land lease and land
use
(Article 35)
The Central Body:
(a) shall may, with the approval of the Government, permit the developer or investor
land lease or land use after causing payment of fees to be made for land lease or
land use, for at least 30 years;
(b) if desirous to continue to operate after the expiry of the permitted term under
subsection (a), may extend consecutive term of 30 years for large-scale investment
57
enterprise and further 15 years of extension after the expiry of the said term;
(c) if desirous to continue to operate after the expiry of the permitted term under
subsection (a), may extend consecutive term of 15 years for medium-scale
investment enterprise and further 15 years of extension after the expiry of the said
term;
(d) if desirous to continue to operate after the expiry of the permitted term under
subsection (a), may extend two times of consecutive term of five years for
small-scale investment enterprises.
Source: Excerpt from “The Myanmar Special Economic Zone Law”2011.
2.4.3.2 Existing SEZs
At present, there are three SEZs planned at different sites in Myanmar, that is, Dawei, Kyaukpyu and
Thilawa. All sites have a plan that the government will transform existing sea ports29 into deep-water ports and
construct SEZs in the nearby vicinity of those ports. Every site seemed to have gained supports from different
countries with its geopolitical interests respectively.
29 Each port is controlled by Myanmar Port Authority under Ministry of Transportation.
58
Location of SEZ, planned SEZ sites and large cities
Source: Trade and Economic Cooperation Bureau, METI, “Myanmar Keizai Jyousei to Nichi-Myanmar Keizai
Kyouryoku Kankei”, 21st September 2012.
(1) Dawei
Dawei is located in the south-east area, Tanintharyi Division, which is designated as Myanmar’s first SEZ.
Thai contractor, Italian-Thai Development, has been granted the right to use the area. If Dawei is connected to
Southern Economic Corridor through Ho Chi Minh City in Vietnam, Phnom Penh in Cambodia and Bangkok in
Thailand, the corridor is expected to become a commercial artery linking Indochina to the India Ocean. The
development of Dawei has been reported recently that the development projects are behind the initial plan.
Naypyitaw
Kyaukpyu
Dawei
Thilawa
Muse
Yangon
59
Thai National Economic and Social Development Board (NESCB) recently released its projection30 (see
figure 2-47). The new cost is estimated 325 billion Thai baht up from 200 billion baht originally projected.
Figure 2-47. Projected investment cost of the Dawei project
(millions baht)
First phase
(2015)
Second phase
(2020)
Total
Total investment amount in Myanmar
(deep-water port, road link, railways, etc.)
148,700 100,000 248,700
Total investment amount in Thailand
(motorway, railways, etc.)
55,989 20,300 76,289
Total investment amount 204,689 120,300 324,989
Source: Dawei Development Company Limited, website.
(2) Kyaukpyu
Kyaukpyu is located in the western part of Myanmar, in Rakhine State. Oil and gas pipelines from Port
Kyaukpyu to Yunnan Province of China are under construction. The pipelines are to carry natural gas produced in
the coast of Rakhine State, and crude oil produced in the Middle East and Africa to China without passing
through the Straits of Malacca31. The government, under China’s initiative, has a plan to establish an SEZ in the
hinterland of the port, however, the development is said to have not progressed yet.
(3) Thilawa
Thilawa Port is located in 25 kilometers southeast of Yangon City. The government, in corporation with
Japan, has a plan to develop an SEZ in the vicinity of the port, which has an area of 2,400 hectares adjacent to
Greater Yangon.
The background and planned schedule for Thilawa SEZ development are as follows:
30 The testimony by Charnwit Amatamatuchart, deputy secretary-general of the NESDB to the House committee on economic development on 9th January 2013. 31 In China, approximately 80% of oil imports are carried passing through the straits of Malacca. This security dilemma is called “Malacca Dilemma”.
60
November 2011: Meeting between Japanese Prime Minister and Myanmar President. Meeting between
Japanese Minister of Economy, Trade and Industry and Myanmar Minister of Ministry of
National Planning and Economic Development.
January 2012: Ministerial Dialogue on Japan - Myanmar Economic and Industrial Cooperation.
April 2012: Japan - Myanmar Summit Meeting. Memorandum of Intent on the Cooperation for the
Development of the Master Plan for the Thilawa.
April 2012-: Feasibility study for investment by private companies (Mitsubishi Corporation, Marubeni
Corporation and Sumitomo Corporation). Feasibility study for infrastructure such as
electricity, water supply and sewerage systems etc. by JICA.
December 2012 Memorandum on the Cooperation for the Development of the Thilawa Special Economic
Zone.
2013-: Establishing a joint venture as a zone-developer. (planned)
Developing infrastructure for Thilawa SEZ with Japan’s ODA. (planned)
2015-: Commencement of the commercial operation at Thilawa SEZ. (planned)
61
Location of Thilawa Special Economic Zone
Source: JICA, “The Project for Development of Infrastructure for Thilawa Special Economic Zone” (in
Japanese), 27th April 2012.
Greater Yangon
Planned site of
Thilawa SEZ
62
3. Policies, laws and regulations on SOEs
3.1 Laws and regulations on SOEs
State-owned Economic Enterprises (SOEs / SEEs) are not corporate bodies established under “Corporate
Act” or “Special Corporate Act,” but they are legally part of the government. Recently, some SOEs under
Ministry of Transport started running operations independent of the government, although none of SOEs under
Ministry of Industry (MOI) have started such independent operations yet. Such SOEs under the control of the
government can be regarded as production units of the government, rather than independent companies.
The following section reviews a legal background of SOEs in general.
3.1.1 Legal background of SOEs
The legal standpoint of SOEs is the State-owned Economic Enterprises Law (The State Law and Order
Restoration Council Law No.9/89) or SEE Law. As mentioned above, SOEs are not corporate bodies under
Company Act or Special Company Act.
The SEE Law defines 12 economic activities in which private investment is restricted and reserved to be
carried out solely by the government. The 12 economic activities, which are specified in Section 3 of the law, are
as follows:
(a) Extraction of teak and sale of the same in the country and abroad;
(b) Cultivation and conservation of forest plantation with the exception of village owned firewood plantation
cultivated by the villagers for their personal use;
(c) Exploration, extraction and sale of petroleum and natural gas and production of products of the same;
(d) Exploration and extraction of pearl, jade and precious stones and export of the same;
(e) Breeding and production of fish and prawn in fisheries which have been reserved for research by the
Government;
(f) Postal and Telecommunications Service;
(g) Air Transport Service and Railway Transport Service;
(h) Banking Service and Insurance Service;
(i) Broadcasting Service and Television Service;
(j) Exploration and extraction of metals and export of the same;
(k) Electricity Generating Services other than those permitted by law to private and cooperative electricity
generating services;
(l) Manufacture of products relating to security and defense which the Government has, from time to time,
prescribed by notification.
63
Section 6 of the law mentions “Any person shall have the right to carry out any economic enterprise other
than those prescribed under Section 3 to be carried out solely by the Government.” Therefore, the areas in which
state-owned enterprises can participate are basically limited to those mentioned above.
However, Section 7 stipulates “Without prejudice to the provision of Section 6, the Government may, in
addition to those economic enterprises which are prescribed under Section 3 to be carried out solely by the
Government, also carry out any other economic enterprise if it is considered necessary in the interest of the Union
of Myanmar.” Based on this section, SOEs can run business in any areas which are not mentioned in Section 3.
SOEs under MOI produce vehicles, heavy machineries, agricultural machineries (No.(1) Heavy Industries
(Paper and Home Utilities Industry), yarns and clothes (Textile Industry), which are not included in Section 3 of
SEE Law.
SEE Law is composed of six chapters and 12 sections, as follows:
Chapter I Title and Definition (Section 1-2)
Chapter II Economic Enterprises to be carried out Solely by the Government (Section 3-5)
Chapter III Right of carrying out other Economic Enterprises (Section 6-7)
Chapter IV Right to form Organizations (Section 8-8A)
Chapter V Offences and Penalties (Section 9-10)
Chapter VI Miscellaneous(Section 11-12)
SOEs do not have to obtain business permits or company registrations issued by Ministry of National
Planning and Economic Development (MNPED) which are necessary for private companies in general32.
The legal background of the establishment of individual SOE is a notification33. Such notifications are issued
upon the approval by the cabinet34.
32 Source: Interviews with MOI (December 2012) 33 Source: Interviews with Union Attorney General's Office (November 2012) 34 Source: Interviews with MOI (December 2012)
64
3.1.2 Regulations on the organizational structures of SOEs
SEE Law does not have any sections which regulate organizational structures or management of SOEs.
Articles on organizational structure or management of Company Act do not apply to SOEs. For example,
shareholder’s meetings that are stipulated in Company Act are not organized in SOEs35. The government designs
the organization and management structure of a SOE individually based on Section 8 of SEE Law.
Section 8
(a) In order to carry out the economic enterprises mentioned in Section 3 and Section 7 ,the Government
may, by notification
(i) Constitute organizations which are to undertake responsibility and prescribe their duties and
powers;
(ii) Reconstitute, if necessary, such organizations which are in existence at the time of the
commencement of this Law, amend and prescribe their duties and powers;
(iii) Constitute one or more bodies to supervise the organizations mentioned in sub –sections (1) and (2),
if necessary, and prescribe their duties and powers.
(b) The respective organizations constituted under sub – section (a) shall be a body corporate having
perpetual succession and a common seal, and shall have the right to sue and be sued in its corporate
name.
According to MOI, the organization and management structure of a SOE in MOI is drafted by the executive
committee of MOI, submitted to Ministry of National Planning and Economic Development, and approved by
the cabinet.
When SOEs form joint ventures (JVs) with private companies or foreign investors, the JV company is
regarded as a “special company” as specified in Special Company Act (1950). The organization and management
structure of a special company is regulated by Company Act (1913), if bylaws does not separately specify. Note
that the organization and management structure of foreign companies, whose legal standpoint is Company Act,
are regulated by Company Act.
In summary, regulations on the organization and management structure are quite different from those on
private companies. Because there is no regulation which regulates the organization and management structure of
SOEs, they are designed individually by ministries in charge, based on the authorizations of the cabinet and
parliament.
35 Source: Interviews with MOI (November 2012)
65
3.1.3 Investment permits for SOEs
When companies and special companies carry out capital investment in equipment or plants, they can obtain
investment permits by Myanmar Investment Commission (MIC) to receive investment incentives. They also
need recommendations or no objection letters from ministries in charge.
Joint venture companies of SOEs and foreign investors, which are regarded as special companies, can also
receive investment incentives by obtaining investment permits by MIC. When applying for investment permits,
special companies submit application to ministries in charge, which are then sent to MIC.
SOEs, in contrast, have to obtain approval of Ministry of National Planning and Economic Development
and Ministry of Finance and Revenue, and also the approval of the parliament, when carrying out capital
investment36, while MIC is not involved in investment approval. Approvals on investments by SOEs are for the
purpose of budget allocation, and not obtaining investment incentives.
Legal backgrounds, regulations on organization, business permits and investment permits are summarized as
follows:
Figure 3-1. Summary of regulatory framework and permissions Established
based on Regulations on Organization
Business permits
Investment permits
Company (Private) - Domestic companies - Foreign companies
Company Act Company Act Necessary By MIC (not compulsory)
Special Company - JV of SOEs and domestic /
foreign investors
Special Company Act
Company Act Necessary By MIC (not compulsory)
SOEs SEE Law Notifications Not necessary
By MNPED, MOFR, Parliament (Compulsory)
3.2 Background of SOEs under Ministry of Industry
Vision of Ministry of Industry is “to produce a variety of machinery and equipment both qualitatively and
quantitatively to satisfy the needs of the industrial sector,” and this would be the purpose that MOI established
SOEs. Although mission and strategy of MOI were significantly revised in 2012, the vision itself was not revised.
The mission of MOI before 2012 is “to produce a variety of machinery & equipment both qualitatively and
quantitatively to satisfy the needs of the industrial sector,” while the mission after 2012 is “to develop an updated
36 Source: Interviews with MOI (November 2012)
66
and modernized system of agricultural-based production, services and industrial sector” and “to open up
employment opportunities for the people at small and medium enterprises.” As can be seen from the missions
before 2012 and after 2012, it can be confirmed that MOI is shifting its role as a “Player” or a producer of
industrial goods to a role as “Regulator” or “Promoter” of industrialization, which sets up industrial policies or
regulations.
Figure 3-2. Mission and Vision of MOI before 2012
Mission
- To produce a variety of machinery & equipment both qualitatively and quantitatively to satisfy the needs of
the industrial sector
Vision
- To play a vital role in transforming the nation into a new modern developed industrialized country
Strategies
- Maximize the production capacities in the existing industries
- Produce machineries, equipment, spare parts etc., for industrial and public use
- Establish new industries for utilization of natural resources & human resources
- By research & development, for the production new materials and machinery spare part as import
substitution
Objective
- Creation of technical-trained manpower around the nation
- Creation of job opportunities for youth to take up industrial employment
- Adoption of production technology and quality control techniques at factories
- Mass production of qualified machine tools for the development of the industrial sector
- Production & distribution of Tools, Die, Jig & Fixtures for the optimum production at state-owned &
private-owned factories
- Production of more value-added products utilizing the basic raw materials in the country for uplifting
social, economic and promoting green & state-of-art technologies
- Intensification of research & development activities for the establishment of competent design and to
improve innovative approach for future products
Source: Ministry of Industry homepage
67
From 1962 to 1988, the government placed emphasis on enhancing import substituting industries, especially
through SOEs, using the foreign exchange gained from exports of rice and wood (teak). The SOEs under MOI,
which are also considered to be established for this purpose, supplied products and encouraged consumption in
the domestic markets.
Note that the notifications, which were issued upon the establishment of SOEs under Ministry of Industry,
were not published. Thus, it was not possible to confirm the legal background and purposes of the establishment
of the SOEs.
SOEs under MOI recently established several factories and carried out new capital investment on equipment
in the 2000’s. For example, new production lines for vehicles designed by Chinese companies or weaving
machines were installed in state-owned factories. Such capital investments seem to have been done by the
military government during the economic sanction period in order to increase domestic production of industrial
and consumption goods to supply them in the domestic market, using loans from the Chinese government
between 2004 and 2009.
However, since 2011, trade barriers have been significantly lifted, and the import amounts increased
dramatically. Thus the social significance of SOE products which tried to substitute imported goods has been
diminishing. One of such examples is the vehicle production lines at No (12) Factory of No (1) Heavy Industries
Enterprise in Htonebo. The production line was installed in late 2000’s under the support of China, to produce
vehicles designed by a Chinese car producer. However, after it started vehicle production, regulations on the import
of foreign cars were lifted in 2010 and 2011, and the number of imported second-hand cars significantly increased
since then. The cars produced by the state-owned factories then faced fierce competitions with imported used cars.
Currently, the government priority seems to be a promotion of the private sector, rather than enhancing
import substituting industries, as the President, U Thein Sein, made remarks in his speech in March 2012.
Accordingly, the mission of MOI was revised in the same directions.
Figure 3-3. Mission and Vision of MOI after 2012
Mission
- To make utmost efforts for the development of an updated and modernized system of agricultural-based
production, services and industrial sector with increased momentum as a National Task
- To open up employment opportunities for the people by giving priority to the implementation of small and
medium industrial enterprises and proceeding from that stage to the setting up and expansion of heavy
industries.
Vision
- To play a vital role in transforming the nation into a new modern developed industrialized country
68
3.3 Organization structure of SOEs under Ministry of Industry
This section explains relationships between SOEs and MOI from the viewpoints of business management,
decision making and personnel management.
3.3.1 The organizational relationship among MOI, SOE and state-owned factories
As mentioned above, SOEs are regarded as part of the government. There are six SOEs under MOI,
together with another six directorates. Six SOEs are No. (1) Heavy Industries Enterprise, No. (2) Heavy
Industries Enterprise, No. (3) Heavy Industries Enterprise, Pharmaceutical and Foodstuff Industry, Paper and
Home Utility Industries, and Textile Industry, while six directors are Directorate of Industry, Directorate of
Industrial Planning, Directorate of Industrial Supervision and Inspection, Central Research and Development
Center, Small and Medium Enterprises Development Center, and Minister Office.
SOEs under MOI are apparently part of the government, and their management is not independent of the
government. As can be seen from the organization chart below, status of the SOEs is the same as other
directorates.
Managerial decisions in MOI are basically made by the executive committee, which consists of the Minister
of Industry as chairman, and two deputy ministers, five directors general of directorates, the director of Minister
Office, and six managing directors of SOEs37.
Executive committee makes decisions of MOI as a whole and also managerial and operational decisions of
SOEs, including procurement, monthly productions, personnel management, and personnel promotions38.
Decision making process at MOI is as follows:
i) Directors general of directorate and managing directors of SOEs send proposals to Minister Office.
ii) Proposals sent to Minister Office are checked by the minister. The minister then gives instructions to
directors general and managing directors to submit the proposals to executive committee for approval.
iii) The executive committee (organized once a week) approves on the proposals.
Approvals are made in the name of the executive committee, and not by the minister. However, it is
estimated that most of the decisions are made by the minister himself in the executive committee.
As can be seen from above, the management of the SOEs is not independent of the ministry. Suppose MOI
is a company, executive committee of MOI is regarded as a board of management that makes managerial
decisions. SOEs can be regarded as production units of the company.
37 A managing director of a SOE is same level with a director general of a directorate. MDs do not have any authorities to make managerial decisions. 38 Source: Interviews with MOI (December 2012)
69
Figure 3-4. Organization chart of MOI
- Chairman: Minister of Industry- Members: Deputy ministers (2),
Directors General of directorates,Director of Minister Office,Managing Director of SOEs (12 intotal)
- Head: Director
Textile Industry
Directrate of IndustryNo.(1) Heavy Industries
Enterprise
Directrate of Industiral PlanningNo.(2) Heavy Industries
Enterprise
Directrate of IndustrialSupervision and Inspection
No.(3) Heavy IndustriesEnterprise
Paper and Home Utility IndustriesSmall and Medium Enterprises
Development Center
Central Research andDevelopment Center
Pharmaceutical and FoodstaffIndustry
Ministyof Industry
Executive Committee
Ministry of Industry (U Aye Myint)Minister Office
Deputy Ministers(U Thein Aung, U Myo Aung)
Source: MOI homepage and the study team
Division of responsibilities among MOI, SOEs, and state-owned factories are as follows:
Figure 3-5. Divisions of responsibilities among MOI, SOEs, and state-owned factories
Organization Decision maker Responsible for
Ministry of Industry Minister
Executive committee
Business management as a whole
State-owned Enterprises Managing Director Daily operations of SOEs
State-owned Factories General Manager Production
management(execution of
production plans)
70
The executive committee makes decisions on a wide range of SOEs’ operations, including procurement of
goods and selling products based on its management policies.
Headquarters of SOEs, located in MOI buildings in Naypyitaw, carry out daily operations, including
financial management and monitoring. As managerial decisions are made by the executive committee, SOEs
carry out the daily operations according to the decisions made by the committee.
Factories under SOEs are responsible for productions and are not responsible for financial management,
while the headquarters of the SOEs provides instructions on production at factories. Factories do not undertake
any marketing activities, as they are under the responsibility of the headquarters.
The cabinet is sometimes involved in making important decisions of SOEs, such as budget allocations to
SOEs, capital investments, and disposal of state assets. Auditor’s General Office is also involved in the
management of SOEs and conducts periodical on-site audits.
Figure 3-6. Managerial structure of SOEs under MOI
Ministry of Industry- Minister(U Aye Myint)- Deputy Minister(U Thein Aung, U Myo Aung)
->
>
Report on Execution Supervision, Nomination, removal, remuneration deicision
- Manufacturing section- Authoriy:Execution of decisions
by executive commitee of MOI- Back-office
(planning/procurement, general affaires, accounting)
- Regular meeting: business communication meeting (biweekly), GM meeting (every quarter)
-
Director's regular meeting: once a month, Extraordinary
Divisions: planning / procurement, general affaires, accounting)
Authority: achievement of production plan, budget use
Managing Director
Deputy Managing Director (2 directors)
Executive CommitteeComposed of the minister, two deputy ministers, three DGs of directorates, six MDs of SOEs. Held every Thursday morning.Make decisions in accordance with the execution, nomination of director, supervision of duties, and budget allocation
Directors: Engineer, accounting, planning, sales etc. 5-6 persons)
Auidt: Carried out once a year, six month from the end of the financial period of SOEs.
71
3.3.2. The personnel management among MOI, SOE and state-owned factories
MOI, SOEs, and factories have close relationships in personnel management as well. For example,
personnel are transferred among factories, SOE headquarters, and directorates in MOI.
Managing Directors of SOEs are assigned by the executive committee of MOI. Only the MOI officials are
qualified to be managing directors of SOEs. In addition, all managing staffs of SOEs under MOI are MOI
officials at the moment39.
Staffs of SOEs, including staffs at factories, are all government staffs, to whom the regulations on personnel
determined by Union Civil Service Board40 are applied. Their salary levels are determined based on the salary
table, which is applied to the government staffs in all ministries41.
When recruiting new employees at SOEs and factories, ministries have to obtain approval by Public Service
Center42. Ministries cannot dismiss employees, no matter if there are excessive employees. When ministries wish
to reduce the number of employees, ministries ask them if they would like to leave the government or not, as
employees have rights to determine if they stay or leave43.
3.3.3 Transformation of SOEs to Corporation Units
Recently, several SOEs under Ministry of Transport have changed to “corporation units”. Such SOEs are (i)
Myanmar Airways (ii) Inland Water Transport (iii) Myanma Shipyard, and (iv) Myanma Port Authority44.
Civilian managers join them as management staffs to achieve efficient business operations of these SOEs45.
Corporation units are still legally regarded as SOEs, and they are corporate bodies established based on
neither Company Act nor Special Company Act. The legal standpoint of corporation units is Section 8A of SEE
Law amended in March 1997, which ensures business operations by funds or employees46. Therefore,
transformation of SOEs to corporations units does not mean that SOEs are corporatized, but that SOEs become
independent of state budgets47. Corporation units will not have any state budget allocations.
Corporation units can increase the amount of employee salary and pay bonuses, although they cannot reduce
the salary amounts or dismiss employees48. In addition, they can borrow bank loans, as stipulated in the budget
39 Source: Interviews with MOI (November 2012) 40 Source: Interviews with MOI (November 2012) 41 Source: Interviews with No. (1) Heavy Industry Enterprise (November 2012) 42 Source: Interviews with No. (1) Heavy Industry Enterprise (November 2012) 43 Source: Interviews with No. (1) Heavy Industry Enterprise (November 2012) 44 Source: Interviews with Privatization Commission (November 2012) and Union Attorney General's Office (November 2012) Related notifications were not available. 45 Source: Interviews with Privatization Commission (November 2012) 46 In the interviews, government officials call this as “Corporatization”. However, they are still SOEs, and they are not corporate bodies based on Corporate Act. Therefore, such SOEs should be called as “Corporate units”, to differentiate from “Corporatization”. 47 Source: Interviews with Union Attorney General's Office (November 2012) 48 Source: Interviews with Union Attorney General's Office (November 2012)
72
law for FY 2012-1349.
The box below shows the organizational structure of the companies established based on Company Act, so
that it can be compared with the organizational structure of SOEs. When compared, the functions of the executive
committee of MOI are quite similar to those of a board of directors of companies. Beside this, any similarities
between the organizational structures of SOEs and companies cannot be found.
Organizational structure based on Company Act
Companies established based on Company Act have to set up a managerial organization. JVs of private
companies and SOE, which are regarded as special companies, also have to setup such a managerial
organization following Company Act, as specified in Section 3 of Special Company Act.
Shareholders' meeting- Authority:approval of corporate strategy and investment plan, nomination of board members and auditors, decision of remuneration etc.- Period:Once a year, within 15 months after previous meeting- Extraordinary meeting:it was held according to the request from the Board of Directors with a one-tenth or more of the outstanding shares- Ordinary resolution:Majority of the number of shares present- Special resolution:Change of business purpose, Transfer of business, Merger, Consigned management, Dismissal of directors while in office.
Resolution of more than three-quarters of the shareholders present and Registration- Shareholder's proposal rights: no provisions
Report on business Nomination, Removal, Remuneration decision etc.
Executive Board Auditor- Composed of more than three board members - External auditors or Internal auditors
Responsibility is for the shareholders' meeting - Authority:Accounting audit (not business audit)Each investor appoints executive in accordance with shares and
executives are nominated by the shareholders' meeting (JV case)
- Authority:Execution of resolutions、decision of business plan and investment Audit- Manager (Board member as an executive manager)
- Managing Director:not required, but normally set up
Managing Agent- This system is introduced in privatized companies and investment companies
- Responsibility is for the executive board
- Authority:Head of the product management,
Execution of corporate resolutions, business plan and investment project
- Term of consigned management:up to 20 years
(Note) A joint venture company with state-owned enterprises and foreign-invested enterprises is established under the special corporation act.
Provisions regarding organization and operation under the act comply with the Corporate Law (The Special Corporation Law, Article 3).
On the other hand, there is no provision regarding managerial structure and operation of SOEs
The managerial structure of SOEs is determined by the notice of the Government under The State-owned Economic Enterprises Law, Article 8 A (a)
(Director General U Kyaw San, Ministry of Justice, explained in an interview on November 09, 2012)
(Source) Related laws and regulations and on-site interview (e.g. MOI, MOJ) by the study team (November, 2012)
Report on Execution Nomination, Removal, Remuneration decision etc.
Supervision of Execution Nomination, Removal, Remuneration decision etc.
However, there is no provision regarding the managerial structure and operation in the State-owned Economic Enterprises Law and it is understood that the structure and operation of SOEs does not comply with the Corporate Law.
49 Source: Interviews with Privatization Commission (November 2012)
73
3.4 Financial relationship between SOEs and the government
3.4.1 Financial relationship between state account, state budget and SOEs
3.4.1.1 Overview of the state fund account system until FY 2011-12
Until FY 2011-12, payments and receipts of SOEs are made through State Fund Account (SFA). This means
that SOEs cannot make payments or receipts independently.
SOEs received budget allocations for production costs, and make payments for such production cost from
SFA50. SOEs cannot use the budget allocated for other purposes than paying production costs. Similarly,
receipts on sales of SOEs were deposited into SFA, and SOEs could not withdraw the receipts51.
Eventually, SOEs are allowed to only manufacture products based on the budget allocated and they did not
have any responsibility for their losses or profits.
Cash transactions (repayments and receipts) of a SOE were made through a “drawing account” and “deposit
account” in Myanmar Economic Bank (MEB). Because the drawing limit is set for the drawing accounts, SOEs
cannot withdraw cash from their account more than their budget allocations. At the same time, SOEs cannot
withdraw cash from deposit accounts, into which receipts on sales were deposited. The receipts were then
transferred to SFA52.
The gap between the payment by a SOE to SFA and the receipt by a SOE from SFA can be roughly
estimated as a gross profit of the SOE. This is because the receipts by a SOE from SFA are for the production
costs of a SOE, and the SOE pays the sales receipt to SFA.
Figure 3-7. Receipt from SFA and Payment to SFA by SOEs in MOI
2004-05 2005-06 2006-07 2007-08 2008-09 2009-10
Receipt from SFA 137,426 177,380 284,601 333,483 388,286 359,070
Payment to SFA 139,468 168,550 274,229 334,289 380,722 368,754
Source: Statistical Yearbook 2010, Ministry of National Planning and Economic Development
In FY 2009-10, the receipt from SFA by SOEs in MOI was 368,754 million kyats, and this was paid for the
production costs and salaries of SOEs in MOI. The payment by SOEs to SFA is 359,070 million kyats in the
same fiscal year, and this is the receipts of sales of SOEs.
The table above shows that SOEs in MOI made a profit in FY 2008-09, as the receipts exceeded payments,
but made a loss in FY2009-10.
50 Upon budget formulation, SOEs submit their production plan in March, which are approved and executed from April in the same year. 51 Source: Interviews with MOI (December 2012) 52 Source: Interviews with Ministry of Finance and Revenue (December 2012)
74
Losses of SOEs in MOI are estimated to increase after FY2012-13. This is due to the fact that the “dual
exchange rate”, which ensured implicit subsidies to SOEs, was abolished in March 2012. For example, a vehicle
factory, which imports parts and materials, pays the cost in foreign currency (US Dollar). The costs denominated
in US Dollar were converted to the domestic currency at the exchange rate of 5.45 kyats per US Dollar, whose
actual exchange rate was 842 kyats per dollar (as of January 2013). Therefore, because of the abolishment of the
dual exchange rate, the import costs are converted by the actual exchange rate, and then the total production costs
would significantly increase.
3.4.1.2 New account system from FY 2012-13
The SFA system was significantly revised from FY 2012-13, which was then divided into Union Fund
Account and Other Account.
From Union Fund Account, which is similar to SFA, payments for salaries, pensions, maintenance costs,
some production costs, loan repayments, and interest are made. Such costs are fully covered by the state budget.
From Other account, production costs, such as fuel cost and material cost are paid. At the same time, receipts on
sales are deposited into Other Account.
Under the new account system, 22% of the material cost and fuel cost were covered by the state budgets, while
remaining 78% is covered by the receipts on sales. This system was adopted to make profits and losses of SOEs
clearer, so that SOE bear responsibility for their profitability.
When cash to be paid from Other Account is not enough, SOEs borrow bank loans from Myanmar
Economic Bank with a 4% interest rate per year. There are not any SOEs which actually borrowed loans from
Myanmar Economic Bank as of December 2012.
Loans to SOEs are paid upon requests of SOEs from the state trust fund at Myanmar Economic bank, and
the bank does not bear any credit risks (credit risks are covered by the government). The bank does not carry out
any credit appraisals.
Unlike production cost, capital investments on equipments are fully financed by the state budget, and SOEs
and line ministries are not authorized to carry out investment at their own discretions. When SOEs wish to invest,
they send a budget proposal to Ministry of Finance and Revenue through its supervising ministries. The proposed
budgets, which are assessed by Ministry of Finance and Revenue, might be reduced or sometimes rejected by the
ministry.
Note that the budget allocations, whose processes are based on Budget Law, are finally approved by the
parliament53.
53 Source: Interviews with MOI (November 2012)
75
3.4.1.3 Taxations on SOEs
SOEs are supposed to pay a part of the sales to Ministry of Finance and Revenue as commercial tax.
Commercial tax rate, which varied among sales items, has been revised to 5% for all items since April 201254.
SOEs also pay 25% of their profits to Ministry of Finance and Revenue as income tax. The income tax rates
of SOEs are the same as the one for domestic corporate bodies established under Company Act and Special
Company Act.
The remaining profits were paid to the government as government contributions, and thus all the profits
made by SOEs were transferred to the state accounts. However, SOEs can keep the 55% of profits as retained
earnings from April 2012. SOEs use retained earnings for salary payments, pensions and production costs55.
54 JETRO homepage (http://www.jetro.go.jp/world/asia/mm/invest_04/) 55 Source: Interviews with Pharmaceutical Industry (November 2012) and Ministry of Finance and Revenue (December 2012)
76
4. Progress of Privatization of SOEs
4.1 Policy framework of Privatization
4.1.1 Policies on privatization
Until a few years ago, most privatization cases were sales of state assets, of cinemas and factories, for
instance. The government is now focusing on (i) joint venturing, (ii) leasing, and (iii) corporatization, to avoid
sales of state assets56. The president also mentioned that privatization does not mean sales of government
businesses.
Figure 4-1. Extract from the president’s speech in June 2012
We need to stop budget deficit as it hurts the national economy and beget ill consequences in the long-run. In
doing so, our expenditures must be effective for the programs beneficial to the nation and the people.
In addition we must trim down uneconomical and redundant enterprises and cut expenses, while shrinking the
State-owned business sector and encouraging privatization. Here, privatization covered by the second phase of
reform strategy doesn't mean a big sell-off of government-run businesses. First we will make an assessment of
the communication, electricity, energy, forestry, education, health and financial sectors where the ratio of
government ownership is large.
Then we will increase the ratio of private ownership in these sectors as per the international rules and practices
followed by the government encouragement for efficiency promotion. Accordingly, we will form a new
Privatization Commission with Vice-President at the helm for a change of methods in reassessing, reviewing
and reforming Union ministry-wise scope of operations and ownership ratio.
Source: President Office Homepage
The speech mentioned also that new Privatization Commission is formulated, which is responsible for a
more efficient and systematic privatization process. According to Privatization Commission, the criteria for
candidate SOEs for JV and lease are (i) inefficient business operations (e.g. equipments are old), and (ii) making
big losses.
One of the priority issues of the government in JV and lease is transferring factory employees to privates.
The study confirmed that the government sets strict conditions on this, and the private side has to take over all
factory employees upon forming a JV or leasing. This condition does not seem to be negotiable, according to the
government and private sector.
Upon forming a JV or starting a lease, factory employees, who are taken over by the private side, can choose
their own status. Some employees choose to leave the government and become private sector company
56 Source: Interviews with Privatization Commission (November 2012)
77
employees. In this case, they can receive government pensions, and receive private based salaries, which might
be higher salaries than the government standard. Others choose to remain as government staffs and keep working
at a factory. In this case, their salary levels are determined by the government salary table, but salaries are paid by
the private. Because they are government staffs, it is not possible for the private enterprise to reduce salaries or
dismiss them.
When state assets including factories were sold to private investors in the past, employees were not basically
transferred to the private, but to other government projects. One of the reasons why the government emphasizes
JV and lease at the moment would be that the government is not active in starting new projects and wishes to
reduce personnel costs by transferring employees to private companies through JV and lease.
4.1.2 Official process of JV, lease and asset sales
There are not any written official processes to determine which state assets (including factories) to be
privatized and also how to privatize them (e.g. JV, lease or sales). They are basically determined by the initiatives
of line ministries. The official processes for JV and lease, whose information was collected from interviews, are
explained in the following sections. Sales of state assets are not the government priority, as mentioned above.
4.1.2.1 JV
When forming a JV between the government and private investors, approvals by MIC is necessary. If the
business area of JV is natural resources, the proposal on JV is made through line ministries to MIC. If the area is
not natural resources, the process is simpler, and the JV companies send the proposal directly to MIC. In each
case, Privatization Commission is not involved in the process. MIC assesses the proposal from a technical
viewpoint and feasibility before issuing a permit to invest57.
When forming a JV, the government uses state assets to makes its contributions in kind. The valuations of
the state assets are carried out by line ministries in charge.
The government basically does not provide state budgets to JV for financial supports. However, a JV
company, whose shares are owned by MOI, might be able to access the credits of SME Development Bank, a
private bank whose chairman is Minister of Industry.
SME Development Bank started a loan program with a lower interest rate in 2012, and JV companies are
eligible for this program. However, as of December 2012, there are no JV companies which actually borrowed
bank loans from SME Development Bank. The loans from SME Development Bank cannot be more than 50
million kyats, which would not be sufficient for large-scale capital investments.
57 Source: Interviews with MIC (December 2012)
78
4.1.2.2 Lease
Official approval on lease contracts of state assets is done by a line ministry in charge. They do not have to
go through approvals of MIC or Privatization Commission.
When leasing, a notice for bidding on a lease of a state asset is announced on newspapers in general. No
matter if there was only one bidder who submitted the proposal, the government can award it as the lowest bidder.
Lease prices are determined based on (i) personnel expenses of employees including contributions to
pension funds, (ii) depreciation amounts of the state assets, and (iii) estimated profits. (i) Personnel expenses and
(ii) depreciation amount cannot be negotiated with the government, while (iii) estimated profits are discussed
between the lessee and the government58. The lease fee level is determined and authorized by the line ministry.
Either MIC or Privatization Commission is not involved in deciding the lease fee level.
For both JV and lease contract which use state assets, JV companies and lessees would not be allowed to
change their business59 (e.g. from beverage production to vehicle production), while it is possible to change the
products in the same business (e.g. from fruit juice to energy drink). The approval of MIC would be necessary to
change business in case of JV, while the approval of a line ministry is necessary in case of lease contracts. If
profitability of the business is improved by changing the business, the government would try to raise the lease
fees, as the lease fees are determined based on profitability. Please note that JV or lease contracts do not seem
clearly state that JV company and lessee cannot change their business. It might be also possible to change
business to a certain extent through negotiations with the government.
4.1.2.3 Sales of state assets
When selling state assets, a line ministry first makes a notification to Privatization Commission, which will
be responsible for sales of state assets. Bidding, which is carried out by Privatization Commission, is compulsory
when selling state assets. Valuation of the state asset is done by Valuation Committee under Privatization
Commission60. MIC is not involved in the process of selling state assets.
Under Privatization Commission, there are two committees, namely Valuation Committee and Land
Analysis Committee. Members of both committees are from 10 governmental agencies including Ministry of
Agriculture, Ministry of Industry, Union Attorney General's Office, Ministry of Finance and Revenue, Ministry of
Interior, Yangon City Development Committee, and Mandalay City Development Committee.
58 Source: Interviews with Pharmaceutical and Foodstuff Industry (December 2012) 59 Source: Interviews with Pharmaceutical and Foodstuff Industry (December 2012) 60 Source: Interview with MOI (December 2012)
79
Figure 4-2. Summary of JV, lease and sales of state assets
Approval Valuation / lease fee Financial supports by the
government
JV MIC Line ministry Possible
Lease Line ministry Line ministry Not possible
Sale Privatization commission Privatization commission
(Valuation Committee)
Not possible
4.1.3 Issues in JV, lease and sales of state assets
4.1.3.1 JV
Possibility of government interventions on JV management
When a foreign company forms a JV with a SOE, the JV is regarded as a corporation body based on Special
Company Act. However, Section 4, 5, 6 and 9 might potentially allow the government to intervene the substances
of JV companies61.
Because of this, legal predictabilities are low for foreign companies; thus, they might be reluctant to form a
JV with SOEs.
Issues in the new Foreign Investment Law
Chapter 13 of the new Foreign Investment Law (2012) mentions “Assurance and Guarantee”, which
ensures that the government does not nationalize economic activities formed with the approval during the
contract period (Section 28) and that the government gives assurance and guarantee for the investment amount in
the type of foreign currency.
However, foreign investors are concerned if these sections are legally backed up, because conflict resolution
measures between companies are not legally sufficient. Actually, foreign companies tend to request MIC or
Ministry of Commerce for conciliations and mediations for conflict resolutions, although they are not legally
authorized for conciliations and mediations.
61 The government has a right to determine the names of special companies by notifications. It can also assign the initial members of companies.
80
4.1.3.2 Lease
Insufficient legal background for lease
Until now, any preceding cases have not seen in which SOEs leased state assets to foreign companies, and it
is not sure if leasing of state assets to foreign companies is legally possible or not.
It is possible for a foreign company to have a lease contract on land up to 5,000 acres for 10 to 30 years (can
be extended up to 50 years)62. However, at the same time, Transfer of Immovable Property Restriction Law 1987
mentions that a lease period of land cannot be longer than 1 year.
Therefore, it would be necessary to establish laws and regulations on land lease, in order to enhance legal
predictability for foreign investors.
4.1.3.3 Sales of state assets
Insufficient legal background on land
Even if foreign companies can obtain land usage rights through leases, they might not be able transfer them
after the termination of business operations, as mentioned in Section 4 of Transfer of Immovable Property
Restriction Law (1987).
Other issues in land lie in the valuation of land use right. Because there are not any clear rules on valuations
of state assets, private investors might face difficulties in transferring the assets.
62 JETRO homepage
81
4.2 Examples of Privatization (including examination of relationships between the government and
privatized SOEs)
4.2.1 Examples of Privatization
4.2.1.1 Example 1:Lease of a textile factory
Summary of Lease agreement and background of negotiation
- Use two textile factories under lease contracts with the government concluded in September 2011.
- Lease contract was concluded through direct negotiation, without any bidding process.
- Lease fee was determined through negotiations at the level that the lessee can make sufficient profits
- Factory employees were transferred to the lessee.
Business activity after contract
- The company carries out commissioned production or CMP (cut, manufacturing and packaging) of
garments for men, women and children based on contracts with Japanese companies and Korea
companies.
Status of factory employees
- The company took over all employees (850 persons) who worked in the factory as a precondition to the
lease agreement. The employment status of 650 persons was changed from government officials to its own
employees and the government paid pensions. The status of remaining 200 persons is still government
officials but the company pays them salaries. Additionally, the company make deposits to pension funds
for them based on a government standard
- Skills of workers are at a sufficient level. However, the employees are rather old (over 40 years old) and
work efficiency is not high.
Financial support by the government
- The government did not make any offers on financial supports, including bank loans from state-owned
banks with lower interest rates.
Others
- Under the lease contract, it does not seem to be allowed to change the business activities from the textile
industry to other industries (e.g. automotive business). On the other hand, it is possible to change the
business activity from sewing to making fabrics within the textile industry. However, there might be room
to negotiate with the government about changing the business in cases where it is impossible to continue
textile business in the future.
82
4.2.1.2 Example 2: JV on an industrial alcohol factory
Summary of JV agreement and background of negotiation
- The company is a JV of a private company and the government established in 2011 for producing
industrial alcohol.
- Capital of JV is 6 billion kyats. The government holds 70% of shares and the private company holds 30%.
Business activity after contract
- The factory was originally established by MOI in 1987. The government (MOI) made contributions in
kind such as buildings, machines and land-use-right. A shareholder of shares of the government is not
Ministry of Finance and Revenue, but Ministry of Industry.
- Contribution by the private investor was made in cash, which was used for equipment investment (e.g.
chaff boiler) and working capital. The old gas-fired boilers in the factory were replaced because of a surge
in natural gas price due to the unification of the exchange rate.
- The factory produces industrial alcohol (ethanol), which was distributed to the market, but currently is sold
only to the private shareholders.
- The board of directors is composed of 7 directors, and Dr. Cho Win Maw, Managing Director of
Pharmaceutical and Foodstuff Industry, is the chairman. Four out of seven directors are officials of
Pharmaceutical and Foodstuff Industry. They do not receive any remuneration for their part-time work as
board members.
- The managing director of the JV company is the private investor. Pharmaceutical and Foodstuff Industry is
not involved in factory operations.
Status of factory employees
- The number of employees is 139. Previously, employees were government staffs but every employee now
has moved to a direct contract with the JV company. The company does not have the right to decrease their
remuneration. The government pays pensions to them upon transfer.
Financial support by the government
- The JV company cannot provide assets as collaterals because they assets are state-owned.
- It might be possible to get a loan with a low interest rate from SME Development Bank if Ministry or
Industry writes a recommendation to the bank.
Others
- Shares of the government (4.2 billion kyats, which is worth 70 % of capital) were evaluated by Valuation
Commission which was under the umbrella of the former Privatization Commission in 2011.
83
- Privatization Commission will not engage in asset valuation, after the formation of a new commission in
2012. (The commission is involved in valuation of asset sales only.)
- Ministry of Industry receives dividends from the company in the case of surplus, but director from MOI do
not receive dividends. Dividends are not returned to Ministry of Finance and Revenue and the national
treasury, but are incorporated into the budget of Ministry of Industry.
- Since the price of land is rising, equity of the government become large when contributing in kind.
Therefore, it has become difficult to organize JVs.
- The company has built factories in rural areas / distant places so far and has invested in infrastructures (e.g.
power distribution, roads, and gas pipelines). Because company's assets include these investments, equity
of the government becomes too large.
- The book value after depreciation is used in evaluation upon the contribution in kind by government.
4.2.1.3 Example 3: Lease of a beverage factory (in 1995)
Summary of Lease agreement and background of negotiation
- This company entered into a lease agreement with the government on two factories in Yangon and one
factory in Mandalay in 1995 and started producing soft drinks.
- The lease period is 20 years. The lease fee, which was set rather low, has not been revised since the
beginning of the lease agreement.
Business activity after contract
- In addition to the factories on lease, the company also built factories with its own funds to expand its
production capacity and product lines.
Status of factory employees
- The company took over all employees from the government at the beginning of the lease contract. Every
employee has a direct contract with the company and currently none of them has a status as government
staff.
Financial support by the government
- Equipments were replaced at the inception of the lease, under the state budget in 1995. Such equipments
were also included in the lease contract.
84
- Financial support by the government has not been provided except in this case and the company
self-financed other equipment.
Others
- The company bought the factory in Mandalay for 50 billion kyats from the government in 2009. The
company is also negotiating with the government remaining two factories as well. Privatization
Commission is the counterpart, and Ministry of Industry is not involved in this negotiation.
4.2.2 Examination of relationships between the government and privatized SOEs
4.2.2.1 Financial relationships between the government and privatized SOEs
When SOEs or state-owned factories are privatized through JVs and leases, they are clearly separated from
the state budget. Thus, the state budget is not allocated to these privatized SOEs to cover production costs or
personnel costs. When state-owned factories are transferred to the private sector through JV or lease contracts,
government staffs are taken over by the JV company or the lessee (private), who pay their salaries. The
government is not going to allocate any state budget for them.
In a lease contract started in 1995, the government carried out capital investments on equipments which
were then leased to a private lessee in order to reduce financial burdens of investments by the private lessee.
There are no other recent examples like this case, where the government provides financial support for capital
investments.
JV companies or lessees cannot basically receive any financial support from the government, including
loans from state-owned banks with favorable terms. Although JV companies might be able to obtain loans at a
lower interest rate from SME Development Bank (a private bank with a strong tie with MOI), the amount of
bank loans provided by SME Development Bank is not big enough to cover large-sized capital investments. At
the same time, JV companies might have difficulties in accessing bank loans, as the state assets that the
government uses as contributions in kind are still regarded as state assets and cannot be used as collateral63.
Private lessees can also be candidates for users of the favorable loans of SME Development Bank. However,
it is not clear if MOI can write recommendation letters for them. Private lessees would not be able to use assets
for collateral, as they are state assets.
63 Source: Interviews with Pharmaceutical and Foodstuff Industry (December 2012)
85
Overview of the low interest loan program of SME Development Bank
<Loan conditions>
- Interest rate: 8.5% (Market rate is 13%)
- Loan duration: 3 years
- Maximum loan amount per borrower: 50 million kyats
- Purpose of loans: Capital investment on equipments and export
<Application and appraisal process>
- Applicants submit applications to SME Service Center of MOI
- When applied, SME Service Center review the overviews and business operations of the applicants.
SME Service Center also carries out a factory review on site.
- After the review, the center issues “Letter of recommendation64” to SME Development Bank.
- SME Development Bank reviews the asset value of land and buildings for collateral in two weeks
(loan amounts are up to 30% of the asset value).
- Six months after the disbursement, SME Service Center examines the status of equipments or
factories, to which loans were used.
<Others>
- SME Service Center received more than 200 applications since the loan program started in
December 2012. 3% of the 200 applicants received loans, 7 % is under the screening process (as of January
2013), and 90% were rejected. Main reasons for the rejections are a lack of assets for collateral.
- SME Service Center has not received any applications from JV companies (as of January 2013). JV
companies are also eligible for loans of SME Development Bank.
Source: Interview with SME Service Center of MOI
64 The center mentioned that they issued “Guarantee Certification”, but it was confirmed that the center or MOI does not guarantee bank loans. This can be regarded as a recommendation letter.
86
4.2.2.2 Managerial and personnel relationship between privatized SOEs and the government
In JV companies, officials of SOEs participate in the board of management as board members. However,
business operations of the JV companies are mostly conducted by the private sector management staffs. Board
members from SOEs only monitor financial status.
In the case of a lease, SOEs do not send any SOE officials as board members to the lessee, and business
operations of the lessee are fully independent of the government.
Factory employees who are regarded as government employees are basically transferred to JV companies or
private lessees. One of the government priorities in concluding JV or lease contracts is transferring all factory
employees, and it does not seem possible for private investors to negotiate the number of factory employees to be
transferred. This is because the government is trying to reduce its budget deficit by reducing personnel expenses.
When transferred to a JV company or private lessee, factory employees can choose their status from the
following options:
i) Work at the factory as government staffs, receiving a salary on the government basis (salaries are paid
by JV companies or private lessees).
ii) Leave the government and become the private sector factory staff, receiving a private based salary and
government pensions.
iii) Move to other government agencies.
If a factory employee chooses to maintain the government staff status as i), he / she does not lose a job, and
the salary level is not decreased. However, most of the factory staffs choose to become ii) private factory staffs.
Factory staffs that choose to move to other government agencies are not common.
87
5. Business Conditions and Issues of State-owned Economic Enterprises
5.1 State-owned Economic Enterprises (SOEs) under Ministry of Industry and Selected SOEs for
Research
Ministry of Industry (MOI) has the following 6 enterprises: Heavy Industries (1), Heavy Industries (2),
Heavy Industries (3), Pharmaceutical and Foodstuff, Textile, and Paper and Home Utilities. Each enterprise
manufactures the following main products:
Heavy Industries (1): Cars, trucks, SUVs, construction equipment, agricultural equipment, diesel engines,
etc.
Heavy Industries (2): Tyres, machine tools, cables, LEDs, turbines, generators, etc.
Heavy Industries (3): Cement, fire clay brick, ceramic tableware, glass, mirrors, etc.
Pharmaceutical and Foodstuff: Medicines, vaccines, health materials, syringes, purified drinking water,
plastic, etc.
Textile: Yarn, fabric, garment, knitting
Paper and Home Utilities: Cultural paper, newsprint paper, cardboard paper, hydrogen peroxide, bicycles,
stainless steel furniture, sewing machines, footwear, etc.
Moreover, there are 54 factories in total under the 6 enterprises as of November 2012 (24 factories for heavy
industries and 30 factories for light industries). See the table in the next page. Of which, through consultation with
MOI, we selected 10 factories and conducted research (See the table below).
Figure 5-1. Selected SOE Factories for Research Enterprise Factory Region
5.2 Business Conditions and Issues of Selected State-owned Economic Enterprises
We visited selected SOEs (10 factories) in November and December 2012 and conducted interviews and
factory tours. Our observation of the 10 factories is summarized in the table below and details by factory are
described afterword.
Figure 5-4. Summary of Observations of Selected SOE Factories for Research
OperatingProfit (usingMarket FX
Rate)
Competition, Cost,Demand
Equipment /Facility
OperatingProfit
Factor
#12 Vehicles &Components
(Htonebo)Outdated
#14 DieselEngines
(Thargaya)New
#16 AgriculturalEquipment
(Sinde)Outdated
Heavy (2)#22 Radial Tyres
(Belin)New
#31 Cement(Thayet)
#32 Cement(Kyangin)
#33 Cement(Kyaukse)
RelativelyNew
Possibleto turnLoss
Provision of cheapinland natural gas isexpected to beterminated in next FY
Pharmaceutical &Foodstuff
#1Pharmaceutical
(Yangon)
* Fierce competition withimports, but brandrecognition is high* Expensive importedraw material cost* Flat demand
Increase in imported rawmaterial cost due to theabolition of official FXrate
#1 Textile(Shwedaung)
#3 Textile(Sagaing)
Loss
Textile
Enterprise Factory
Heavy (1)
* Lack price/productcompetitivenesscompared to cheapimports* Expensive importedraw material cost* Low demand
Loss
Profit
* Low demand* Increase in cost
Outdated
Forecast
* Lack price/productcompetitivenesscompared to cheapimports
FY 2011-2012
Loss
* Low demand* Increase in importedraw material cost due tothe abolition of official FXrateLoss
Heavy (3)
* Fierce competition withimported & domesticproducts* Low quality, but highdemand in the North* Increase in demand* Kyaukse has locationadvantage and can usealternative fuel
OutdatedSteep rise in fuel costcaused by depletion ofinland natural gas
Industries covered by MOI are not necessarily considered public enough for the government to exclusively
operate businesses in the concerned industries (See Table in the next page), and market share of private sector
companies in such industries is already high. However, not only from perspectives of national and social security,
but also from perspectives of leading strengthening / accumulation of domestic technology and fostering
domestic production, there could be occasions where the government decides to keep some factories as SOE
factories if the government considers they belong to important industries with respect to policy.
93
Figure 5-5. Current Situation of SOE Privatization in Myanmar
Profitability
Public Nature
High
Pharmaceutical
Railways(Privatization of particular line
failed. Measures are beingconsidered)
Water Traffic /ContainerShipping(C→E?)
Airlines(C→E?)
(Private playersalready exist)
Low
Manufacturing Industries Coveredby SOE Factories for This
Research(Privatize, JV or Close)
Other Profitable Manufacturing / Services(Privatize or JV)
(Many of them already been privatized)
Airport / Seaport(C→E?)
Telecom(C→E?)
Low
C = CorporatizationE = Equitization
High
Public School /Hospital & OtherPublic Facilities
Waterworks
ElectricityTransmission &
Distribution(C?)
ElectricityGeneration
(C→E?)(Private playeralready exists)
Source: Created based on interviews with Ministry of National Planning and Economic Development
94
5.2.1 Heavy Industries (1) Factory #12 (Vehicles and Components; Htonebo)
We visited the factory #12 (Vehicles and Components in Htonebo) on November 12, 2012 and conducted an
interview and factory tour. Points of our observation are as follows:
Amid the ongoing market liberalization, factory products cannot compete with imported used cars, and sales
price and revenues decline.
Sales of cars manufactured at the Htonebo factory is so small compared to the increase in the number of
imported used cars. Brand awareness of the factory’s products is considerably low.
Profitability of the factory drastically worsens due to a huge rise in the cost of imported raw materials with
the abolition of the official foreign exchange rate in April 2012.
The number of cars sold in 9 months in FY 2012-2013 is only about 80 cars, which seems to be significantly
below the initial sales plan.
Overview of the factory, observations on management, financial, production, and distribution aspects as well
as issues of the factory are as indicated below.
5.2.1.1 Overview of the Factory
Factory #12 under Heavy Industries Enterprise (1) is a vehicles and components plant established in 1970.
Since its establishment, the factory manufactured Mazda’s jeep type four-wheel drive vehicles such as Mazda
X2000. The factory completed construction in 1973 and started operation in 1974. Presently, the factory mainly
manufactures pickup trucks such as Myanmar Double Cabs (four doors) and Myanmar Single Cabs (two doors).
Both cars are vehicles called Grand Tiger introduced by a Chinese company called ZX Auto. Additionally, the
factory manufactures agricultural engine parts by utilizing their casting equipment for engine parts.
The number of employees is 1,073 (the document provided by the enterprise indicated 1,059). Of which, 41
are officers above Assistant Managers (40 in the enterprise document) and 1,032 are other employees (1,019 in
the enterprise document).
Further, the factory is in the inland area situated about 1.5 hours away on a rough road from the town of
Pyay and has little location advantage due to inconvenient access from neighboring cities.
5.2.1.2 Observations on Management
We researched the following items to analyze management of SOE factories: 1) Management vision /
strategy; 2) Structure and operation of senior management and organization; 3) Management’s decision making
process; 4) Business model; 5) Qualification of factory manager; 6) Management ethics; 7) Business plan; 8)
Public nature of the business (provision of employment opportunities); and 9) Market share, competition
environment with private sector companies.
95
1. Management vision / strategy
MOI develops all management vision and strategies; therefore, it is not the factory’s discretion to make a
decision on such matters.
2. Structure and operation of senior management and organization
Under General Manager and Deputy General Manager (currently vacant), there are Planning,
Administration, Finance, Production, and Quality Control Departments. 6 Assistant General Managers
oversee Planning, Administration, Finance, and Production. Managers supervise relatively small Quality
Control Department. Except for Quality Control, four departments comprise of Assistant General Managers
and 14 managers handling 3 to 6 sections.
3. Management’s decision making process
Management’s decision making process is believed to be a top down system where MOI basically
makes business decisions and factories follow the decisions and manufacture products. However, factory
managers have discretion over employee promotion / transfer and operation control such as schedule
management.
4. Business model
MOI determines the amount of production, suppliers, and distributors and procures raw materials, parts,
and fuel. The factory manufactures vehicles and related products using the raw materials, parts, and fuel
procured by MOI. The factory does not draw up a business model.
5. Qualification of factory manager
An MOI employee is assigned as a general manager who has vast management knowledge and
experience of vehicles manufacturing. The current general manager holds a bachelor’s degree in mechanical
engineering and has been working for MOI for about 28 years. He has experience in training related to
We visited the factory #1 (Pharmaceutical in Yangon) on November 15, 2012 and conducted an interview.
We did not undertake a factory tour since the tour was not permitted. Points of our observation are as follows:
Fierce competition with imported products in the liberalized market could lead to reductions in sales prices.
The factory cannot stay competitive and their sales and operating income could decline if they cannot charge
a portion of the increased imported raw material cost caused by the abolition of the official foreign exchange
rate in April 2012.
Even though the competition with imports is severe, the factory’s products have a strong brand.
In comparison to imported products, their ability to compete in the market is low due to low quality;
however, they can secure a certain level of demand from the government.
If the factory experiences operating loss with increased cost, they need a fundamental reform like other
factories.
Overview of the factory, observations on management, financial, production, and distribution aspects as well
as issues of the factory are as indicated below.
5.2.8.1 Overview of the Factory
Factory #1 under Pharmaceutical and Foodstuff Industries Enterprise is a pharmaceutical plant established
by a British company in 1958. At present, the factory manufactures 160 kinds of products in total, including
tablets / capsules, vaccines / antivenin, sterile products, anti-malarial drugs, and Hepatitis B vaccines. In the last
few years, the factory replaced old machines and constructed a new facility three times, but a lot of facility is still
outdated.
The factory has been increasing the number of employees for the past 3 years, resulting from the new facility
construction, for instance. The number of employees in FY 2011-2012 was 1,641 (154 officers and 1,487 other
employees, up 11.5% from the previous fiscal year). There were in 1,472 employees in FY 2010-2011 (105
officers and 1,367 other employees, up 5.6% from the previous fiscal year) and 1,394 employees in FY
2009-2010 (99 officers and 1,295 other employees).
In addition, the factory is located in Yangon, the biggest market in the country and has a location advantage.
158
5.2.8.2 Observations on Management
We researched the following items to analyze management of SOE factories: 1) Management vision /
strategy; 2) Structure and operation of senior management and organization; 3) Management’s decision making
process; 4) Business model; 5) Qualification of factory manager; 6) Management ethics; 7) Business plan; 8)
Public nature of the business (provision of employment opportunities); and 9) Market share, competition
environment with private sector companies.
1. Management vision / strategy
MOI develops all management vision and strategies; therefore, it is not the factory’s discretion to make a
decision on such matters.
2. Structure and operation of senior management and organization
Under General Manager, there are Planning, Administration, Finance, Production and Quality Control &
Research Departments. Except for Quality Control & Research Department, each department has Deputy
General Manager. Production Department consists of 5 sections based on the kinds of products
manufactured.
3. Management’s decision making process
Management’s decision making process is believed to be a top down system where MOI basically makes
business decisions and factories follow the decisions and manufacture products. However, factory managers
have discretion over employee promotion / transfer and operation control such as schedule management.
4. Business model
MOI determines the amount of production, suppliers, and distributors and procures raw materials. The
factory manufactures pharmaceutical using the raw materials procured by MOI. The factory does not draw
up a business model.
5. Qualification of factory manager
General Manager holds a degree in mechanical engineering, and Deputy General Managers of Planning
and Production Departments hold degrees in botany and zoology, respectively. It can be observed, to some
degree, that personnel with degrees and experiences related to pharmaceuticals are assigned as managers.
6. Management ethics
MOI, not the factory, determines a basis of the standard with which factories and MOI should follow as
organizations.
159
7. Business plan
MOI determines the amount of annual production and creates plans for new products if MOI deems
they are viable. Factories are expected to manufacture products based on the amount of raw materials
provided and will not create business plans.
8. Public nature of the business (provision of employment opportunities)
Currently, 1,641 employees work in the factory and commute from the Yangon metropolitan area.
9. Market share, competition environment with private sector companies
Pharmaceuticals manufactured in this factory are sold to government agencies such as Ministry of
Health and to the market through sales agents. The factory also sells their products to retail customers at their
wholly-owned distribution outlets. The sales area covers the entire country. The market is dominated by
imported products, and according to the factory, their market share is about 10%. However, based on our
research, the actual market share is estimated to be about 3% (See “2.2.2.6. Current status of selective
industries: Pharmaceuticals”).
Factory products were previously sold under the brand name of BPI (Burma Pharmaceutical Industry)
till 1988 and MPF (Myanmar Pharmaceutical Factory) afterword. The brand name was changed back to BPI
in 2011, and brand awareness is still high. As mentioned earlier, we estimate that the factory’s market share is
about 3%, and imported products from India, Bangladesh, and China account for the rest of the market share.
The factory’s products are relatively cheap, and we think that they are competitive in terms of price. On the
other hand, their product competitiveness is not as high as their price competitiveness because there are no
quality control standards in Myanmar and the factory is using the guidelines the United Kingdom used to
apply. Demand for government agencies is stable, and the amount of sales for the market is increasing in
recent years. But price and product competitions with imports are fierce. Additionally, it is expected that, from
FY 2012-2013, the cost of imported raw material will largely rise as a result of the abolition of the official
foreign exchange rate in April 2012. It is not easy for the factory to charge a portion of the increased cost of
goods manufactured to the sales price; thus, we think that it is difficult to stay price-competitive.
160
5.2.8.3 Observations on Finance
We researched the following items to analyze finance of SOE factories: 1) Profitability; 2) Growth potential;
and 3) Safety. Some analysis includes comparisons with sector peer companies in Japan.
1. Profitability
Rates of return on invested capital for the past 3 years are 7.20% in FY 2009-2010, 3.80% in FY
2010-2011, and 4.12% in FY 2011-2012, respectively. The reason why the rate of return on invested capital
in FY 2010-2011 almost halved compared to FY 2009-2010 is that the amount of production declined as the
delivery of imported raw materials delayed.
Rates of return on invested capital in FY 2011-2012 for Japanese peer companies such as Fuji Pharma
and Nissui Pharmaceutical are 10.44% and 11.27%, respectively (all non-consolidated basis). They have
higher rates of return on invested capital compared to that of the Yangon factory, which indicates they are
more profitable than the factory. Turnover ratios of long-term fixed capital for most of those Japanese peers
are more than 50%, while their rates of return on income before interest and tax is about 10% to 20%. On the
other hand, the factory’s turnover ratio of long-term fixed capital is about 20%, while the rate of return on
income before interest and tax is also about 20%. This indicates that the factory’s ratio of sales to long-term
fixed capital is low, whereas the ratio of income before interest and tax to sales is about the same or high.
In addition, we simulated the factory’s cost of imported raw materials and operating income using the
market exchange rate in FY 2011-2012 (1Euro = 1,060 kyats) even though the official rate was used during
that period, while taking into consideration the effects of large inventory. We found that the simulated
operating income declined to 3.11 million kyats (estimated figure), while the factory reported 1,588.8 million
kyats of operating income.
2. Growth potential
Sales in FY 2011-2012 (6,590 million kyats) increased by 45% compared to sales in FY 2010-2011
(4,530 kyats). We expect that the factory will continuously face price and product competitions with imported
products. Furthermore, the government is going to drastically reduce the budget for raw material procurement
for FY 2012-2013 in association with the abolition of the official foreign exchange rate. Hence, in FY
2012-2013, we anticipate that the amount of imported raw materials will decrease, and the amount of
production as well as sales will also decline. If the factory is to raise a sales price along with the increase in
the cost of goods manufactured, it will be difficult for the factory to stay competitive in terms of price and
growth will likely drop.
3. Safety
The factory’s balance sheet contains government fund accounts such as Government Account 1,
161
Government Account 2 or Investment. These accounts are considered to be a budget (operating capital)
provided by the government. Up until FY 2011-2012, operating capital was provided or losses were
compensated even though the factory’s business is making a loss. However, from FY 2012-2013, factories
are required to conduct business and make a profit with the operating capital provided. On the other hand, if
factories cannot make a profit with operating capital, they are required to borrow a portion of the loss from
the government. In this manner, though there are differences in ways of providing operating capital, the
government continuously provides operating capital and / or loans to factories regardless of the state of their
operations. Thus, we consider that the safety of factory finance is quite high.
5.2.8.4 Observations on Production
We researched the following items to analyze production of SOE factories: 1) Operating structure of
production department; 2) Production plan; 3) Production technology (production efficiency); 4) Process
management; 5) Work management; 6) Cost control; and 7) Equipment management / work environment.
1. Operating structure of production department
Deputy General Manager is assigned under Production Department. Under that department, there are 5
sections based on the kinds of products manufactured: tablets / capsules, vaccines / antivenin, sterile products,
anti-malarial drugs, and Hepatitis B vaccines.
2. Production plan
MOI determines the amount of annual production, and factories are to manufacture products based on
the amount of raw materials procured by MOI. Production is basically a made-to-order system, and factories
are not required to search potential clients and to alter production plans. The amount of planned sales for
government agencies in FY 2011-2012 was 1.99 billion kyats and for the retail market (sold through sales
agents) was 2.01 billion kyats. In contrast, the amount of planned sales for government agencies in FY
2012-2013 is very high at 7.37 billion kyats. This is because some of the government clients’ (departments’)
budget increased approximately five-fold. But, the government has not decided which production should be
increased yet, and the amount of actual sales for government agencies as of October 2012 was only 1.72
billion kyats. We do not think it is likely that this planned sales amount will be achieved.
3. Production technology (production efficiency)
This factory was established in 1958, and facility is outdated. Many of the machines used in the factory
are British, but the factory replaced and installed new machines with funds obtained through loans from
Thailand, China, and South Korea. The loan from Thailand was used to renew facility relating to
162
manufacturing of syringes and sterile products. Chinese loan was used to replace tablet production lines. Also,
from FY 2012-2013, the factory received a loan from South Korea and established a plant for manufacturing
Hepatitis B vaccines. The factory can manufacture products with 3 shifts per day at full capacity, but
generally they manufacture with 2 shifts per day on average. The enterprise estimates that the rate of
operation is about 80%.
Monthly sales per employee in FY 2009-2010, 2010-2011, and 2011-2012 are not so high: 358,000
kyats, 257,000 kyats, and 335,000 kyats, respectively. Monthly operating income for the same duration is
105,000 kyats, 55,000 kyats, and 81,000 kyats, respectively. One of the reasons why monthly operating
income in FY 2011-2012 declined even though sales in the same fiscal year rose compared to FY 2009-2010
is considered to be the fact that the factory has increased the number of employees by 247 (or 17.7%) in the
past three fiscal years. We do not think that production efficiency of this factory is high.
4. Process management
Based on the amount of production determined by MOI, the factory calculates the amount of raw
materials necessary and asks MOI to procure raw materials. Products are manufactured according to the
amount of available raw materials. The amount of available raw materials determines the amount of
production. Hence, if raw materials are not readily available and are not procured enough, it will be difficult
to maintain process management.
As described earlier, in FY 2010-2011, a delay in the delivery of imported raw materials led to the
decline in the amount of production. This happened because the factory relies 60% of raw materials on
imports and has a high procurement risk. Major suppliers of imported raw materials include companies in
Hong Kong, India, Singapore, and Thailand. It takes 2 to 3 month from the time of the order to the delivery of
raw materials to the factory.
5. Work management
The factory uses manuals for employee trainings and standardizes work methods. Moreover, employees
who were trained at WHO (World Health Organization) conduct product quality checks.
6. Cost control
Trend of the breakdown of cost of goods manufactured in FY 2011-2012 is that material cost accounts
most for 39%. Labor cost accounts for 29%, and depreciation charge accounts for 15%.
It is certain that the cost of imported raw materials will rise in corresponding to the abolition of the
official foreign exchange rate in April 2012. Considering that the raw material budget allocated for FY
2013-2014 is going to be slashed, we expect that it is difficult to control cost down the road.
163
7. Equipment management / work environment
We did not undertake research for this item since the factory tour was not permitted.
5.2.8.5 Observations on Distribution
We researched the following items to analyze distribution of SOE factories: 1) Market trend; 2) Marketing /
sales strategy, sales plan; 3) Operating structure of distribution department, customer management; 4)
Cooperation with external entities (wholesale, retail).
1. Market trend
Pharmaceuticals from India, Bangladesh, and China are imported to Myanmar, and imported products
have more than 90% of the market share. Though the SOE factory’s products are sold in the market and have
a strong brand, their market share is extremely low.
2. Marketing / sales strategy, sales plan
Production is a made-to-order from the government, and the factory sells pharmaceuticals to
government agencies and the market. The factory does not need to directly formulate marketing / sales
strategies and sales plans. They are required to follow the top-down production plan determined by MOI.
3. Operating structure of distribution department, customer management
They are not in the position to require customer management for their government clients. But for sales
to the market through sales agents, we think that the factory needs to manage customers (their buying and
inquiry history, for instance) so as to understand the market needs, conduct better marketing, and improve the
level of customer satisfaction.
4. Cooperation with external entities (wholesale, retail)
About half of the factory products are sold to government agencies and the other half are sold to the
market through sales agents.
5.2.8.6 Issues
Based on the findings of the research, the following issues can be raised:
Management:
Price competition with imported products and rise in the cost of imported raw materials are expected. It is
not easy to stay competitive in terms of price.
164
Since MOI has authority on management decisions and strategy formulation, general (factory) managers
only have discretion over personnel matters, operation schedule, and so forth. General managers are not
expected to be independent in terms of management; thus, they lack management qualification, abilities to
create business plans, and knowledge of the principle of market mechanism.
Finance:
As far as growth potential (monthly sales and operating income per employee) is concerned, we expect a
decline in the amount of production in association with the drastic budget cut for raw materials and foresee
that sales will decrease even though government demand is expected to be stable. Also, cost of goods
manufactured is likely to rise with the increase in the cost of imported raw materials; thus, operating income
is expected to decline.
Production:
The factory’s dependence on imported raw material is high. A shortfall of procurement and / or delay in
delivery will cause a postponement of production.
Even though the factory undertook facility replacement in the last few years, many machines are outdated
and the rate of operation is not high.
Distribution:
The factory is not able to independently formulate marketing and sales strategies. Thus, they cannot
manufacture products that meet the market needs and are missing out on opportunities to generate additional
earnings.
165
5.2.9 Textile Factory #1 (Textile; Shwedaung)
We visited the factory #1 (Textile in Shwedaung) on November 16, 2012 and conducted an interview and
factory tour. Points of our observation are as follows:
Amid the ongoing market liberalization, factory products cannot compete with imports in terms of product
quality, and sales price and revenues decline.
As the factory uses low quality domestic cotton and facilities are outdated, they cannot manufacture
products that the market demands. Thus, demand for their products is low.
It is anticipated that the sewing industry will expand as Myanmar’s low labor cost can be fully utilized for
industry growth. Thus, huge demand is expected if Myanmar is able to manufacture high quality yarns and
fabrics cheaply.
Overview of the factory, observations on management, financial, production, and distribution aspects as well
as issues of the factory are as indicated below.
5.2.9.1 Overview of the Factory
Factory #1 under Textile Enterprise is a textile plant with spinning, weaving, and finishing functions. It was
established as an import substitution factory in the 1980’s. At first, the factory operated spinning and weaving
only. But, several years later, they started to manufacture finished goods with the assistance of the World Bank.
The factory started a set of production from cotton to finished goods since 1990 and specializes in supplying
products to the domestic market. Quality of that time was relatively high, and they were able to expand their
market share.
Under General Manager, there are 5 departments. The number of employees is 1,935, of which, 70 people
are officers above Assistant Managers.
The Shwedaung factory is located about 230km north-northwest of Yangon along the Irrawaddy River and
situated about half an hour drive from the nearby town of Pyay. Compared to the other SOE factories under
research, their location is not so bad.
5.2.9.2 Observations on Management
We researched the following items to analyze management of SOE factories: 1) Management vision /
strategy; 2) Structure and operation of senior management and organization; 3) Management’s decision making
process; 4) Business model; 5) Qualification of factory manager; 6) Management ethics; 7) Business plan; 8)
Public nature of the business (provision of employment opportunities); and 9) Market share, competition
environment with private sector companies.
166
1. Management vision / strategy
MOI develops all management vision and strategies; therefore, it is not the factory’s discretion to make a
decision on such matters.
2. Structure and operation of senior management and organization
Under General Manager, there are Planning, Administration, Finance, Production, and Quality Control
Departments. Planning and Production Departments hold Deputy General Managers, Assistant General
Managers, Managers, and staff members. Each of these 2 departments consists of 3 to 4 sections overseen by
Managers. Finance, Administration and Quality Control Departments have Managers and staff members.
Except for Quality Control that has only 1 section, other departments consist of 4 to 5 sections.
3. Management’s decision making process
Management’s decision making process is believed to be a top down system where MOI basically
makes business decisions and factories follow the decisions and manufacture products. However, factory
managers have discretion over employee promotion / transfer and operation control such as schedule
management.
4. Business model
MOI determines the amount of production, suppliers, and distributors and procures raw materials. The
factory manufactures yarns and fabrics using the raw materials procured by MOI. The factory does not draw
up a business model.
5. Qualification of factory manager
A person with abundant knowledge and experience in managing a textile factory is assigned as General
Manager. Current General Manager holds a bachelor’s degree in textile engineering and has been working for
MOI for the past 32 years.
6. Management ethics
MOI, not the factory, determines a basis of the standard with which factories and MOI should follow as
organizations.
7. Business plan
MOI determines the amount of annual production and creates plans for new products if MOI deems
they are viable. Factories are expected to manufacture products based on the amount of raw materials
167
provided and will not create business plans.
8. Public nature of the business (provision of employment opportunities)
600 households out of 1,935 employees live in factory dorms. Other employees commute from the
nearby areas, and the factory employment contributes to local job generation to a certain extent.
9. Market share, competition with private sector companies
Imported products from India, China, Thailand and other countries sharply increased and dominate the
Myanmar textile market. Products manufactured by SOE factories are relatively cheap and have price
competitiveness. However, product quality is inferior to imported products, and SOE products are not
competitive. Another factor for the factory’s poor performance derives from decreased occasions to wear a
native costume like longyi as Myanmar opens up to other countries.
5.2.9.3 Observations on Finance
We researched the following items to analyze finance of SOE factories: 1) Profitability; 2) Growth potential;
and 3) Safety. Some analysis includes comparisons with sector peer companies in Japan.
1. Profitability
Rates of return on invested capital for the past 3 years are negative: - 0.31% in FY 2009-2010, -
18.57 in FY 2010-2011, and -2.04% in FY 2011-2012. The reasons why the rate of return on invested
capital largely decreased in FY 2010-2011 are that there was a wide gap between the amount of yarn
manufactured based on the plan and the amount of actual orders received and that direct exporting of excess
inventory to China resulted in a huge foreign exchange loss.
The rate of return on invested capital in FY 2011-2012 for a Japanese peer company, Shinnaigai Textile,
is 3.73% (non-consolidated basis). They have a higher rate of return on invested capital compared to that of
the Shwedaung factory, which indicates they are more profitable than the factory. The turnover ratio of
long-term fixed capital of Shinnaigai Textile is more than 200%, while their rate of return on income before
interest and tax is about 2%. On the other hand, the factory’s turnover ratio of long-term fixed capital is about
23%, while the rate of return on income before interest and tax is negative due to a loss. This indicates that
the factory’s ratio of sales to long-term fixed capital is low.
2. Growth potential
Sales in FY 2011-2012 (2.84 billion kyats) decreased by 57% compared to sales in FY 2010-2011 (6.61
billion kyats). We expect that the factory will continuously face competitions with high quality, inexpensive
168
imports from India and China. In addition, facility replacement is necessary to manufacture products the
market demands. But, considering that there is no budget available for facility replacement and that quality
improvement of domestic cotton cannot be expected, we foresee that demand will not rise and sales will
decline.
3. Safety
The factory’s balance sheet contains government fund accounts such as Government Account 1,
Government Account 2 or Investment. These accounts are considered to be a budget (operating capital)
provided by the government. Up until FY 2011-2012, operating capital was provided or losses were
compensated even though the factory’s business is making a loss. However, from FY 2012-2013, factories
are required to conduct business and make a profit with the operating capital provided. On the other hand, if
factories cannot make a profit with operating capital, they are required to borrow a portion of the loss from
the government. In this manner, though there are differences in ways of providing operating capital, the
government continuously provides operating capital and / or loans to factories regardless of the state of their
operations. Thus, we consider that the safety of factory finance is quite high.
5.2.9.4 Observations on Production
We researched the following items to analyze production of SOE factories: 1) Operating structure of
production department; 2) Production plan; 3) Production technology (production efficiency); 4) Process
management; 5) Work management; 6) Cost control; and 7) Equipment management / work environment.
1. Operating structure of production department
Production Department consists of 4 sections including spinning, weaving, and finishing. Deputy
General Manager, Assistant General Manager, Managers, and staff members are assigned in Production.
2. Production plan
MOI determines the amount of monthly and annual production, and factories are to manufacture
products based on the production amount determined. Production is basically a made-to-order system, and
factories are not required to search potential clients and to alter production plans.
3. Production technology (production efficiency)
Except for the fabric division with Chinese machinery installed in the 2000’s, many of the machines are
outdated, and the rate of operation is low. Especially, renewal of finishing equipment installed in the late
1980’s is an issue of importance. The factory continues to manufacture by repairing facilities that they cannot
169
replace due to budget restrictions. The fact that the factory cannot manufacture high quality yarns and fabrics
with low-performance equipment largely affects the quality of final products.
It is anticipated that the sewing industry will expand as Myanmar’s low labor cost can be fully utilized
for industry growth. Thus, huge demand is expected if Myanmar is able to manufacture high quality yarns
and fabrics cheaply. However, a large amount of capital investment and ability to procure high quality cotton
are essential to create a huge demand.
Monthly sales per employee between FY 2009-2010 and 2011-2012 are low: 155,000 kyats, 341,000
kyats, and 122,000 kyats, respectively. Operating income for the same duration is a loss for the consecutive 3
years. Thus, production efficiency of this factory is very low.
4. Process management
Based on the amount of production determined by MOI, the factory calculates the amount of raw
materials necessary and asks MOI to procure raw materials. Products are manufactured according to the
amount of available raw materials. Hence, if raw materials are not readily available and are not procured
enough, it will be difficult to maintain process management.
Many of necessary materials can be procured domestically. However, procurement of cotton is
becoming difficult as domestic cotton farmers convert to produce more profitable legumes and the supply of
cotton is declining. The factory is reducing procurement risk by starting to partially use imported cotton.
5. Work management
Production is done with 2 shifts (6:00 to 14:30 and 14:30 to 23:30). Work methods are standardized. But
the rate of operation is low; thus, there should be a demand issue to be addressed before improving work
management.
6. Cost control
Breakdown of cost of goods manufactured in FY 2011-2012 is that material cost accounts for 70% of
cost of goods manufactured, and labor cost accounts for about 17%, and other cost for 13%.
As mentioned earlier, domestic cotton farmers convert their crops to more profitable legumes.
Consequently, the supply of cotton declines, and the unit price of cotton continues to rise. There is a
possibility that a rise in the price of domestic cotton becomes a factor to further increase cost of goods
manufactured. Moreover, the factory is to procure a large quantity of high quality cotton from overseas so as
to manufacture higher quality products that meet the market needs, they will be required to pass a portion of
the increased raw material cost to the sales price. Thus, the factory needs to control cost more strictly.
170
7. Equipment management / work environment
Except for the fabric division with Chinese machinery installed in the 2000’s, many facilities were
installed in the late 1980’s and are outdated. Especially, renewal of finishing equipment installed in the late
1980’s is an issue of importance. The factory continues to maintain facilities in the factory’s workshops.
Annual expense on parts purchased for maintenance is about 50 million kyats.
5.2.9.5 Observations on Distribution
We researched the following items to analyze distribution of SOE factories: 1) Market trend; 2) Marketing /
sales strategy, sales plan; 3) Operating structure of distribution department, customer management; 4)
Cooperation with external entities (wholesale, retail).
1. Market trend
The textile market is dominated by cheap and high quality products imported from India and China, and
the market share of products manufactured by SOE factories is low. It seems that uniforms, shirts, and longyis
manufactured at the Shwedaung factory are sold in the market through distributors; however, we did not
come across with any of their products at super markets and shops in Yangon, Mandalay, and other cities.
2. Marketing / sales strategy, sales plan
The factory designs uniforms, shirts, and longyis that they make and has about 700 designs. The factory
suffers from decline in sales and sales price as cheap and high quality imports are increasingly available in
recent years. The factory also researches and develops clothes using jeans like fabrics; however, it is not easy
for them to compete with imported products since they manufacture products with low quality domestic
cotton using outdated facilities.
3. Operating structure of distribution department, customer management
Generally, as a new client, a distributor checks production facilities before deciding on the order contents
and quantity. The factory accepts orders for not only regular products, but also special order products. But, the
factory is not able to cultivate the market with products that can vie with competitive imports.
4. Cooperation with external entities (wholesale, retail)
The factory exhibits finished products in the premises and welcomes wholesale agents that are
interested in trading.
171
5.2.9.6 Issues
Based on the findings of the research, the following issues can be raised:
Management:
Demand for products manufactured at the Shwedaung factory is low in the textile market in Myanmar. The
factory’s products lack competitiveness against imported products from China and other countries.
Since MOI has authority on management decisions and strategy formulation, general (factory) managers
only have discretion over personnel matters, operation schedule, and so forth. General managers are not
expected to be independent in terms of management; thus, they lack management qualification, abilities to
create business plans, and knowledge of the principle of market mechanism.
Finance:
Profitability (the rate of return on invested capital) of the factory is much lower than those of Japanese
competitors. Especially, the rates of return on invested capital are negative in 3 consecutive fiscal years.
Their products are low quality and facing fierce price competitions with imported products; hence, they
cannot compete.
With regards to growth (monthly sales per employee, monthly operating income per employee), we expect a
decline in sales price associated with price competitions and foresee that sales will decrease. Also, cost of
goods manufactured such as the price of cotton is likely to increase; thus, it is difficult to anticipate
improvement in operating income.
Production:
Except for the fabric division, many of the machines are outdated, and the rate of operation is low. Especially,
renewal of finishing equipment installed in the late 1980’s is an issue of importance. The fact that the factory
cannot manufacture high quality yarns and fabrics with low-performance equipment largely affects the
quality of final products.
It is anticipated that the sewing industry will expand as Myanmar’s low labor cost can be fully utilized for
industry growth. Thus, huge demand is expected if Myanmar is able to manufacture high quality yarns and
fabrics cheaply. However, a large amount of capital investment and ability to procure high quality cotton are
essential to create a huge demand.
Distribution:
Awareness of products manufactured at the Shwedaung factory such as uniforms, shirts, and longyis is low
in the market.
The factory is located about 230km north-northwest of Yangon, and their location advantage is not so bad
compared to other SOE factories selected for research.
172
Pictures Taken at the Shwedaung Factory in November 2012
173
5.2.10 Textile Factory #3 (Textile; Sagaing)
We visited the factory #3 (Textile in Sagaing) on December 14, 2012 and conducted an interview and
factory tour. Points of our observation are as follows:
Amid the ongoing market liberalization, factory products cannot compete with imports in terms of product
quality, and sales price and revenues decline.
As the factory uses low quality domestic cotton and facilities are outdated, they cannot manufacture
products that the market demands. Thus, demand for their products is low.
Textile Enterprise has a production network based on the division of labor among 18 factories throughout
the country. However, the production network is inefficient as the production system is not constructed to
manufacture the appropriate amount of products in response to demand. The prospect for improvement is
low.
If the enterprise deems that the factory is unnecessary, we think that measures to close the factory including
transformation of the factory to other uses and asset sales should be considered.
Overview of the factory, observations on management, financial, production, and distribution aspects as well
as issues of the factory are as indicated below.
5.2.10.1 Overview of the Factory
Factory #3 under Textile Enterprise is a spinning and weaving plant that commenced operation in June 1972.
Tomen (Currently named Toyota Tsusho Corporation) provided technical assistance through Japanese official
development assistance.
Main products include cotton yarns (7s, 10s, 21s, and 32s), poplin fabrics (44” and 47” widths), gauzes (32”
width) and bandages (21” width). A majority of their products are semi-finished goods provided to Paleik and
Shwedaung factories at a cost basis, while about 30% of product sales consist of finished goods such as blankets
and bandages.
The number of employees is 1,226 (29 officers and 1,197 other employees). Although the factory can hire
up to a maximum of 2,001 people (44 officers and 1,957 other employees), it does not have to hire that many
employees since the factory is not in full production.
Further, the factory is in the inland area situated about 16km southwest of Mandalay, and its location
advantage is low.
174
5.2.10.2 Observations on Management
We researched the following items to analyze management of SOE factories: 1) Management vision /
strategy; 2) Structure and operation of senior management and organization; 3) Management’s decision making
process; 4) Business model; 5) Qualification of factory manager; 6) Management ethics; 7) Business plan; 8)
Public nature of the business (provision of employment opportunities); and 9) Market share, competition
environment with private sector companies.
1. Management vision / strategy
MOI develops all management vision and strategies; therefore, it is not the factory’s discretion to make
a decision on such matters.
2. Structure and operation of senior management and organization
Under General Manager and Deputy General Manager, there are Planning, Administration, Finance,
Production, and Quality Control Departments. Planning and Production Departments hold Deputy General
Managers, Assistant General Managers, Managers, and staff members. Finance, Administration and Quality
Control Departments have Managers and staff members.
3. Management’s decision making process
Management’s decision making process is believed to be a top down system where MOI basically
makes business decisions and factories follow the decisions and manufacture products. However, factory
managers have discretion over employee promotion / transfer and operation control such as schedule
management.
4. Business model
MOI determines the amount of production, suppliers, and distributors and procures raw materials. The
factory manufactures yarns and fabrics using the raw materials procured by MOI. The factory does not draw
up a business model.
5. Qualification of factory manager
Former military personnel (major) became General Manager 2 years ago. It seems that credentials to be
General Manager are not required.
6. Management ethics
MOI, not the factory, determines a basis of the standard with which factories and MOI should follow as
organizations.
175
7. Business plan
MOI determines the amount of annual production and creates plans for new products if MOI deems
they are viable. Factories are expected to manufacture products based on the amount of raw materials
provided and will not create business plans.
8. Public nature of the business (provision of employment opportunities)
Currently, 1,226 employees work in the factory and most of them live in the factory dorms. The factory
provides shuttle buses for employees who commute from the Sagaing region. In the closed economy, this
factory was established with a goal of strengthening employment opportunities and industrializing the
countryside. However, the factory has lost its significance as the market is now more liberalized than ever
before and consumers are able to purchase inexpensive imported products with better quality that suit their
needs.
9. Market share, competition environment with private sector companies
Of products (yarns and fabrics) manufactured at this factory, about 70% is sold to other SOE textile
factories as semi-finished goods at a production cost basis. Of the rest of 30% (finished goods), bandages are
sold to Ministry of Health and blankets are sold in the market. The textile market is dominated by products
of private entities in India and China.
The market demands wider fabrics than fabrics the factory is able to manufacture. Moreover, demand is
also high for high quality and cheap imported yarns from India and China. Products manufactured at SOE
textile factories are cheap and seem to have price competitiveness. However, if we take factory made
blankets sold to the market as an example, the demand for such products is low and they do not have product
competitiveness since product quality is low. We foresee that competitions with the private sector will grow
intense with the lift of import tariff bans in 2010, establishment of ASEAN Community in 2015, and
competitive products of neighboring countries. The factory expects that they can improve competitiveness if
new machinery is installed and can meet demand from ASEAN countries. Nevertheless, the factory cannot
compete in the market if they cannot manufacture high quality, wider fabrics (width of 80”) that meet the
market needs. Additionally, production efficiency will not improve unless the division of labor and
production network with 18 factories is revised. Thus, we expect that their competitiveness will decline
steadily in the future.
176
5.2.10.3 Observations on Finance
We researched the following items to analyze finance of SOE factories: 1) Profitability; 2) Growth potential;
and 3) Safety. Some analysis includes comparisons with sector peer companies in Japan.
1. Profitability
Rates of return on invested capital for the past 3 years are extremely low: 0.80% in FY 2009-2010, -
25.14% in FY 2010-2011, and -6.20% in FY 2011-2012. The reason why the rate of return on invested
capital turned negative in FY 2010-2011 is that there was a wide gap between the amount of yarn
manufactured based on the plan and the amount of actual orders received and that direct exporting of excess
inventory to China resulted in a huge foreign exchange loss. In FY 2011-2012, the rate also turned negative
because of the excess inventory again. However, in this fiscal year, the factory did not export the excess
inventory and used it to manufacture and sell bandages to government agencies such as Ministry of Health.
It should be noted; however, that there was no profit realized from the bandage sales and that manufacturing
cost is borne by both government agencies and the factory.
The rate of return on invested capital in FY 2011-2012 for a Japanese peer company, Shinnaigai Textile,
is 3.73% (non-consolidated basis). They have a higher rate of return on invested capital compared to that of
the Sagaing factory, which indicates they are more profitable than the factory. The turnover ratio of
long-term fixed capital of Shinnaigai Textile is more than 200%, while their rate of return on income before
interest and tax is about 2%. On the other hand, the factory’s turnover ratio of long-term fixed capital is about
20%, while the rate of return on income before interest and tax is negative due to a loss. This indicates that
the factory’s ratio of sales to long-term fixed capital is low.
2. Growth potential
Sales in FY 2011-2012 (1.74 billion kyats) decreased by 40% compared to sales in FY 2010-2011 (2.9 billion
kyats). We expect that the factory will continuously face competitions with high quality, inexpensive imports from
India and China. In addition, facility replacement is necessary to manufacture products the market demands. But,
considering that there is no budget available for facility replacement and that quality improvement of domestic
cotton cannot be expected, we foresee that demand will not rise and sales will decline.
3. Safety
The factory’s balance sheet contains government fund accounts such as Government Account 1,
Government Account 2 or Investment. These accounts are considered to be a budget (operating capital)
provided by the government. Up until FY 2011-2012, operating capital was provided or losses were
compensated even though the factory’s business is making a loss. However, from FY 2012-2013, factories
are required to conduct business and make a profit with the operating capital provided. On the other hand, if
177
factories cannot make a profit with operating capital, they are required to borrow a portion of the loss from
the government. In this manner, though there are differences in ways of providing operating capital, the
government continuously provides operating capital and / or loans to factories regardless of the state of their
operations. Thus, we consider that the safety of factory finance is quite high.
5.2.10.4 Observations on Production
We researched the following items to analyze production of SOE factories: 1) Operating structure of
production department; 2) Production plan; 3) Production technology (production efficiency); 4) Process
management; 5) Work management; 6) Cost control; and 7) Equipment management / work environment.
1. Operating structure of production department
Production Department consists of Spinning, Weaving, and Garment sections, and Deputy General
Manager, Assistant Managers, Managers, and staff members are assigned.
2. Production plan
MOI determines the amount of annual production, and factories are to manufacture products based on
the amount of raw materials procured by MOI. Production is basically a made-to-order system, and factories
are not required to search potential clients and to alter production plans. Annual production capacity is 1.63
million pounds for yarn and 2.64 million yards for fabric.
3. Production technology (production efficiency)
The factory manufactures using machinery installed by Tomen, etc. in 1972. Although the factory
replaced some facility with Chinese machinery in the 2000’s, most of the machinery is outdated, and the rate
of operation is low.
According to the factory, they have 977 machines, of which 97% or 945 machines are operable. 222
machines (10 of them are not operable) are installed in the spinning section, 646 machines (22 of them are
not operable) are installed in the weaving section, and 109 machines (all are operable) are installed in the
blanket section. However, there are many idle machines in the factory due to low demand for their products,
and the rate of operation is low.
Monthly sales per employee between FY 2009-2010 and 2011-2012 are low: 114,000 kyats, 156,000
kyats, and 115,000 kyats, respectively. Operating income for the same duration is a loss for the consecutive 2
years except 2,000 kyats in FY 2009-2010. Thus, production efficiency of this factory is very low.
178
4. Process management
Based on the amount of production determined by MOI, the factory calculates the amount of raw
materials necessary and asks MOI to procure raw materials. Products are manufactured according to the
amount of available raw materials. Hence, if raw materials are not readily available and are not procured
enough, it will be difficult to maintain process management.
Many of necessary materials can be procured domestically. However, procurement of cotton is
becoming difficult as domestic cotton farmers convert to produce more profitable legumes and the supply of
cotton is declining. The factory is reducing procurement risk by starting to partially use imported cotton.
Cotton with the width of 40” is classified as Grade A and the width of 32” is classified as Grade B.
Most of the cotton the factory used in FY 2011-2012 was Grade C (the width of 21”). In FY 2012-2013, the
factory imported cotton from the United States for research purposes, but they have not yet created products.
There is no problem in supply of electricity and water as the supply is stable.
5. Work management
The factory offers training programs for their employees every year, and each section (spinning and
weaving) has 4 courses. Duration of training for each course is 2 months for operation and 3 months for
maintenance. The factory creates manuals and standardizes work methods. If new machines are installed,
the factory has some employees receive training sessions at other factories that have already placed new
machines. When the factory installed new machinery from China in 2011, they sent 3 employees for
training to China (Tianjin) for three months.
The factory manufactures products with 2 shifts. However, the factory says that the current rate of
operation is about 30% as there are not so many orders received. Furthermore, work is divided among SOE
textile factories, and time is wasted. As Textile Enterprise as a whole, factories are not efficiently operated.
Work methods are standardized. But the rate of operation is low; thus, there should be a demand issue
to be addressed before improving work management.
6. Cost control
Trend of the breakdown of cost of goods manufactured between FY 2009-2010 and 2011-2012 is that
material cost accounts for 70% of cost of goods manufactured, and labor cost accounts for about 20%.
As mentioned earlier, domestic cotton farmers convert their crops to more profitable legume.
Consequently, the supply of cotton declines, and the unit price of cotton continues to rise. There is a
possibility that a rise in the price of domestic cotton becomes a factor to further increase cost of goods
manufactured. The factory is planning to procure 500 tons of cotton domestically and 500 tons from abroad
(the U.S., Australia, Egypt, India, etc.) in FY 2012-2013. With the abolition of the official foreign exchange
rate in April 2012, procuring cotton from abroad becomes a factor for cost increase. We expect that it
179
becomes more difficult to control cost.
7. Equipment management / work environment
The factory was established in 1972 and facility is outdated. However, considering that the factory
maintains machinery and 97% of them are reportedly operable, it can be presumed that equipment
management and work environment are okay. Nonetheless, the rate of operation is low as the amount of
production is low and there are many unused machines.
5.2.10.5 Observations on Distribution
We researched the following items to analyze distribution of SOE factories: 1) Market trend; 2) Marketing /
sales strategy, sales plan; 3) Operating structure of distribution department, customer management; 4)
Cooperation with external entities (wholesale, retail).
1. Market trend
Yarn, fabric, and bandages manufactured at the factory are not sold in the market, while blankets are
sold in the market. As for yarn, fabric, and blankets, the market is dominated by inexpensive high quality
imports from India and China. The market share of products manufactured by SOE textile factories is low.
2. Marketing / sales strategy, sales plan
Production is a made-to-order from the government, and the factory sells yarns, fabrics, and bandages
to government agencies and the market. They also sell blankets to the market. The factory does not need to
directly formulate marketing / sales strategies and sales plans. They are required to follow the top-down
production plan determined by MOI.
3. Operating structure of distribution department, customer management
Including finished products (blankets) sold in the market, the factory ships out all products directly to
government agencies. Products are 70% transported by truck and 30% by ship. Factory’s semi-finished
products are sent to the Paleik and Shwedaung factories for finishing, but some of them are shipped to the
Sagaing garment factory that is located near the Sagaing factory. There are not so many clients, and the sales
amount is small. Also, the factory has no discretion over changing the number of clients and amount of sales.
Thus, we do not think that they are in the position to require customer management.
180
4. Cooperation with external entities (wholesale, retail)
Since the factory sells its products to government agencies and other SOE textile factories directly, there
is no cooperation with external entities regarding wholesale and retail operations.
5.2.10.6 Issues
Based on the findings of the research, the following issues can be raised:
Management:
There is little demand for the factory’s products in the market, and their products are not competitive. It is
difficult to expand their market share under the liberalized market.
Since MOI has authority on management decisions and strategy formulation, general (factory) managers
only have discretion over personnel matters, operation schedule, and so forth. General managers are not
expected to be independent in terms of management; thus, they lack management qualification, abilities to
create business plans, and knowledge of the principle of market mechanism.
Finance:
Profitability (the rate of return on invested capital) of the factory is much lower than those of Japanese
competitors. Especially, the rates of return on invested capital in both FY 2010-2011 and 2011-2012 are
negative. Their products are low quality and facing fierce price competitions with imported products; hence,
they cannot compete. It is very difficult to expect improvement in operating income.
With regards to growth (monthly sales per employee, monthly operating income per employee), we expect a
decline in sales price associated with price competitions and foresee that sales will decrease even though
government demand is expected to be stable. Also, cost of goods manufactured such as the price of cotton is
likely to increase; thus, it is difficult to anticipate improvement in operating income.
Production:
Textile Enterprise has a production network based on the division of labor among 18 factories throughout
the country. However, the production network is inefficient as the production system is not constructed to
manufacture the appropriate amount of products in response to demand. The prospect for improvement is
low.
As the factory uses low quality domestic cotton and the facility is outdated, they cannot manufacture
products that the market demands. Thus, demand for their products is low.
181
Distribution:
The factory is located in the inland area and has no location advantage.
Many of their clients are government agencies, and the factory is not able to independently formulate
marketing and sales strategies. Thus, they cannot manufacture products that meet the market needs and are
missing out on opportunities to generate additional earnings.
Pictures Taken at the Sagaing Factory in December 2012
182
5.3 Examination of Investment Possibilities
In this section, we conduct an examination of investment possibilities for the 10 SOE factories under
research. We set up assumptions regarding the amount of sales, budget for capital investment, and other items
based on the actual financial performance between FY 2009-2010 and 2011-12 and undertake financial
simulations between FY 2012-2013 and 2015-2016. Based on the results obtained, we examine possibilities of
investment by private sector companies for each SOE factory under research.
5.3.1 Assumptions used for financial simulations
We set the following assumptions in conducting financial simulations:
1) Undertook financial simulations between FY 2012-2013 and 2015-2016 based on FY 2011-2012 financial
data adjusted with market foreign exchange rates (1USD = 800 kyats and 1EURO = 1,060 kyats) and other
factors (See “Corrected” in the table below).
2) The amount of sales will be stable for the next 3 years (except for Htonebo), and the cost of imported raw
materials will be settled using the market foreign exchange rates.
3) Increase in costs caused by rises in the raw material cost will not be passed on to the sales price.
4) The average number of employees will not change after March 2012, while the average personnel charge per
employee will increase at an annual rate of 1.33%.
5) Budget for capital investment will be cut down by 20% annually across the board; however, this reduction
will have no effect on production activities (the amount of sales, etc.)
6) From FY 2012-2013, income tax rate and state contribution rate will be reduced from 30% and 70% to 25%
and 20%, respectively.
5.3.2 Investment possibility of each SOE factory
We undertook financial simulations using the actual performance data between FY 2009-2010 and
2011-2012 and aforementioned assumptions. Investment possibility for each SOE factory is as follows.
As for Heavy Industries Enterprise (1) Factory #1 (Vehicles & Components) in Htonebo, we set the
assumptions that demand for their products (automobiles) will be stagnant and that sales of FY 2012-2013 will be
a quarter of the corrected sales amount of FY 2011-2012. The factory will suffer from operating loss and have a
low investment possibility from a financial perspective. On the other hand, Factory #14 (Diesel Engines) in
Thargaya will see a rise in operating loss and in government fund account posted as liabilities. Net assets will be
continuously negative for the next 3 fiscal years, and the factory’s investment possibility is recognized to be low
from a financial point of view. Moreover, operating income of Factory #16 (Agricultural Equipment) in Sinde
will turn into a loss due to a rise in the cost of raw materials caused by the application of the market foreign
183
exchange rate. The factory requires financial assistance from the government to continue operations, and we
estimated that their investment possibility is low.
As far as Heavy Industries Enterprise (2) Factory #22 (Radial Tyres) in Belin, we consider that net assets of
the factory decreases due to continuous operating loss and that the amount of negative net worth increases. We
also estimated that government fund account posted as liabilities also increase and consider chances that private
sector companies invest in the factory are slim unless the government keeps funding the factory to achieve
continuous operations.
For Heavy Industries Enterprise (3) Factory #31 (Cement in Thayet) and #32 (Cement in Kyangin), since
the amount of fuel cost (such as natural gas) will rise to a large degree due to the application of the market foreign
exchange rate, we estimated that operating income will fall into a loss and government fund account posted as
liabilities will rise. We also expect chances that private sector companies invest in the factory are slim unless the
government keeps funding the factory to achieve continuous operations. On the contrary, we estimated that the
Kyaukse factory ‘s operating income will stay positive for FY 2012-2013, but profitability from FY 2013-2014
will largely decline due to the soaring fuel cost as we assume that the factory will not be able to use inland natural
gas from that fiscal year.
As for Yangon Pharmaceutical Factory #1, even though we estimate that the cost of raw materials will rise
due to the application of the market foreign exchange rate, operating income will decrease but stay positive. We
also anticipate that negative net worth will turn positive thanks to the revision of income tax and state contribution
rates. On the other hand, we expect that government fund account posted as liabilities will increase because of
effects including high-level capital investment and see that chances that private sector companies invest in the
factory are slim unless the government keeps funding the factory to operate continuously.
As far as Textile Factory #1 in Shwedaung and #3 in Sagaing are concerned, operating losses will increase
and government fund account posted as liabilities will also rise. We estimated that net assets (already negative net
worth) will not rebound to a positive level. Investment possibilities for these 2 factories are low from a financial
simulation perspective.
As described above, many factories face low investment possibilities based on the result of the financial
simulations. We assessed that, from a financial point of view, chances are slim for the factories to be targets for
private sector investment since profitability worsens due to a rise in imported raw material cost associated with
the application of the market foreign exchange rate. Additionally, the factories could fall into a much more severe
situation than the simulated results if competitions with imported products intensify and sales decline.
However, if reform measures that could alter the simulation assumptions we have used were executed, the
chances to attract private investment could significantly improve in the future. In the next chapter, we will report
specific improvement plans for each SOE factory from perspectives of factory location, management /
technological expertise, machinery, and brand recognition.
184
6. Options for Improvement and Recommendations of Privatization by State-owned Economic Enterprise Factories Surveyed
6.1 Recommendations from institutional and policy perspectives
6.1.1 Classification of SOEs / factories and restructuring plans based on classification
At present, the Myanmar government is focusing on cutting off unprofitable SOE factories from central
government finance through JVs and leases and on transferring SOE factory employees to the private sector.
Some SOEs have public functions such as resources, electricity, and infrastructure; however, some SOEs such as
the ones under MOI no longer serve a purpose of SOEs as they operate businesses under severe competitions with
private sector companies and import goods.
Therefore it is recommended to classify SOEs into several categories according to the degree of their policy
importance and profitability, and then to develop restructuring plans for each category. SOEs can be categorized into
four groups as follows;
(1) Profitable and policy wise important state-owned enterprises and factories
(2) Profitable but for policy reasons, unimportant
(3) Unprofitable but important for policy reasons
(4) Neither profitable nor important policy wise
Restructuring plans should be prepared for each category. For category (1), as long as the importance remains,
such SOEs should maintain its profitability via efficient management. Whereas for category (2), equitization or
corporatization to improve its business efficiency is one of the measures to be taken, and JV and lease with private
partners is another option. As for category (3), there are occasions in which the government decides to remain some
factories as state-owned for policy reasons if it highly regards the importance of those industries concerned from
the perspectives of strengthening or accumulating domestic technology as well as fostering domestic production.
As such, continuous allocation of state budget of financing scheme will be required for the SOE concerned as well as
measures to improve its profitability through enhancing the efficiency and productivity. For category (4), realistic
options are closure of the factories and businesses; therefore, the main issues would be how to sell assets and reallocate
SOE or factory employees.
6.1.2 Enhancement of legislations for corporate governance and SOEs
Currently, SOEs in Myanmar are understood to be out of the coverage of Corporate Act, and there are no legal
provisions on the organization and management structure of SOEs. As the government is moving toward
“Corporatization” upon accelerating privatization of SOEs, it would be necessary to enhance legislations on the
management and operational structure and corporate governance of SOEs, eying the possibility of equitization and
185
privatization. Applying the relevant part of Corporate Act to SOEs might be also desirable.
6.1.3 Promotion of JV and lease through providing financial support to investors
No matter if private investors are interested in JV and lease of state-owned factories, private investors would face a
necessity in investing a huge amount in facilities, as most of the equipment in state-owned factories are too old.
However, financing for such capital investments might be one of the bottlenecks for JV and leasing, as it is not always
easy for private investors to borrow bank loans. One of the examples is Shwedaung textile factory, in which several
private investors are interested. Such private investors tend to say that they are interested in the factory, but they cannot
make decisions due to the huge investment necessary for the renovation of the factory. Some of them said they look for
foreign partners who can provide funds for investments.
Therefore, providing bank loans from a state-owned bank for such investments might be one of the possible
measures to encourage JV and lease of state-owned factories.
6.1.4 Improvement in the investment environment for foreign enterprises
As mentioned above, when foreign companies consider JV and lease, they might be concerned with the following
issues upon investment judgment:
- Possible intervention by the government on JV established under Special Company Act
- Issues of foreign investment law (inadequate business-to-business dispute settlement system),
- Undeveloped legal system on asset leases
- Undeveloped legal system on asset sales and valuation method of land usage rights.
In order to remove their concerns, it would be desirable to enhance the legal system to improve legal predictability
on business activities of foreign companies in Myanmar.
6.2 Options for Improvement and Recommendations of Privatization by SOE Factories Surveyed
Based on findings of field research undertaken in November and December 2012, we describe options for
improvement and recommendations in this section.
We categorized SOE factories targeted for this research into 4 groups (Group A, B, C, and D) based on our
observation of the 10 factories and possible options of improvement. Current situation has the following four
evaluation points: Factory location, managerial and technical expertise, machinery, and brand recognition. As for
options for improvement, we raised 1) corporatization (not privatization), 2) joint venture (JV) with private partners,
3) lease, 4) full privatization, and 5) no option.
186
Figure 6-1. Overview of current conditions and options for improvement for 10 factories surveyed Group Enterprise Factory Options for Improvement
Factory Location Good
Managerial & TechnicalExpertise
OK
Machinery OK
Brand Recognition OK
Factory Location Not Good
Managerial & TechnicalExpertise
Not Good
Machinery OK
Brand Recognition Not Good
Factory Location OK
Managerial & TechnicalExpertise
Not Good
Machinery Not Good
Brand Recognition Not Good
Factory Location Not Known
Managerial & TechnicalExpertise
OK
Machinery OK
Brand Recognition OK
Factory Location Not Good
Managerial & TechnicalExpertise
Not Good
Machinery Not Good
Brand Recognition Not Good
Current Situation
A
Heavy Industries (3)
Pharmaceutical &Foodstuff
#33 Cement(Kyaukse)
#1 Pharmaceutical(Yangon)
1) Corporatize and give autonomy(not privatize)
2) Form JV with private partner withexpertise in finance and production
3) Fully privatize
B
Heavy Industries (1)
Heavy Industries (2)
#14 Diesel Engines(Thargaya)
#22 Radial Tyres(Belin)
1) Lease
2) Form JV with private partner withexpertise in finance, production andmarketing
3) Fully privatizeTextile
#1 Textile(Shwedaung)
C Heavy Industries (3)
#31 Cement(Thayet)
#32 Cement(Kyangin)
While limestone reserve is stillavailable, alternative fuel toexpensive natural gas has not beenidentified to date. Search foraffordable fuel continues.
DHeavy Industries (1)
Textile
#12 Vehicles &Components(Htonebo)
#16 AgriculturalEquipment (Sinde)
#3 Textile (Sagaing)
None
Nothing to appeal to privateinvestors
6.2.1 Group A: Dry Cement Factory in Kyaukse and Pharmaceutical Factory in Yangon
6.2.1.1 Current Situations
The dry cement factory in Kyaukse and pharmaceutical factory in Yangon are categorized in Group A.
Common aspects of these factories are that they have a location advantage and managerial / technical expertise
through a highly skilled production level and longtime operation, the rate of operation is relatively high with
operable machinery, and their brand recognition is high (See Figure 5-3 in the previous chapter for factory
location maps).
Since the dry cement factory in Kyaukse has a limestone quarry near the factory premises and is relatively
close to the northern market and coal mines that can be used as alternative fuel to natural gas, the factory has a
better location advantage compared to the other 2 cement factories in Thayet and Kyangin. The Kyaukse factory
187
started operation in 2003 and has enough technical expertise on dry cement production to provide training to
other factories’ employees. Although clinker is leaking from a kiln, machinery is relatively new and the factory
achieves about the 70% rate of operation with 3 eight-hour shifts a day. Brand of SOE cement is established, and
their brand recognition is high.
However, the Kyaukse factory currently receives cheap inland natural gas, but supply of inland natural gas is
to be stopped after the completion of the LNG pipeline between Rakhine State and China. The factory will have
to alter fuel they use from inland natural gas to either offshore natural gas or coal. If the factory uses offshore
natural gas, we estimate that their operating income turn to a loss. On the other hand, the factory uses coal, their
cost of fuel will increase and their price competitiveness against imported products will be low. It is significant for
the factory to anticipate future cost increase and control cost to accomplish continuous operations.
The pharmaceutical factory in Yangon is located in Yangon, the biggest market in the country, and has a
location advantage. The factory has been in operation since its establishment in 1958 and has managerial and
technical expertise. Even though the factory has renewed and newly established facilities 3 times in recent years,
most of the machinery is outdated. But, the rate of operation is relatively high at about 80%. They sell their
products with a brand name of BPI, and their brand is highly recognized in the country.
Furthermore, the Yangon pharmaceutical factory relies 60% of raw materials on imports, and the abolition of
the official foreign exchange rate is a factor of cost increase. Government demand is expected to be stable, but, it
is important for the factory to lower the procurement cost of raw materials.
6.2.1.2 Options for Improvement and Recommendations for Privatization
Taking into the current situations, we think that the cement factory in Kyaukse and pharmaceutical factory in
Yangon could stay competitive and ensure profitability without government assistance. Thus, we recommend the
following options for improvement: 1) Corporatize and give autonomy (not privatize); 2) Form a JV with a
private partner with expertise in finance and production; or 3) Fully privatize.
The Kyaukse cement factory has a location advantage and has room for facilities expansion thanks to its
huge premises. We consider that the factory can improve the level of technology and management knowledge,
expand facilities by utilizing their vast land, and repair their facilities through cooperating with private sector
companies. Moreover, the pharmaceutical factory in Yangon also has a location advantage and has high brand
awareness. We think that the factory can improve the level of technology / management knowledge and renew
their outdated facilities. As described above, we anticipate that the factory’s competitiveness will be further
strengthened and profitability will improve if private sector companies engage in factory operations. Hence, we
recommend these 2 factories choose and execute among the 3 options mentioned above (corporatization, JV, and
full privatization).
6.2.2 Group B: Diesel Engine Factory in Thargaya, Radial Tyre Factory in Belin, and Textile Factory in
188
Shwedaung
6.2.2.1 Current Situations
The diesel engine factory in Thargaya, radial tyre factory in Belin, and textile factory in Shwedaung are
categorized in Group B. Common aspects of factories in Thargaya and Belin are that their location advantage is
low, managerial and technical expertise is limited due to their dependence on overseas technology, their
machinery is quite new, and brand recognition is low. Moreover, the factory in Shwedaung has a location
advantage, but their expertise on new technology is nil because they are using outdated machinery, and brand
awareness is low.
The diesel engine factory in Thargaya is located in the inland area and has little location advantage. They
manufacture products using Chinese technology and raw materials with a knockdown system; therefore,
technical knowledge is not accumulated in the factory. Additionally, since their products compete with imported
products from countries like China and only few of them are sold in the market, brand recognition is extremely
low. However, the factory is established in 2009 and their facilities are new.
There are natural rubber plantations near the radial tyre factory in Belin; thus, the location is highly
advantageous in terms of procuring rubber materials. But their location advantage is not so high from
perspectives other than procurement of natural rubber. Even though the factory uses Chinese technology, they
only started operations about 3 years ago and it cannot be necessarily said that they have a high level of technical
expertise. Further, their brand awareness is low because competition with domestic and imported products is
severe and the factory cannot manufacture the size of tyres the market demands. However, the factory started
operations from 2010 and their machinery is new.
The textile factory in Shwedaung is located in the inland area, but has a location advantage because it is
relatively close to Yangon and has vast grounds. The factory was established in 1980, and their facilities are
outdated. Although a part of their facilities was renewed in 2004, the most of the machinery is outdated and the
rate of operation is low. Moreover, the factory products are not competitive because the factory does not have
technological expertise to manufacture new products and manufactures products using low quality and relatively
expensive domestic cotton. Hence, only few of their products are sold in the market, and brand recognition is
extremely low.
6.2.2.2 Options for Improvement and Recommendations for Privatization
Considering their loss-making operations, we estimate that it will be difficult for the diesel engine factory in
Thargaya, radial tyre factory in Belin, and textile factory in Shwedaung to stay competitive and ensure
profitability without government assistance. However, if they can receive assistance from private sector
companies, we think that it is possible for those factories to improve their competitiveness and profitability.
Therefore, we recommend the following options for improvement: 1) Lease; 2) Form a JV with a private partner
with expertise in finance, production, and marketing; or 3) Fully privatize.
189
Facilities of Thargaya’s diesel engine factory and Belin’s radial tyre factory are new. Additionally, there are
natural rubber plantations near the Belin factory; hence, raw materials can be easily procured. We consider that
these factories can improve the production know-how / procurement methodology of raw materials, invest in
manufacturing new products, and market their finished products through cooperating with private sector
companies. Moreover, the textile factory in Shwedaung is relatively close to Yangon and has room to expand. We
think that the factory can renew and modernize their facilities by utilizing their vast grounds, provide support on
importing raw materials and on marketing finished products through cooperating with private sector companies.
As such, we anticipate that the factory’s competitiveness will be further strengthened and profitability will
improve if private sector companies engage in factory operations. Hence, we recommend these 3 factories choose
and execute among the 3 options mentioned above (lease, JV, and full privatization).
6.2.3 Group C: Wet Cement Factories in Thayet and Kyangin
6.2.3.1 Current Situations
The wet cement factories in Thayet and Kyangin are categorized in Group C. Common aspects of both
factories are that while it is possible for them to obtain limestone, they still need additional research regarding
their location advantage, they have managerial and technical expertise thanks to longtime operations, but they
cannot cope with modern mass production, facilities are operable, and brand is widely recognized.
Although both factories are able to procure raw materials such as limestone, they still need additional
research as far as their location advantage is concerned. Their many years of cement production experience
provided them with managerial and technical expertise; however, their production system cannot cope with
modern mass production as they pack cement in 50kg bags and cannot manufacture in bulk. Facilities of the
Thayet factory are mainly installed in the 1960’s from Japan and are outdated. The factory renewed part of the
facilities in the 2000’s and operate facilities while they maintain them. But, the factory is not operating at full
capacity. Facilities of the Kyangin factory are introduced in 1971 and are also outdated, but they operate
machinery while they maintain them as well. Furthermore, brand awareness of cement manufactured by SOE
factories is high, and much of their cement is used for public works. As for the cement industry, we expect that
demand will increase as demand for construction rises.
Common issues for both factories are that they use a wet cement manufacturing process which is more
costly than a dry process and that they presently utilize more expensive offshore natural gas as inland natural gas
they used as fuel was depleted. Also, they have an issue in competing with domestic and imported products in
terms of price since they use expensive offshore natural gas. A supply price of offshore natural gas delivered to
the factories is discounted and set at 5 USD per million BTU until May 2013 (usually set at around 11USD per
million BTU), but the price to be applied after June 2013 is not yet determined. Therefore, if the supply price is
set at around 11 USD per BTU, that is, the price set for export, factories’ profitability will worsen. Also, fuel
190
expense till FY 2011-2012 was not expensive since they used the official foreign exchange rate. However, we
estimate that operating income will turn to a loss after FY 2012-2013 because factories settle fuel expense using
the market rate and that their price competitiveness against imported products will be low. Despite the fact that
factories consider using alternative fuel such as coal in order to operate continuously and negotiate to lower the
gas price and receive a long-term supply of gas with Ministry of Energy, they have not yet found a concrete
solution to date.
6.2.3.2 Options for Improvement and Recommendations for Privatization
Given the fact that wet cement factories in Thayet and Kyangin suffer from high fuel expense and cannot
use alternative fuel to offshore natural gas, we think that it is difficult for them to remain competitive without
government assistance and ensure profitability. Moreover, we assume that it is difficult for them to improve their
competitiveness and profitability even with the help of the private sector. Thus, we do not consider that
corporatization, lease, JV, and full privatization are the option for improvement. In other words, government
subsidy is essential in order for both factories to operate continuously.
6.2.4 Group D: Vehicles and Components Factory in Htonebo, Agricultural Equipment Factory in Sinde,
and Textile Factory in Sagaing
6.2.4.1 Current Situations
The vehicles and components factories in Htonebo, agricultural equipment factory in Sinde, and textile
factory in Sagaing are categorized in Group D. Common aspects of these factories are that they have little
location advantage, cannot manufacture products the market desires even though they possess managerial and
technical expertise through long-time operations, have outdated facilities, and their brand recognition is extremely
low.
The vehicles and components factory in Htonebo is located in the inland area and has little location
advantage. The factory has not accumulated technical expertise since they manufacture automobiles with a
knockdown system. The factory started operation in 1974, and facilities are outdated. They face a severe
competition with imported used cars from countries like Japan. They sell few of their products in the market, and
brand awareness is very low due to their poor reputation. Furthermore, demand including that of government
agencies is declining, we expect that it is highly likely that the factory’s profitability in FY 2012-2013 worsens to
a large degree.
The agricultural equipment factory in Sinde is located in the inland area and has little location advantage.
The factory was established in 1965, and their facilities including casting are outdated. Competition with
imported products from China and other countries is intense. They cannot strategically market their products, and
their brand recognition is extremely low.
191
The textile factory in Sagaing is located in the inland area and has little location advantage. Facilities that
started production in 1972 are outdated. The factory renewed part of their facilities in the 2000’s, but most of
them are outdated, and the rate of operation is low. Also, they are not competitive in the market since they do not
possess technological knowledge of manufacturing new products and manufacture products using low quality
and relatively expensive domestic cotton. Hence, their products are not sold in the market, and brand recognition
is extremely low.
6.2.4.2 Options for Improvement and Recommendations for Privatization
The vehicles and components factories in Htonebo, agricultural equipment factory in Sinde, and textile
factory in Sagaing were established as import substitute plants to serve a purpose of industrialization in the area.
They import raw materials and manufacture a small amount of products. They cannot compete with imported
products in terms of both price and quality. Considering their low product competitiveness (low demand),
outdated facilities, and disadvantageous locations, we expect that, even with government assistance, it will be
difficult for them to make a profit with a few orders from the government in the midst of the ongoing trade
liberalization. Further, we anticipate that it is also hard for them to improve competitiveness and profitability even
if they receive assistance from the private sector. Therefore, we do not consider that corporatization, lease, JV, and
full privatization are the option for improvement. We recommend that these 3 factories examine measures to
effectively utilize factories’ assets again by transferring knowledge and skills of factory workers to the private
sector and by selling factory premises and facilities in a highly transparent manner.