25
May 2015 Myers Industries, Inc. Investor Presentation
| Date post: | 03-Aug-2015 |
| Category: |
Business |
| Upload: | myersinvestors |
| View: | 415 times |
| Download: | 0 times |

May 2015
Myers Industries, Inc. Investor Presentation

Forward-looking Statements
Statements in this presentation concerning the Company’s goals, strategies, and expectations for business and financial results may be "forward-looking statements" within the meaning of the Private Securities Litigation Reform Act of 1995 and are based on current indicators and expectations. Whenever you read a statement that is not simply a statement of historical fact (such as when we describe what we "believe," "expect," or "anticipate" will occur, and other similar statements), you must remember that our expectations may not be correct, even though we believe they are reasonable. We do not guarantee that the transactions and events described will happen as described (or that they will happen at all). You should review this presentation with the understanding that actual future results may be materially different from what we expect. Many of the factors that will determine these results are beyond our ability to control or predict. You are cautioned not to put undue reliance on any forward-looking statement. We do not intend, and undertake no obligation, to update these forward-looking statements. These statements involve a number of risks and uncertainties that could cause actual results to differ materially from those expressed or implied in the applicable statements. Such risks include:
(1) Changes in the markets for the Company’s business segments
(2) Changes in trends and demands in the markets in which the Company competes (3) Unanticipated downturn in business relationships with customers or their purchases (4) Competitive pressures on sales and pricing (5) Raw material availability, increases in raw material costs, or other production costs (6) Harsh weather conditions (7) Future economic and financial conditions in the United States and around the world (8) Inability of the Company to meet future capital requirements (9) Claims, litigation and regulatory actions against the Company (10) Changes in laws and regulations affecting the Company
(11) The Company’s ability to execute the components of its Strategic Business Evolution process
Myers Industries, Inc. encourages investors to learn more about these risk factors. A detailed explanation of these factors is available in the Company’s publicly filed quarterly and annual reports, which can be found online at www.myersindustries.com and at the SEC.gov web site.
2

Why Myers
3
• Realigned and refocused
• Enhanced platform to accelerate growth
• Strong market positions; plans to further penetrate expansion markets
• Financially strong; disciplined capital deployment
• Dedicated to enhancing shareholder value

Streamlined Operating Segments
Over the course of 18 months, Myers has realigned and reduced the number of its reportable operating segments from four to two distinct businesses through a series of planned strategic transactions.
• Divested WEK Industries, Inc., a non-core business, in June 2014 for $20 million • Used proceeds to help fund the acquisition of Scepter
• Acquired Scepter in July 2014 for $157 million • Complements and grows Material Handling Segment with adjacent products and
technologies and expands end markets and geographic reach • Provides opportunities for cross selling with existing Myers’ businesses in a number of
end markets, including Marine, Industrial, and Automotive • Annual sales of approximately $100M increases Material Handling revenue by 25% • Higher margins and better growth potential than divested Lawn & Garden business
• Divested underperforming Lawn and Garden segment in February 2015 for $110 million
• Net proceeds from the transaction used to pay down debt
4

76%
24%
72%
28%
5
Two core businesses & reporting segments: Material Handling • Polymer-based returnable packaging • Polymer-based storage and safety products • Specialty molding
Distribution • Largest U.S. wholesale distributor of tools, supplies and
equipment for the tire, wheel and undervehicle service segment industry
• Manufacturer of tire repair and retread products
2014 Net Sales*
2014 Adjusted Income Before Taxes*
Material Handling | Distribution
*Data has been updated to reflect discontinued operations presentation, segment realignment completed in June 2014, and inclusion of Scepter Corporation Group’s full year 2014 sales and income before taxes.
Company at a Glance (NYSE: MYE) Material Handling | Reusable Containers Distribution | Tire Maintenance Supplies

Business Segments Material Handling | Reusable Containers Distribution | Tire Maintenance Supplies

• Focus on markets that have strong, sustainable growth and profit potential
• Material Handling: • Food processing • Agriculture • Industrial • Marine
• Distribution: • Auto dealer tire market • Fleet maintenance • E-Commerce
• Invest within our growth platforms for value creation • Drive earnings growth faster than sales growth • Maintain a strong and flexible balance sheet
7
Strategic Goals

Financial Goals and Progress Towards Them
8
• Operating performance in 2014 impacted by poor weather conditions early in the year, freight and logistical issues, weak commodity prices and the troubled Brazilian economic climate
• ROIC in 2014 impacted by acquisition of Scepter which took place mid-year
• Despite challenging year operationally, generated strong free cash flow in 2014
2014 Results:
Metric Goal 2014(5) 2013(5) 2012(5)
Sales Growth(1) > 2.0x GDP 7% 7% 7%
Gross Profit Margin > 30% 26% 29% 30%
Free Cash Flow(2) ≥ 100% of Net Income 308% 205% 90%
ROIC(3) > 10% 5% 17% 15%
Innovation / NPD(4) >10% of Sales 8% 7% 3%
Operations Excellence Savings 3% of COGS (gross) 2% 2% 2%(1) Using real GDP forecasted and actual growth rates, 2.0x GDP growth = 4.8%, 4.4% and 4.6% for 2014, 2013 and 2012 respectively.
(2) Free cash flow calculated as cash flow provided by continuing operations - capital expenditures for continuing operations.
(3) ROIC = Net Operating Profit After Tax/(Debt + Equity).
(4) NPD = New Product Development calculation based on products/services introduced within the last three years.
(5) All years reflect discontinued operations presentation. 2012 and 2013 do not include Scepter acquisition completed in 2014.
Key Accomplishment Metrics

9
Net Sales Growth
+
• Select investments and acquisitions
• Richer product mix
• New markets and geographies
Profitability
+
• Optimize capacity
• Drive greater operating efficiency
• Enhance product mix
Free Cash Flow • Sales growth and profitability improvement
• Capital discipline
Growth Drivers

First Quarter 2015 Financial Summary
10
• Sales increased due to the Scepter acquisition but were offset by decreased sales in the Material Handling Segment’s agricultural and food processing end markets
• Gross profit margin increase mainly due to pricing actions and the incremental contribution from Scepter
• SG&A increased due to incremental expenses from the Scepter acquisition and restructuring/other unusual pre-tax charges
• Adjusted income per diluted share of $0.13 vs. $0.15 in the first quarter of 2014
Note: All figures except ratios and percents are $Millions
Continuing Operations Q1 Q1 %Highlights 2015 2014 Change
Net sales $156.3 $150.5 3.9%
Gross profit margin 29.3% 28.0%
SG&A $39.0 $33.2 17.5%
Income from continuing ops - adjusted¹ $4.0 $5.0 (19.9)%
Effective tax rate 34.7% 34.7%
Income per diluted share from continuing ops - adjusted¹ $0.13 $0.15 (13.3%)
¹See Reconciliation of Non-GAAP measures on slide 24
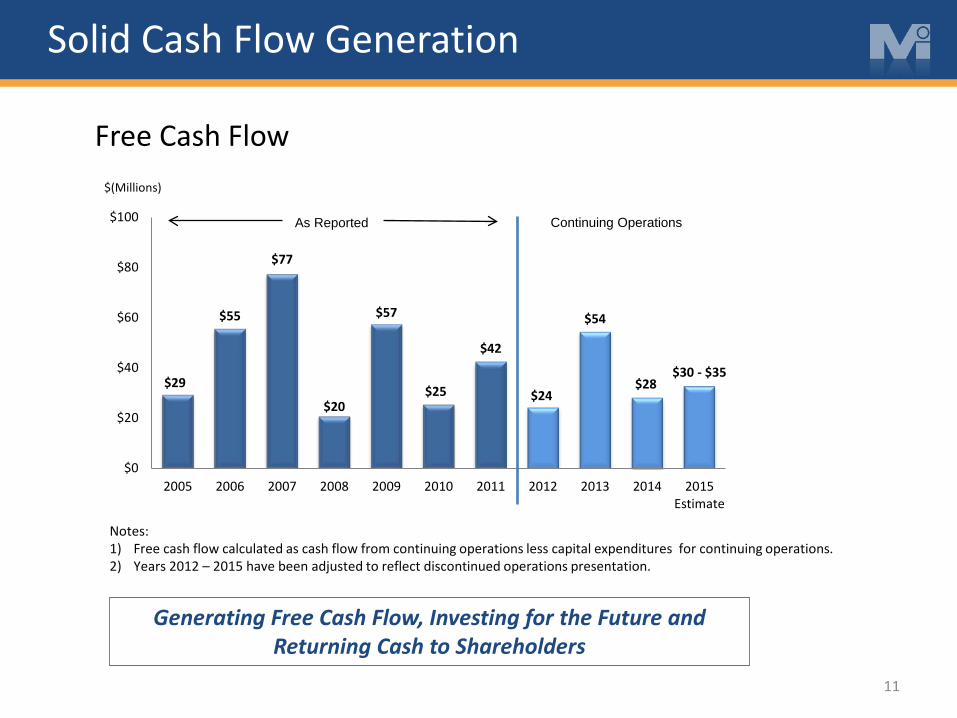
$29
$55
$77
$20
$57
$25
$42
$24
$54
$28$30 - $35
$0
$20
$40
$60
$80
$100
2005 2006 2007 2008 2009 2010 2011 2012 2013 2014 2015Estimate
Solid Cash Flow Generation
11
Notes: 1) Free cash flow calculated as cash flow from continuing operations less capital expenditures for continuing operations. 2) Years 2012 – 2015 have been adjusted to reflect discontinued operations presentation.
Generating Free Cash Flow, Investing for the Future and Returning Cash to Shareholders
$(Millions)
Free Cash Flow
As Reported Continuing Operations
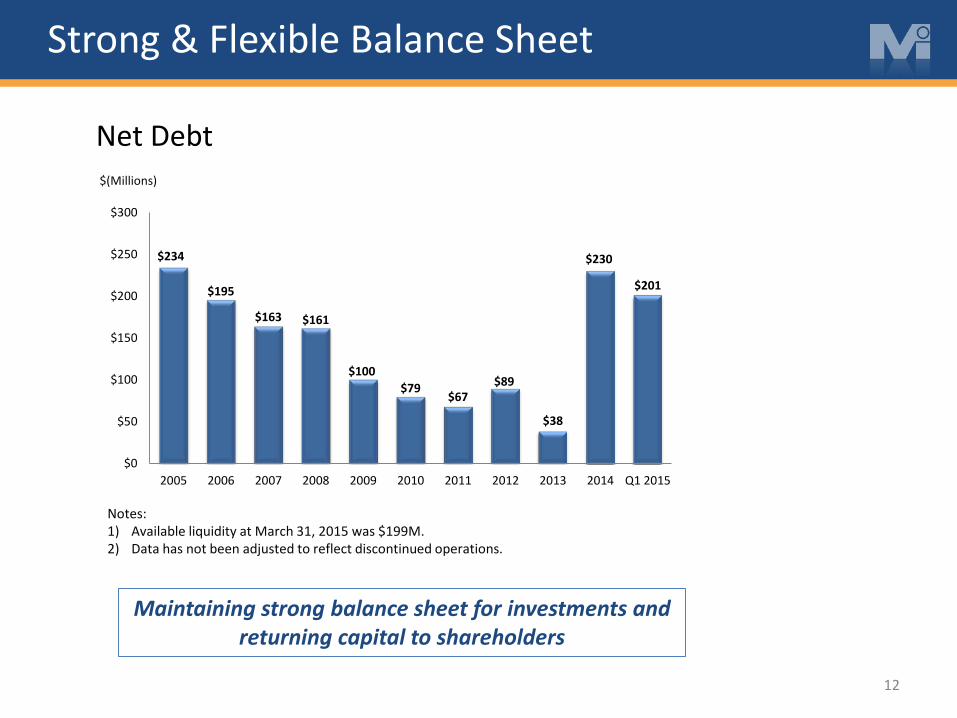
Strong & Flexible Balance Sheet
12
Notes: 1) Available liquidity at March 31, 2015 was $199M. 2) Data has not been adjusted to reflect discontinued operations.
Maintaining strong balance sheet for investments and returning capital to shareholders
Net Debt $(Millions)
$234
$195
$163 $161
$100$79
$67$89
$38
$230
$201
$0
$50
$100
$150
$200
$250
$300
2005 2006 2007 2008 2009 2010 2011 2012 2013 2014 Q1 2015

Balanced Approach to Capital Allocation
13
• Core markets • Adjacencies
• Dividends • Share repurchases • Debt reduction
Growth Through Acquisitions
Return Capital to Shareholders
Organic Growth • Reinvest in business • New product development • Process improvements
Investing for the future and returning cash to shareholders
• Market development
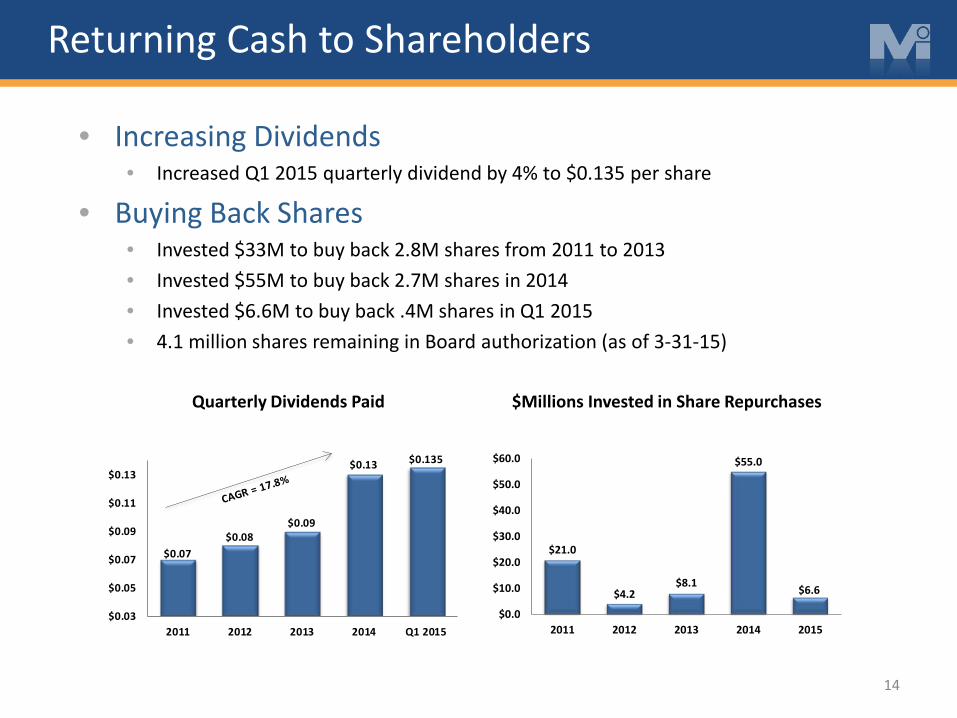
$0.07$0.08
$0.09
$0.13 $0.135
$0.03
$0.05
$0.07
$0.09
$0.11
$0.13
2011 2012 2013 2014 Q1 2015
Returning Cash to Shareholders
• Increasing Dividends • Increased Q1 2015 quarterly dividend by 4% to $0.135 per share
• Buying Back Shares • Invested $33M to buy back 2.8M shares from 2011 to 2013 • Invested $55M to buy back 2.7M shares in 2014 • Invested $6.6M to buy back .4M shares in Q1 2015 • 4.1 million shares remaining in Board authorization (as of 3-31-15)
14
Quarterly Dividends Paid $Millions Invested in Share Repurchases
$21.0
$4.2$8.1
$55.0
$6.6
$0.0
$10.0
$20.0
$30.0
$40.0
$50.0
$60.0
2011 2012 2013 2014 2015

Why Myers
15
• Realigned and refocused
• Enhanced platform to accelerate growth
• Strong market positions; plans to further penetrate expansion markets
• Financially strong; disciplined capital deployment
• Dedicated to enhancing shareholder value

Appendix
16

Management Team
John C. Orr, President & Chief Executive Officer • Named President and CEO May 2005 • Previously President and COO, responsible for global manufacturing and
distribution • Prior General Manager of Buckhorn • Previous 28 years with Goodyear, including Vice President of Manufacturing
for North America and Director of Manufacturing for Latin America Division
Gregg Branning, SVP, Chief Financial Officer & Corporate Secretary • Joined Myers as CFO in September 2012 • Previously VP of Finance and CFO of Danaher subsidiary, Thomson Industries,
a global industrial manufacturing business • Prior President of Danaher subsidiary, Accu-Sort, global developer and
manufacturer of technological products; also CFO of Joslyn Hi-Voltage • Prior to Danaher, 13 years with Hamilton Sundstrand & 7 in public accounting
17
More than 100 Years of Experience in Manufacturing

18
More than 100 Years of Experience in Manufacturing
Joel Grant, SVP & General Manager, Material Handling Segment • Named VP & General Manager, Material Handling Segment in November of 2010,
with his title changing to Senior VP & General Manager in July of 2011 • Previously Managing Director of Material Handling & GM of Buckhorn • Prior Director of Operations of Material Handling, Director of Sales & Marketing,
Buckhorn, and Director of Sales, Buckhorn • Over 13 years of experience with the Sonoco Products Company and seven years
with Continental Group of New York (division sold to Sonoco Products)
Alex Williamson, VP & General Manager, Distribution Segment • Joined Myers as VP & General Manager, Distribution Segment in June 2014 • Previously Co-President of Seaman Corporation • Held senior leadership positions at Noveon Inc. (now Lubrizol) • Over 24 years of experience in business management and an extensive background
in marketing, sales, chemistry, and product engineering
Management Team

19
More than 100 Years of Experience in Manufacturing
Michael Valentino, VP & General Manager, Myers do Brasil, Novel, Scepter & Ameri-Kart • Joined Myers as VP & General Manager, Myers do Brasil, Novel, Scepter and Ameri-Kart
in January 2015 • Previously spent over 15 years with The Marmon Group, a Berkshire Hathaway
Company, holding numerous leadership positions • Most recently served as sector president of Marmon Foodservice Technologies and
president of Prince Castle and Silver King • During tenure with The Marmon Group was instrumental in increasing shareholder
value by improving margins, optimizing resources and developing a pipeline of innovative new products
Management Team

Market Indicators
• Current shipment data is February 2015 at 2.5% growth
20
Material Handling
Source: Material Handling Industry (MHI) Feb 2015 Forecast

Market Indicators
• The Outdoor Power Equipment Institute (OPEI) estimates that total outdoor power equipment shipments will increase by 3.6% in 2015
21
Material Handling
Source: OPEI U.S. Econometric Forecast – December 2014
2009 2010 2011 2012 2013 2014 2015 2016Consumer Products 6,223,328 6,588,176 5,875,396 6,191,291 6,379,735 5,897,982 6,221,402 6,553,717
Percent Change -10.6 5.9 -10.8 5.4 3.0 -7.6 5.5 5.3
Commercial Products 131,050 180,226 183,609 182,817 221,200 224,227 238,675 253,264 Percent Change -34.4 37.5 1.9 -0.4 21.0 1.4 6.4 6.1
Handheld Products 10,558,563 10,825,352 10,365,472 10,921,443 10,909,630 11,149,771 11,430,870 11,679,547 Percent Change -7.9 2.5 -4.2 5.4 -0.1 2.2 2.5 2.2
Total 16,912,941 17,593,754 16,424,477 17,295,551 17,510,565 17,271,980 17,890,947 18,486,528 -9.1 4.0 -6.6 5.3 1.2 -1.4 3.6 3.3
ACTUAL FORECAST

Market Indicators
• Recreational vehicle market will continue to grow in 2015 but at a lower rate
22
Material Handling
Source: RVIA Release

Market Indicators
• The Rubber Manufacturers Association (RMA) projects a slight decrease in replacement tire shipments in 2015 (-0.4%).
23
Distribution
Source: JP Morgan, RMA
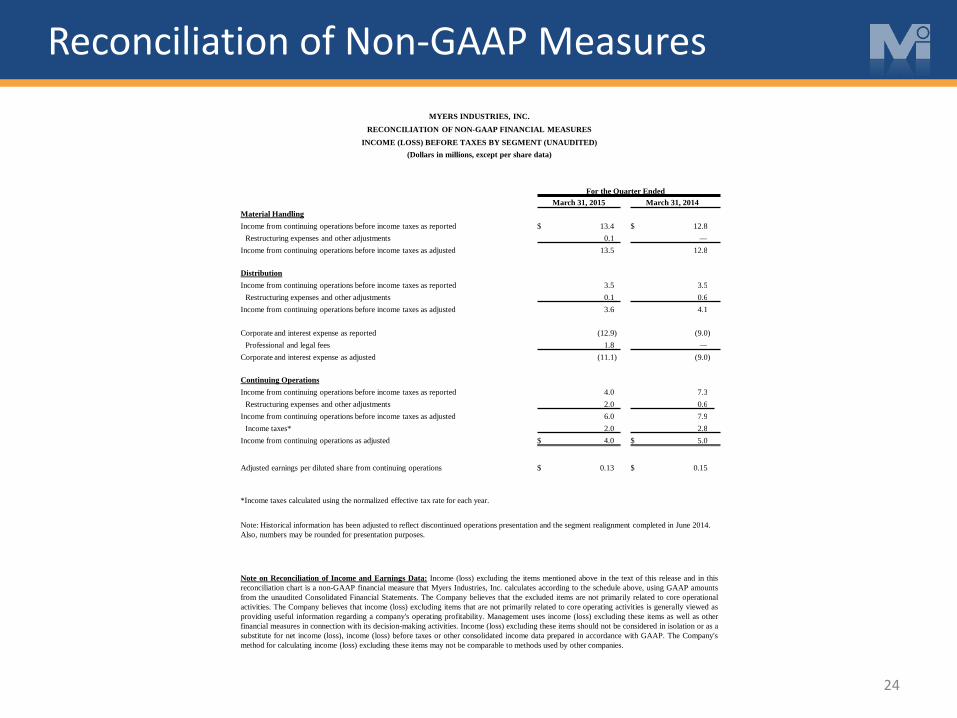
Reconciliation of Non-GAAP Measures
24
MYERS INDUSTRIES, INC. RECONCILIATION OF NON-GAAP FINANCIAL MEASURES
INCOME (LOSS) BEFORE TAXES BY SEGMENT (UNAUDITED) (Dollars in millions, except per share data)
For the Quarter Ended March 31, 2015 March 31, 2014 Material Handling Income from continuing operations before income taxes as reported $ 13.4 $ 12.8
Restructuring expenses and other adjustments 0.1 — Income from continuing operations before income taxes as adjusted 13.5 12.8 Distribution Income from continuing operations before income taxes as reported 3.5 3.5
Restructuring expenses and other adjustments 0.1 0.6 Income from continuing operations before income taxes as adjusted 3.6 4.1 Corporate and interest expense as reported (12.9 ) (9.0 )
Professional and legal fees 1.8 — Corporate and interest expense as adjusted (11.1 ) (9.0 ) Continuing Operations Income from continuing operations before income taxes as reported 4.0 7.3
Restructuring expenses and other adjustments 2.0 0.6 Income from continuing operations before income taxes as adjusted 6.0 7.9
Income taxes* 2.0 2.8 Income from continuing operations as adjusted $ 4.0 $ 5.0
Adjusted earnings per diluted share from continuing operations $ 0.13
$ 0.15
*Income taxes calculated using the normalized effective tax rate for each year.
Note: Historical information has been adjusted to reflect discontinued operations presentation and the segment realignment completed in June 2014. Also, numbers may be rounded for presentation purposes.
Note on Reconciliation of Income and Earnings Data: Income (loss) excluding the items mentioned above in the text of this release and in this reconciliation chart is a non-GAAP financial measure that Myers Industries, Inc. calculates according to the schedule above, using GAAP amounts from the unaudited Consolidated Financial Statements. The Company believes that the excluded items are not primarily related to core operational activities. The Company believes that income (loss) excluding items that are not primarily related to core operating activities is generally viewed as providing useful information regarding a company's operating profitability. Management uses income (loss) excluding these items as well as other financial measures in connection with its decision-making activities. Income (loss) excluding these items should not be considered in isolation or as a substitute for net income (loss), income (loss) before taxes or other consolidated income data prepared in accordance with GAAP. The Company's method for calculating income (loss) excluding these items may not be comparable to methods used by other companies.


![JA Knowledge Manager Manual-4.0.3 EDITED …...mYe"#$%&’("nopqr" s9tkuv]wxy" 567189":;](https://static.documents.pub/doc/80x56/5f1004517e708231d447077e/ja-knowledge-manager-manual-403-edited-myeanopqr.jpg)


