Nº 45 - January 2019 Economic GPS Tracking Wages vs inflation Zooming Variation analysis of local risk premium (2016-2018) Industry Roadmap 22nd Annual Global CEO Survey: CEO confidence mirrors caution. Global Coordinates What happened to the surplus in China’s current account? 04 07 08 13
Transcript
Nº 45 - January 2019
Economic GPS
TrackingWages vs inflation
ZoomingVariation analysis of local risk premium (2016-2018)
Industry Roadmap 22nd Annual Global CEO Survey: CEO confidence mirrors caution.
Global CoordinatesWhat happened to the surplus in China’s current account?
04
07
08
13
The year 2019 has dawned and we hope that unlike 2018, which started with great optimism and ended with a strong economic contraction, this year can follow the reverse path and the poor initial performance gradually gives way to economic recovery.
At international level, 2019 seems to offer a better prospect for Argentina than 2018 did. The change in expectations
about the behavior of interest rates in the United States has caused capital flows to start reversing toward the emerging markets. In addition, the estimated harvest for the current farming season allows to foresee that the generation of foreign currency revenues in the early months of the year will exceed that of 2018, and the Brazilian economy will at last fuel our exports.
As mentioned on other occasions, the level of activity is likely to exhibit a different pace in each of the various sectors and regions of our country, tending to uniformity after having produced a gradual effect on the level of consumption.
On the other side, 2019 being an election year, with the passing of months we could expect certain increase in volatility of macroeconomic (especially financial and monetary) variables, as long as the uncertainty as to the outcome of the election is not solved.
Therefore, the sustained recovery predicted at the opening of this leading article will require not only strict adherence to a commitment to fiscal adjustment but also a monetary policy managed in a way to avoid past mistakes. Further, even in an election year, government policy should resist the luring siren song of controlling inflationary pressure by allowing a foreign exchange appreciation beyond the possibilities of sustaining the balance of the external sector both in the medium and long term.
José María SeguraChief Economist PwC Argentina
Don't yield to the siren song
Summary
Wages vs inflation 0422nd Annual Global CEO Survey: CEO confidence mirrors caution 07Variation analysis of local risk premium (2016-2018) 08What happened to the surplus in China’s current account? 13
Monitors 14Table of indicators 15Our services. Contacts. 16
TrackingWages vs inflation
The higher inflation rate during 2018 eroded the purchasing power of wage earners. However, depending on the trade union and/or sector, variations in the purchasing power of wages have differed significantly.
Zooming
Variation analysis of local risk premium (2016-2018)The higher the risk of a bond or investment, the higher the expected yield, and the lower its price. This is a basic concept in finance. There are all kinds of macro and microeconomic risks in the stock markets, such as those related to financial, exchange, economic, political, psychological and other issues. During 2018, the prices of emerging market financial instruments, particularly the Argentine financial instruments, recorded significant decreases due to a mix of risks perceived by international investors.
Industry Roadmap 22nd Annual Global CEO Survey: CEO confidence mirrors caution.
Presented the survey at the World Economic Forum in Davos, the study conveys the sensations and perceptions of companies' leaders, who expressed their caution in the face of global economic uncertainty and the volatility of the markets in which they operate. Nearly 30% believe that global economic growth will decrease over the next 12 months.
Global CoordinatesWhat happened to the surplus in China’s current account? After almost 20 years of accumulating and then reducing the largest current account surplus worldwide, China’s external account recorded a deficit in Q1 2018.
04 07
Economic GPS
13
08
4
Tracking
The higher inflation rate during 2018 eroded the purchasing power of wage earners. However, depending on the trade union and/or sector, variations in the purchasing power of wages have differed significantly.
The year 2018 ended with a cumulative price increase of 47.6%. This increase reflects an average, but the different components increased in different manners. On the one side, rate adjustments continued to apply, mainly those related to transport which had been postponed during 2017. On the other side, there was a substantial impact due to the transfer onto prices of the exchange rate devaluation: 114% in that period.
The largest increases in gas, electricity and transport rates occurred in the months of February, April, August and October, while the most significant exchange rate variations took place in June, July, September and October.Transport headed the price increases during the year, with a year-on-year increase of 66.8%, followed by communications (55.3%) and other goods and services (53.2%). Foodstuffs and non-alcoholic beverages increased 51.2%. Alcoholic beverages and tobacco increased 28.3% and education, 32%.
The year 2018 started with an optimistic outlook for annual price increases of less than 20% year-on-year, and so did the wage bargaining agreements. However, the price escalation as from the second half of the year led to a decline in the wage earners’ purchasing power, except for some retail sectors.
Wages vs inflation
1 F.T.C.I.O.D y A.R.A - Argentine Federation of Oilseeds Industrial Complex Workers, Cotton Farmers and the Like.² Gas Station Workers, La Bancaria, FAECyS, F.T.C.I.O.D y A.R.A, UTEDyC, FOEVA, SUPEH, UOCRA, FGPIC, La Fraternidad3 La Bancaria, F.T.C.I.O.D y A.R.A, SUPEH, FATSA.
Source: Prepared by the authors based on BCRA and INDEC
Source: Prepared by the authors based on BCRA and INDEC
Graphic 1: December 17=1 index, CPI and exchange rate
Graphic 2: Monthly variation in CPI and its components
Table 1 considers 16 wage bargaining agreements approved by the Ministry/Secretariat of Labor, including some of the most important agreements because of the number of enrollees or because they serve as a reference for other wage negotiations. As it can be seen, only the cooking oil industry workers, F.T.C.I.O.D y A.R.A1, managed to overcome inflation, while the bank workers’ union was hardly below the level of inflation. Graphic 3 shows
wages above the level of inflation in the first months of the year, when wage negotiations commenced, but they lagged behind when inflation began to spiral in July. More precisely in April, ten2 of the 16 trade unions under consideration had managed to align with inflation, and just four of them had done it by July3. Towards December, only the cooking oil sector could get a pay rise to compensate for the price rise.
CPI general level Seasonal prices Core prices Regulated prices
Economic GPS
5
Source: Prepared by the authors based on statistics from trade unions, the Secretariat of Labor, and INDEC.
Chart 1: Wage increases at December 2018
Source: Prepared by the authors based on statistics from trade unions and the Secretariat of Labor
Note: F.T.C.I.O.D y A.R.A - Argentine Federation of Oilseeds Industrial Complex Workers, Cotton Farmers and the Like. La Bancaria (Collective Bargaining Agreement (CCT) 18/75: Employees of national, provincial, municipal state-owned and privately held banks nationwide). SUPEH - United Oil and Hydrocarbon Unions. FATSA - Argentine Federation of Health Care Workers’ Associations (Collective Bargaining Agreement 120/75: Technical and Administrative Workers of Drugstores in General). UOCRA - Argentine Construction Workers’ Union. FGPIC - Union Federation of Meat Industry Workers. La Fraternidad – Argentine Union of Train Drivers (La Fraternidad). UTEDyC - Sports Centers and Civil Entities Workers’ Union (Collective Bargaining Agreement 736/16: CIVIL ENTITIES AND SPORTS CENTERS). Gas Station Workers. FAECyS - Argentine Federation of Trade and Services Employees/ Teamsters /UATRE - Argentine Union of Rural Workers and Stevedores/ FOEVA - Federation of Wine Industry Workers and Employees and the Like (Collective Bargaining Agreement 154/91: Vineyards Workers). UTA - Motorcar and Subway Drivers Union (Collective Bargaining Agreement 460/73: Short and Middle Distance Bus Drivers). UPACP – Maids’ Union. UOM - Metal Workers’ Union.* They agreed to a bonus of $7,000 payable in two months (Dec18 and Feb19), while the government issued a decree for a $5,000 bonus** Extraordinary payment in a fixed amount per job title during October/November/December***Health Day**** two payments: $1,500 in March and $4,000 in August
Graphic 3: December 17=100 index - Wages per trade union and CPI
Trade Union Sector YoY increase Retroactive to 2017, due to the loss of the purchasing power
Fixed amounts (excluding the $5,000 bonus payable under a presidential decree)
F.T.C.I.O.D y A.R.A Cooking oil industry workers 55% 26,987 -
La Bancaria Bank Workers 46% 4.43% -
SUPEH Fuel 40% - -
FATSA Health Care 39% - 1,237***
UOCRA Construction 37% - -
FGPIC Meat - Foodstuffs 36% - 1,000*
La Fraternidad Train drivers - Transport 32% - $1,500 to $3,000**
UTEDyC Sports centers workers - Recreational and cultural activities
30% - -
Gas station workers Gas stations - Transport 30% - -
FAECyS Trade 28% - -
Teamsters Transport 27% - -
UATRE Rural workers 26% - -
FOEVA Wineries and Wines - Beverages 25% - -
UTA Short and middle distance bus drivers - Transport
Gas station workers La bancaria FAECyS F.T.C.I.O.D y A.R.A UTEDyC
FOEVA UTA SUPEH UOCRA UOM
Teamsters FGPIC La Fraternidad UPACP FATSA
UATRE CPI
6
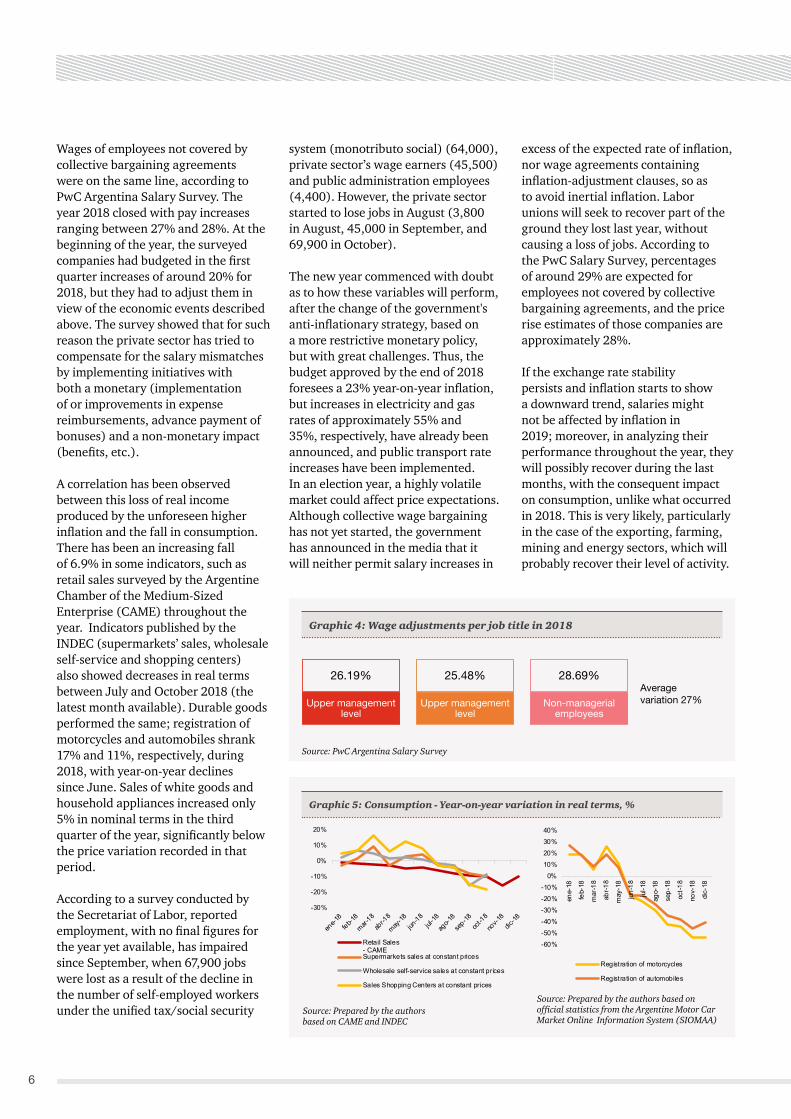
Wages of employees not covered by collective bargaining agreements were on the same line, according to PwC Argentina Salary Survey. The year 2018 closed with pay increases ranging between 27% and 28%. At the beginning of the year, the surveyed companies had budgeted in the first quarter increases of around 20% for 2018, but they had to adjust them in view of the economic events described above. The survey showed that for such reason the private sector has tried to compensate for the salary mismatches by implementing initiatives with both a monetary (implementation of or improvements in expense reimbursements, advance payment of bonuses) and a non-monetary impact (benefits, etc.).
A correlation has been observed between this loss of real income produced by the unforeseen higher inflation and the fall in consumption. There has been an increasing fall of 6.9% in some indicators, such as retail sales surveyed by the Argentine Chamber of the Medium-Sized Enterprise (CAME) throughout the year. Indicators published by the INDEC (supermarkets’ sales, wholesale self-service and shopping centers) also showed decreases in real terms between July and October 2018 (the latest month available). Durable goods performed the same; registration of motorcycles and automobiles shrank 17% and 11%, respectively, during 2018, with year-on-year declines since June. Sales of white goods and household appliances increased only 5% in nominal terms in the third quarter of the year, significantly below the price variation recorded in that period.
According to a survey conducted by the Secretariat of Labor, reported employment, with no final figures for the year yet available, has impaired since September, when 67,900 jobs were lost as a result of the decline in the number of self-employed workers under the unified tax/social security
system (monotributo social) (64,000), private sector’s wage earners (45,500) and public administration employees (4,400). However, the private sector started to lose jobs in August (3,800 in August, 45,000 in September, and 69,900 in October).
The new year commenced with doubt as to how these variables will perform, after the change of the government's anti-inflationary strategy, based on a more restrictive monetary policy, but with great challenges. Thus, the budget approved by the end of 2018 foresees a 23% year-on-year inflation, but increases in electricity and gas rates of approximately 55% and 35%, respectively, have already been announced, and public transport rate increases have been implemented. In an election year, a highly volatile market could affect price expectations. Although collective wage bargaining has not yet started, the government has announced in the media that it will neither permit salary increases in
excess of the expected rate of inflation, nor wage agreements containing inflation-adjustment clauses, so as to avoid inertial inflation. Labor unions will seek to recover part of the ground they lost last year, without causing a loss of jobs. According to the PwC Salary Survey, percentages of around 29% are expected for employees not covered by collective bargaining agreements, and the price rise estimates of those companies are approximately 28%.
If the exchange rate stability persists and inflation starts to show a downward trend, salaries might not be affected by inflation in 2019; moreover, in analyzing their performance throughout the year, they will possibly recover during the last months, with the consequent impact on consumption, unlike what occurred in 2018. This is very likely, particularly in the case of the exporting, farming, mining and energy sectors, which will probably recover their level of activity.
Source: PwC Argentina Salary Survey
Source: Prepared by the authors based on CAME and INDEC
Graphic 4: Wage adjustments per job title in 2018
Graphic 5: Consumption - Year-on-year variation in real terms, %
Source: Prepared by the authors based on official statistics from the Argentine Motor Car Market Online Information System (SIOMAA)
26.19%
Upper management level
25.48% 28.69%
Upper management level
Non-managerial employees
Average variation 27%
-30%
-20%
-10%
0%
10%
20%
Retail Sales- CAMESupermarkets sales at constant prices
Wholesale self-service sales at constant prices
Sales Shopping Centers at constant prices
-60%-50%-40%-30%-20%-10%
0%10%20%30%40%
ene-
18
feb-
18
mar
-18
abr-1
8
may
-18
jun-
18
jul-1
8
ago-
18
sep-
18
oct-1
8
nov-
18
dic-
18
Registration of motorcycles
Registration of automobiles
Economic GPS
Industry Roadmap22nd Annual Global CEO Survey: CEO confidence mirrors caution.
7
A few days ago, we announced the results of the 22nd Annual Global CEO Survey in which 1,378 executives from 35 industries and 91 countries participated. These figures represent a contrast with the previous edition in terms of the leaders' confidence in all regions of the world.
Bob Moritz, global president of PwC, presented the survey at the World Economic Forum in Davos. The study conveys the sensations and perceptions of companies' leaders, who expressed their caution in the face of global economic uncertainty and the volatility of the markets in which they operate. Nearly 30% believe that global economic growth will decrease over the next 12 months.
This decline in optimism affected growth plans, beyond the borders of their own countries. The United States, for example, holds its position as the main market for growth with 27%, when in the previous number the percentage was 46%. China, the second most influential market, also saw its attractiveness fall, from 33% in 2018 to 24%.
If we try to infer the reasons for this decline in confidence, we will surely have to refer to the increase in trade tensions between the United States and China, the Brexit in Europe, the growth of protectionism and also the concerns that increased the most with respect to 2018 relating to the volatility of the exchange rates (23 points), volatility in the price of raw materials (12 points) and uncertain economic growth (10 points).
As for Argentine businessmen, a curious and mathematical division of 50/50 exists; while half of the respondents voiced some level of confidence (31% "somewhat confident" plus 19% "very confident"), exactly the other half expressed the opposite (35% "not very confident" plus 15% "no trust at all"), when in 2018, the confidence level reached a record of 94% (between the "very confident" and the "somewhat confident") .
The reasons for this loss of confidence in our country lay in the volatility of the currency, high interest rates and inflation rates that do not give way.
When consulted by their specific concerns, the following position on the podium of the Argentine CEOs: volatility in exchange rates (96%), increase in tax burden (94%) and political uncertainty (94% - this is the first time this item is included in the survey -).
In 2018, the current government strengthened the dialogue with the world to encourage the arrival of investments. The highest manifestation of this objective was hosting the G20, where several bilateral trade agreements were concluded. In addition, the country was recategorized as an 'emerging market', which is expected to positively impact confidence.
Towards the foreseeable future, facing the challenges posed, the organizations will be "looking inward", focusing on their strengths and weaknesses to develop strategies that allow them to take advantage of opportunities and face threats. Eight out of ten Argentine CEOs will focus on operational efficiency and more than half plan to grow organically by launching new products or services.
While the major markets are in a commercial conflict and face a volatile international context, regions such as Latin America, including our country, offer a valid alternative to invest. Although business optimism falls and only half of respondents believe that the economy will improve in 2019, in the coming months we expect to be able to balance financial variables and inflation at levels more compatible with the growth of the economy.
By Martín Barbafina, partner responsible for the Markets and Communications area in PwC Argentina.
8
Zooming
Variation analysis of local risk premium (2016-2018)
8
The higher the risk of a bond or investment, the higher the expected yield, and the lower its price. This is a basic concept in finance. There are all kinds of macro and microeconomic risks in the stock markets, such as those related to financial, exchange, economic, political, psychological and other issues. During 2018, the prices of emerging market financial instruments, particularly the Argentine financial instruments, recorded significant decreases due to a mix of risks perceived by international investors.
The purpose of this report is to analyze on an aggregated basis the risk premium implicit in the corporate bonds issued by Argentine companies during the period 2016-2018. A second analysis seeks to compare that risk premium with the one shown by companies located in other Latin American countries, such as Mexico and Chile, with a view to finding out differences and similarities between the risk premium trends followed by the three countries.
Introduction
In 2018, the financial markets were volatile and more risk averse in view of a considerable, though expected, increase in interest rates by the US Federal Reserve (“FED”) and an increasing fear for a trade war between the USA and China. This situation produced a material fly-to-quality effect worldwide, with investors selling the highest risk assets and investing in safer instruments, such as US Treasury Bonds. In this international context,
and considering the usual uncertainty locally, as well as the doubt about the local macroeconomic fundamentals, Argentine bonds (both sovereign and corporate bonds) were sold by international investors, with the consequent fall in the prices of these instruments.
To understand the reasons for the decline in the prices of those instruments, it is important to understand how a bond operates and what are the risks affecting their price/yield.
First, a bond is a debt instrument that obliges its issuer1 to repay investor the amount lent plus interest on that instrument over a certain period of time. Likewise, the yield on a bond is the interest rate that will make the present value of cash flows generated by that investment (coupons plus amount) be equal to the price of the bond. This yield is also known as Rate of Return (“YTM”). In general terms, the price of a bond can be calculated using the following formula:
Where:P = Pricen = the number of time periodsC = Couponi = interest rateM = the amount to be repaid at period endt = the time period over which payment of the coupon or final amount is made.
𝑃 = �𝐶
1 + 𝑖 𝑡 +𝑛
𝑡=1
𝑀1 + 𝑖 𝑛
Thus, whenever the market interest rate increases (decreases), the price of the bond decreases (increases) to balance its yield with the new market equilibrium.
Bonds may expose investors to different types of risks (interest rate risk, inflation risk, exchange rate risk, liquidity risk, credit risk, psychological risk and political risk, among others). Investors will assume these risks to the extent that the instrument compensates them for tolerating an extra risk, compared to the risk tolerated by an individual who invests in a risk-free asset, that is, through the offer of an extra return, or a lower price. This extra return is known as risk premium.
1 In general, there are three types of bond issuers: the federal government and its agencies, the provincial and municipal governments, and privately-held corporations.
Economic GPS
9
Analysis
Below is an analysis of the variations in the risk premium of corporate bonds in Argentina over the last few years.
For the purposes of this analysis, a search was made on Thomson Reuters Eikon information system of corporate bonds in United States dollars issued by Argentine companies2, which had information of public domain available between June 30, 20163 and December 31, 2018 and with maturities between 3 and 7 years at June 30, 2016.
After the financial instruments have
2 Banking and financial institutions were excluded from this analysis, for they operate in sectors that have specific regulations on the risk profile they can assume.3 After the agreement with investment funds (Holdouts).4 CDS are financial contracts whereby a buyer of debt instruments pays a rate applicable to a certain principal amount, to secure such principal in the event of default on a debt instrument issued by a third party. Thus, a country's CDS determines the rate that is to be paid on a given principal amount on sovereign debt bonds issued by that country as security for their non-payment. CDS are a good indicator of the nations’ sovereign risk premium insofar as they approximate the yield spread on their bonds compared to sovereign debt bonds issued by countries considered as risk-free countries, as required for their placement in the market.5 LIBOR (London Inter Bank Offered Rate) is a daily benchmark rate based on the interest rates at which banks offer unsecured funds to other banks in the wholesale money market or interbank market.
Source: Prepared by the authors based upon statistics obtained from Thomson Reuters Eikon.
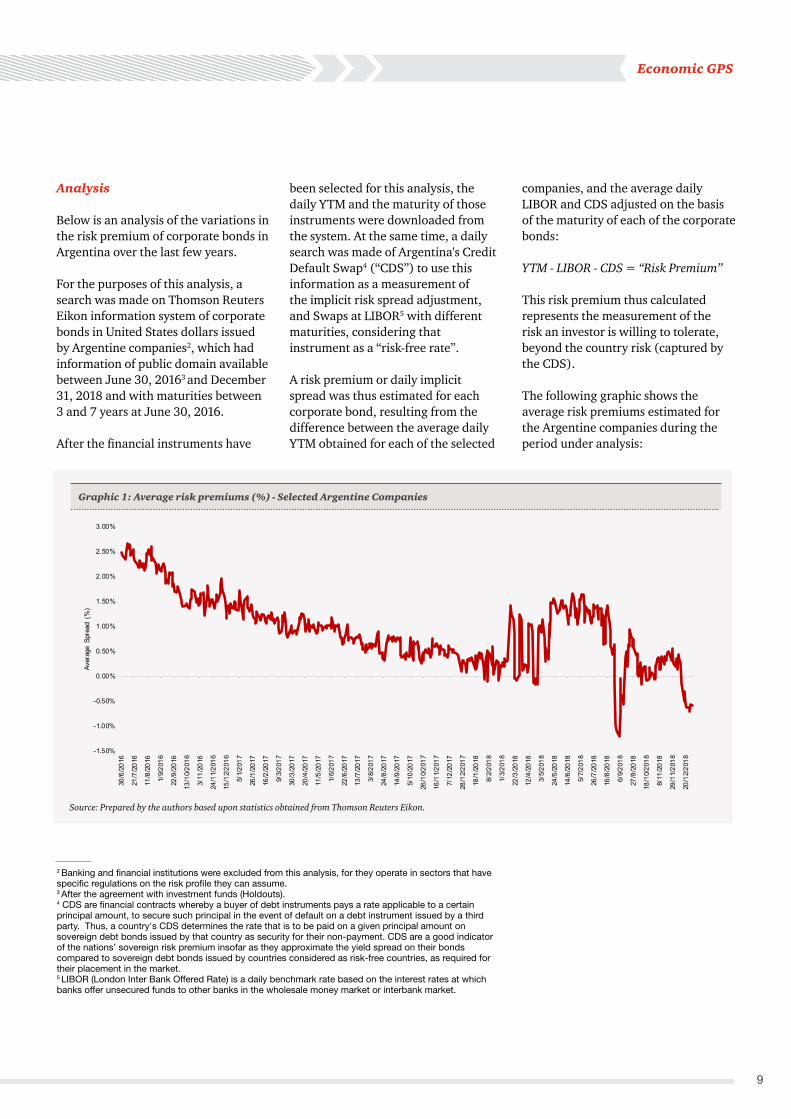
Graphic 1: Average risk premiums (%) - Selected Argentine Companies
been selected for this analysis, the daily YTM and the maturity of those instruments were downloaded from the system. At the same time, a daily search was made of Argentina's Credit Default Swap4 (“CDS”) to use this information as a measurement of the implicit risk spread adjustment, and Swaps at LIBOR5 with different maturities, considering that instrument as a “risk-free rate”.
A risk premium or daily implicit spread was thus estimated for each corporate bond, resulting from the difference between the average daily YTM obtained for each of the selected
companies, and the average daily LIBOR and CDS adjusted on the basis of the maturity of each of the corporate bonds:
YTM - LIBOR - CDS = “Risk Premium”
This risk premium thus calculated represents the measurement of the risk an investor is willing to tolerate, beyond the country risk (captured by the CDS).
The following graphic shows the average risk premiums estimated for the Argentine companies during the period under analysis:
-1.50%
-1.00%
-0.50%
0.00%
0.50%
1.00%
1.50%
2.00%
2.50%
3.00%
30/6
/201
6
21/7
/201
6
11/8
/201
6
1/9/
2016
22/9
/201
6
13/1
0/20
16
3/11
/201
6
24/1
1/20
16
15/1
2/20
16
5/1/
2017
26/1
/201
7
16/2
/201
7
9/3/
2017
30/3
/201
7
20/4
/201
7
11/5
/201
7
1/6/
2017
22/6
/201
7
13/7
/201
7
3/8/
2017
24/8
/201
7
14/9
/201
7
5/10
/201
7
26/1
0/20
17
16/1
1/20
17
7/12
/201
7
28/1
2/20
17
18/1
/201
8
8/2/
2018
1/3/
2018
22/3
/201
8
12/4
/201
8
3/5/
2018
24/5
/201
8
14/6
/201
8
5/7/
2018
26/7
/201
8
16/8
/201
8
6/9/
2018
27/9
/201
8
18/1
0/20
18
8/11
/201
8
29/1
1/20
18
20/1
2/20
18
Aver
age
Spre
ad (
%)
1010
The graphic 1 shows certain stability in the volatility risk premium during the first 1.5-year period analyzed, and it has followed a downward trend. As from 2018, more highly volatile premiums are noted, which relates to the economic volatility experienced during that year.
In general, relatively stable risk premiums would be expected in relatively short periods of time.
The graphic 2 details the evolution of YTM, LIBOR, CDS and the average risk premium of Argentine corporate bonds included in this analysis.
Source: Prepared by the authors based upon statistics obtained from Thomson Reuters Eikon..
The graphic 2 shows that until the beginning of 2018, the average distance between YTM and CDS remained relatively stable, both of them with a downward trend (especially in the case of YTM), within a context of economic recovery in Argentina, with an increase in investments. The calculated risk premium also showed a slight fall and low volatility.
-2%
0%
2%
4%
6%
8%
10%
12%
YTM (Average) CDS (Average) Libor (Average) Average Spread (Diference)
Economic GPS
11
In other words, in periods of relative calm in the financial markets and economic growth, the average yield on an Argentine corporate bond has a country risk component and a risk component specific to the sector/industry/company.
However, in periods of foreign exchange and economic turbulence, as it occurred in the second half of 2018, the yield on corporate bonds tends to be exclusively dominated by the CDS movement, taking to a second place the risk inherent in the sector/industry/company, which sometimes seems to be even lower than country risk. This behavior, which would seem to contradict the theory, can relate to the domestic capital market failures, such as the small volumes traded on the local financial market that imposes certain limitations on liquidity, and prevent corporate bonds from adjusting their yield as fast as sovereign bonds.
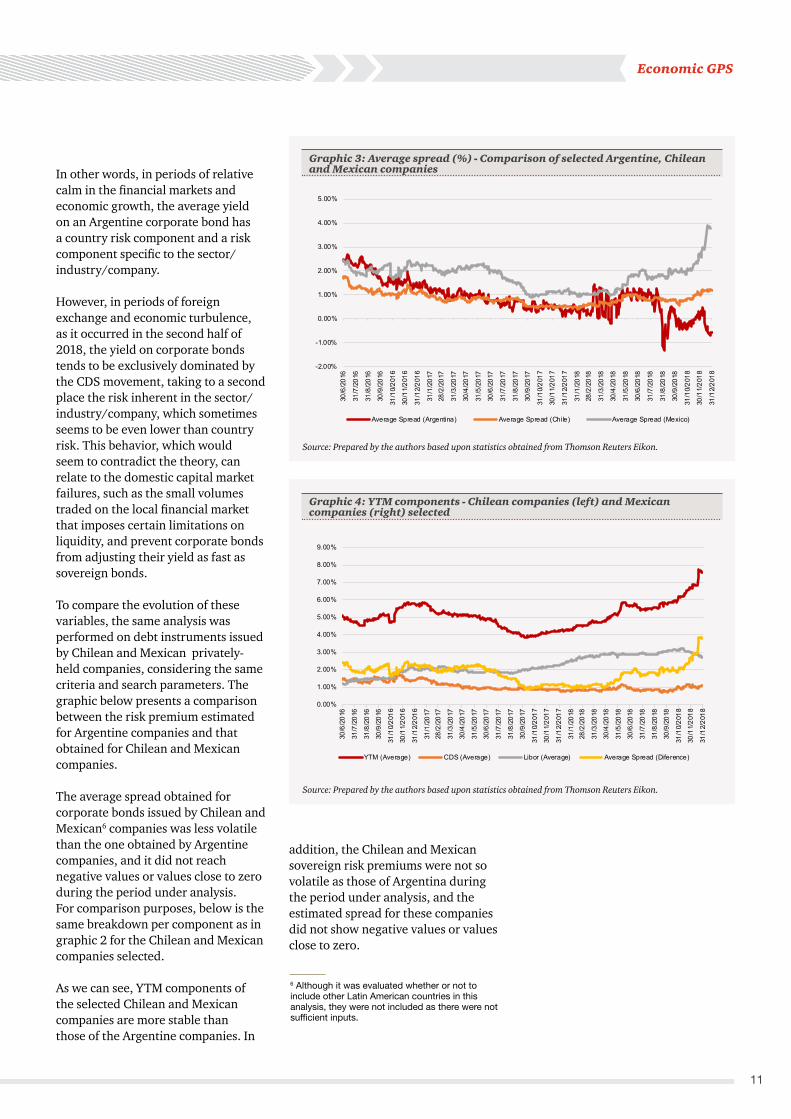
To compare the evolution of these variables, the same analysis was performed on debt instruments issued by Chilean and Mexican privately-held companies, considering the same criteria and search parameters. The graphic below presents a comparison between the risk premium estimated for Argentine companies and that obtained for Chilean and Mexican companies.
The average spread obtained for corporate bonds issued by Chilean and Mexican6 companies was less volatile than the one obtained by Argentine companies, and it did not reach negative values or values close to zero during the period under analysis.For comparison purposes, below is the same breakdown per component as in graphic 2 for the Chilean and Mexican companies selected.
As we can see, YTM components of the selected Chilean and Mexican companies are more stable than those of the Argentine companies. In
Source: Prepared by the authors based upon statistics obtained from Thomson Reuters Eikon.
Source: Prepared by the authors based upon statistics obtained from Thomson Reuters Eikon.
Graphic 3: Average spread (%) - Comparison of selected Argentine, Chilean and Mexican companies
addition, the Chilean and Mexican sovereign risk premiums were not so volatile as those of Argentina during the period under analysis, and the estimated spread for these companies did not show negative values or values close to zero.
6 Although it was evaluated whether or not to include other Latin American countries in this analysis, they were not included as there were not sufficient inputs.
-2.00%
-1.00%
0.00%
1.00%
2.00%
3.00%
4.00%
5.00%
30/6
/201
6
31/7
/201
6
31/8
/201
6
30/9
/201
6
31/1
0/20
16
30/1
1/20
16
31/1
2/20
16
31/1
/201
728
/2/2
017
31/3
/201
7
30/4
/201
7
31/5
/201
7
30/6
/201
7
31/7
/201
7
31/8
/201
7
30/9
/201
7
31/1
0/20
17
30/1
1/20
17
31/1
2/20
17
31/1
/201
828
/2/2
018
31/3
/201
8
30/4
/201
8
31/5
/201
8
30/6
/201
8
31/7
/201
8
31/8
/201
8
30/9
/201
8
31/1
0/20
18
30/1
1/20
18
31/1
2/20
18
Average Spread (Argentina) Average Spread (Chile) Average Spread (Mexico)
0.00%
1.00%
2.00%
3.00%
4.00%
5.00%
6.00%
7.00%
8.00%
9.00%
30/6
/201
6
31/7
/201
6
31/8
/201
6
30/9
/201
6
31/1
0/20
16
30/1
1/20
16
31/1
2/20
16
31/1
/201
728
/2/2
017
31/3
/201
7
30/4
/201
7
31/5
/201
7
30/6
/201
7
31/7
/201
7
31/8
/201
7
30/9
/201
7
31/1
0/20
17
30/1
1/20
17
31/1
2/20
17
31/1
/201
828
/2/2
018
31/3
/201
8
30/4
/201
8
31/5
/201
8
30/6
/201
8
31/7
/201
8
31/8
/201
8
30/9
/201
8
31/1
0/20
18
30/1
1/20
18
31/1
2/20
18
YTM (Average) CDS (Average) Libor (Average) Average Spread (Diference)
12
Final thoughts
According to the economic theory, the yield on a financial instrument depends on the risks it faces. In the analysis disclosed in this report, it was simply assumed that the yield on certain corporate bonds is equal to the algebraic sum of a “risk-free rate”, a sovereign risk premium and a spread that considers several factors specific to the issuer.
In 2018, many events occurred locally and internationally had an impact on the price of emerging market financial assets, particularly the Argentine instruments. According to the information collected for this analysis, it can be seen that in a more volatile and uncertain economic context at a local level, the yield on corporate bonds tends to be dominated mainly by Argentina’s country risk and not by factors that are specific to the issuers of those bonds. The risk premium of the sector/industry/company showed an excessive volatility and little information regarding the risk of that sector/industry/company.
Consequently, the reduction and stabilization of the country risk premium would be extremely important for financing of the private sector, as it would enable its participants to obtain funds from local and international debt markets at a lower interest rate. Moreover, it would enable investors to have a better perception of the risk in local businesses, with the consequent improvement in the process of decision-making and measurement of the expected return on investment.
Economic GPS
13
Global CoordinatesGlobal Coordinates: What happened to the surplus in China’s current account?After almost 20 years of accumulating and then reducing the largest current account surplus worldwide, China’s external account recorded a deficit in Q1 2018.
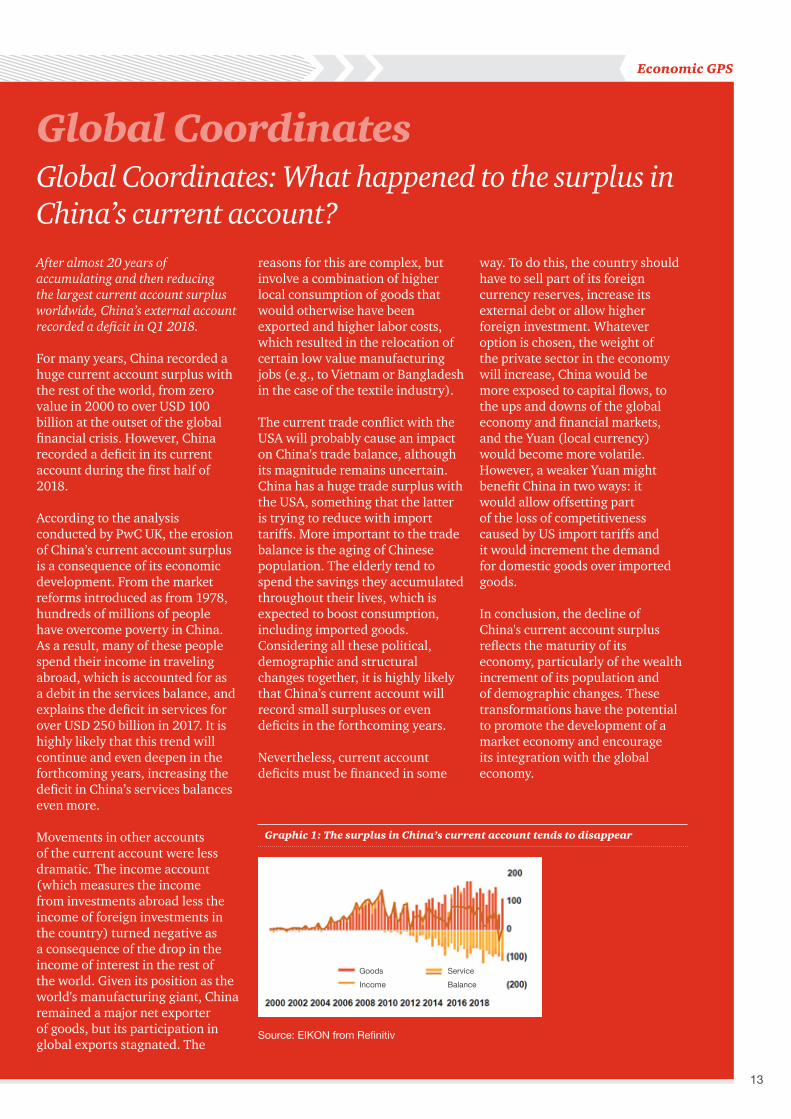
For many years, China recorded a huge current account surplus with the rest of the world, from zero value in 2000 to over USD 100 billion at the outset of the global financial crisis. However, China recorded a deficit in its current account during the first half of 2018.
According to the analysis conducted by PwC UK, the erosion of China’s current account surplus is a consequence of its economic development. From the market reforms introduced as from 1978, hundreds of millions of people have overcome poverty in China. As a result, many of these people spend their income in traveling abroad, which is accounted for as a debit in the services balance, and explains the deficit in services for over USD 250 billion in 2017. It is highly likely that this trend will continue and even deepen in the forthcoming years, increasing the deficit in China’s services balances even more.
Movements in other accounts of the current account were less dramatic. The income account (which measures the income from investments abroad less the income of foreign investments in the country) turned negative as a consequence of the drop in the income of interest in the rest of the world. Given its position as the world's manufacturing giant, China remained a major net exporter of goods, but its participation in global exports stagnated. The
reasons for this are complex, but involve a combination of higher local consumption of goods that would otherwise have been exported and higher labor costs, which resulted in the relocation of certain low value manufacturing jobs (e.g., to Vietnam or Bangladesh in the case of the textile industry).
The current trade conflict with the USA will probably cause an impact on China's trade balance, although its magnitude remains uncertain. China has a huge trade surplus with the USA, something that the latter is trying to reduce with import tariffs. More important to the trade balance is the aging of Chinese population. The elderly tend to spend the savings they accumulated throughout their lives, which is expected to boost consumption, including imported goods. Considering all these political, demographic and structural changes together, it is highly likely that China’s current account will record small surpluses or even deficits in the forthcoming years.
Nevertheless, current account deficits must be financed in some
way. To do this, the country should have to sell part of its foreign currency reserves, increase its external debt or allow higher foreign investment. Whatever option is chosen, the weight of the private sector in the economy will increase, China would be more exposed to capital flows, to the ups and downs of the global economy and financial markets, and the Yuan (local currency) would become more volatile. However, a weaker Yuan might benefit China in two ways: it would allow offsetting part of the loss of competitiveness caused by US import tariffs and it would increment the demand for domestic goods over imported goods.
In conclusion, the decline of China's current account surplus reflects the maturity of its economy, particularly of the wealth increment of its population and of demographic changes. These transformations have the potential to promote the development of a market economy and encourage its integration with the global economy.
Graphic 1: The surplus in China’s current account tends to disappear
Goods Service
BalanceIncome
Source: EIKON from Refinitiv
Spot
Jun - 19Mar - 19
Sep - 19
CPI*
Inflation Exchange rate: spot and futures
Reserves and Central Bank Assets
Income and Expenses of the National Non-Financial Public Sector
Foreign Trade
Monthly Industrial EstimatorReal Exchange Rate Index: base Dec-99=1
Source: own calculations based on Central BankSource: own calculations based on CBOT y WTI NYMEX
Source: own calculations based on the Argentine Central Bank Source: own calculations based on INDEC
Source: own calculations based on Secretary of FinanceSource: own calculations based on INDEC
Source: Own calculations based on CPI Congress and UTD*CPI Congress. As of November 2016 it is considered CPI City of Buenos Aires
Source: Own calculations based on Rofex
Price of Soy and Oil, index2004=100
Inflation prospects
Reserves, USD mn, end of period Reserves/AssetsPublic Sector Assets/Assets
* Quarterly figure. The year corresponds to Q4** includes intrasector public interest*** data 2012/13/14 corresponds to the daily weighted average of December**** One moth Future contracts, period averagep: provisional
Source: INDEC, Secretary of Finance, Ministy of Economy, BCRA, AFIP, Unión por Todos, CIARA, CBOT, NYMEX
Spot
Jun - 19Mar - 19
Sep - 19
CPI*
Inflation Exchange rate: spot and futures
Reserves and Central Bank Assets
Income and Expenses of the National Non-Financial Public Sector
Foreign Trade
Monthly Industrial EstimatorReal Exchange Rate Index: base Dec-99=1
Source: own calculations based on Central BankSource: own calculations based on CBOT y WTI NYMEX
Source: own calculations based on the Argentine Central Bank Source: own calculations based on INDEC
Source: own calculations based on Secretary of FinanceSource: own calculations based on INDEC
Source: Own calculations based on CPI Congress and UTD*CPI Congress. As of November 2016 it is considered CPI City of Buenos Aires
Source: Own calculations based on Rofex
Price of Soy and Oil, index2004=100
Inflation prospects
Reserves, USD mn, end of period Reserves/AssetsPublic Sector Assets/Assets
This publication has been prepared for general guidance on matters of interest only, and does not constitute professional advice. You should not act upon the information contained in this publication without obtaining specific professional advice. No representation or warranty (express or implied) is given as to the accuracy or completeness of the information contained in this publication, and, to the extent permitted by law, Price Waterhouse & Co. Asesores de Empresas S.R.L., its members, employees and agents do not accept or assume any liability, responsibility or duty of care for any consequences of you or anyone else acting, or refraining to act, in reliance on the information contained in this publication or for any decision based on it.