N-Glycan Profile and KidneyDisease in Type 1 DiabetesDiabetes Care 2018;41:79–87 | https://doi.org/10.2337/dc17-1042
OBJECTIVE
Poorer glycemic control in type 1 diabetes may alter N-glycosylation patterns oncirculating glycoproteins, and these alterations may be linked with diabetic kidneydisease (DKD).We investigated associations betweenN-glycans and glycemic controland renal function in type 1 diabetes.
RESEARCH DESIGN AND METHODS
Using serum samples from 818 adults who were considered to have extreme annualloss in estimated glomerular filtration rate (eGFR; i.e., slope) based on retrospectiveclinical records, from among 6,127 adults in the Scottish Diabetes Research NetworkType 1 Bioresource Study, wemeasured total and IgG-specific N-glycan profiles. Thisyielded a relative abundance of 39 total (GP) and 24 IgG (IGP) N-glycans. Linearregressionmodelswereused to investigate associationsbetweenN-glycan structuresandHbA1c, albumin-to-creatinine ratio (ACR), and eGFR slope.Models were adjustedfor age, sex, duration of type 1 diabetes, and total serum IgG.
RESULTS
Higher HbA1c was associated with a lower relative abundance of simple biantennaryN-glycans and a higher relative abundance of more complex structures with morebranching, galactosylation, and sialylation (GP12, 26, 31, 32, and 34, and IGP19 and23; all P< 3.793 1024). Similar patternswere seen for ACR and greatermean annualloss of eGFR, which were also associated with fewer of the simpler N-glycans (allP < 3.793 1024).
CONCLUSIONS
Higher HbA1c in type 1 diabetes is associated with changes in the serum N-glycomethat have elsewhere been shown to regulate the epidermal growth factor receptorand transforming growth factor-b pathways that are implicated in DKD. Further-more, N-glycans are associatedwithACR and eGFR slope. These data suggest that therole of altered N-glycans in DKD warrants further investigation.
Chronic kidneydisease (CKD) is amajor cause ofmorbidity andmortality in diabetes (1).In people with type 1 diabetes, such CKD is usually due to specific diabetic kidneydisease (DKD) in which a falling estimated glomerular filtration rate (eGFR) is usuallyaccompanied by albuminuria (2). Diabetic nephropathy is the underlying pathologicprocess, the features of which include thickened basement membrane and disruptionof the glycocalyx (3). Poorer glycemic control, as measured by the degree of nonenzy-matic glycation of hemoglobin (HbA1c), is associated with risk of CKD in diabetes andDKD. Such glucose-induced tissue damage is hypothesized to be mediated through arange of pathways, including increased flux of glucose through the hexosamine bio-synthetic pathway (HBP) (4). However, considerable variation exists in individuals’
1MRC Institute of Genetics and Molecular Med-icine, University of Edinburgh, Edinburgh, U.K.2Centre for Population Health Sciences, Usher In-stitute, University of Edinburgh, Edinburgh, U.K.3Genos Glycoscience Research Laboratory,Zagreb, Croatia4Pharmatics, Ltd., Edinburgh, U.K.5MRC Human Genetics Unit, MRC Institute ofGenetics and Molecular Medicine, University ofEdinburgh, U.K.6Cardiovascular and Diabetes Medicine, Univer-sity of Dundee, Dundee, U.K.7Institute of Cardiovascular & Medical Sciences,University of Glasgow, Glasgow, U.K.8Diabetes Centre, Victoria Hospital, Kirkcaldy, U.K.9Diabetic Day Centre University Hospital, Ayr, U.K.10Research & Development Support Unit, Dum-fries & Galloway Royal Infirmary, Dumfries, U.K.11Highland Diabetes Institute, Raigmore Hospi-tal, NHS Highland, Inverness, U.K.12Western General Hospital, NHS Lothian,Edinburgh, U.K.13Royal Infirmary of Edinburgh, NHS Lothian,Edinburgh, U.K.14David Matthews Diabetes Centre, MonklandsHospital, Airdrie, U.K.15Faculty of Pharmacy and Biochemistry, Univer-sity of Zagreb, Zagreb, Croatia16Department of Public Health, NHS Fife, Kirkcaldy,U.K.
susceptibility to DKD for a given level ofHbA1c, with estimates of up to 35% forheritability of this complication (5).Increased flux of glucose through
the HBP in diabetes should lead to in-creased levels of uridine diphosphate-N-acetylglucosamine (6), the donormoleculefor the enzymatic process of N-linked gly-cosylation of secreted proteins (7). Theglycosylation process occurswhena blockof 14 sugars (the dolichol phosphate pre-cursor) is transferred cotranslationally tospecific asparagine residues in newly syn-thesized polypeptides in the endoplas-mic reticulum. The resulting N-glycansare subjected to extensive modificationas the glycoproteins mature and movevia the Golgi complex to their intracellu-lar and extracellular destinations. The re-sult is a myriad of modifications that canbe described in terms of the amount ofN-acetylglucosamine (GlcNAc), fucosyla-tion, galactosylation, and sialylation(N-acetylneuraminic [sialic] acid), as wellas branching (8). The degree of branching(biantennary, triantennary, and tetra-antennary structures) has been shown tobe determined by Golgi enzyme activityand by diphosphate-N-acetylglucosaminelevels (7). We hypothesize that peoplewith type 1 diabetes and poorer glycemiccontrol would have increased complexbranched N-glycan modifications in serumproteins. As detailed in the CONCLUSIONS,these complex branched structures havebeen shown to be determinants of manyaspects of protein function with potentialrelevance to kidney disease; therefore wefurther hypothesize that N-glycan profilesmay be associated with DKD. We exam-ined the associations of N-glycans re-leased from total serum protein andthose released specifically from serumIgG with glycemia, albumin-to-creatinineratio (ACR), and retrospective eGFR slopein type 1 diabetes.
RESEARCH DESIGN AND METHODS
Study PopulationThe Scottish Diabetes Research NetworkType 1 Bioresource Study (SDRNT1BIO)is a population-based cohort study of par-ticipants aged $16 years who were en-rolled between 1 December 2010 and29 November 2013 andwho had a clinicaldiagnosis of type1diabetes,maturity-onsetdiabetes of the young, or latent autoim-mune diabetes in adults. They comprisedconsecutive attendees at annual routine
hospital and primary care diabetes reviewvisits in 10 of the 13National Health ServiceBoard areas in Scotland. Data collectionfrom study participants comprised of asingle study visit. Participants were askedto complete a self-report questionnairethat included information on demo-graphic and behavioral attributes; detailsof the medical history of diabetes werecollected during an interview on the dayof the test. Clinicalmeasures andnonfast-ing blood and urine samples were alsotaken. Participants are representativeof the total adult population with type 1diabetes in Scotland with regard to clini-cal history and clinical and demographiccharacteristics. The study data are linkedretrospectively andprospectively tootherroutine data sources, including electronichealth records for diabetes (9). For thisstudy, type 1 diabetes was defined as aclinical diagnosis of type 1 diabetes, noevidence in the historical record of .1year between diagnosis and insulin re-quirement, and no history of use of non-metformin oral drug treatment. Thestudy was approved by the Tayside Re-search Ethics Committee (reference 10/S1402/43) and conducted according totheprinciplesof theDeclarationofHelsinki.Written consent was obtained from theparticipants.
Acquisition of HbA1c, ACR, and eGFRDataFor all participants in the SDRNT1BIO, welinked HbA1c measurements from theScottish Care Information-Diabetes Col-laboration database to participant data(9). Baseline HbA1c was defined as themeasurement closest to, and up to 1 yearbefore, the date of consent.
Albuminuria status on the study daywas based on measurement of albuminand creatinine in two spot urine samplestaken several days apart. Albumin andcreatinine concentrationsweremeasuredwith an ADVIA 2400 Clinical ChemistrySystem (Siemens Healthcare, Camberley,U.K.) using immunoturbidimetric (antibodyreaction) and modified Jaffe reactionmethods, respectively, at the NinewellsMedical School & Hospital BiochemistryLaboratory, National Health Service Tayside,Ninewells Hospital & Medical School(Dundee, U.K.). We then modeled in theanalyses the relationship of N-glycansto ACR, with ACR scaled to have a meanof 0 and an SD of 1. For the purposesof describing baseline characteristics,
normoalbuminuria was defined as anACR ,30 mg/g (mean from the tworeadings), microalbuminuria as an ACRin the range of 30–300mg/g, andmacro-albuminuria as ACR .300 mg/g.
eGFR was estimated before the studyday based on serum creatinine recordsfromtheScottishCare Information-DiabetesCollaboration database linked to partic-ipant data. This database captures all se-rum creatinine values measured clinicallyin all participants since 2004. The meannumber of creatinine readings per personover the period was 10 (interquartile range7–17), excluding all creatinine measure-ments corresponding with a hospitalstay. The CKD Epidemiology Collaborationformula was used to convert creatininevalues to eGFR (10). eGFR was set at10 mL/min/1.73 m2 for the purpose ofmodeling continuous data distributionsonce renal replacement was started.The monthly median eGFR across the pa-tient’s retrospective record was then re-tained for inclusion in a later analysis. Tovalidate the use of the eGFR from theelectronic record, we confirmed that thehealth record–derived eGFR at time ofsampling was highly correlated (r .0.97) with eGFR derived from directlymeasured serum creatinine.
Selection of Participants in ThisN-Glycan Study From the SDRNT1BIOCohortFunding did not permit measurement ofN-glycans in the entire SDRNT1BIO co-hort; therefore a subgroup of 818 partici-pants were selected (SupplementaryFig. 1). We calculated for each person theretrospective eGFR slope. Only those withat least 3 years of longitudinal eGFR dataand at least five eGFR observations overtheir history were considered for slopeestimation. Two participants did notmeet these inclusion criteria and wereremoved from subsequent analyses ofeGFR slope. Slope was estimated by fit-ting a linear regression to the smoothedeGFR for each individual and estimatingthe effect of time on eGFR. To increasethe power to detect associations, we thenrandomly selected participants across therange of slope but overweighted at theextremes of the distribution, such that36% of all those included came from thetop and bottomdeciles of slope. The sum-mary measure of slope was used as a sin-gle outcome variable in the subsequentanalysis.
80 N-Glycans and Diabetic Kidney Disease Diabetes Care Volume 41, January 2018
N-Glycan AnalysesIgG was isolated from serum samples us-ing protein G monolithic plates (11), andN-glycanswere released fromsamples us-ing a previously described high-throughputmethod (12).
Hydrophilic InteractionChromatography–UltraperformanceLiquid ChromatographyFluorescently labeled N-glycans wereseparated by hydrophilic interactionchromatography on an ACQUITY ultraper-formance liquid chromatography (UPLC)instrument (Waters, Milford, MA), as de-scribed previously (13). Glycan peaks werepooled based on similar structural or com-positional features of the peak glycanmembers. Chromatograms for the totaland IgG N-glycans were separated into39 and 24 peaks using manual integrationof chromatograms (12) and a semisuper-vised approach for the automatic chro-matogram extraction (14), respectively.The amount of glycans in each peakwas then expressed as a percentage ofthe total integrated area. The N-glycantraits are described in SupplementaryTable 1.
Measurement of Within-Sample IgGand GlucoseWemeasured serum IgG and glucose levelsin serum samples using an immunoturbidi-metric assay (Tina-quant IgG Gen.2; RocheDiagnostics), and aGOD-PAP enzymatic col-orimetric assay (Roche Diagnostics) at theRoyal Devon and Exeter Hospital Blood Sci-ences Laboratory (Exeter, U.K.).
Statistical AnalysisTo removeexperimental variation, theUPLCN-glycan data were normalized for the totalarea, log transformed, and corrected forbatch effects using the empirical Bayesmethod, implemented with the R packagesva ComBat function (15). The exponent ofbatch-corrected measurements was thenobtained to transform the UPLC N-glycandata to the original scale. An additional15 and 54 derived traits were then cal-culated from the normalized and batch-corrected total and IgG N-glycan traits,respectively. These derived traits averageparticular glycosylation features (galacto-sylation, fucosylation, bisecting GlcNAc,and sialylation; Supplementary Table 1).All N-glycan and continuous clinical vari-ables used in the association analyseswere Gaussianized, centered, and scaledto have a mean of 0 and an SD of 1.
Before association analyses, we testedfor associations between the N-glycanmeasurements and serum IgG and glu-cose levels in a linear regression modelafter adjusting for the effects of age, sex,and duration of type 1 diabetes. Serumglucose did not associate with total orIgG N-glycans. As such, N-glycosylationpatterns are not confounded with within-sample variation in serum glucose levels.However, we observed that total and IgGN-glycan profiles variedwith IgG levels. IgGlevelswerenot associatedwithHbA1c, ACR,or eGFR slope, but they showed some uni-variate association with eGFR. Thereforewe adjusted all total and IgG N-glycanassociation analyses for IgG. However,adjusting for IgG in the analyses madeno meaningful difference to any of thereported associations.
Linear regression models were used totest for associations between N-glycansand each of the following outcomes: gly-cemic control (HbA1c), ACR, and the sum-mary measure of historical eGFR slope.For HbA1c associations, the first (minimal)model was adjusted for age, sex, durationof type 1 diabetes, and serum IgG levels.The second (full) model was additionallyadjusted for baseline eGFR, ACR, BMI,smoking status, diastolic blood pressure,systolic blood pressure, total cholesterol,use of antihypertensive drugs (a-blockers,ACE inhibitors, angiotensin receptor block-ers, b-blockers, calcium channel blockers,and diuretics), use of statins, use of anti-inflammatory drugs (d-hydrocortisone,dexamethasone, hydrocortisone, Hydro-cortone, Medrone, methylprednisolone,
Plenadren, and triamcinolone), and use oforal contraceptives or hormone replace-ment therapy. For ACR and eGFR slope,the minimal model was adjusted for age,sex, duration of diabetes, and total IgG lev-els, and the fullmodelwas adjusted furtherfor HbA1c to examine to what extentN-glycans may capture an association ofthe underlyingdeterminant (i.e., poor gly-cemic control) with DKD that is not al-ready captured by the HbA1c measure.We then addedeach of theN-glycans sep-arately to the first model to test for asso-ciation with the outcomes of interest andconfirmed that associations were robustto the adjustments in the second model.In total, 132N-glycan variableswere tested,and we adopted a Bonferroni-correctedthreshold of 3.79 3 1024 (0.05/numberof N-glycans tested) to indicate statisticalsignificance. Reported P values are nom-inal. All analyses were conducted usingthe R software package version 3.3.1.
RESULTS
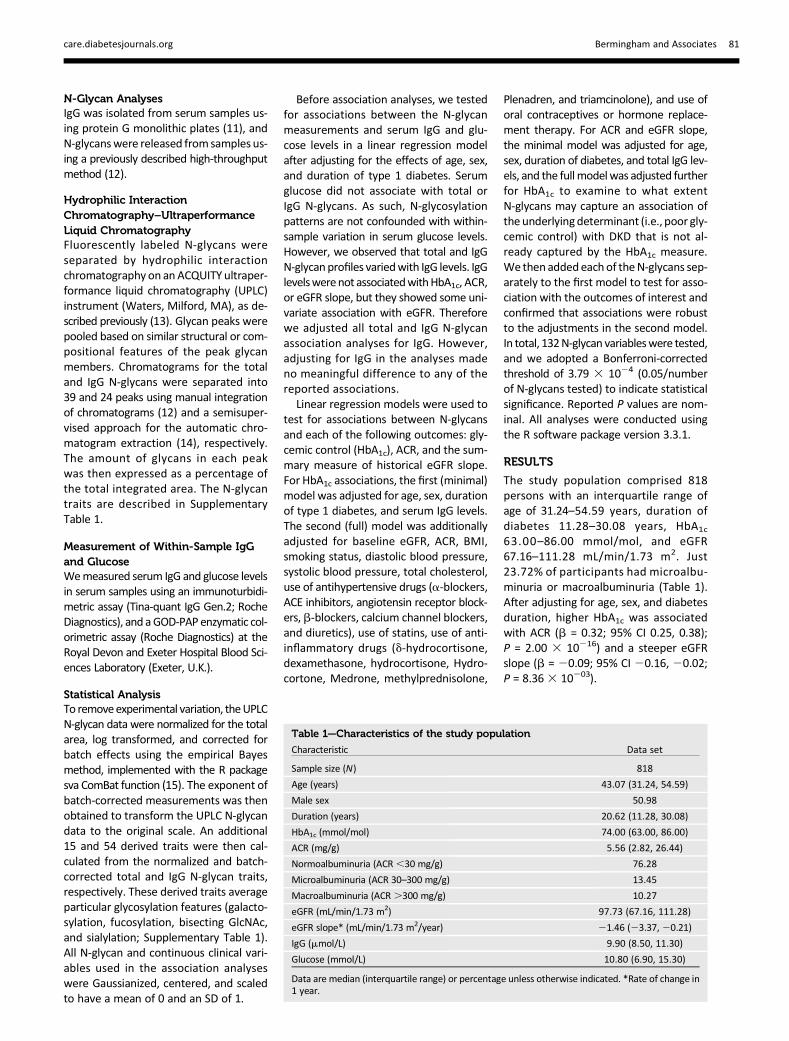
The study population comprised 818persons with an interquartile range ofage of 31.24–54.59 years, duration ofdiabetes 11.28–30.08 years, HbA1c
63.00–86.00 mmol/mol, and eGFR67.16–111.28 mL/min/1.73 m2. Just23.72% of participants had microalbu-minuria or macroalbuminuria (Table 1).After adjusting for age, sex, and diabetesduration, higher HbA1c was associatedwith ACR (b = 0.32; 95% CI 0.25, 0.38);P = 2.00 3 10216) and a steeper eGFRslope (b = 20.09; 95% CI 20.16, 20.02;P = 8.363 10203).
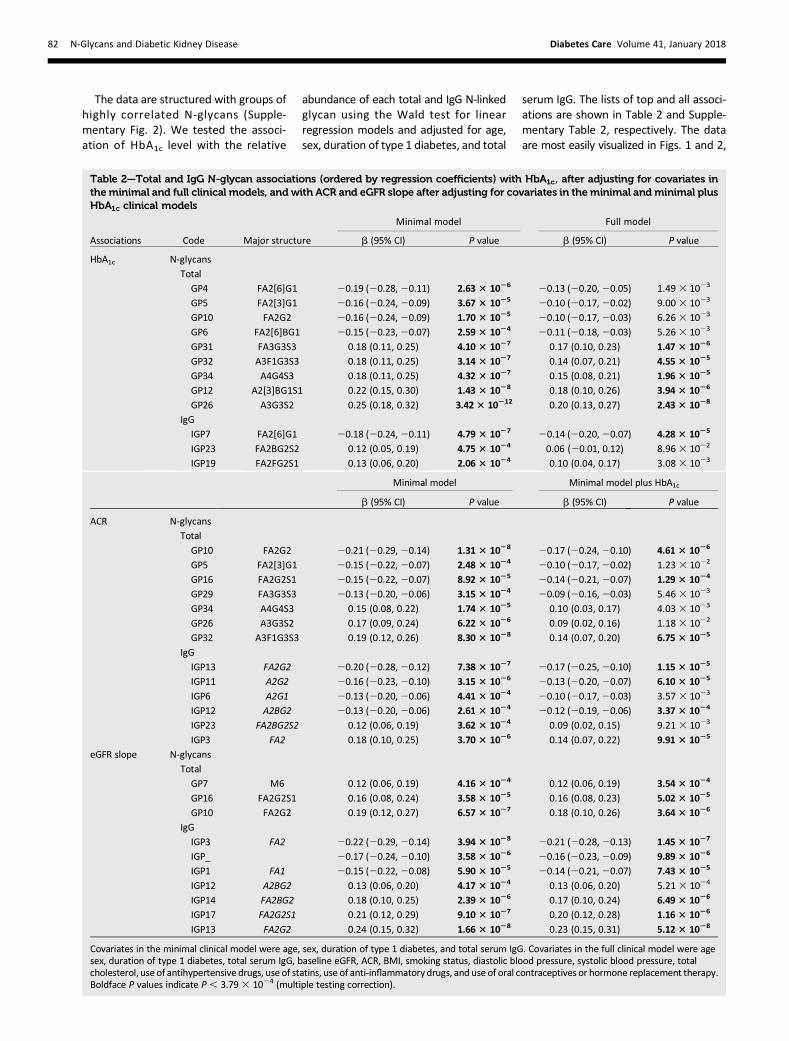
The data are structured with groups ofhighly correlated N-glycans (Supple-mentary Fig. 2). We tested the associ-ation of HbA1c level with the relative
abundance of each total and IgG N-linkedglycan using the Wald test for linearregression models and adjusted for age,sex, duration of type 1 diabetes, and total
serum IgG. The lists of top and all associ-ations are shown in Table 2 and Supple-mentary Table 2, respectively. The dataare most easily visualized in Figs. 1 and 2,
Table 2—Total and IgG N-glycan associations (ordered by regression coefficients) with HbA1c, after adjusting for covariates intheminimal and full clinical models, and with ACR and eGFR slope after adjusting for covariates in theminimal and minimal plusHbA1c clinical models
Covariates in the minimal clinical model were age, sex, duration of type 1 diabetes, and total serum IgG. Covariates in the full clinical model were agesex, duration of type 1 diabetes, total serum IgG, baseline eGFR, ACR, BMI, smoking status, diastolic blood pressure, systolic blood pressure, totalcholesterol, use of antihypertensive drugs, use of statins, use of anti-inflammatory drugs, and use of oral contraceptives or hormone replacement therapy.Boldface P values indicate P, 3.793 1024 (multiple testing correction).
82 N-Glycans and Diabetic Kidney Disease Diabetes Care Volume 41, January 2018
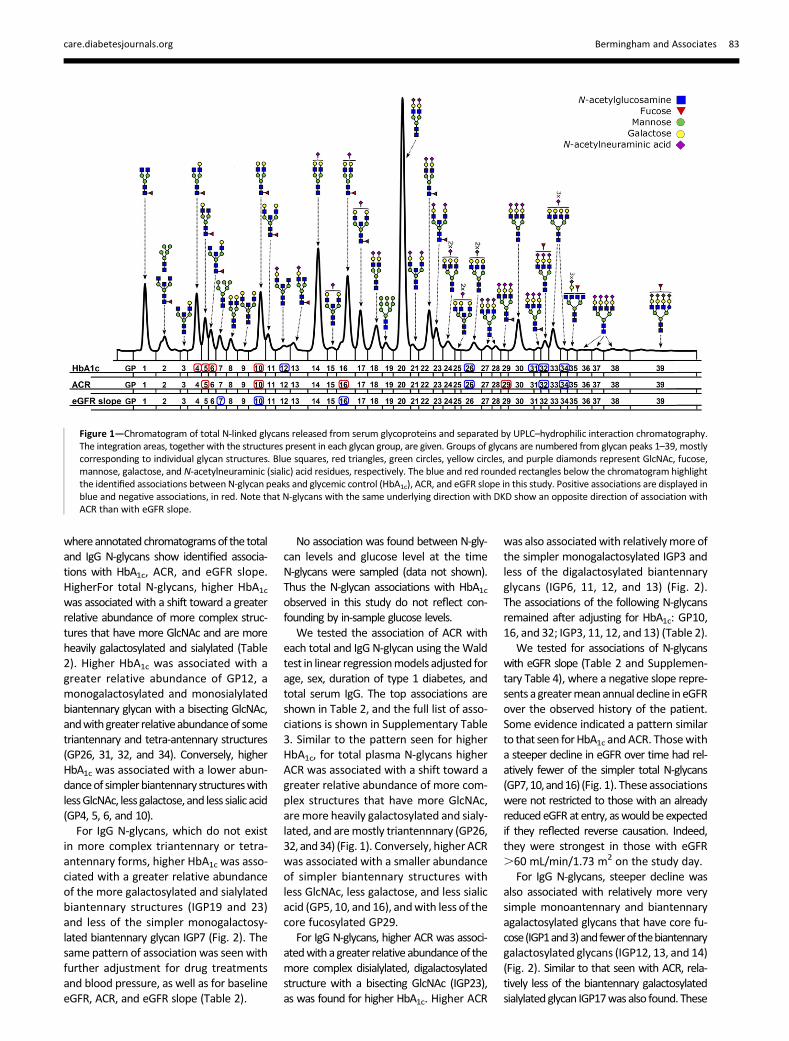
whereannotated chromatogramsof the totaland IgG N-glycans show identified associa-tions with HbA1c, ACR, and eGFR slope.HigherFor total N-glycans, higher HbA1cwas associated with a shift toward a greaterrelative abundance of more complex struc-tures that have more GlcNAc and are moreheavily galactosylated and sialylated (Table2). Higher HbA1c was associated with agreater relative abundance of GP12, amonogalactosylated and monosialylatedbiantennary glycan with a bisecting GlcNAc,andwithgreater relativeabundanceof sometriantennary and tetra-antennary structures(GP26, 31, 32, and 34). Conversely, higherHbA1c was associated with a lower abun-danceof simplerbiantennary structureswithlessGlcNAc, less galactose, and less sialic acid(GP4, 5, 6, and 10).For IgG N-glycans, which do not exist
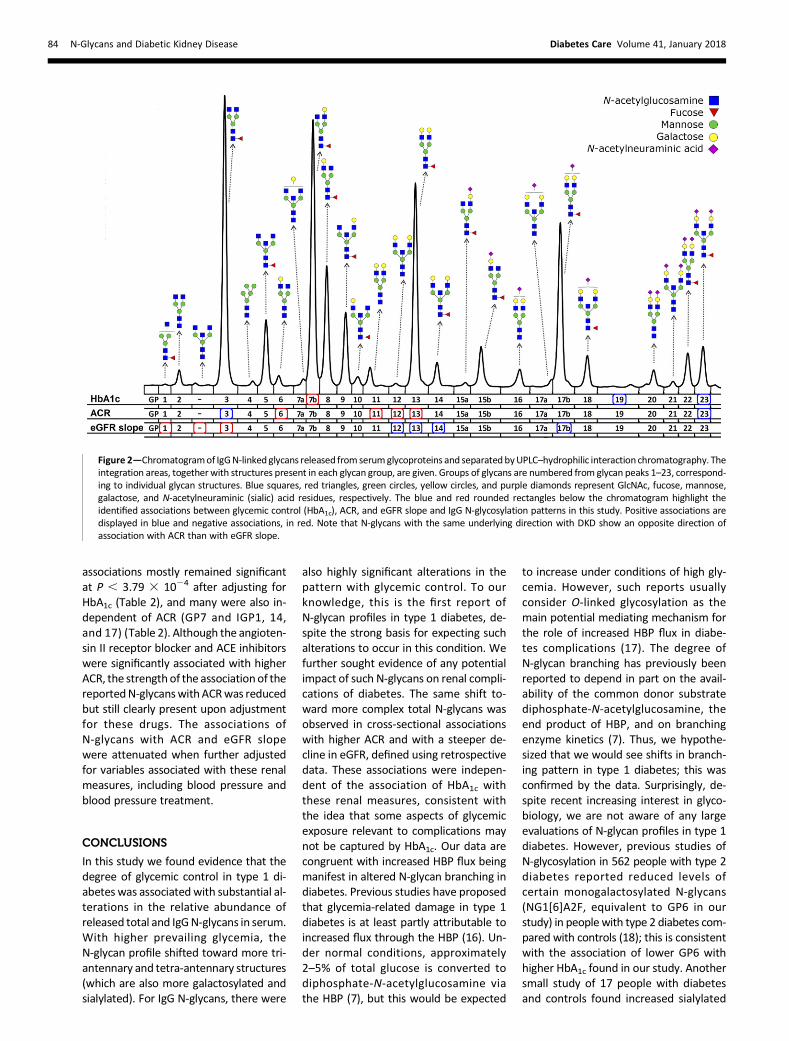
in more complex triantennary or tetra-antennary forms, higher HbA1c was asso-ciated with a greater relative abundanceof the more galactosylated and sialylatedbiantennary structures (IGP19 and 23)and less of the simpler monogalactosy-lated biantennary glycan IGP7 (Fig. 2). Thesame pattern of association was seen withfurther adjustment for drug treatmentsand blood pressure, as well as for baselineeGFR, ACR, and eGFR slope (Table 2).
No association was found between N-gly-can levels and glucose level at the timeN-glycans were sampled (data not shown).Thus the N-glycan associations with HbA1cobserved in this study do not reflect con-founding by in-sample glucose levels.
We tested the association of ACR witheach total and IgG N-glycan using theWaldtest in linear regressionmodels adjusted forage, sex, duration of type 1 diabetes, andtotal serum IgG. The top associations areshown in Table 2, and the full list of asso-ciations is shown in Supplementary Table3. Similar to the pattern seen for higherHbA1c, for total plasma N-glycans higherACR was associated with a shift toward agreater relative abundance of more com-plex structures that have more GlcNAc,aremore heavily galactosylated and sialy-lated, and aremostly triantennnary (GP26,32, and34) (Fig. 1). Conversely, higher ACRwas associated with a smaller abundanceof simpler biantennary structures withless GlcNAc, less galactose, and less sialicacid (GP5, 10, and 16), andwith less of thecore fucosylated GP29.
For IgG N-glycans, higher ACR was associ-atedwith a greater relative abundanceof themore complex disialylated, digalactosylatedstructure with a bisecting GlcNAc (IGP23),as was found for higher HbA1c. Higher ACR
was also associatedwith relativelymore ofthe simpler monogalactosylated IGP3 andless of the digalactosylated biantennaryglycans (IGP6, 11, 12, and 13) (Fig. 2).The associations of the following N-glycansremained after adjusting for HbA1c: GP10,16, and 32; IGP3, 11, 12, and 13) (Table 2).
We tested for associations of N-glycanswith eGFR slope (Table 2 and Supplemen-tary Table 4), where a negative slope repre-sents a greatermeanannual decline in eGFRover the observed history of the patient.Some evidence indicated a pattern similarto that seen forHbA1c and ACR. Thosewitha steeper decline in eGFR over time had rel-atively fewer of the simpler total N-glycans(GP7,10,and16) (Fig. 1). These associationswere not restricted to those with an alreadyreduced eGFRat entry, aswouldbeexpectedif they reflected reverse causation. Indeed,they were strongest in those with eGFR.60 mL/min/1.73 m2 on the study day.
For IgG N-glycans, steeper decline wasalso associated with relatively more verysimple monoantennary and biantennaryagalactosylated glycans that have core fu-cose(IGP1and3)andfewerof thebiantennarygalactosylated glycans (IGP12, 13, and 14)(Fig. 2). Similar to that seen with ACR, rela-tively less of the biantennary galactosylatedsialylatedglycan IGP17was also found. These
Figure 1—Chromatogram of total N-linked glycans released from serum glycoproteins and separated by UPLC–hydrophilic interaction chromatography.The integration areas, together with the structures present in each glycan group, are given. Groups of glycans are numbered from glycan peaks 1–39, mostlycorresponding to individual glycan structures. Blue squares, red triangles, green circles, yellow circles, and purple diamonds represent GlcNAc, fucose,mannose, galactose, and N-acetylneuraminic (sialic) acid residues, respectively. The blue and red rounded rectangles below the chromatogram highlightthe identified associations between N-glycan peaks and glycemic control (HbA1c), ACR, and eGFR slope in this study. Positive associations are displayed inblue and negative associations, in red. Note that N-glycans with the same underlying direction with DKD show an opposite direction of association withACR than with eGFR slope.
care.diabetesjournals.org Bermingham and Associates 83
associations mostly remained significantat P , 3.79 3 1024 after adjusting forHbA1c (Table 2), and many were also in-dependent of ACR (GP7 and IGP1, 14,and 17) (Table 2). Although the angioten-sin II receptor blocker and ACE inhibitorswere significantly associated with higherACR, the strength of the associationof thereportedN-glycanswithACRwas reducedbut still clearly present upon adjustmentfor these drugs. The associations ofN-glycans with ACR and eGFR slopewere attenuated when further adjustedfor variables associated with these renalmeasures, including blood pressure andblood pressure treatment.
CONCLUSIONS
In this study we found evidence that thedegree of glycemic control in type 1 di-abetes was associatedwith substantial al-terations in the relative abundance ofreleased total and IgGN-glycans in serum.With higher prevailing glycemia, theN-glycan profile shifted toward more tri-antennary and tetra-antennary structures(which are also more galactosylated andsialylated). For IgG N-glycans, there were
also highly significant alterations in thepattern with glycemic control. To ourknowledge, this is the first report ofN-glycan profiles in type 1 diabetes, de-spite the strong basis for expecting suchalterations to occur in this condition. Wefurther sought evidence of any potentialimpact of such N-glycans on renal compli-cations of diabetes. The same shift to-ward more complex total N-glycans wasobserved in cross-sectional associationswith higher ACR and with a steeper de-cline in eGFR, defined using retrospectivedata. These associations were indepen-dent of the association of HbA1c withthese renal measures, consistent withthe idea that some aspects of glycemicexposure relevant to complications maynot be captured by HbA1c. Our data arecongruent with increased HBP flux beingmanifest in altered N-glycan branching indiabetes. Previous studies have proposedthat glycemia-related damage in type 1diabetes is at least partly attributable toincreased flux through the HBP (16). Un-der normal conditions, approximately2–5% of total glucose is converted todiphosphate-N-acetylglucosamine viathe HBP (7), but this would be expected
to increase under conditions of high gly-cemia. However, such reports usuallyconsider O-linked glycosylation as themain potential mediating mechanism forthe role of increased HBP flux in diabe-tes complications (17). The degree ofN-glycan branching has previously beenreported to depend in part on the avail-ability of the common donor substratediphosphate-N-acetylglucosamine, theend product of HBP, and on branchingenzyme kinetics (7). Thus, we hypothe-sized that we would see shifts in branch-ing pattern in type 1 diabetes; this wasconfirmed by the data. Surprisingly, de-spite recent increasing interest in glyco-biology, we are not aware of any largeevaluations of N-glycan profiles in type 1diabetes. However, previous studies ofN-glycosylation in 562 people with type 2diabetes reported reduced levels ofcertain monogalactosylated N-glycans(NG1[6]A2F, equivalent to GP6 in ourstudy) in people with type 2 diabetes com-pared with controls (18); this is consistentwith the association of lower GP6 withhigher HbA1c found in our study. Anothersmall study of 17 people with diabetesand controls found increased sialylated
Figure 2—Chromatogramof IgGN-linked glycans released from serumglycoproteins and separatedbyUPLC–hydrophilic interaction chromatography. Theintegration areas, together with structures present in each glycan group, are given. Groups of glycans are numbered from glycan peaks 1–23, correspond-ing to individual glycan structures. Blue squares, red triangles, green circles, yellow circles, and purple diamonds represent GlcNAc, fucose, mannose,galactose, and N-acetylneuraminic (sialic) acid residues, respectively. The blue and red rounded rectangles below the chromatogram highlight theidentified associations between glycemic control (HbA1c), ACR, and eGFR slope and IgG N-glycosylation patterns in this study. Positive associations aredisplayed in blue and negative associations, in red. Note that N-glycans with the same underlying direction with DKD show an opposite direction ofassociation with ACR than with eGFR slope.
84 N-Glycans and Diabetic Kidney Disease Diabetes Care Volume 41, January 2018
N-glycans in the vitreous fluid of peoplewith proliferative retinopathy (19). Astudy of one specific glycoprotein, a1-acid glycoprotein, in type 1 diabetesreported altered fucosylation (20). Thefundamental role of N-glycans is increas-ingly recognized in mediating a widerange of biological processes, includingprotein folding, cell adhesion, and recep-tor activitymodulation (21). An importantquestion, therefore, is whether the al-tered N-glycan profile in type 1 diabetesis part of the mechanism of glucose-induced kidney damage. We found sup-portive evidence, in that N-glycan profilesshowed highly significant variation, withhigher ACR and steeper eGFR decline inthe 818 people studied. Certainly, therecould plausibly be a causal role in DKD inparticular with respect to the shift to tri-antennary and tetra-antennary branchedstructures that we observed in this study.It has been shown that triantennary andtetra-antennary N-glycans bind to galec-tins and form a molecular lattice on thecell surface that opposes glycoproteinendocytosis, thereby regulating surfacelevels of important glycoproteins in theglycocalyx (7). Termination of brancheswith galactose and/or sialic acid also in-creases and decreases galectin affinities,respectively (7). Of particular relevanceto DKD is evidence that hexosamine/N-glycan branchingmay differentially reg-ulate epidermal growth factor (EGF) recep-tor and transforming growth factor-b(TGF-b) signaling (7). Given the pivotalrole of TGF-b in extracellular matrix depo-sition in DKD, and the increasing evidencethat persistent EGF receptor activation is apivotal process in diabetic nephropathy, arelationship of altered N-glycan branchingto kidney damage in diabetes is highlyplausible (22,23). Reverse causation ispossible, with altered N-glycans resultingfrom reduced renal function. For exam-ple, progressive renal decline (as measuredby eGFR) is associated with the presence ofspecific inflammatory cytokines (e.g., inter-leukin 6) in type 1 diabetes (24). Sustainedinflammation is known to modify the gly-cosylation pattern of glycoproteins (25),and some glycosyltransferases havebeen shown to be regulated at the tran-scriptional level by proinflammatory cyto-kines such as interleukin 6 (26).Increasing evidence indicates that al-
terations in branching, galactosylation,and sialylation of N-glycans on IgG dictateeffector function (27–30). Glycosylation
of IgG acts as a switch between proin-flammatory and anti-inflammatory IgGfunctionality. Specifically, the decreasein galactosylated (IGP12, 13, and 14)and increase in agalactosylated (IGP1and 3) glycoforms that we observedwith more rapid eGFR decline would beexpected to render a more proinflamma-tory IgG profile (29). A previous analy-sis of IgG N-glycans in relation to eGFRdistribution in the TwinsUK cohortshowed evidence similar to that reportedheredthat is, lower eGFR was associatedwith more IGP1 and IGP3 (called GP4 inthat paper), and less IGP12, IGP13, andIGP14 (30).
We observed an increase in the diga-lactosylated and disialylated biantennarystructure with a bisecting GlcNAc (IGP23)with glycemia and with higher ACR. Wenote that previous studies have shownelevation of total sialic acid in patientswith diabetes and microvascular dis-ease (31). However, unlike the proinflam-matory changes seen with falling eGFR,this sialylation modification is expectedto be anti-inflammatory (30,32), and wenote that in the TwinsUK study this IGP23was actually higher in those with a highereGFR (30). A causal relationship of IgGglycan changes with DKD is plausible inthat some evidence points to a role forthe humoral immune system in DKD,withglomerular deposition of immune com-plexes (33). Also, IgG Fcg receptor defi-ciency was protective in a mouse modelof diabetic nephropathy (34–37).
Although the N-glycan profile patternshave some commonalities associatedwith higher HbA1c, higher ACR, and lowereGFR, they do not perfectly overlap. ACRand eGFR represent aspects of renal func-tion decline in diabetes, but even theydo not overlap perfectly. Many peoplewith declining renal function in diabetesare increasingly recognized as normoal-buminuric and, conversely, microalbumi-nuria may capture some aspects ofwidespread vascular damage other thanonly renal disease. However, the lack ofperfect overlap highlights the importanceof further proposed work to explorewhether these relationships representcausal pathways.
Our study has several limitations.N-glycan profiling by examining releasedglycans is limited in that the proteins fromwhich N-glycans have been released arenot directly quantified. Thus any associa-tions of HbA1c, ACR, or eGFR slope with
relative abundance of N-glycans maybe confounded by associations of thesevariables with relative composition ofthe serum proteome. However, for theIgG N-glycans, we were able to quantifythe relevant protein IgG, and adjusting forit made little difference to the associa-tions found for IgG N-glycans.
Most importantly, we cannot demon-strate causality in the relationship ofN-glycans with DKD in this study design,in which we have tested both cross-sectional and retrospective associations.Changes in N-glycans could be secondaryto changes in renal function. However,the fact that such strong associationsare shown with renal function and areindependent of HbA1c does suggest thatfurther work is warranted. Furthermore,the associations of total N-glycans witheGFR slope were not restricted to thosewith an already substantially reducedeGFR (,60mL/min/1.73m2). Prospectiveassociationswill be tested in the cohort asmore data accrue. Also, because severalof the N-glycans that we found to be asso-ciated with eGFR decline and ACR are par-tially controlled by genes (38,39), our nextstep is to test for causal associations of ge-netic predictors of risk for these traits withrenal outcomes using Mendelian randomi-zation. Development of N-glycans as clinicalbiomarkers for risk of DKDwould also needto include the development of direct abso-lute quantification methods (40).
In summary, our results highlight thatpoorer glycemic control in type1 diabetesis associated with substantial changesin the serumN-glycome that has elsewherebeen shown to regulate EGF receptor andTGF-b signaling pathways that are gener-ally considered important in mediatingDKD. Furthermore, we found associationsbetween N-glycans and both higherACR and steeper eGFR slope in patientswith type 1 diabetes. Our report servesto highlight the importance of furtherstudies in understanding the pathogenicsignificance of these altered profiles inDKD.
Funding. This study was supported by fundingfrom JDRF (grant 1-SRA-2016-334-Q-R) and theCroatian National Science Foundation (grantUIP-2014-09-7769). F.A. and A.S.A. reportgrants from EU FP7 Methods for IntegratedAnalysis of Multiple Omics Datasets (MIMO-mics). L.K. reports grants from University ofEdinburgh. C.N.A.P. reports grants from Diabe-tes UK and Chief Scientist Office, Scotland, duringthe conduct of the study. J.R.P. reports grants from
care.diabetesjournals.org Bermingham and Associates 85
JDRF. H.M.C. is funded by an endowed chair fromthe AXA Research Fund.Dualityof Interest.M.C., F.A., P.M.M., andH.M.C.are coinventors on a pending patent on predictingrapid decline in renal function. F.V., M.P.B., I.T.-A.,and L.K. are employees of Genos, Ltd., a privateresearch organization that specializes in high-throughput glycomic analysis. G.L. is the founderand owner of Genos, Ltd., and holds several patentsin thefieldofglycomics.F.A.andA.S.A. reportgrantsfrom EU FP7 MIMOmics. F.A. also has a patent inglycomics pending. L.K. reports grants from Univer-sity of Edinburgh and grants and personal fees fromGenos, Ltd. C.N.A.P. reports grants from DiabetesUK and Chief Scientist Office (CSO), Scotland,during the conduct of the study. J.R.P. and R.S.L.report personal fees from Eli Lilly & Co. and NovoNordisk. J.R.P. and S.T. report personal fees fromAstraZeneca and Janssen Global. J.R.P. also re-ports personal fees and grants from Sanofiand nonfinancial support from Merck KGaA(Germany) and Itamar Medical, grants fromJDRF, and grants and personal fees from Quin-tiles, Roche, and Boehringer Ingelheim. R.S.L.is a member of advisory panels for NovartisPharmaceuticals, Novo Nordisk, and Eli Lilly &Co. H.M.C. has received research support andhonoraria as a member of advisory panels andspeakers’ bureaus for Sanofi, Regeneron Pharma-ceuticals, and Eli Lilly & Co.; has received researchsupport from Roche Pharmaceuticals, Pfizer, Inc.,Boehringer Ingelheim, AstraZeneca, Novo Nordisk,Eli Lilly & Co., and GlaxoSmithKline; and is a share-holder of Roche Pharmaceuticals and Bayer. Noother potential conflicts of interest relevant tothis article were reported.Author Contributions. M.L.B. interpreted theresults and wrote the first draft of the manu-script. M.L.B., M.C., P.M.M., and H.M.C. de-signed the study. M.L.B and H.M.C. reviewedthe literature. M.C. analyzed the baseline data.S.J.M. and L.A.K.B. undertook quality control ofthe clinical diabetes data sets. F.V., M.P.B., I.T.-A.,G.L., and O.G. released the total and IgG N-linkedglycans from serum samples. F.A. and A.S.A. un-dertook quality control of the N-glycan data. C.H.and L.K. provided expert advice on the interpre-tation of the results. C.N.A.P., J.R.P., J.C., A.C., F.G.,R.S.L., S.M., J.A.M., A.W.P., and S.T. were in-volved in the establishment of the SDRNT1BIOcohortandthecollectionof theclinicaldatausedinthis study. All authors contributed to the dis-cussion and reviewed and edited the manu-script.H.M.C. is the guarantor of thiswork and, assuch, had full access to all the data in the studyand takes responsibility for the integrity of thedata and the accuracy of the data analysis.
References1. Groop P-H, Thomas MC, Moran JL, et al.; Finn-Diane Study Group. The presence and severityof chronic kidney disease predicts all-cause mor-tality in type 1 diabetes. Diabetes 2009;58:1651–16582. Berhane AM,Weil EJ, KnowlerWC, Nelson RG,Hanson RL. Albuminuria and estimated glomerularfiltration rate as predictors of diabetic end-stagerenal disease and death. Clin J Am Soc Nephrol2011;6:2444–24513. Cheng H, Harris RC. Renal endothelial dysfunc-tion in diabetic nephropathy. Cardiovasc HematolDisord Drug Targets 2014;14:22–33
4. Fantus IG, Goldberg HJ, Whiteside CI, Topic D.The hexosamine biosynthesis pathway. In TheDiabetic Kidney. Cortes P, Morgensen CE, Eds.Totowa, NJ, Humaba Press, 2006, p. 117–1335. Sandholm N, Van Zuydam N, Ahlqvist E, et al.;FinnDiane Study Group; DCCT/EDIC StudyGroup; GENIE Consortium; SUMMIT Consortium.The genetic landscape of renal complications intype 1 diabetes. J Am Soc Nephrol 2017;28:557–5746. Taparra K, Tran PT, Zachara NE. Hijacking thehexosamine biosynthetic pathway to promoteEMT-mediated neoplastic phenotypes. Front On-col 2016;6:857. Lau KS, Partridge EA, Grigorian A, et al. Com-plex N-glycan number and degree of branchingcooperate to regulate cell proliferation and differ-entiation. Cell 2007;129:123–1348. Dennis JW,Nabi IR, DemetriouM.Metabolism,cell surface organization, and disease. Cell 2009;139:1229–12419. Akbar T, McGurnaghan S, Palmer CNA, et al.Cohort profile: Scottish Diabetes Research Net-work Type 1 Bioresource Study (SDRNT1BIO). IntJ Epidemiol 2017;46:796–796i10. Levey AS, Stevens LA, Schmid CH, et al.; CKD-EPI (Chronic Kidney Disease EpidemiologyCollaboration). A new equation to estimate glo-merular filtration rate. Ann InternMed 2009;150:604–61211. Pucic M, Knezevic A, Vidic J, Adamczyk B,Novokmet M, Polasek O, et al. High throughputisolation and glycosylation analysis of IgG–variability and heritability of the IgG glycome inthree Isolated human populations. Mol Cell Pro-teomics 2011;10:M111.01009012. Akmacic IT, Ugrina I, Stambuk J, et al. High-throughput glycomics: optimization of samplepreparation. Biochemistry (Mosc) 2015;80:934–94213. Saldova R, Asadi Shehni A, Haakensen VD,et al. Association of N-glycosylation with breastcarcinoma and systemic features using high-resolution quantitative UPLC. J Proteome Res2014;13:2314–232714. Agakova A, Vuckovic F, Klaric L, Lauc G,Agakov F. Automated integration of a UPLC gly-comic profile. Methods Mol Biol 2017;1503:217–23315. Leek JT, Johnson WE, Parker HS, Jaffe AE,Storey JD. The sva package for removing batcheffects and other unwanted variation in high-throughput experiments. Bioinformatics 2012;28:882–88316. Buse MG. Hexosamines, insulin resistance,and the complications of diabetes: current status.Am J Physiol Endocrinol Metab 2006;290:E1–E817. BrownleeM. Biochemistry andmolecular cellbiology of diabetic complications. Nature 2001;414:813–82018. Testa R, Vanhooren V, Bonfigli AR, et al.N-glycomic changes in serum proteins in type 2diabetes mellitus correlate with complicationsand with metabolic syndrome parameters. PLoSOne 2015;10:e011998319. Inafuku S, Noda K, Amano M, Nishimura S,Ishida S. Short communication: increase of sialy-latedN-glycansin eyeswith neovascular glaucomasecondary to proliferative diabetic retinopathy.Curr Eye Res 2016;41:721–72420. Poland DC, Schalkwijk CG, Stehouwer CD,KoelemanCA, vanhetHofB, vanDijkW. Increased
alpha3-fucosylation of alpha1-acid glycoprotein intype I diabetic patients is related to vascular func-tion. Glycoconj J 2001;18:261–26821. Kristic J, Lauc G. Ubiquitous importance ofprotein glycosylation. In High-Throughput Glyco-mics and Glycoproteomics. Lauc G, Wuhrer M,Eds. New York, Springer, 2017, p. 1–1222. Ziyadeh FN. Mediators of diabetic renal dis-ease: the case for TGF-b as the major mediator.J Am Soc Nephrol 2004;15(Suppl. 1):S55–S5723. ZhangM-Z,Wang Y, Paueksakon P, Harris RC.Epidermal growth factor receptor inhibition slowsprogression of diabetic nephropathy in associa-tion with a decrease in endoplasmic reticulumstress and an increase in autophagy. Diabetes2014;63:2063–207224. Bjornstad P, Cherney D, Maahs DM. Early di-abetic nephropathy in type 1 diabetes: new in-sights. Curr Opin Endocrinol Diabetes Obes2014;21:279–28625. Dewald JH, Colomb F, Bobowski-Gerard M,Groux-Degroote S, Delannoy P. Role of cytokine-induced glycosylation changes in regulating cellinteractions and cell signaling in inflammatory dis-eases and cancer. Cells 2016;5:E4326. Groux-Degroote S, Krzewinski-Recchi M-A,Cazet A, et al. IL-6 and IL-8 increase the expressionof glycosyltransferases and sulfotransferases in-volved in the biosynthesis of sialylated and/orsulfated Lewisx epitopes in the human bronchialmucosa. Biochem J 2008;410:213–22327. Tomana M, Schrohenloher RE, Koopman WJ,Alarcon GS, Paul WA. Abnormal glycosylation ofserum IgG from patients with chronic inflamma-tory diseases. Arthritis Rheum 1988;31:333–33828. Anthony RM, Nimmerjahn F, Ashline DJ,Reinhold VN, Paulson JC, Ravetch JV. Recapitula-tion of IVIG anti-inflammatory activity with a re-combinant IgG Fc. Science 2008;320:373–37629. Karsten CM, Pandey MK, Figge J, et al. Anti-inflammatory activity of IgG1 mediated by Fcgalactosylation and association of FcgRIIB anddectin-1. Nat Med 2012;18:1401–140630. Barrios C, Zierer J, Gudelj I, et al. Glycosylationprofile of IgG in moderate kidney dysfunction.J Am Soc Nephrol 2016;27:933–94131. Crook MA, Pickup JC, Lumb PJ, Giorgino F,Webb DJ, Fuller JH; EURODIAB IDDM Complica-tions Study Group. Relationship between plasmasialic acid concentration and microvascular andmacrovascular complications in type 1 diabetes:the EURODIAB Complications Study [publishedcorrection appears in Diabetes Care 2001;24:973]. Diabetes Care 2001;24:316–32232. Jones MB, Oswald DM, Joshi S, WhiteheartSW, Orlando R, Cobb BA. B-cell-independent sia-lylation of IgG. Proc Natl Acad Sci U S A 2016;113:7207–721233. Malhotra R, Wormald MR, Rudd PM, FischerPB, Dwek RA, Sim RB. Glycosylation changes ofIgG associated with rheumatoid arthritis can acti-vate complement via the mannose-binding pro-tein. Nat Med 1995;1:237–24334. Lopez-ParraV,MallaviaB, Lopez-FrancoO, et al.Fcg receptor deficiency attenuates diabetic ne-phropathy. J Am Soc Nephrol 2012;23:1518–152735. Velez M-G, Bhalla V. The role of the immunesystem in the pathogenesis of diabetic nephrop-athy. J Nephrol Ther 2012;S2:00736. Vidarsson G, Dekkers G, Rispens T. IgG sub-classes and allotypes: from structure to effectorfunctions. Front Immunol 2014;5:520
86 N-Glycans and Diabetic Kidney Disease Diabetes Care Volume 41, January 2018
37. Wada J, Makino H. Innate immunity in diabe-tes and diabetic nephropathy. Nat Rev Nephrol2016;12:13–2638. Barrett JC, Lee JC, Lees CW, et al.; UK IBDGenetics Consortium; Wellcome Trust Case Con-trol Consortium 2. Genome-wide association
study of ulcerative colitis identifies three new sus-ceptibility loci, including the HNF4A region. NatGenet 2009;41:1330–133439. McGovern DP, Jones MR, Taylor KD, et al.;International IBD Genetics Consortium. Fucosyl-transferase 2 (FUT2) non-secretor status is
associated with Crohn’s disease. Hum Mol Genet2010;19:3468–347640. Shubhakar A, Reiding KR, Gardner RA,Spencer DIR, Fernandes DL, Wuhrer M. High-throughput analysis and automation for glycomicsstudies. Chromatographia 2015;78:321–333
care.diabetesjournals.org Bermingham and Associates 87