Using the 4 R’s for improved N management for corn and water quality for MN?? Gyles Randall (Professor Emeritus) and Jeff Vetsch (Assistant Scientist) Univ. of Minnesota Southern Research and Outreach Center Waseca, MN 56093 AGVISE Seminar Series January 5, 6, & 7, 2016
Transcript
Using the 4 R’s for improved
N management for corn and
water quality for MN??
Gyles Randall (Professor Emeritus) and
Jeff Vetsch (Assistant Scientist)Univ. of Minnesota
Southern Research and Outreach Center
Waseca, MN 56093
AGVISE Seminar Series
January 5, 6, & 7, 2016
Nitrogen
• Required at higher rates than any other
nutrient for optimizing corn yield and
profitability
• More than 600,000 tons of N are applied for
corn each year in Minnesota alone.
• N BMP’s soil (region) specific in Minnesota.
Region Specific BMPs for N
Randall
Lynn Betts, NRCS
Randall
RISK
Yield Loss & N LossEconomic and Environmental
Management Practices
1. Cropping system
2. Rate of N application
3. Time of N application
4. Nitrification inhibitors
5. Source of N
6. Cover Crops
4R Principles
• The 4R nutrient stewardship principles
are the same globally, but how they are
used locally varies depending on field
and site specific characteristics such as
soil, cropping system, management
techniques and climate.
4R’s– Right Source – Ensure a balanced supply of essential
nutrients, considering both naturally available sources and
the characteristics of specific products, in plant available
forms.
– Right Rate – Assess and make decisions based on soil
nutrient supply and plant demand.
– Right Time – Assess and make decisions based on the
dynamics of crop uptake, soil supply, nutrient loss risks, and
field operation logistics.
– Right Place – Address root-soil dynamics and nutrient
movement, and manage spatial variability within the field to
meet site-specific crop needs and limit potential losses from
the field.
Rate of N Application
Relative corn yield following soybean & residual soil
NO3 (0-5’ depth) as affected by N rate (Port Byron)
2006-10 average,
Olmsted CountyNitrogen rate, lb N ac-1
0 30 60 90 120 150 180
Resiu
al soil
nitra
te-N
(0-5
'), lb
ac-1
0
20
40
60
80
100
120
Rela
tive y
ield
, %
40
60
80
100 Nitrate
Yield
97.4% of max yield
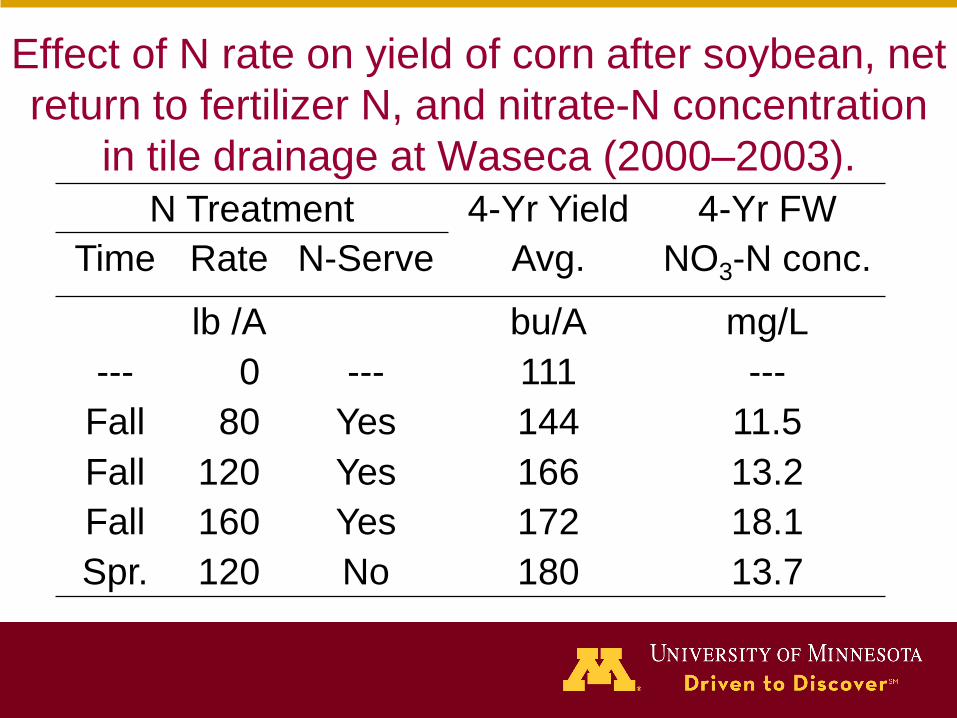
Continuous Corn, 2001–03 Olmsted Co.
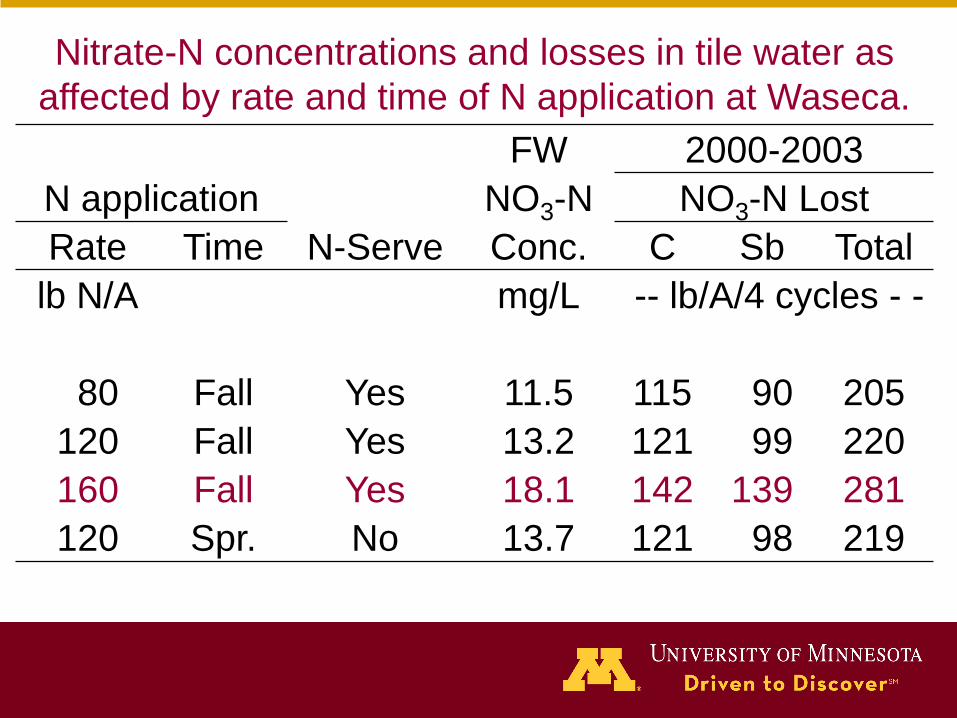
Effect of N rate for corn after soybean on NO3-N
concentrations in tile drainage water in 2001.
15-A
pr
22-A
pr
29-A
pr
6-M
ay
13-M
ay
20-M
ay
27-M
ay
3-Ju
n
10-J
un
17-J
un
24-J
un
Date
10
15
20
25
30
35
40
Nit
rate
Co
nc
(mg
/L)
80 lb N/A 120 160
Time of N Application
and
N-Serve
April – June Rainfall
30-yr normal = 10.7”
1997 = 8.5” (20% below)
1998 = 11.8” (10% above)
1999 = 15.8” (48% above)
Corn yield as affected by time of application.
Years
Time/Placement 1997-’98 1999 3-yr Avg.
Yield (bu/A)1/
Fall/under row 188 145 174
April/between rows 188 181 1861/ Across all four tillage systems.
Primary points
• Although 3-yr average tillage system yields
ranged from 176-184, there was no interaction
between Time of N and Tillage
• Spring N in 1999 increased grain yield by 36 bu/A,
silage yield by 1.3 T/A, and N recovery by 42%
compared to a late October application.
- fall N can be risky
Corn yield as influenced by N-Serve, time of
application, and N-Serve at Waseca, 1981-82.
N Treatment Time of Application
Source N-Serve Fall Spring
- - - Yield (bu/A) - - -
None -- 104
Urea No 157 164
“ Yes 155 167
An. Ammonia No 162 168
“ Yes 170 173
Corn grain yield after soybeans as affected by fall and
spring application of N-Serve with anhydrous
ammonia at Waseca, 1994-99.
N-Serve
Time of Application No Yes
- - - 6-Yr Avg. Yield (bu/A) - - -
Fall (late Oct.) 161 171
Spr. (April)* 172 176
* A yield response to spring-applied N-Serve occurred in years when
June rainfall was excessive, but the 4 bu/A (6-yr avg.) increase was
not statistically significant.
Corn yield, N recovery, and NUE as influenced by
time of application and N source at Waseca.
N Management 3-Yr Avg.
Time Source N-Serve Yield N recovery NUE
bu/A % bu/lb FN
Fall Urea No 152 43 0.36
“ “ Yes 158 47 0.42
“ AA No 168 60 0.51
“ “ Yes 170 63 0.53
Spr. PP Urea No 185 76 0.66
“ AA No 182 84 0.64
-- None -- 112 -- --
Corn production and nitrate loss as affected
by time of N application and N-Serve.
7-Year Average Nitrate-N
N Treatment Corn N Economic Loss in
Time N-Serve Yield Recovery Return Drainage
Bu/A % $/A Lb/A/Inch
Fall No 131 31 67 3.8
“ Yes 139 37 78 3.1
Spring No 139 40 85 3.1
Split No 145 44 97 3.3
LSD (0.10) = 4
1987-93, Waseca, MN
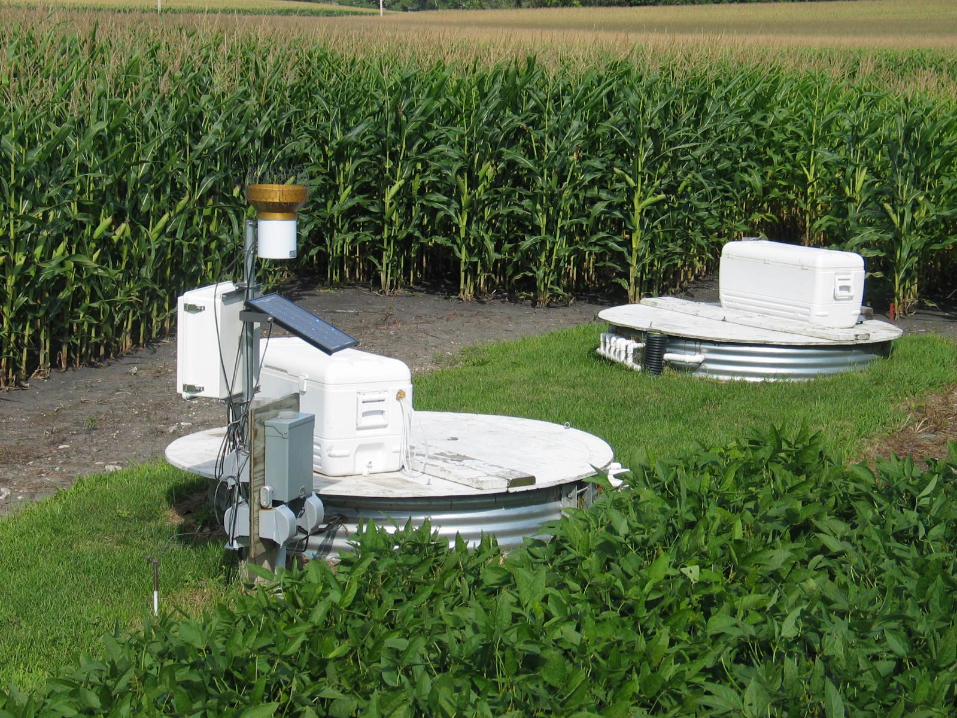
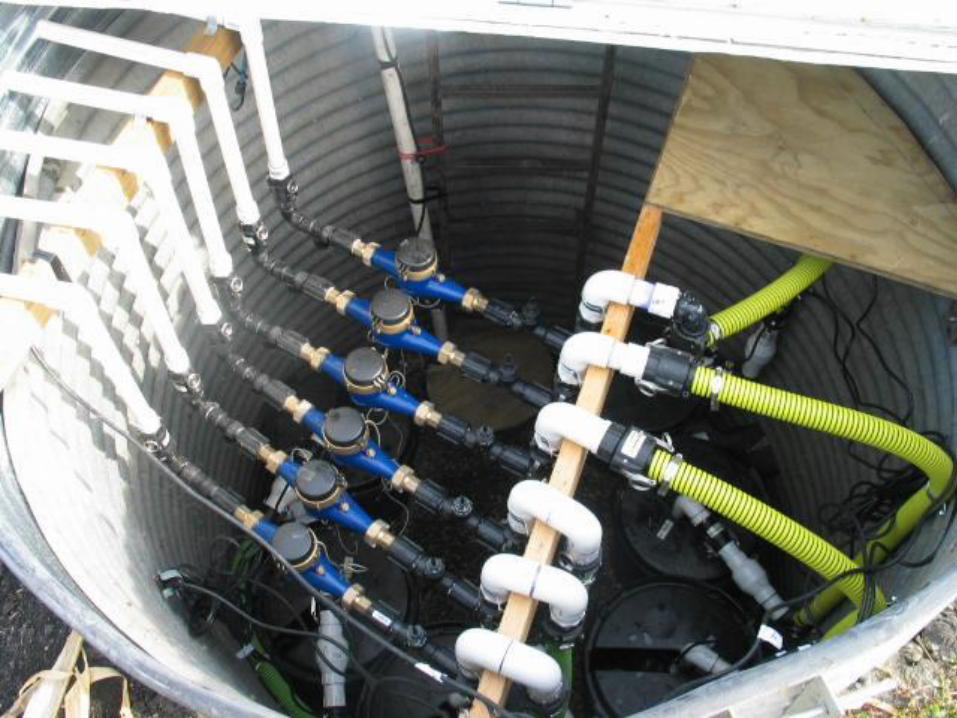
Nitrogen (NO3) Loss
from Tile Drainage
Lamberton 1973-1985• Site history
- no N or manure for previous 10 yrs
- corn, soybean, small grain rotation
• Soil: Normania cl, mod. well drained
• Crop: Continuous corn
• Fertilizer N Rates (Spring), 1973-79
18 (as starter), 100, 200 & 400 lb N/A
• 12 - 45’x50’ separated drainage plots (3 reps)
1973-75 Nitrate-N Concentration
Annual Year
N rate 1973 1974 1975
lb N/A - - - - - - - mg/L - - - - - -
18 13 19 19
100 15 25 23
200 13 37 43
400 12 65 81
Annual flow (inches) 1.46 3.58 5.04
1973-75 Nitrate-N Loss
Annual Year
N rate 1973 1974 1975
lb N/A - - - - - - - lb N/A - - - - - -
18 4 15 17
100 5 20 22
200 4 27 53
400 5 48 107
• Corn yields were poor (70-110 bu/A) – Dry
• No movement of nitrate below 6’
1976-79 Nitrate-N Concentration Annual Year
N rate 1976 1977 1978 1979
lb N/A - - - - - - - - mg/L - - - - - - - -
18 * 28 21 16
100 * 48 53 47
200 * 73 119 106
400 * 150 191 172
Annual flow (Inches): 0.56 1.99 8.21
* = Drought, no tile flow
1976-79 Nitrate-N LossAnnual Year
N rate 1976 1977 1978 1979
lb N/A - - - - - - - - lb N/A - - - - - - - -
18 * 4 10 30
100 * 6 26 82
200 * 6 43 165
400 * 18 87 3741/
* = Drought, no tile flow & no grain yield. 1/ Nitrate moved below 10’ with 400-lb rate