N N N E E E V V V A A A D D D A A A D D D E E E P P P A A A R R R T T T M M M E E E N N N T T T O O O F F F W W W I I I L L L D D D L L L I I I F F F E E E 2 2 2 0 0 0 0 0 0 9 9 9 – – – 2 2 2 0 0 0 1 1 1 0 0 0 B B B I I I G G G G G G A A A M M E E E S S S T T T A A A T T T U U U S S S
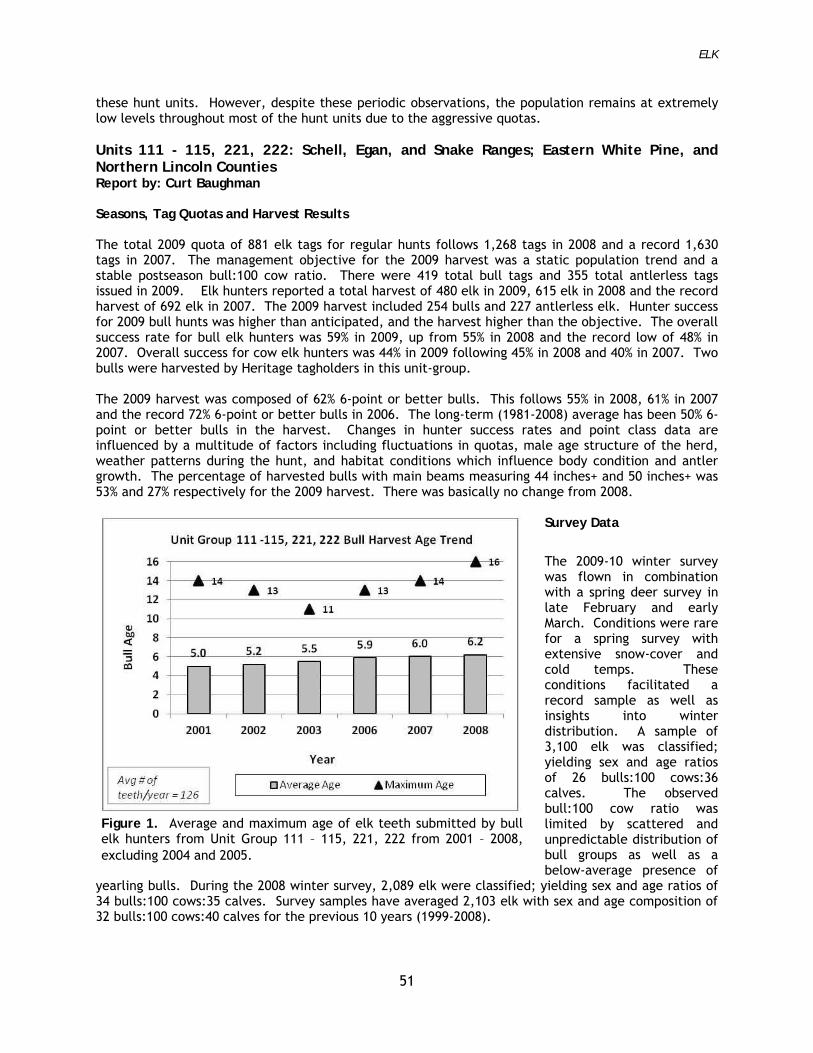
This publication will be made available in an alternative format upon request. Nevada Department of Wildlife receives funding through the Federal Aid in Wildlife Restoration. Federal laws prohibit discrimination on
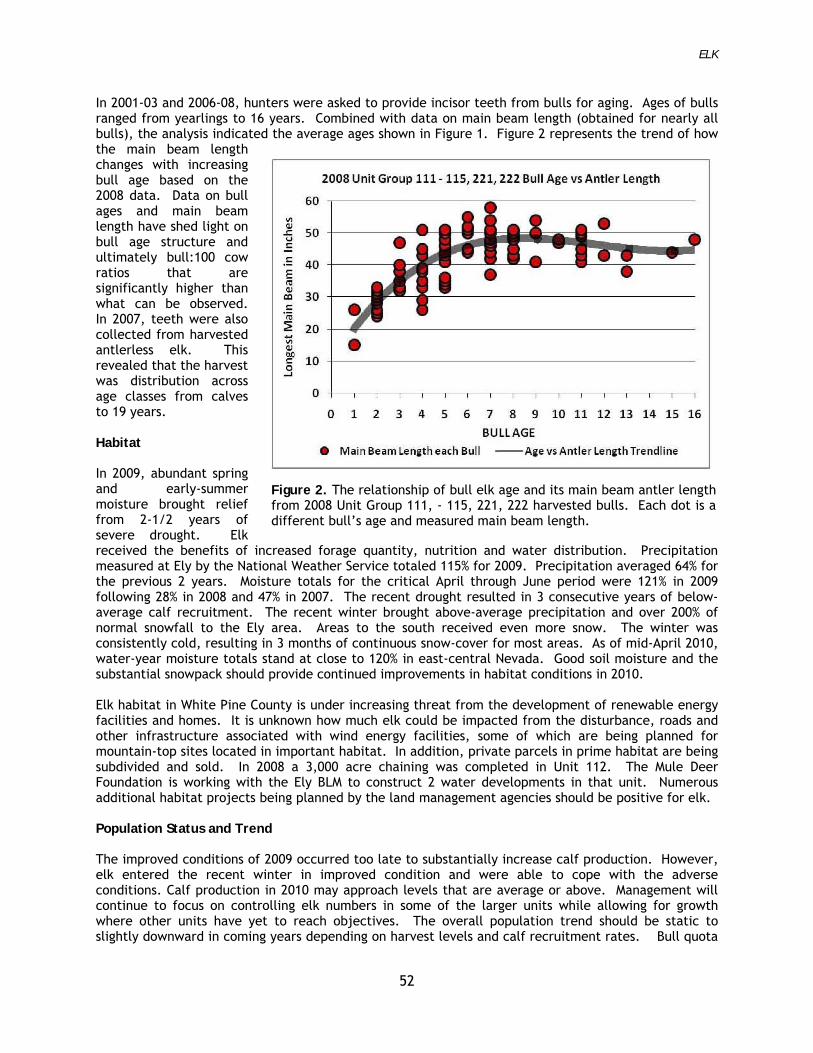
the basis of race, color, national origin, age, disability, and sex [in educational programs]. If you believe you’ve been discriminated against in any NDOW program, activity, or facility, please write to the following:
US Fish and Wildlife Service or Director Division of Federal Assistance Nevada Department of Wildlife
4401 North Fairfax Drive, Mailstop: MBSP-4020 1100 Valley Road Arlington, VA 22203 Reno, Nevada 89512 Individuals with hearing impairments may contact the Department via telecommunications device at our Headquarters at 775-688-1550,
or teletype to the following State Relay number 1-800-326-6868
STATE OF NEVADA
Jim Gibbons, Governor
DEPARTMENT OF WILDLIFE Ken Mayer, Director
GAME DIVISION
Larry Gilbertson, Chief
Mike Cox, Big Game Staff Biologist Tony Wasley, Mule Deer Staff Biologist
Kevin Lansford, Furbearer Staff Biologist
Dawn Carter, Administrative Assistant
Western Region Southern Region
Eastern Region
Regional Supervisors Mike Dobel Steve Kimble Larry Gilbertson Big Game Biologists Chris Hampson Pat Cummings Curt Baughman Carl Lackey Tom Donham Ken Gray Kyle Neill Mike Scott Kari Huebner Ed Partee Jeremy Lutz Jason Salisbury Caleb McAdoo Mike Podborny Russell Woolstenhulme
Cover Photos by: Bill Homan, Larry Spradlin, and Tony Wasley
NEVADA DEPARTMENT OF WILDLIFE
2009-2010 BIG GAME STATUS
This Program Receives Federal Aid in Wildlife Restoration Grant W-48-R-41; Sub-Grant II, Big Game Management
Compiled and Edited by:
Mike Cox, Big Game Staff Biologist Tony Wasley, Mule Deer Staff Biologist
Mike Dobel, Regional Supervising Biologist
Larry Gilbertson, Game Division Chief Steve Kimble, Regional Supervising Biologist
Kevin Lansford, Furbearer Staff Biologist
Dawn Carter, Administrative Assistant
NEVADA-~WILDLIFE
_...-
TABLE OF CONTENTS
BIG GAME STATUS STATEWIDE SUMMARY ............................. SS1 – SS7
MULE DEER .......................................................................... 1 Units 011 – 015: Northern Washoe and Western Humboldt Counties ........................................ 1 Units 021, 022: Southern Washoe County ........................................................................ 2 Units 031, 032, 034, 035: Western Humboldt County .......................................................... 3 Unit 033: Sheldon National Wildlife Refuge; Washoe and Humboldt Counties ............................ 4 Units 041, 042: Western Pershing and Southern Humboldt Counties ........................................ 5 Units 043 - 046: Eastern Pershing and Southern Humboldt Counties ........................................ 6 Unit 051: Santa Rosa Mountains; Eastern Humboldt County .................................................. 7 Units 061 - 062, 064, 066 – 068: Independence and Tuscarora Ranges; Elko County ..................... 7 Unit 065: Pinyon Range; Southwestern Elko County ........................................................... 8 Units 071 – 079, 091: Northeastern Elko County ................................................................ 9 Unit 081: Goose Creek Area; Northeastern Elko County ...................................................... 10 Units 101 - 108: Southern Elko and Northwestern White Pine Counties .................................... 10 Units 111 – 113: Eastern White Pine County ..................................................................... 11 Units 114 – 115: Snake Range; Southeastern White Pine County ............................................. 12 Unit 121: North Egan, Cherry Creek Ranges; White Pine and Elko Counties ............................... 13 Units 131 - 134: Southern White Pine, Eastern Nye and Western Lincoln Counties ....................... 13 Units 141 - 145: Eureka and Eastern White Pine Counties .................................................... 14 Units 151, 152, 154, 155: Lander and Western Eureka Counties ............................................. 15 Units 161 - 164: North-Central Nye and Southern Lander and Eureka Counties ........................... 16 Units 171 - 173: Northwestern Nye and Southern Lander Counties .......................................... 17 Units 181 - 184: Churchill, Southern Pershing and Western Lander Counties ............................. 18 Unit 192: Carson River Interstate Herd; Douglas County ...................................................... 18 Unit 194, 196: Carson Range and Peavine Mountain Interstate Herd; Washoe and Carson City
Counties ..................................................................................................... 19 Unit 195: Virginia Range Herd; Storey, Washoe and Lyon Counties ......................................... 20 Units 201, 202, 204 – 206: Walker/Mono Interstate Deer Herd; Douglas, Lyon and Mineral Counties . 20 Unit 203: Mason and Smith Valley Resident Herds; Lyon County ............................................ 21 Units 211, 212: Esmeralda County ................................................................................ 21 Units 221 - 223: Northern Lincoln and Southern White Pine Counties ...................................... 22 Unit 231: Wilson Creek Range; Northeastern Lincoln County ................................................ 22 Units 241 – 245: Clover, Delamar, and Meadow Valley Mountain Ranges; Lincoln County ............... 23 Units 251 - 253: South Central Nye County ...................................................................... 23 Units 261 – 268: Clark and Southern Nye Counties ............................................................. 24 Units 271, 272: Southern Lincoln and Northeastern Clark Counties ......................................... 24 Unit 291: Pinenut Mountain Herd: Douglas County ............................................................. 25
PRONGHORN ANTELOPE ........................................................ 26 Units 011 - 015, 021, 022: Washoe and Western Humboldt Counties ....................................... 26 Units 031, 032, 034, 035, 051: Humboldt County .............................................................. 28 Unit 033: Sheldon National Wildlife Refuge; Washoe and Humboldt Counties ............................ 29 Units 041, 042: Western Pershing and Southern Humboldt Counties ........................................ 30 Units 061, 062, 064, 071, 073: North Central Elko County .................................................... 31
i
Units 065, 142, portion of 144: Southern Elko County, Northern Eureka County ......................... 31 Unit 066, Owyhee Desert: Northwestern Elko County ......................................................... 32 Units 067, 068: Western Elko and Northern Lander and Eureka Counties .................................. 32 Units 072, 074, 075: Northeastern Elko County ................................................................. 33 Units 076, 077, 079, 081, 091: Northeastern Elko County .................................................... 33 Units 078, 105 – 107, 121: Southeastern Elko and Central White Pine Counties .......................... 34 Units 101 – 104, 108, portion of 144: South Central Elko and Western White Pine Counties ............ 34 Units 111 – 114: Eastern White Pine County ..................................................................... 35 Units 115, 231, 242: Eastern Lincoln and Southern White Pine Counties ................................... 36 Units 131, 145, 163, 164: Southern Eureka, Northeastern Nye, and Southwestern White Pine
Counties ..................................................................................................... 37 Units 132-134, 245: Eastern Nye and Western Lincoln Counties ............................................. 37 Units 141, 143, 151 – 155: Eastern Lander and Eureka Counties ............................................. 38 Units 161, 162: Northern Nye, Southeastern Lander, and Southwestern Eureka Counties .............. 38 Units 171 – 173: Northwestern Nye and Southern Lander Counties .......................................... 39 Units 181-184: Churchill, Southern Pershing, Western Lander and Northern Mineral Counties ........ 40 Units 202, 204: Lyon and Mineral Counties ..................................................................... 41 Units 203, 291: Lyon, Douglas Counties ......................................................................... 41 Units 205, 206: Eastern Mineral County ......................................................................... 42 Units 221 – 223, 241: Lincoln and Southern White Pine Counties ............................................ 42 Unit 251, Central Nye County ..................................................................................... 43
ROCKY MOUNTAIN ELK .......................................................... 44 Units 061, 071: Bruneau River and Merritt Mountain Area; Northern Elko County ........................ 44 Units 062, 064, 066 – 068: Independence and Tuscarora Ranges; Western Elko and Northern Eureka
and Lander Counties ...................................................................................... 45 Units 072, 074: Jarbidge Mountains; Northern Elko County .................................................. 45 Unit 073: Stag Mountain Area; Elko County ..................................................................... 46 Unit 075: Snake Mountains; Elko County ......................................................................... 47 Units 076, 077, 079, 081: Thousand Springs, Goose Creek, and Pequop Mountains Area; Northern
Elko County ................................................................................................. 48 Units 078, 104A, 105 – 107: Spruce Mountain; Elko County ................................................... 49 Unit 091: Pilot Range; Eastern Elko County ..................................................................... 50 Unit 101 – 103: East Humboldt and Ruby Mountains; Elko County ........................................... 50 Units 111 - 115, 221, 222: Schell, Egan, and Snake Ranges; Eastern White Pine, and Northern
Lincoln Counties ........................................................................................... 51 Unit 121 and portion of Units 104 and 108: Cherry Creek, North Egan, Butte and Medicine Ranges;
Northern White Pine County ............................................................................. 53 Units 131,132: White Pine, Grant and Quinn Canyon Ranges; Southern White Pine and Eastern Nye
Counties ..................................................................................................... 53 Units 161 - 164: North-Central Nye and Southern Lander and Eureka Counties ........................... 54 Unit 231: Wilson Creek Range; Lincoln County ................................................................. 55 Unit 241-242: Delamar and Clover Mountains; Lincoln County ............................................... 56 Unit 262: Spring Mountains; Clark and Southern Nye Counties ............................................... 56
DESERT BIGHORN SHEEP ........................................................ 58 Units 044, 182: East and Stillwater Ranges; Pershing and Churchill Counties ............................ 58 Unit 045: Tobin Range; Pershing County ........................................................................ 58 Units 131 and 164: White Pine Range; Southern White Pine and Eastern Nye Counties ................. 59
ii
Unit 132: Grant Range; Eastern Nye County .................................................................... 60 Unit 133, 245: Pahranagat and Mount Irish Ranges; Lincoln County ........................................ 61 Unit 134: Pancake Range; Nye County ........................................................................... 61 Unit 161: Toquima Range; Northern Nye County ............................................................... 62 Units 162, 163: Monitor and Hot Creek Ranges; Nye County ................................................. 62 Unit 173: Toiyabe Range; Northern Nye County ................................................................ 63 Unit 181: Fairview Peak, Slate Mountain, and Sand Springs Range; Churchill County .................... 64 Unit 183: Clan Alpine Range; Churchill County ................................................................. 64 Unit 184: Desatoya Range; Churchill and Lander Counties ................................................... 65 Unit 202: Wassuk Range; Mineral County ........................................................................ 66 Unit 204: Pine Grove Range; Lyon County ....................................................................... 66 Unit 205: Gabbs Valley Range, Gillis Range, Pilot Mountains; Eastern Mineral County .................. 67 Unit 206: Excelsior Range; Mineral County ...................................................................... 67 Unit 211: North, Monte Cristo Range; Esmeralda County ..................................................... 68 Unit 211: South, Silver Peak Range and Volcanic Hills; Esmeralda County ................................. 69 Unit 212: Lone Mountain; Esmeralda County .................................................................... 69 Unit 221: South Egan Range; Lincoln County .................................................................... 70 Unit 223, 241: Hiko, Pahroc, and Delamar Ranges; Lincoln County ......................................... 70 Unit 243: Meadow Valley Mountains; Lincoln County .......................................................... 71 Unit 244: Arrow Canyon Range; Northern Clark County ....................................................... 71 Unit 252: Stonewall Mountain; Nye County ...................................................................... 72 Unit 253: Bare Mountain and Specter Range; Southern Nye County ......................................... 73 Unit 261: Last Chance Range; Southeastern Nye County ...................................................... 74 Unit 262: Spring Mountains (La Madre, Red Rock and South Spring Mountains) and Bird Spring
Range; Western Clark County ............................................................................ 76 Unit 263: McCullough Range and Highland Range; Southern Clark County ................................. 77 Unit 264: Newberry Mountains; Southern Clark County ....................................................... 78 Unit 265: South Eldorado Mountains; Southeastern Clark County ........................................... 79 Unit 266: North Eldorado Mountain;: Southeastern Clark County ........................................... 80 Unit 267: Black Mountains; Eastern Clark County .............................................................. 81 Unit 268: Muddy Mountains: Clark County ....................................................................... 81 Unit 271: Mormon Mountains; Lincoln County .................................................................. 83 Unit 272: Virgin Mountains and Gold Butte; Northeastern Clark County ................................... 83 Unit 280: Spotted Range; Northwestern Clark County ......................................................... 85 Unit 281: Pintwater Range; Northwestern Clark County ...................................................... 85 Unit 282: Desert Range and Desert Hills; Northwestern Clark County ...................................... 86 Units 283, 284: East Desert Range and Sheep Range; Northern Clark County ............................. 86 Unit 286: Las Vegas Range; Clark County ........................................................................ 87
CALIFORNIA BIGHORN SHEEP .................................................. 88 Unit 012: Calico Mountains and High Rock Canyon; Western Humboldt and Washoe Counties ......... 88 Unit 014: Granite Range; Washoe County ....................................................................... 89 Unit 022: Virginia Mountains; Washoe County ................................................................. 91 Unit 031: Double H, Montana and Trout Creek Mountains; Humboldt County ............................. 91 Unit 032: Pine Forest Range and McGee Mountain; Humboldt County ...................................... 92 Unit 033: Sheldon National Wildlife Refuge; Washoe and Humboldt Counties ............................ 93 Unit 034: Black Rock Range; Humboldt County ................................................................. 93 Unit 035: Jackson Mountains; Humboldt County ............................................................... 94
iii
iv
Unit 051: Santa Rosa Range; Humboldt County ................................................................. 95 Units 066, 068: Snowstorm and Sheep Creek; Western Elko and Northern Lander and Eureka
ROCKY MOUNTAIN BIGHORN SHEEP ........................................... 97 Unit 074: The Badlands; Elko County ............................................................................. 97 Unit 091: Pilot Peak; Elko County ................................................................................. 97 Unit 101: East Humboldt Range; Elko County ................................................................... 98 Unit 102: Ruby Mountains; Elko County .......................................................................... 99 Unit 114: North Snake Range – Mount Moriah; Eastern White Pine County ................................. 100
MOUNTAIN GOAT ............................................................... 102 Unit 101: East Humboldt Mountains; Elko County .............................................................. 102 Unit 102: Ruby Mountains; Elko County .......................................................................... 102 Unit 103: South Ruby Mountains; Elko and White Pine Counties ............................................. 102
MOUNTAIN LION ................................................................ 103 Western Region Areas: 1, 2, 3, 4, 5, 18, 19, 20, and 29 ...................................................... 103 Eastern Region: Areas 6, 7, 8, 9, 10, 11, 12, 13, 14, and 15 ................................................. 105 Southern Region: Areas 16, 17, 21, 22, 23, 24, 25, 26 and 27 ............................................... 108
BLACK BEAR ..................................................................... 111 Western Region ...................................................................................................... 111
SUMMARY
BIG GAME STATUS STATEWIDE SUMMARY
MULE DEER The 2009 hunting season resulted in the harvest of 6,837 deer. Hunter success for resident rifle hunters was 40%, the same as 2008. Although 2009 resident rifle hunter success was relatively low at 40%, the statewide percentage of 4-points or better across all harvest was at an all-time high at 46%. The 46% 4-point or better is likely the result of 2 different factors; poor production and recruitment observed in many areas in 2007 and 2008 reduced the availability of 1- and 2-year old bucks for harvest, and good older age-class representation. Since the implementation of split rifle seasons in many areas in 2007, draw odds have remained low for the 16-day early hunts at 2:1 to 4:1 and, on average, 4 to 5 times higher for the 11 day late hunts. As a result of the hotter drier conditions in the early hunts, hunter success is typically half of what hunters enjoy in the later hunts. Analysis in 2008 demonstrated that statewide hunter success was approximately 3 to 4 percent lower as a result of going to an early/late season split. However, as a result of the lower hunter success, many more hunters can be provided an opportunity to go afield with friends or family and pursue Nevada’s most abundant big game animal. Limited post season surveys resulted in 21,600 deer classified statewide up from approximately 13,500 in 2008. Statewide fawn production as indicated by fall surveys improved slightly from the last 2 years but continues to remain below 50 fawns:100 does and is still amongst the 6 lowest statewide fawn ratios on record. Spring surveys resulted in the classification of 34,400 deer, 10,000 more than was classified in the spring of 2009. Despite the low observed production in the fall, fawn recruitment was up considerably at 34 fawns:100 adults compared to the 27 fawns:100 adults classified in the spring of 2009 and nearly at the long-term statewide average of 35 fawns:100 adults. Good body condition resulting from record June precipitation and mild winter range conditions are likely contributors to the low winter losses and the resulting good recruitment. The increase in recruitment observed in 2009 has resulted in a modest increase in the statewide mule deer population estimate. Although the 2010 statewide mule deer population estimate is virtually the same as in 2009, many of the state’s management areas are experiencing changes in their population levels. However, population declines observed in some areas are being offset by increases in other areas and the end result is a slight statewide increase. Biologists are optimistic that good body condition, low winter mortality, and mild winter conditions in most areas will help contribute to increased production in the spring of 2010.
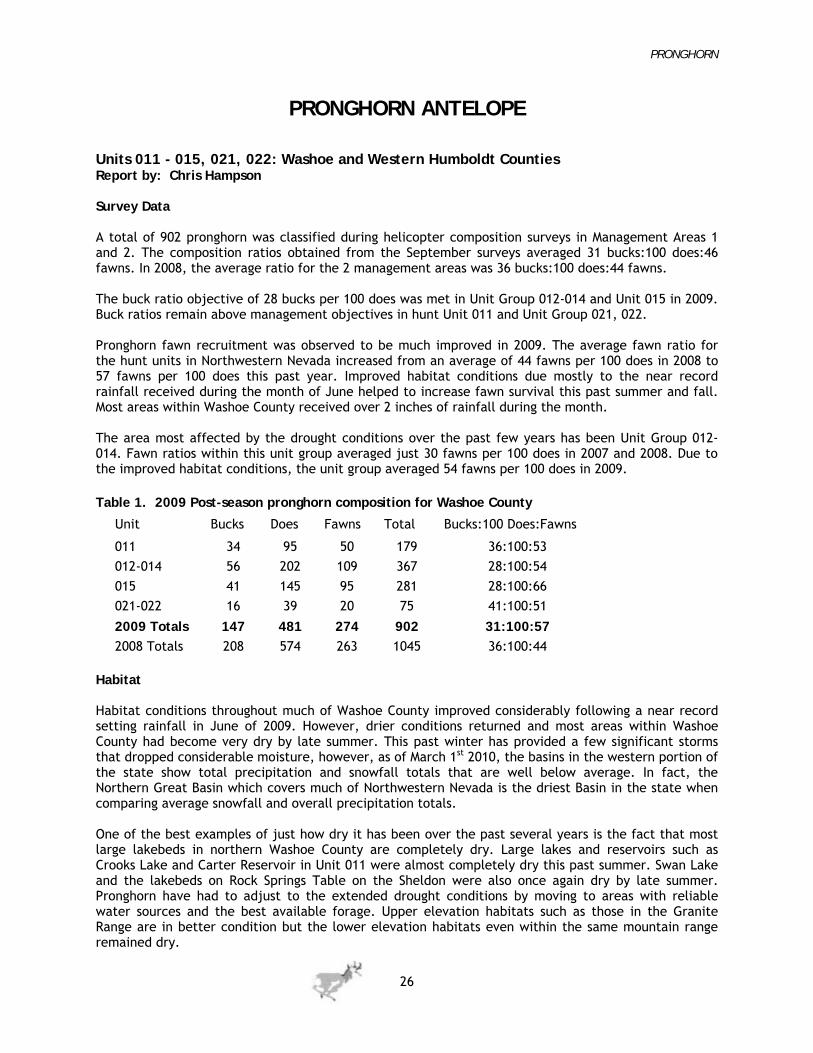
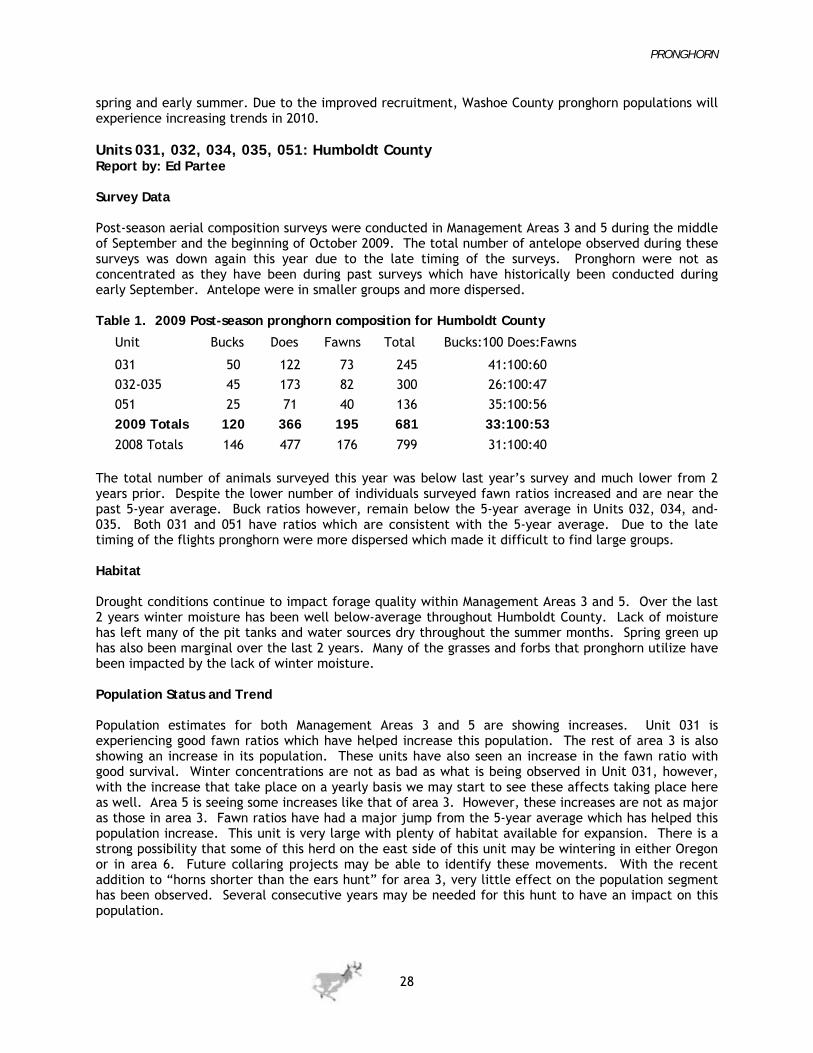
PRONGHORN ANTELOPE Nevada pronghorn hunters continue to enjoy outstanding pronghorn hunting opportunity and subsequent harvest rates. A total of 2,734 tags was available this past year to hunt pronghorn with an average of 8 applications per available tag. During 2009 resident rifle hunters harvested 1,465 buck antelope and 230 pronghorn with horns shorter than the ears. Resident rifle hunters recorded an average hunter success rate of 77 percent with many units registering success rates in excess of 80 percent. Harvest questionnaire data shows that over 50 percent of the bucks harvested had horns 14 inches or longer and 36 percent recorded bucks with horns 15 inches or longer. Division biologists observed a total of 9,304 pronghorn while conducting their annual composition surveys. These surveys yielded ratios of 39 bucks:100 does:38 fawns. Buck ratios remain similar to last year at high levels indicating a conservative harvest approach. Fawn ratios rose dramatically in most of the northwestern and northeastern portion of the state but remained low in Nye, White Pine and southern Elko Counties. Overall, fawn ratios rose from what was observed in 2008 and will provide for an increase in the statewide pronghorn population.
SS-1
SUMMARY
Nevada’s estimated statewide pronghorn population increased by 6 percent this year and is at an all time high of 26,000 animals. Increased fawn production and recruitment in many of the larger pronghorn populations in the northwest and northeast allowed for this increase. With pronghorn populations at record levels NDOW biologists will continue to monitor herds and recommend solutions to keep them in check with the proper carrying capacity of the range. With this in mind a 16 percent increase in doe tags is being recommended this year and NDOW biologists may also consider trapping and transplanting activities in those herds that lack suitable winter range. Tag numbers recommended for horns shorter than the ears hunts are intended to remove does at a level that will either prevent further increases or in some cases reduce overall numbers.
ROCKY MOUNTAIN ELK The sale of 2,972 elk tags in 2009 resulted in the harvest of 1,420 elk compared to 2,723 tags sold last year with a harvest of 1,319 elk. The 2008 elk harvest consisted of 697 bulls and 724 antlerless elk. The quality of bulls in the harvest remains high with more than 67% of bulls reported as being 6-points-or-better. Harvest strategies are designed to maintain population objectives with a combination of bull harvest and intensive cow harvest directed towards individual unit population objectives. In units where elk populations are below objectives, elk harvest management is designed to allow those populations to increase. The Department's Elk Management on Private Lands Program continued to be a great success and benefit to landowners with 66 elk-incentive tags sold with estimated revenue generation of more than $500,000 for private landowners again this year. Record elk survey samples were obtained in some areas this year. A total of 9,222 elk was classified during aerial winter composition surveys; yielding statewide sex and age ratios of 32 bulls:100 cows:31 calves compared to the previous year when 7,351 animals were classified, yielding ratios of 39:100:38. Calf recruitment was fair in 2010 but still allowed for population increases in most units. The 2010 statewide spring adult elk population estimate is 13% higher than last year with 12,300 elk estimated compared to 10,900 last year. Nevada’s elk harvest management continues to be based on meeting population objectives within the guidelines of the state’s Elk Species Management Plan. Statewide population increases resulted in an increase in recommended tag quotas for the 2010 season. Hunters lucky enough to receive an elk tag for 2010 should enjoy good hunting conditions with overall healthy elk populations and good availability of mature bulls for harvest.
DESERT BIGHORN SHEEP Nevada continues to be the leader in providing quality desert bighorn hunting opportunities in North America. The Nevada Department of Wildlife issued a record number of 193 tags in the 2009 desert bighorn hunt. Hunter success continued to be high at 89% of hunters harvesting a ram. Hunters averaged less time in the field when compared to the last few years at 5.2 days hunted in 2009. The statewide average age of harvested rams in 2009 was 6.2 years with an average unofficial B&C score of over 153. Field biologists in the 2009 statewide desert bighorn survey classified over 3,500 animals. The calculated lamb ratio of 31 lambs:100 ewes indicates that observed lamb recruitment was lower than the 38 lambs:100 ewes observed in the survey last year. Population estimates by hunt units vary across the state, with 49% increasing, 22% decreasing, and 29% not changing. The 2010 statewide desert bighorn population estimate is the highest ever recorded at 7,600 animals which is an increase of 4% from last year’s estimate of 7,300. Restoration efforts of bighorn sheep populations into historic Nevada ranges continued this past year with releases in the Delamar and Meadow Valley Mountains of Lincoln County, Southern Stillwater Range in Churchill County, and the Virgin Gold Buttes of Clark County. These achievements would not be possible without the efforts of past and present NDOW biologists working along with dedicated, passionate, and active sportsman's conservation organizations.
SS-2
SUMMARY
ROCKY MOUNTAIN BIGHORN SHEEP All recent focus has been on the tragic dieoffs of the East Humboldt Range and Ruby Mountain Rocky Mountain bighorn sheep herds. NDOW biologists and veterinarian confirmed in December 2009 a bacterial pneumonia event that was running its course in both herds. As of mid April 2010, 102 known mortalities have been found among both herds. Both sexes, and mature and immature animals alike had succumbed to the disease. As with any bighorn dieoff, it will take a few years through aerial and ground surveys and follow up on radiomarked animals to get a more accurate assessment of the actual mortalities that occurred in Units 101 and 102. The statewide 2010 Rocky Mountain bighorn sheep population is estimated to be below 400 compared to the 2009 estimate of 560. Similar to what was seen during the past disease event, it is anticipated poor lamb recruitment in Units 101 and 102 will be realized in the next several years to come, initially suppressing population growth. The Department of Wildlife is conducting ongoing monitoring efforts to help better understand the extent this disease outbreak has had on the populations and to attempt to identify causal agents or catalysts that may have been involved. The statewide 2009-2010 survey sample size of 175 Rocky Mountain bighorn (excluding Unit 101 and 102) yielded ratios of 68 rams:100 ewes:40 lambs. The individual lamb ratios were highly variable among the different herds with the lowest occurring on Mount Moriah (17 lambs:100 ewes) and the highest involving the Unit 091 herd (96 lambs:100 ewes). Eleven ram tags were available for 2009 and all 11 of the hunters were successful. The average age of rams harvested was 7.9 and the average B&C green-score was 171 & 5/8. The largest ram (11 years-old) was harvested in Unit 101 and was measured at 195 & 4/8. This is a tremendous animal and new record for that unit but also a harsh reminder of the devastating loss of the East Humboldt herd. On the bright side, the Unit 091 population continues to perform well, expanding not only on Pilot Mountain but with newly constructed water developments in the Leppy Hills, this subherd is also doing well.
CALIFORNIA BIGHORN SHEEP Over 10,000 applications were received this past year for 48 California bighorn tags. Resident hunters faced odds of 131:1 while nonresidents faced odds averaging 1,141:1. During the 2009 California bighorn season a total of 48 hunters harvested 47 rams for a 98 percent success rate. The average age of all harvested rams was slightly over 7 years. The average Boone and Crockett score compared favorably with past years at 155 inches. Biologists conducted composition surveys on all hunted California bighorn herds during 2009. A total of 835 bighorn was classified as 191 rams, 431 ewes and 213 lambs for a ratio of 44 rams:100 ewes:49 lambs. Ram ratios declined slightly from what was observed in 2008 while the overall average lamb ratio remained the same as what was observed during the previous year. The 2010 statewide population estimate is 1,900 California bighorn sheep and is the highest on record showing a 6 percent increase from last year. No problems or major die-offs were noted in any populations this past year. High population levels and good ram ratios will allow for an increase in tags during the 2010 season. Overall, biologists are recommending a 7 percent increase in California bighorn tags this year.
MOUNTAIN GOAT There were 28 mountain goat tags in 2009 including; one PIW tag, 24 resident tags, and three nonresident tags. Hunter success increased slightly from 93% in 2008 to 96% in 2009. In 2009, hunters checked in 19 billies and 8 nannies. Nanny harvest, expressed as a percent of the total harvest, has increased for four consecutive years and at 30% in 2009 was the highest reported and nearly twice the long-term average of
SS-3
SUMMARY
17%. In 2009, average age of harvested animal was 7.7 years in unit 101, 4.5 years in unit 102, and 8.0 years in unit 103. Average age of harvested animal in unit 101 has increased for five consecutive years and at 7.7 is well above the long-term average of 4.9 years. Average age of harvested animal in unit 102 is relatively stable at 4.5 years but slightly below the five-year average of 4.8 years. Horn length was well above the long-term average in both units 101 and 103, while right at the long-term average in unit 102. Surveys were conducted in February 2010 and 190 goats were observed between units 101 and 102. In unit 101, 88 goats were observed yielding a ratio of 17 kids:100 adults. In unit 102, 102 goats were observed yielding a ratio of 34 kids:100 adults. Although 17 kids:100 adults is too low to demonstrate population growth, 34 kids:100 adults is more than adequate to allow a population to grow. However, this year, goat populations experienced increased mortality caused by bacterial pneumonia. Prior to this year all three units (101, 102, and 103) had been exhibiting a stable to slightly upward trend. However, this year, populations are believed to be exhibiting a substantial decline (estimated at 30 percent). In 2009 the odds of drawing a goat tag were 176:1 for residents and 794:1 for nonresidents. As a result of the ongoing disease event in the East Humboldt and Ruby Mountains, the number of goat tags in 2010 should decrease moderately relative to last year. However, applicants lucky enough to draw one of these tags should still have an opportunity for a hunt of a lifetime in the remote, beautiful, high elevation terrain inhabited by mountain goats in Northeastern Nevada.
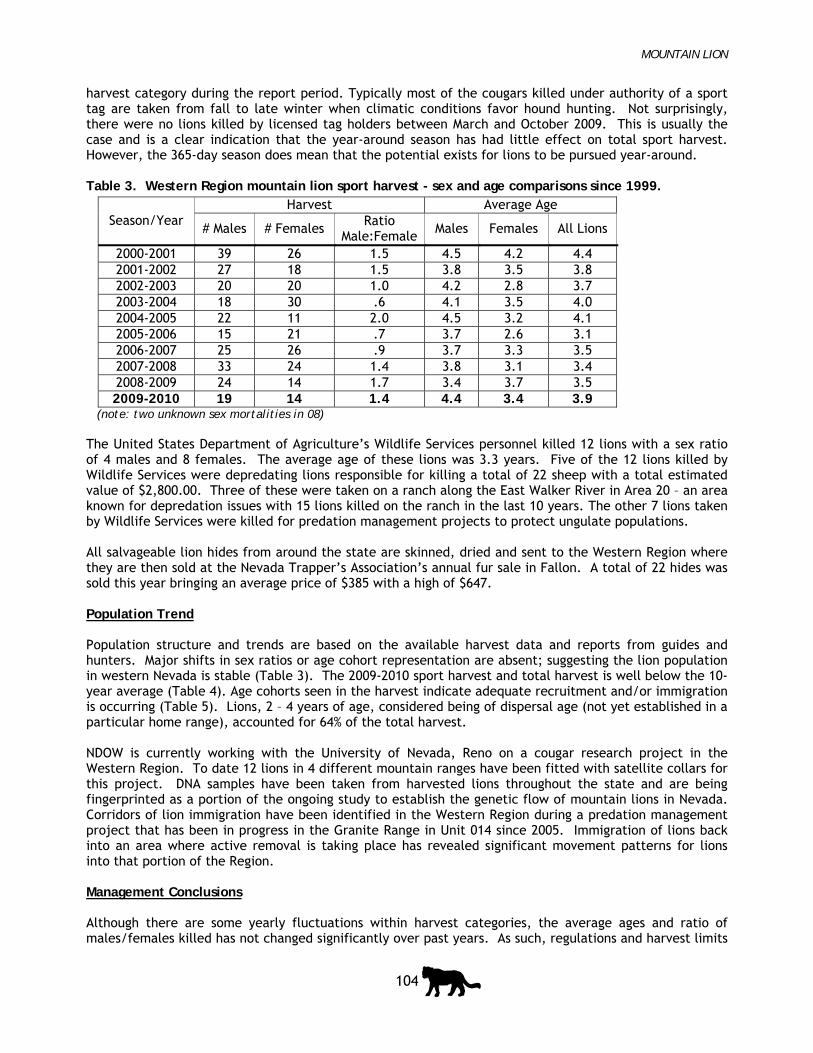
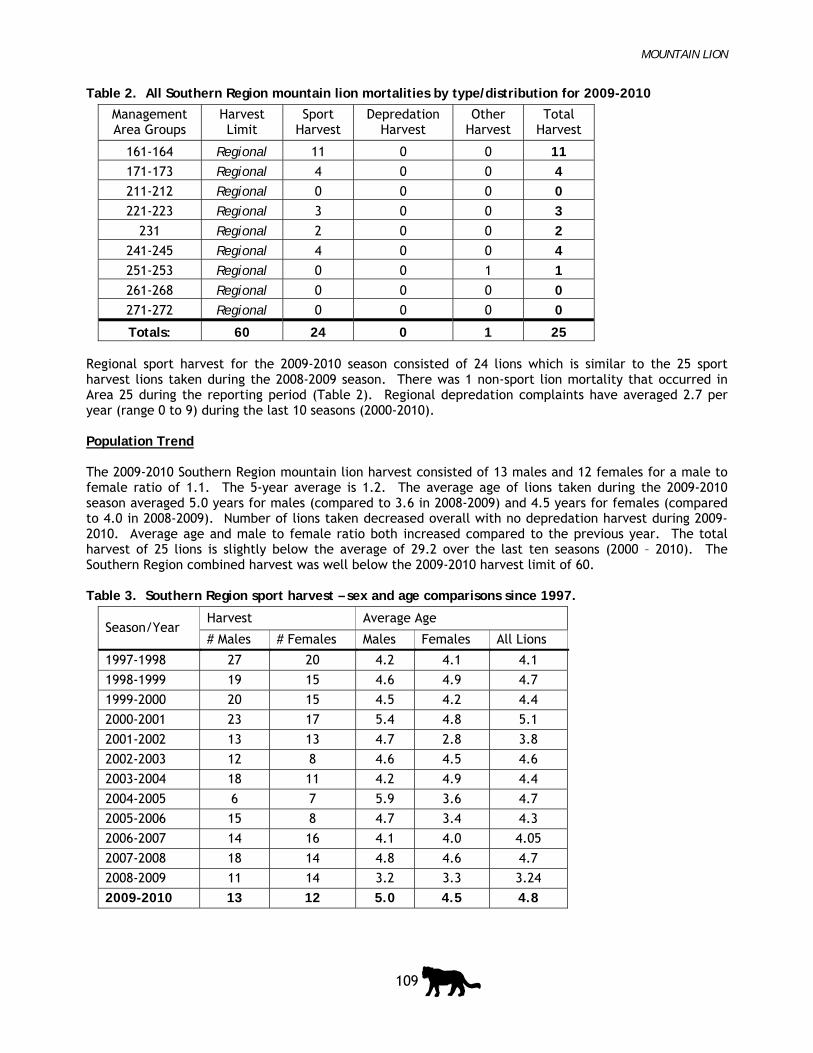
MOUNTAIN LION The 2009-2010 (2009) mountain lion hunting season resulted in an overall lion mortality of 170 lions. Sport hunter harvest accounted for 131 lions or 77% of the total lions taken. The 10- and 5-year average for statewide sport harvest of lions is 143 and 129, respectively. The 2009 sport harvest surpassed the 2008 harvest overall by 10%. This fluctuation in harvest falls well within normal ranges and is generally tied to hunting conditions for the winter months. Lions removed for the protection of livestock, human safety or natural resource protection, such as deer and bighorn sheep, increased by 5 lions to 31 in 2009. The depredation harvest represents 18% of the overall mortalities. The increase in depredation lions over the last couple years is mainly due to several Predation Management Projects implemented by sportsmen’s dollars to reduce the impact of predation on ungulate populations, mainly deer and bighorn sheep. Six of those lions were taken from Predation Management Project 18 in Hunt Unit 014, the Granite Range, for the enhancement of mule deer herds. Three other lions were taken to protect bighorn sheep on Mount Moriah where lion predation had been identified on the resident herd. The other 22 depredation lions were removed for the protection of livestock or human safety. The remaining nine lions (6%) were killed incidentally or hit by vehicles. Sport harvest was 43% of the statewide limit of 306 mountain lions. Males constituted 54% of the total 2009 sport harvest compared to the 20-year average of 58%.
WEATHER AND CLIMATE EFFECTS Northeastern Nevada Significant storms in late May and early June of 2009 resulted in excellent habitat conditions in much of Elko County. Spring and summer precipitation created favorable summer range conditions. Snow pack levels and moisture content for the winter of 2009-10 continue to remain below the long-term average for the Ruby Mountains and adjacent mountain ranges. The winter of 2009-10 was a relatively mild winter. Habitat conditions in Eureka County improved in the short term with good leader growth on browse and overall good forage production and increased water availability following near record precipitation in June 2009. This was preceded by consecutive years of drought in 2007 and 2008. In Lander County, the northern half of units 141 and 152 experienced a relatively mild and open winter. The southern portion of units 152,154, and 155 experienced a much harder winter. Deep snow and cold temperatures persisted until late March.
SS-4
SUMMARY
Habitat conditions in the White Pine County portion of Northeast Nevada improved in 2009 in response to above-average precipitation. This was a welcome change following severe drought from mid-2006 through 2008. The National Weather Service recorded 115% of average precipitation at Ely during 2009. For the period April through July, 124% of average moisture was received. This resulted in improved vegetative cover and nutritional value of the forage, as well as, better overall water distribution for big game animals. The recent winter brought more than twice the average snowfall to the Ely area. Over 90 inches have been recorded since last October. Consistently cold temperatures resulted in an extended period of snow-cover for much of the unit-group. As of mid-April the water-year precipitation total is approximately 120% in the Ely area. The snow-pack is in excellent condition for this stage of the spring. Prospects for further habitat improvements are also excellent. With 7 of the past 10 years bringing drought, longer term improvements in climatic conditions are needed to reverse the habitat degradation that has occurred. Northwestern Nevada Most water basins in north-western Nevada show snowfall and precipitation totals that are below average as of April 1, 2010. As an example, Cedarville, California reported this past February to be the driest on record. Drought conditions have been a recurrent theme over the last four years in most of the counties in north-western Nevada while portions of Northern Humboldt County have received below average precipitation during seven of the past ten years. The only reprieve from the dry conditions this past year occurred when 3 to 4 inches of rainfall fell between the 1st and 22nd of June 2009. Dry conditions returned for the remainder of the summer and very little moisture was received into the fall. Although, the near-record rainfall in June helped in the short-term to alleviate some of the effects of the drought, much more moisture is needed to reverse the cumulative impacts from consecutive years of below average precipitation. Southern Nevada (MOJAVE DESERT) The National Weather Service (NWS) reported below normal precipitation totals throughout the Mojave Desert region in 2009. The annual moisture deficit was due to the absence of storm systems in January and March and an inactive monsoon season (June—September). Moreover, the annual precipitation total (1.59”) from the NWS official weather recording station at McCarran International airport indicates 2009 was the eighth driest year on record. In addition, NWS reported 2009 tied for the second warmest year on record. The warmth in 2009 was primarily attributed to higher low temperatures (higher average low temperature). In April 2010, environmental conditions in the Mojave Desert region in southern Nevada are greatly improved relative to 2009. Based on rain gauge data collected by Clark County Regional Flood Control District in cooperation with United States Geological Survey and National Weather Service, Las Vegas and outlying areas in Clark County experienced several fall and winter storm systems over nearly a four-month period from December 2009 through early March 2010. Thus far in 2010 (January—March), NWS in Las Vegas reported precipitation receipts at 173% of normal. In its seasonal drought outlook, NWS has not identified the likely development of drought conditions during the period April 1, 2010 through June 2010. In April 2010, vegetative conditions are improved. However, increased precipitation receipts during the preceding fall and winter months have promoted widespread establishment of exotic invasive annuals. The resultant high accumulation of fine fuels coupled with dry lightning strikes associated with the early summer monsoon season, should increase the potential for wildland fire occurrence and severity. Southeastern Nevada According to WRCC/DRI, in 2009 Lincoln and southern White Pine Counties received approximately 78% of the previous 10-year average annual precipitation. BLM rain can data obtained from 26 areas throughout Lincoln County indicates that the total was approximately106% of the previous 10-year average. The year-to-date totals show Lincoln County to be at approximately 154% of average so far in 2010. The summer of 2009 was somewhat below average with monsoonal moisture coming in localized areas, with higher elevation summer ranges generally receiving higher amounts of rainfall. After a relatively dry fall,
SS-5
SUMMARY
December was about average with regard to precipitation. Lincoln County received above average precipitation during January and February while March was close to average. Lincoln County can have very diverse weather conditions due to the change in latitude and elevation from north to south. The northern end of Lincoln County contains the higher elevation mountain ranges and tends to receive higher amounts of winter precipitation. The southern end of Lincoln County is lower elevation Mojave Desert terrain that typically receives more of the monsoonal moisture. According to WRCC/DRI, Ely received approximately 51% of average annual precipitation in 2009. The northern portion of Area 22 is generally subject to similar weather as Ely. The Egan and Schell Creek Ranges received lower-than-average precipitation. Area 23 received average moisture, which resulted in moderate range conditions during the fall months. September, October, and November were all drier than average, but still received some precipitation. Big game animals should have entered winter in good condition. The late winter and spring of 2010 has been cooler and wetter than recent years with heavy snow still found on most north and east facing slopes. Range conditions appear moderate to good across Lincoln County at this time. Although 2009 was drier than average through the northern portion of the area, the southern portion of the area was average to slightly above average. Much of southeastern Nevada is subject to monsoonal storms during the summer months. The timing of precipitation coming during the summer months plays an important role in benefitting many forage species. In general, the invasive annual grasses are cured out during this time which helps native or other beneficial plants to compete with exotic annual grasses. This tends to help areas of burned pinyon-juniper recover and produce quality forage for wildlife and livestock. Central Nevada Data published by the United States Department of Agriculture (USDA), Natural Resources Conservation Service (NRCS) indicate that central Nevada has experienced average to above average moisture receipts since June of 2009. Favorable moisture and temperature patterns through the summer and fall of 2009 greatly benefited habitat conditions and improved the body condition of animals that had suffered in 2006, 2007, and parts of 2008, through some of the worst conditions seen in central Nevada for some time. Moisture during this time of the year is critical for providing a boost to the nutrient content of forage, which allows mule deer and other wildlife to enter the winter in good condition. While November saw very little precipitation, moisture receipts returned to near average from December through March potentially setting the stage for a continuation of increased productivity of central Nevada game populations. Although winter conditions resulted in somewhat higher over-winter mortality in some populations than has been the case in the previous few winters, the increased productivity of surviving animals as well as improved habitat conditions should far outweigh these relatively minor losses. Although game populations in central Nevada are currently reaping the benefits of improved climatic conditions, the cumulative impacts of drought experienced regularly over the past few years will take some time to be overcome. These favorable conditions will need to continue into the foreseeable future in order to see any significant increases in central Nevada game populations.
SS-6
SUMMARY
SS-7
Table 1. Water basin climate data from SNOTEL monitoring stations throughout Nevada and the Sierra Nevada Mountains for snow water equivalent of snowpack as of 22 April 2010 and total water year precipitation from 1 October 2009 – 22 April 2010 in inches (Natural Resources Conservation Service). BASIN Snow Water Equivalent Total Precipitation
Data Site Name Unit(s) Current Average % of Avg Current Average % of Avg
NORTHERN GREAT BASIN 79 83
Disaster Peak 031 0 4.7 0 14.6 15.9 92
Sheldon 033 0 0 100 5.9 6 98
TRUCKEE RIVER 106 91
Mt Rose Ski Area 194 35.6 43.4 82 46.7 45.7 102
Big Meadow 194 23 19.7 117 28.2 29 97
CARSON RIVER 192 110 97
WALKER RIVER 201 102 105
JARBIDGE/SNAKE RIVER 65 80
Pole Creek R.S. 072 14.7 21.4 69 11.2 13.3 84
BRUNEAU RIVER 73 86
Big Bend 061/071 3.6 4.4 82 10.9 12.1 90
Bear Creek 071/072 12.6 21.3 59 19.7 25.3 78
Seventysix Creek 071/072 4.4 6.4 69 12.3 15.6 79
OWYHEE RIVER 72 83
Fawn Creek 062 11.2 17.5 64 20.1 25.6 79
Jack Creek Upper 062 13.2 20.1 66 17.5 21.6 81
Laurel Draw 062 5.1 3.8 134 16.2 20.2 80
Taylor Canyon 068/062 0.5 0.9 56 8.8 8.9 99
LOWER HUMBOLDT RIVER 68 81
Big Creek Summit 171 19.2 19.7 97 16.9 19 89
Buckskin Lower 051 13.9 26 53 20.6 25.8 80
Granite Peak 051 4.5 5.5 82 15.3 19.5 78
Lamance Creek 051 1.4 5.9 24 16.3 21.3 77
UPPER HUMBOLDT RIVER 88 92
Draw Creek 072 6.5 6.1 107 13.5 14.2 95
Dorsey Basin 101/102 12.1 12.6 96 20.7 22.7 91
Green Mountain 102 10.8 10.8 100 19.7 22.7 87
Lamoille #3 102 6.9 10.5 66 20.4 22.5 91
CLOVER VALLEY
Hole-in-Mountain 101 12.3 18.2 68 23.8 24.9 96
EASTERN NEVADA 135 120
Berry Creek 111 18.4 16.1 114 21 17.2 122
Diamond Peak 141 3.1 2.3 135 15.9 16.1 99
Ward Mountain 221 15.1 8.7 174 19.9 14.2 140
BIG GAME HERD
STATUS REPORTS
MULE DEER
1
MULE DEER Units 011 – 015: Northern Washoe and Western Humboldt Counties Report by: Chris Hampson Harvest Following 2 consecutive years of a 16-day split season scenario in 2007 and 2008, a nearly month long season structure was reinstated in most hunt units within Washoe County in 2009. The rifle, muzzleloader and archery hunting seasons in hunt Unit 015 were moved to the month of December back in 2007. The area is critical winter range for the interstate mule deer herd migrating from Lassen County, California. The season was moved to the later timeframe in order to provide hunters with the highest deer densities and the best possible chance of being successful. The hunter success rate for resident rifle hunters within Unit Group 011 – 013 was 54% in 2009. Fifty-six percent of the hunters reported harvesting bucks with 4 points or better. Both of these figures are near long-term averages. Harvest objectives or the number of deer expected to be harvested from each unit or unit group was met or exceeded in all hunt units in Management Area 1. An example of this is in unit group 011-013 where NDOW expected 107 bucks to be killed and hunters from all weapons classes ended up harvesting 117 mule deer bucks. Survey Data Post-season surveys were conducted during the second week of November 2009. Surveys were delayed due to bad weather. A total of 162 bucks, 429 does, and 277 fawns was observed within Management Area 1. The sample provided an average composition ratio of 38 bucks:100 does:65 fawns. In addition, California biologists classified another 253 mule deer in California hunt unit X5B and the western portion of unit 015. California biologists survey the interstate deer units in the fall because many of the deer have not yet migrated into Nevada and are usually on the California side of the state line in November. Fawn ratios observed during the fall surveys were very good and ranged between 73 and 76 fawns per 100 does. This is excellent recruitment for mule deer herds in the northwestern portion of the state. The higher recruitment observed this year is thought to be due to the better conditions following an exceptional month of precipitation in June. Between 2 and 3 inches of rainfall occurred during this timeframe. The much need rainfall allowed for a short-term improvement in habitat conditions from June through mid August. Infrequent rainfall through the remainder of the summer and into the fall caused habitat conditions to once again deteriorate. Most water sources and large lakebeds were completely dry or had very low water levels by the end of September. Forage quality had also deteriorated following 3 months of little to no precipitation. Composition data from this past fall showed increased buck ratios in most hunt units in Washoe County. However, some of the buck ratios are thought to be skewed high due to sample bias. In hunt unit 014, the survey was cut short due to high winds and snow flurries. The bad weather canceled the survey and prevented biologists from surveying the southern half of the unit. The survey sample size was reduced for this reason. Spring composition surveys were delayed significantly by a series of continuous cold fronts moving through western Nevada in late February and March. Despite the almost constant delays, surveys were finally completed one day at a time and over a 3 week period. Actual survey hours were reduced due to the inclement weather. All units in Management Area 1 were at least partially surveyed. A total of 1,213 mule deer was classified with a composition ratio of 51 fawns per 100 Adults. The large increase in the number of animals classified this spring was due primarily to deer being heavily concentrated on winter ranges in Units 014 and 015. The fawn to adult ratio shows an increase of 11 fawns per 100 adults over what was observed in 2008-09. Hunt units within Management Area 1 had fawn:adult ratios ranging between 48 and 52 fawns per 100 adults. This represents very good fawn recruitment for mule deer in the western portion of the state.
MULE DEER
2
Habitat Drought conditions continued to be felt throughout western Nevada during much of 2009. The exception was during early summer when most areas within Washoe County received over 2 plus inches of rainfall during the month of June. Habitat conditions following this exceptional weather event improved in the short-term. The timing of the moisture was important as it provided both does and fawns with improved forage and water through most of the summer. Fawn survival through this period was high and recruitment levels in 2009-10 are very strong. However, hot dry conditions returned and only 0.5 inch of rainfall was received during July, August and September. Habitat conditions had once again deteriorated by the end of September. Although, mule deer herds in Washoe County experienced increased fawn recruitment this past year, many of the large lakes and important water sources are currently dry or have very low water levels. The low water levels are the result and cumulative effects from several consecutive years of below average precipitation. The winter of 2009-10 has once again been below average for both precipitation and snowfall and the predicted spring runoff is expected to be below normal. Unless we receive significant moisture later this spring and into the summer, habitat conditions within the western portion of the state could once again be in very poor condition this coming summer and fall. Population Status and Trend The mule deer predator control project in Unit 014 started in mid December 2004 when 24 mule deer were fitted with ear-tag transmitters to allow for better follow-up. Wildlife Services started removing lions and coyotes from the project area soon afterwards. The project has now finished its fifth year and the data collected will be analyzed over the next several months. Mule deer recruitment rates have thus far been somewhat variable from year to year. Survey sample sizes have generally shown increases over the past few years. However, one must be careful when looking at just the number of animals classified during surveys as it can change dramatically depending on survey and snow conditions. Recruitment rates for mule deer within Management Area 1 increased by an average of over 10 fawns per 100 Adults in 2009-10. This will result in increasing trends for most deer herds in the northwestern portion of the state. Quota recommendations will generally mimic these trends. Units 021, 022: Southern Washoe County Report by: Chris Hampson Harvest The season structure for hunting in Unit 021 mimics that of hunt Unit 015. The 2 hunt units both represent critical winter range for interstate deer herds out of California. The season was changed back in 2007 in order to afford hunters the best possible chance of being successful in harvesting a deer. The mule deer herd in unit 022 is made up of mostly resident mule deer and the hunting season is currently under the nearly month long season format that begins in early October. In 2009, resident rifle hunters in Unit 021 had a hunter success rate of 59%. Unit 022 hunters had a success rate of 47%. Both of the units saw improvements in the 2010 hunter success rates compared with recent years. NDOW projected that 45 deer would be harvested by all weapons types from Management Area 2 in 2009. Sportsmen were more successful this year than expected and harvested 13 additional bucks during the various archery, muzzleloader, and rifle seasons. Survey Data Fall surveys conducted by California Fish and Game biologists classified a total of 893 mule deer with an average computed ratio of 27 bucks:100 does:58 fawns. Surveys were conducted in both California Hunt Zones X6B and X7A in November 2009. No fall surveys were flown in Unit 022 in Nevada.
MULE DEER
3
Spring mule deer surveys were flown by the Nevada Department of Wildlife biologists and covered portions of Unit 021 in Nevada. The survey classified a total of 289 mule deer and had a composition ratio of 43 fawns per 100 adults. The 43 fawns per 100 adult’s recruitment rate is considered very good recruitment for this interstate mule deer herd. The NDOW spring survey in Unit 022 classified a total of 231 mule deer. The computed ratio for the sample was 41 fawns per 100 adults. The recruitment rate observed this year is 4 fawns per 100 adults above what was observed during the 2009 spring survey. Although, the winter of 2009-10 was near average on the California side of the line, there was sufficient snowfall in the upper elevations in California to force more mule deer to winter on the Nevada side of the line in hunt Unit 021. Habitat According to the Nevada Water Supply Outlook Report, as of April 1, 2010, most basins in northwestern Nevada are below average for both water year precipitation and snowfall. Storm fronts that provided western Nevada with additional moisture in early April will help to increase these precipitation totals. However several consecutive drought years have left most lakes and water sources with low water levels or flows. The predicted spring runoff is expected to be below average in most portions of western Nevada. Much more precipitation is needed in order to reverse the cumulative effects of several consecutive dry years. The Petersen Mountains have had a long fire history. For the second year in a row, wildfires have impacted important mule deer habitat in the Petersen Mountains in Unit 021. The recent fires burned over 10,000 acres of critical deer winter range. Important sagebrush and scattered bitterbrush communities were lost in the fires. A cooperative effort between the BLM Carson City District, Nevada Department of Wildlife, California Fish and Game, The Mule Deer Foundation, and the Woodland Village Homeowners Association provided the funding and much of the labor to re-seed over 70% of the burned area. The restoration project was completed in February 2010. Additional work will be completed this spring as well as over the next few years. Population Status and Trend The mountain lion control project in the Virginia Mountains of Unit 022 continues. To date, a total of 6 lions have been removed from the north end of the range. The project was initiated in an effort to reduce lion predation on a low density California bighorn population. Mule deer herds within Management Area 2 are expected to experience static to slight increasing trends in 2010. Quota recommendations for the Management Area 2 deer herds for the 2010 hunting seasons will be similar to those from 2009. Housing development, proposed energy development, and a recently proposed tree farming operation are just some of the issue that will continue to impact mule deer habitat within Management Area 2 over the next decade. Mule deer habitat and areas to hunt mule deer will continue to shrink as these types of projects are implemented. Mule deer numbers will continue to shrink in the long-term as more and more habitat is lost or disturbed. Units 031, 032, 034, 035: Western Humboldt County Reported by: Ed Partee Survey Data Aerial surveys were conducted during both fall and spring in Management Area 3 this past year. During mid November 2009, a post-season helicopter flight was conducted. A total of 545 deer was classified which was slightly below the 2008 survey of 602 deer. Dry conditions appeared to have spread deer out which increased search time. Overall, ratios obtained from these surveys were 30 bucks:100 does:67 fawns. The past 5-year average for these units was 38 bucks:100 does:59 fawns. Buck ratios were down slightly from the past 5-year average but remain near objective levels. Fawn ratios are up slightly from the 5-year average.
MULE DEER
4
A spring helicopter survey was conducted during mid March 2010. A total of 811 deer was classified; yielding a ratio of 42 fawns:100 adults. Fawn recruitment was up slightly when compared to the past 5-year average. Habitat Management Area 3 continues to show the effects of lasting drought conditions. In June of 2009 substantial moisture was received which improved range conditions over the short term. However, by late fall, habitat conditions had declined with a lack of water availability and poor forage conditions. Fortunately no additional habitat loss occurred from wild land fires during the summer of 2009. Several habitat projects continue in Management Area 3. Several sagebrush plantings occurred during the spring of 2009 through spring 2010 in an attempt to reestablish areas of sage brush that have been lost in past fires. Other projects include green-striping methods that are designed to protect those areas that have not been affected by wild land fires. Population Status and Trend Population estimates for Management Area 3 has remained relatively stable over the last 3 years. These populations are still substantially lower than historic highs primarily due to a long term decline in range conditions. The primary limiting factor for these populations remains adequate winter range. Many of the traditional winter use areas have been converted to annual grass due to fires. Drought conditions will continue to hamper the recovery of burned areas. Unit 033: Sheldon National Wildlife Refuge; Washoe and Humboldt Counties Report by: Chris Hampson Harvest Harvest figures indicate another tough year for hunters that drew the early season rifle tag on the Sheldon. Hunter success rates during this early season remained very low when compared with long-term averages. Extremely dry and warm conditions due the extended drought have made early season hunting very difficult. Lower deer numbers over the past few years have also played a role in the decreased hunter success rates. Tag quotas over the past few years have decreased accordingly. Late season tagholders had much higher success rates the past 2 years than their early season counterparts. In 2008, the hunter success rate for the late season resident rifle hunters was 50%. This year the success rate for the late season increased to 63% with a 56% 4 point or better in the harvest. The 2009 late season success rate was near the long-term average for the Sheldon. However, early season hunters continue to struggle. Overall, hunters on the Sheldon harvested 50 bucks during the 2009 season, just 1 short of the NDOW harvest objective of 51. The statewide average hunter success rate remained static at 40%. Mule deer numbers on the Sheldon have declined since the winter of 2006-07. Drought conditions are now into their fourth consecutive year. Resident rifle quotas on the Sheldon have been reduced approximately 49% since the 2006 hunting season and have mimicked this decline. The Sheldon mule deer herd has struggled in recent years due to the very dry conditions. Most large lakes and other water sources have been completely dry or suffered reduced flows due to the long-term drought. Forage plants important to mule deer continue to show signs of stress due to the lack of moisture. Survey Data Post-season composition surveys on the Sheldon focused efforts on Badger Mountain, Catnip Mountain, and Fish Creek Mountain. There were 291 mule deer observed with a ratio of 36 bucks:100 does:72 fawns. Mule
MULE DEER
5
deer were once again associated with the mountain mahogany tree cover at the upper elevations of the Sheldon. Spring surveys located mule deer on extreme winter range in Virgin Valley and Sagebrush Creek. The Little High Rock area and the north end of the Calicos in hunt Unit 012 were also surveyed. Recent collaring work on mule deer from Badger Mountain on the Sheldon has identified these areas as important winter range. A total of 154 mule deer was located during spring surveys and the sample provided a composition ratio of 43 fawns per 100 adults. This is 8 fawns per 100 adults higher than what was observed in 2008-09. Habitat Most water basins in western Nevada show snowfall and precipitation totals that are below average as of April 1, 2010. Drought conditions have been a recurrent theme on the Sheldon as most lakes and important water sources are dry or have low water levels. Vegetative quality and condition has deteriorated due to the extended drought. The only reprieve from the dry conditions this past year was in the month of June when nearly 3.9 inches of rainfall fell between the 1st and 22nd of June. Due to the lack of soil moisture and dry conditions, the much needed moisture was quickly absorbed by the dry soil. Dry conditions returned for the remainder of the summer and very little moisture was received into the fall. Although, the near-record rainfall in June helped in the short-term to alleviate some of the effects of the drought, much more moisture is needed in order to reverse the cumulative impacts from several consecutive years of below average precipitation. The low water levels in most lakes and reservoirs are an indication of just how dry it has been over the past several years. The carrying capacity of the Sheldon mule deer herd was significantly reduced due to several large fires that occurred over the past 25 years. Critical mule deer summer range was lost on Badger Mountain, Catnip Mountain, Devaney Mountain and Alkali Peak. These fires burned approximately 50 to 60% of the important mule deer summer range on the Sheldon. Important mountain mahogany, sagebrush and bitterbrush cover was lost in the fires. The burned areas have not fully recovered and do not currently provide mule deer with the quality forage and escape/thermal cover that was once available. This significant reduction in quality mule deer habitat will limit the Sheldon mule deer herd well into the future. Population Status and Trend Several consecutive years of drought have impacted forage quality and water distribution for mule deer on the Sheldon. Mule deer numbers on the Sheldon have declined during the past 4 very dry years. Although, recruitment on the Sheldon showed an improvement this past year, habitat conditions have deteriorated over the past several years and current snow accumulations will not be sufficient to refill lakes and improve water flows to springs and seeps. Forage quality has been poor in recent years. Unless, the Sheldon receives significantly more moisture this coming spring and summer, habitat conditions are expected to remain fair to poor this year. The population model for the Sheldon mule deer herd shows a stable trend. Quota recommendations are expected to be similar to the previous year. Units 041, 042: Western Pershing and Southern Humboldt Counties Report by: Kyle Neill Survey Data No post-season surveys were conducted in 2009. A brief (one hour) helicopter survey was conducted on 5 March 2010 in Unit 042 in the Eugene and Majuba Mountains and in the north end of the Trinity Range. Ground surveys were conducted for 2 days in March 2010 in the Selenite and Seven Troughs Ranges of Unit 041. Combined survey observations resulted in 51 deer being classified that resulted in a fawn:adult ratio of 38:100.
MULE DEER
6
Habitat Little quality mule deer habitat currently remains in this unit group. Mule deer habitat in western Pershing County has declined considerably following wildfires from 2000-2001 and 2008, which converted good mule deer habitat into annual grasslands. Continued grazing and the current drought cycle have not allowed for the recovery of mule deer habitat in this area. Population Status and Trend The 2009 mule deer population estimate for Units 041, 042 remains at 750 animals. This herd’s population trend has been declining by an average of 2% every year since 1999 when the population was estimated at 1,000 animals. Biologists believe that wildfires coupled with drought cycles have led to poor forage quantity and quality for mule deer. These conditions have ultimately influenced fawn recruitment, which has a long-term average of 35 fawns:100 adults and has averaged 33 fawns:100 adults over the last 5 years. The 2010 fawn ratio of 38 fawns:100 adults is slightly better than maintenance level recruitment. However, this herd’s population trend will continue to remain stable to slightly declining under current habitat conditions. Units 043 - 046: Eastern Pershing and Southern Humboldt Counties Report by: Kyle Neill Harvest Results For the 2009 season, Units 043-046 reverted back to a single season for the Any Legal Weapon Hunt 1331. Split season harvest strategy for Hunt 1331 was instilled for the 2007 and 2008 seasons. Survey Data There were no post-season surveys conducted in these units during the fall of 2009. In early March 2010, aerial surveys were conducted in Unit 043 (east side of the Humboldt Range from Limerick Canyon north to I-80). Subsequent aerial surveys occurred on 14 March 2010 in Units 044-046 (4 hours 20 minutes helicopter time). Spring survey efforts yielded a sample of 586 mule deer with a recruitment ratio of 43 fawns:100 adults. Spring fawn ratios continue to remain greater than the long-term average of 40 fawns:100 adults. Habitat In October 2009, BLM-Winnemucca conducted a horse gather in Units 045 and 046 encompassing Pumpernickel, Goldbanks and South Buffalo Allotments. Gather efforts resulted in 376 horses being rounded-up. The 2009 gather will help alleviate competition and over use of Summit Spring located in the Smesler Pass area. Poor winter range conditions continue to persist throughout the whole unit group. Lower elevations have been largely converted into annual grasslands following the wildfires of 2000, 2001 and 2007. Forage recovery in the lower elevations also continues to remain low due to drought cycles and continued grazing from domestic livestock at normal stocking rates. Additionally, the winter range in Unit 043 is thought to be the most degraded by over utilization of domestic sheep, that heavily graze all of the lower elevations in the fall months on the east side of the Humboldt Range. However, quality summer range enables mule deer to enter the winter months in good to excellent body condition. Population Status and Trend The 2010 mule deer population estimate for eastern Pershing County is 3,200 animals and is equivalent to the all time high estimate that was calculated in 2002. This herd has maintained a 6% average rate of increase since 2004. This steady rate of population increase can be attributed to recruitment rates that have averaged 46 fawns:100 does for the last 5-years. Other indicators of herd growth can be correlated to percent 4-point or better bucks harvested for all hunts. The 2009 value was 47% and has averaged 47%
MULE DEER
7
for the past 3-years. The long-term figure for percent 4-point or better bucks harvested is 42%. Also, spring survey sample size has averaged 575 animals over the last 5-years, which is considerably greater than the long-term average of 415 animals surveyed during the spring. There are concerns that this herd is at or above carrying capacity, given that the herd is at an all time estimated population high. Poor winter range conditions in combination with a hard winter may cause significant losses to this herd in the near future. Unit 051: Santa Rosa Mountains; Eastern Humboldt County Report by: Ed Partee Survey Data Post-season helicopter flights were conducted in mid November. A total of 213 deer was classified this year which is up from the 2008 survey of 161. Ratios obtained from these surveys were 32 bucks:100 does:73 fawns. The buck ratio is down slightly from the 5-year average of 39 bucks:100 does: 67 fawns. Spring helicopter flights were conducted during mid March. A total of 649 deer was surveyed which approximates last year’s survey totals. The spring fawn ratio for this survey was 48 fawns:100 adults. This recruitment rate is near the past 5-year average of 46 fawns:100 adults. Snow conditions were lacking in most of the areas surveyed. Habitat There was no additional loss of mule deer habitat in this unit over the past year. A significant amount of critical winter range has been lost to wildfire in Unit 051 over the last decade. Rehabilitation efforts have met with minimal success due to drought conditions. Winter moisture has been below average this year resulting in a very dry spring with a lack of green-up. Spring and summer moisture will be needed to improve habitat conditions. Population Status and Trend The population estimate for Unit 051 has dropped from what we saw last year. Buck ratios have fallen slightly and winter mortality has had a little increase. The past years may have had a slight inflation of the estimates which are being brought down to show more of what is occurring. The last few years snow conditions for this unit have been minimal. With the lack of green-up that was experienced this spring, summer moisture will be needed to sustain these populations. This unit may experience minor increases and decreases, however, increases may not be much over current levels. With the drought conditions that have taken place over the last few years’, production this year may be a little lower then what was observed last year. Forage conditions are stressed due to the lack of moisture. Units 061 - 062, 064, 066 – 068: Independence and Tuscarora Ranges; Elko County Report by: Ken Gray Survey Data A spring helicopter survey was conducted in March 2010. A total of 4,405 deer was classified; yielding a fawn:adult ratio of 42 fawns:100 adults. This was 12 fawns:100 adults above the past 10-year-average and was the highest spring fawn ratio observed in 10 years in Area 6. Habitat Significant storms in late May and early June of 2009 resulted in excellent habitat conditions on deer fawning and summer ranges which persisted throughout the summer and fall months. Deer came into the winter in excellent condition. The winter of 2009-10 was mild with little snow accumulations at the mid and lower elevations. The abundant spring rain combined with timely fall precipitation also produced
MULE DEER
8
good forage conditions on the intermediate and winter ranges with abundant liter growth on the shrub species and winter green-up on the grass species. Between the years of 1999 and 2007, over 1,370,864 acres of rangeland have burned in Area 6, much of which was important deer habitat. Fortunately, less than 1,500 acres have burned in 2008 and 2009. The Marsh Creek Bench, which burned in the summer of 2006, is showing remarkable recovery and should be productive for wintering and migrating deer within 5 to 10 years. Other burned transition ranges, especially in the North Tuscarora Range, are also showing positive recovery. The Department of Wildlife seeded approximately 800 acres within the Dunphy Hills with a seed mix of desirable winter forage species in 2009. The areas seeded were part of a massive cheatgrass die-off that has occurred throughout the low elevation winter ranges. In addition the Department aerially seeded the 1,100 acre North Boulder Valley Seeding project in hopes of increasing the success of this 2008 project. Also, about 1,300 acres of land in the Argenta Rim area was aerially seeded with sagebrush and forage kochia. This important winter range for both the Area 6 and Area 15 deer herds burned in 2007 but supported enough bare ground to warrant seeding. Finally, an effort led by the Elko BLM and Nevada Muley’s resulted in the planting of approximately 3,000 sagebrush seedlings and 600 forage kochia seedlings on the south end of the Izzenhood Range. Approximately 30 volunteers participated in this project. No additional predator management activities, above existing normal levels, occurred in this management area this past year. Population Status and Trend The Area 6 Deer Herd population estimate increased by approximately 800 deer over last year’s estimate. Good fawn recruitment facilitated by excellent forage conditions combined with the mild winter were responsible for most of this increase. It is believed that the Area 6 Deer Herd is within the carrying capacity of their winter range which is estimated to support between 6,000 and 7,500 deer. Continued aggressive habitat restoration efforts are needed to increase the winter habitat carrying capacity for deer in this management area. However, if fire suppression priorities and techniques are not addressed, and fires continue to burn out of control in this area, this deer herd will continue to spiral downward to the point that there will be little hope of ever restoring it. The Area 6 Deer Herd is capable of increasing rapidly due to the excellent summer habitat and high fawn producing capabilities associated with this area. This was the case this past year when the population increased by 12%. However, the poor winter range will dictate long-term population levels as it has done for most of the past decade. The recommended buck quota will be up from last year’s quota due to the increase in population. Very few antlerless tags will be recommended since the deer population is within the carrying capacity of the winter range. Unit 065: Pinyon Range; Southwestern Elko County Report by: Russell Woolstenhulme Survey Data A Post-season survey was conducted for the first time in many years in this Unit. A total of 159 deer was classified yielding age and sex ratios of 23 bucks:100 does:58 fawns.
MULE DEER
9
Habitat Long-term habitat conditions for deer are poor in Unit 065 due to the tremendous amount of habitat that has been lost to fires since 1999. A reseeding project of the 3000 acre Bailey fire took place in the fall/ winter of 2007. Habitat rehabilitation in burned areas that once served as important deer habitat would help increase carrying capacity and facilitate overall mule deer production and survival. Population Status and Trend Poor habitat conditions have resulted in population levels that are below historic levels. The trend of this deer population is believed to be stagnant. The area is managed as a “Quality” hunt area and is capable of producing good bucks. The quota in this unit has been based on similar numbers of tags as in previous years. Units 071 – 079, 091: Northeastern Elko County Report by: Kari Huebner Harvest Results A split in the Any Legal Weapon hunt was again held in the 071 Unit Group for the 2009 hunting season. The biggest change that occurred was in the late season with hunter success rising to 63% compared with 51% in 2008 and the 4-point or better bucks rose to 61% compared to 43% in 2008. The late archery season saw just the opposite occur in 2009 with hunter success dropping to 9% compared to 28% in 2008. Survey Data Post-season helicopter surveys resulted in the classification of 1,563 deer; yielding sex and age ratios of 18 bucks:100 does:50 fawns. Spring surveys were flown in late March and early April. A total of 1,643 mule deer was classified during the survey; yielding a ratio of 36 fawns:100 adults. Habitat Deer habitat in this unit group has been reduced following the tremendous wildfires that have occurred in the area since 1999. Invasive weeds such as cheatgrass and mustard have invaded some of these areas and replaced much of the native vegetation that previously existed. However, even in areas where weed invasion has not occurred and perennial grasses and forbs are found, it will take years for the shrubs, mainly sagebrush and bitterbrush, to recover and expand back into these burned areas. A good majority of the Area 7 deer herd winters south of Interstate 80 in the Pequop Mountains. Unfortunately as many of these deer attempt to make it to their winter range from Jarbidge and outlying areas, they are often struck by vehicles either on Highway 93 or Interstate 80. Fifteen deer were collared in the fall of 2008 and we are learning a great deal about their migration and the movement corridors they are using to get to winter range. This information is helping both the Nevada Department of Wildlife and the Nevada Department of Transportation work collaboratively on current and future projects to reduce the amount of vehicle mortality that is occurring. By next fall 2 overpasses and 3 underpasses should be in place to facilitate deer movement across Highway 93 and significantly reduce vehicle-deer collisions. Population Status and Trend Although over winter survival was good for fawns this winter, fawn ratios going into the winter were below average. This year’s recruitment rate of 36 fawns:100 adults was slightly below the previous 5-year average of 38 fawns:100 adults. It was the first time the spring fawn ratio increased in the last 4 years. The population model for Unit Group 071-079,091 predicts a pre-hunt adult mule deer population slightly lower than the previous year.
MULE DEER
10
Unit 081: Goose Creek Area; Northeastern Elko County Report by: Kari Huebner Survey Data Post-season helicopter surveys resulted in the classification of 292 mule deer in Unit 081; yielding sex and age ratios of 27 bucks:100 does:37 fawns. Spring surveys were not conducted. Habitat This deer herd’s winter range and some summer range were significantly impacted by the West Fork Fire in 2007. The fire burned 154,943 acres of primary winter range. The fire burned very hot and left few islands of habitat. Although the area was intensely seeded the first winter following the fire, it will be several years until the brush community recovers in this area. Population Status and Trend Overall this is a relatively small deer resource in terms of resident deer populations with some migration from both Idaho and Utah. The magnitude of this migration is dependent on weather conditions during the hunting season and timing of the hunt. This year in attempt to take advantage of these later migrations the muzzleloader and any legal weapon hunts have been scheduled later than previous years. The intended result was to harvest more of the migratory herd and lessen the harvest on the small resident deer populations in the area. It appears the hunter success remained consistent with previous years however the percentage of 4-points was considerably higher with the later any legal weapon season. This herd has been managed as a trophy area in the past and with current challenges such as the reduction of winter range, the tags will be expected to remain conservative. Units 101 - 108: Southern Elko and Northwestern White Pine Counties Report by: Caleb McAdoo Harvest Results The long-term average hunter success for the early any legal weapon season is approximately 25%. For 2009, the hunter success for this season was 26% percent. The late season hunter success typically varies with weather conditions, as both snow fall amount and timing play a key role in late season hunter success, which is typically over 50 percent. However, the 2009 late season hunter success was only 42 percent. The hunter success for the resident any legal weapon antlerless hunt was 50% yielding a harvest of 476 antlerless mule deer. For specific 2009 hunting season results, please refer to Harvest Tables in the Appendix Section.
Survey Data An aerial post-season herd composition survey was conducted in January 2010 and 7,739 deer were classified. The age and sex ratios derived from this survey were 24 bucks:100 does:44 fawns. The observed young:adult ratio derived from this survey was 35 fawns:100 adults. A spring helicopter survey was also conducted in March of 2010. During this survey, 9,407 deer were classified yielding a ratio of 31 fawns:100 adults. This is up 11 fawns:100 adults from last year’s spring survey and down 4 fawns:100 adults from the January 2010 survey. Habitat Area 10 was spared from catastrophic wildfires in the summer of 2009; however, some small acreage fires did occur. Spring and summer precipitation created favorable summer range conditions. Snow pack levels and moisture content for the winter of 2009-10 continue to remain below the long-term average for the Ruby Mountains and adjacent mountain ranges. The winter of 2009-10 was a relatively mild winter resulting in increased fawn survival.
MULE DEER
11
The Department of Wildlife along with land management agencies, are maintaining past chaining projects and are developing future projects which will increase the habitat potential for mule deer. Population Status and Trend The Area 10 population continues to account for approximately 20 percent of the statewide mule deer population and is up 6 percent from last year’s population estimate. The increase is likely a result of good spring and summer precipitation and a relatively mild winter resulting in increased fawn recruitment. Until last year, population estimates in Area 10 had increased for 7 of the last 8 years. Good age class representation is observed throughout the buck segment of the population and hunters should continue to see many mature bucks. Barring extreme weather conditions or catastrophic wildfires, we should continue to be optimistic about future trends of the Area 10 deer herd. Units 111 – 113: Eastern White Pine County Report by: Curt Baughman Survey Data An aerial post-season herd composition survey was conducted in December 2009 and January 2010. A total of 1,543 deer was classified yielding sex and age ratios of 26 bucks:100 does:41 fawns. The spring 2010 survey was flown in March in combination with the elk survey. The total sample of 2,653 deer yielded a ratio of 25 fawns:100 adults. This was an improvement from the 19 fawns:100 adults observed during the spring 2009 survey which tied 1993 and 1994 for the second lowest recruitment on record and was 17 points below the previous 10-year average (1999-2008) recruitment of 36 fawns:100 adults. The lowest recruitment on record was the ratio of 15 fawns:100 adults documented during the spring survey in 1975. Habitat Precipitation levels improved in 2009 following 2-1/2 years of severe drought. Precipitation totals recorded in Ely by the National Weather Service were 115% of average for the calendar year. More importantly, 124% of average moisture was recorded for the April through July period. Moisture totals for those same periods were 47% in 2007 and 28% in 2008. The increased 2009 moisture brought improvements in forage, cover and water distribution that allowed mule deer to make gains in body condition. Deer entered the winter in improved condition which would prove to be useful. The recent winter brought above average precipitation and more than twice the average snowfall to the Ely area. Over 90 inches have been recorded since last October. Cold temperatures persisted through the winter with no significant periods of moderation. Snow covered most areas from mid December through mid March. Conditions were slightly more moderate in the northern parts of the unit-group. As of mid-April 2010, water-year moisture totals stand at close to 120%. The current snowpack has seen little melting and should provide an extended run-off and further improvements in habitat values for mule deer in 2010. Long-term habitat potential for mule deer is slowly declining due to the encroachment of pinyon and juniper trees upward into mountain brush zones and downward onto bench areas. In some areas, degradation from severe drought has resulted in loss of native vegetation and expansion of cheatgrass and noxious weeds. Large-scale projects designed to control the encroachment of trees without imposing long-term impacts to shrub communities will be needed to reverse this trend. Population Status and Trend This deer population expanded between 2004 and 2007 due to improved habitat conditions and favorable fawn recruitment. A severe drought extended from mid-2006 through 2008. This resulted in sharply reduced fawn recruitment and a significant population decrease. The improved habitat conditions of 2009 came too late to have a large influence on 2009 productivity. However, without the habitat improvements of 2009, the past winter could have been very negative for mule deer. The 2010 spring fawn ratio indicates a stable to slightly increasing population trend. With improving habitat conditions in the short
MULE DEER
12
term, fawn production in 2010 should improve over that of 2009. Quota recommendations for 2010 seasons should be somewhat higher than the very low quotas of 2009. Units 114 – 115: Snake Range; Southeastern White Pine County Report by: Curt Baughman Harvest Results The total approved 2009 buck quota (including youth) was 292 tags following 491 tags in 2008 and 511 tags in 2007. The 2009 reported harvest was 70 bucks and 26 antlerless deer which follows 144 bucks and 50 antlerless deer in 2008. The 2007 reported buck harvest was 217. Both quotas and hunter success rates have been decreasing in recent years. In 2009, hunter success was 21% for the early rifle hunt and 11% for the late hunt. This follows early rifle season success rates of 32%, 44% and 49% for 2008-07-06 respectively. Late-season resident muzzleloader hunters enjoyed 45% success in 2009 and took as many bucks as resident any-legal-weapon hunters did. Averaged hunter success for all buck-only hunts was 22% in 2009, 30% in 2008, 42% in 2007 and 41% in 2006. As this deer herd has become smaller in recent years it appears that the presence of Great Basin National Park may be having a greater influence on hunter success rates. Hunting is not permitted in the Park, which covers about 120 square miles of Unit 115. Survey Data An aerial post-season herd composition survey was flown in late December 2009/January 2010. The sample of 320 deer yielded sex and age ratios of 47 bucks:100 does:35 fawns. Ratios of 32 bucks:100 does:29 fawns were observed during the 2008 postseason survey. The spring 2010 aerial survey took place in March. A sample of 584 deer was classified with a ratio of 32 fawns:100 does. This was a little better than the 17 fawns:100 does observed in the spring 2009. The 2009 ratio was the third lowest fawn recruitment on record and follows 22 fawns:100 does (the fourth lowest) in 2008. The 2010 fawn:100 adult ratio of 21 was 7 points below the previous 10-year average (2000-2009) recruitment of 28 fawns:100 adults. Habitat Habitat conditions improved in 2009 in response to above-average precipitation. This was a welcome change following severe drought from mid-2006 through 2008. The National Weather Service recorded 115% of average precipitation at Ely during 2009. For the period April through July, 124% of average moisture was received. This resulted in improved nutrition, cover and water distribution for mule deer. The recent winter brought more than twice the average snowfall to the Ely area. Consistently cold temperatures resulted in an extended period of snow-cover for much of the unit-group. As of mid-April the water-year precipitation total is approximately 120% in the Ely area. The snow-pack is in excellent condition for this stage of the spring. Prospects for further habitat improvements are also excellent. With 7 of the past 10 years bringing drought, longer term improvements in climatic conditions are needed to reverse the habitat degradation that has occurred. Long-term habitat potential for mule deer is slowly declining due to the encroachment of pinyon and juniper trees upward into mountain brush zones and downward onto bench areas. In some areas, recurrent drought has resulted in loss of native vegetation and expansion of cheatgrass and noxious weeds. Large-scale projects designed to control the encroachment of trees without imposing long-term impacts to shrub communities will be needed to reverse this trend. In addition, Southern Nevada Water Authority has purchased several ranches on the west side of Unit 115 and now holds grazing permits on allotments containing important mule deer habitat. It is hoped that improved grazing practices can provide benefits to mule deer. Population Status and Trend Since 1999 this unit-group has experienced below average fawn recruitment in all but 3 years. The population trend was downward from 2001 to 2005 followed by some recovery between 2005 and 2007 and
MULE DEER
13
another decline since that time. The improved habitat conditions of 2009 arrived too late to provide much of a boost to fawn production, but did allow deer to improve body condition and make it through the recent winter without suffering substantial losses. The fawn recruitment observed this spring indicates that the herd has stabilized. This year’s population model predicts a population estimate very similar to the 2009 estimate. Although the buck:100 doe ratio remains high, quota recommendations for 2010 will be similar to 2009 levels so that falling hunter success rates can stabilize. Further short-term improvements in habitat conditions should result in increased productivity of this mule deer herd in 2010. Unit 121: North Egan, Cherry Creek Ranges; White Pine and Elko Counties Report by: Russell Woolstenhulme Survey Data No post-season mule deer composition survey was conducted this year in Unit 121. Spring mule deer composition surveys were conducted from the helicopter during March 2010. The Cherry Creek Range and North Egan Range were surveyed primarily along the East Benches. A total of 1600 deer was classified in Unit 121, yielding a ratio of 27 fawns:100 adults. This is the second highest spring count in the unit. The Unit 121 herd estimate is similar to last year. Habitat Spring precipitation during 2009 was very good creating great summer range conditions across much of Unit 121. The winter of 2009-2010 continued with good precipitation which should be beneficial to the deer range. Habitat improvement projects and small fires in the unit are providing some improved habitat conditions for deer by reducing pinion-juniper cover and increasing potential for increased forbs and shrubs in some areas. Population Status and Trend The spring fawn ratio of 27 fawns:100 adults resulted in a population estimate very similar to last year. If moisture regimes continue to be normal or above normal, improved range conditions could cause a favorable response in the deer herd. Unit 121 has so far avoided major impacts to deer habitat from range fires and man-made disturbances. Pinion/juniper encroachment is of some concern but small fires and habitat projects are slowing the effects. Mule deer carrying capacity is being improved by these small improvements. Barring any unforeseen setbacks, deer populations could return to an upward trend that has been documented over the last few years. Units 131 - 134: Southern White Pine, Eastern Nye and Western Lincoln Counties Report by: Mike Podborny Survey Data There was no post-season herd composition survey conducted. The previous post-season survey was conducted by helicopter in January 2007 with 460 deer classified; yielding ratios of 31 bucks:100 does:60 fawns. The spring survey was conducted by helicopter in March 2010. There were 1,215 deer classified; yielding a ratio of 36 fawns:100 adults. This compares to the spring 2009 survey of 339 deer classified from the ground with a ratio of 30 fawns:100 adults. This was the first spring aerial survey conducted since 2005 when 353 deer were classified and was the highest spring sample since 1989. The abundant snow that covered all mountain ranges forced deer to low elevations along the migration trail making them easily accessible during the survey. Habitat Habitat conditions improved in 2009 with abundant spring and summer rains resulting in increased forage production and water availability for wildlife following the drought of 2007 and 2008. The long-term quality and quantity of summer ranges are slowly being reduced by Pinion/Juniper forests taking over
MULE DEER
14
brush zones thereby lowering the carrying capacity for mule deer. Although this deteriorating condition also affects winter range, it is believed the effect on summer range has a greater impact to the deer herd. No major fires have occurred since 1999 but smaller fires in upper elevations in the last few years may benefit deer habitat over the long term. Population Status and Trend The abundant snow in the mountains concentrated deer on low elevation spring ranges and made them easily available for classification. The spring sample was the highest in 21 years and the deer appeared healthy. The data also documented that the further south the deer migrated, the lower the fawn survival. This corresponds to the winter storms dropping heavy wet snow on the southern winter ranges which often receive very little snow. The reported harvest was above the expected harvest and hunter success was high with the number of 4-point or better bucks in the harvest also high. The moderate spring recruitment in 2010 increased for the second consecutive year and resulted in a population increase. A post-season composition survey is needed to measure the buck ratio which by all indications should be high but has not been verified for 3 years. Units 141 - 145: Eureka and Eastern White Pine Counties Report by: Mike Podborny Survey Data A post-season herd composition survey was conducted in November 2009 with a clear sky and no wind. The bucks were with the does because the rut was ongoing but warm open conditions with no snow increased the difficulty of finding deer in some areas. There were 866 deer classified yielding ratios of 35 bucks:100 does:58 fawns. The last post-season helicopter survey in December 2007 was conducted with very good conditions including cold temperatures and good snow cover and resulted in the classification of 1,900 deer; yielding age and sex ratios of 31 bucks:100 does:41 fawns. A spring survey was conducted in March 2010 by helicopter with 1,133 deer classified; yielding a ratio of 32 fawns:100 adults. In 2009 and 2008 the spring surveys resulted in fawn to adult ratios of only 21:100 and 19:100 respectfully. Habitat Habitat conditions improved in the short term with good leader growth on browse and overall good forage production and increased water availability following near record precipitation in June 2009. This was preceded by consecutive years of drought in 2007 and 2008. Over the long term deer habitat is being reduced by pinion/juniper forests crowding out the highly productive mountain brush zones with the browse community maturing and becoming less productive. There were no major wildfires in 2009. Major wildfires occurred in 1999, 2001 and 2007 in Units 141 and 142. These fires burned and converted extensive brush zones into monocultures of cheatgrass and other annual weeds reducing the value of these areas for deer and other wildlife. The cumulative effect of these fires has been a reduced capacity of the range to support deer. Post-fire seeding efforts to restore the most critical portions of these fires have been partially successful. A very large molybdenum mine is being proposed for Mt. Hope in Unit 143. The mine will impact deer habitat in the immediate area of the mine site but is not expected to cause a major decrease of the deer herd in Unit 143. Population Status and Trend The post-season sample was the lowest since 1980 and the last 2 years’ spring samples are 2 of the lowest back to back helicopter samples ever. Previous survey sample sizes were generally consistent in Management Area 14 from year to year with only slight differences related to survey timing conditions. The 2010 spring survey conditions were excellent with abundant snow in the mountains concentrating deer at lower elevations. These conditions resulted in high to record high spring samples in several other central Nevada deer populations but not in Area 14. The drought of 2007 and 2008 resulted in record low spring production for 2 years and may have negatively affected adult survival as well. The base population was therefore adjusted downward using lower survival rates in the computer model. Although the base
MULE DEER
15
population estimate was lowered for Area 14, the post-season herd composition survey documented a buck ratio of 35 bucks:100 does. The 2-year drought was broken with above-average precipitation in the late spring and early summer of 2009. The 2010 spring recruitment increased to a moderate level and should at least help to stabilize the Area 14 deer herd this year. Units 151, 152, 154, 155: Lander and Western Eureka Counties Report by: Jeremy Lutz Harvest Results The following analysis is for the 2009 Resident Any Legal Weapon Hunt which was changed to a split season with an early and late hunt in 2007. The number of first choice applicants for the early and late hunts was 382 and 139, respectively. The total number of first choice applicants was 521 in 2009 and 529 in 2008 compared to 488 in 2006 without a split season. The odds of drawing a tag in the early hunt were 4 to 1 compared to 11 to 1 for the late hunt with a limited tag quota. For specific 2009 hunting season results, please refer to Harvest Tables in the Appendix Section. Survey Data Post-season aerial composition flights were conducted in November and December of 2009 and included the Battle Mountains, Fish Creeks, Shoshones, Simpson Parks and north Toiyabes. There were 1,177 deer classified during the survey; yielding ratios of 30 bucks:100 does:60 fawns and is the second highest sample since 1982. The previous post-season survey was conducted in November 2008 with 772 deer classified; yielding ratios of 31 bucks:100 does:76 fawns. Spring surveys were conducted from the ground during March 2010. Areas surveyed were the Shoshones, Toiyabes and the Simpson Parks. The Battle Mountains and Fish Creeks were not surveyed due to time constraints. A samples of 807 deer was classified; yielding a ratio of 41 fawns:100 adults. The previous year’s survey was conducted from the ground in March of 2008. A sample of 544 deer was obtained; yielding a ratio of 32 fawns:100 adults. Habitat Habitat conditions for deer in Area 15 continue to improve over the long term. The Battle Mountain BLM is currently working on the last 2 remaining allotment evaluations, the Battle Mountain and Argenta allotments. Proper grazing management plans in these allotments should help alleviate grazing resource conflicts. These are scheduled to be completed by late 2010. The north Toiyabes and Simpson Parks have shown good habitat recovery on springs, riparian’s and forage availability with the removal of 1700 horses in 2008. Survey data and habitat conditions indicate that deer have started to utilize areas that were overrun by feral horses in previous surveys. Two habitat projects were completed in 2009 in Lander and Eureka counties in the Shoshone Mountains. The 2007 Sansinena fire burned approximately 29,000 acres of summer and winter habitat for mule deer on the Argenta Rim. This area now contains a robust perennial grass and annual weed community with little to no shrub component. In January and February of 2010 about 1400 acres was aerial seeded with sagebrush and forage kochia and over 600 sagebrush seedlings were planted in high wildlife use areas. The success of these projects will depend on adequate spring and summer moisture. Population Status and Trend The Area 15 adult deer population experienced a mild winter in the northern units with green up starting in early February. Record samples were obtained on winter ranges in Unit 152 with the availability of grasses and forbs on lower elevations. Above average fawn ratios consisting of 40 fawns: 100 adults should allow for population growth in 152. The southern Units 154 and 155, experienced a much harder winter with deep snow conditions that persisted until late March. Green up had not occurred during March and
MULE DEER
16
deer were much harder to find. Deer came into the winter in great shape. Above average precipitation in early summer proved instrumental for deer surviving through the winter. Overall fawn ratios of 35 fawns:100 adults for Unit 155 will allow this population to remain stable. The 2010 deer population estimate for Area 15 is approximately 6% higher than last year. Units 161 - 164: North-Central Nye and Southern Lander and Eureka Counties Report by: Tom Donham Harvest Results 2009 was the third consecutive year of the Any Legal Weapon early/late split mule deer hunt. In 2007, the season changed from a single 23-day season to a split 16-day early/late season for both Management Area 16 and 17. The split season is intended to allow those willing to deal with larger crowds and comparatively more difficult hunting conditions a greater chance of obtaining a deer tag on a regular basis, while at the same time offering a hunt later in the fall with significantly smaller crowds for those sportsmen willing to wait longer between deer tags. In 2009, the draw odds for the early season were 3 to 1. Early season success was 44% with a harvest of 40% 4-points or better. In comparison, 2008 saw 46% success with a harvest of 34% 4-points of better. The draw odds for the late season were 12 to 1. Hunter success in the 2009 late hunt was 69% with a harvest of 67% 4-points or better. In 2008, late season hunter success was 78% with a harvest of 89% 4-points or better. The comparatively easy access to higher elevations in much of Area 16 allows for higher hunter success in Area 16 compared to Area 17 where the late season success is much more dependent winter weather conditions to make deer more accessible. Survey Data Post-season compositions surveys were conducted during late November and early December 2009 in Units 161, 162, and 163. Unit 164 was not included in the survey due to limited time and the low density of animals occurring in the unit. A total sample of 786 deer was classified resulting in observed ratios of 34 bucks:100 does:57 fawns. Following 2 years of lowered production in central Nevada deer herds, the impressive production rates in 2009 were very welcome. The observed buck ratio was slightly above expected levels. A spring composition survey was conducted in late March 2010. The spring sample of 1,215 deer classified during the spring survey period represents the second highest sample obtained since 1992. The observed ratio of 35 fawns:100 adults indicates that although over winter fawn loss over was approximately 17%, recruitment was still noticeably above the previous 10-year average. The previous spring survey took place during late March 2009 when a total of 409 deer was classified as 318 adults and 91 fawns. Population Status and Trend Due to regularly occurring drought periods during the past several years, reduced recruitment rates have caused the MA 16 mule deer herd to remain fairly static overall. Extremely poor climatic conditions which occurred from the fall of 2006 through the late fall of 2007 resulted in an even more drastic reduction in recruitment which caused a decrease in deer numbers throughout central Nevada during that time period. Fortunately, the past year has seen a return of favorable climatic conditions to central Nevada resulting in boosted production and recruitment rates and an increase in deer populations over the short-term. Currently, conditions in central Nevada are encouraging, and all types of wildlife are benefitting from improved habitat conditions. Impacts caused by previous drought cycles will take some time to reverse, and conditions will need to remain favorable for the foreseeable future if central Nevada deer herds are to increase significantly. The Area 16 pre-hunt population estimate is approximately 4,000 adult animals, which reflects a 9% increase over 2009.
MULE DEER
17
Units 171 - 173: Northwestern Nye and Southern Lander Counties Report by: Tom Donham Harvest Results 2009 was the third consecutive year of the Any Legal Weapon early/late split mule deer hunt. In 2007, the season changed from a single 23-day season to a split 16-day early/late season for Management Area 16 and 17. The split season is intended to allow those willing to deal with larger crowds and comparatively more difficult hunting conditions a greater chance of obtaining a deer tag on a regular basis, while at the same time offering a hunt later in the fall with significantly smaller crowds for those sportsmen willing to wait longer between obtaining deer tags. In 2009, the draw odds for the early hunt were 3 to 1. Early season success was similar to that in 2008 with 31% success and a harvest of 33% 4-points or better. Draw odds for the late season were 5 to 1. The late season saw a success rate of 46% with a harvest of 67% 4-points or better, which was also very similar to success rates and harvest of 4-points or better in 2008. Unlike Area 16 with more road access, the comparative success of the Area 17 late hunt depends more on cooler temperatures and/or sufficient precipitation to make deer more accessible for harvest. Survey Data Post-season aerial composition surveys were not conducted in Management Area 17 (MA 17) during the reporting period. A spring aerial composition survey was conducted in late March 2010. A total sample of 668 deer was classified as 478 adults and 190 fawns. Similarly to MA 16, due to improved climatic conditions, recruitment levels increased noticeably over those experienced over the past few years. The last post-season survey accomplished in Area 17 took place in late 2007. During the survey, a sample of 1,810 mule deer was classified as 343 bucks, 1145 does, and 322 fawns. The sample size was the largest that has been obtained during a post-season survey since 1986. The previous spring composition survey was conducted in late March of 2008, when a very modest sample of 509 mule deer was classified as 426 adults and 83 fawns. Population Status and Trend Extremely dry conditions experienced throughout central Nevada from the fall of 2006 through the late fall of 2007 greatly impacted mule deer populations and their habitats. Record low production and recruitment rates caused a noticeable decline in deer numbers throughout the central portion of the state. The comparatively low number of yearling bucks entering the population in 2008, and to a lesser degree, in 2009, resulted in reduced quotas. Fortunately, this past year has seen a return of favorable climatic conditions to central Nevada resulting in boosted production and recruitment rates and an increase in deer populations over the short-term. Currently, conditions in central Nevada are encouraging, and all types of wildlife are benefitting from improved habitat conditions. Impacts caused by previous drought cycles will take some time to reverse, and conditions will need to remain favorable for the foreseeable future if central Nevada deer herds are to increase significantly. The MA 17 pre-hunt population estimate is approximately 5,000 adult animals, which reflects an 11% increase over 2009 levels.
MULE DEER
18
Units 181 - 184: Churchill, Southern Pershing and Western Lander Counties Report by: Jason Salisbury Survey Data A ground survey occurred in the spring of 2010 resulting in the classification of 169 mule deer. The sample consisted of 120 adults and 49 fawns, resulting in a ratio of 41 fawns: 100 adults. Areas surveyed within the Area 18 herd include the Clan Alpine, Stillwater, and Desatoya Mountain Ranges and Lahontan Valley. Habitat The Area 18 mule deer herd has had to cope with vast areas of dense pinyon-juniper with little to no understory to support browsing mule deer. Habitat conditions are improving because of the recent accumulated moisture, resulting in a perennial grass green-up. A continued pattern of moisture needs to occur to sustain current range conditions. The maturation of the browse community joined with the pinyon juniper canopy closing around it will cause the browse community to be less productive in the future for mule deer. A project has been identified on the western slope of the Desatoya Mountains. This particular project is 2,700 acres and will target pinyon and juniper removal within the Big Den, Little Den area. This treatment will involve hand treatment as well as a masticator machine designed to grind up trees. This opening up of the canopy should allow for improved flow around spring sources as well as increasing the overall browse component. Past fires that have occurred in pinyon and juniper woodland within the Clan Alpine and Stillwater Mountain Ranges has shown to benefit mule deer. Within 10 years preceding the fire, mule deer as well as brush species are reoccupying the area. Brush species are providing needed requirements for the sustainability of the mule deer herd. Population Status and Trend The Area 18 herd experienced a mild winter in 2009-2010. Increased vigor of bunch grasses followed precipitation received in late winter. Spring and summer moisture is important to allow for improved leader production as well as the promotion of forbs and grasses, making up the vegetative component for mule deer in Area 18. The mule deer population within Area 18 has remained stable due to general maintenance level recruitment. This year’s adult to fawn ratio should allow for a slight increase in population growth. The buck segment of the population is well represented in all age classes and hunters should have the opportunity to find mature bucks within this population. Unit 192: Carson River Interstate Herd; Douglas County Report by: Carl Lackey Survey Data A post-season survey flight took place in January 2009. Survey results were fair and very similar to last year with 142 deer classified and ratios of 17 bucks:100 does:56 fawns. The spring survey was flown during March resulting with 165 deer classified and a ratio of 50 fawns:100 adults. Winter fawn loss was modeled at 9%. Low buck ratios along the Carson front seem to be the norm during surveys. The reasons for this may include: the toe-slopes and alluvial fans which would account for most of the winter range are now occupied by housing developments; which in turn means the deer that would normally be observed during a survey are either amongst the homes feeding on ornamentals or they are at higher elevations and among the trees. Regardless, point-class distribution in the harvest record indicates a higher percentage of bucks in the population than what is observed during surveys. The majority of deer surveyed in Unit 192 are found in the northern part of the unit. Habitat There were no significant changes to the habitat in 2009 occupied by this deer herd. The majority of this
MULE DEER
19
herd uses the eastern slopes of the Carson Range as critical winter range, migrating over from California summer range, but there is a portion of the herd that remains in Nevada year-round as resident deer. Urbanization along the Carson Front continues to encroach upon winter range traditionally used by the Carson River deer herd and is the single most important issue facing deer herds in the Carson Range. This loss is recognized not only as a direct loss of available habitat but also as stress-free space – free from human recreational activities, and loss of thermal cover. What habitat that does remain above the home-line is in fairly good condition. Population Status and Trend The modeled pre-hunt population estimate is between 850-950 animals. Overall this deer herd is in decline and has been for at least 2 decades, mostly due to the expanding urban interface. Regardless, survey and harvest data indicate this deer herd has probably maintained itself over the last year. Fawn production and recruitment rates have been at or above maintenance levels, yet the population has remained stable to declining, indicating it is probably at carrying capacity for the habitat. Changes to the season structure for the 2008 season did not affect the overall harvest in this unit over the last 2 years. Unit 194, 196: Carson Range and Peavine Mountain Interstate Herd; Washoe and Carson City Counties Report by: Carl Lackey Survey Data Biologists completed a late post-season composition survey flight in early January 2009 and classified 251 deer with a ratio of 18 bucks:100 does:45 fawns. A spring survey flight was accomplished in March 2009 classifying 598 deer with a ratio of 34 fawns:100 adults. These results give a modeled winter fawn loss of 7%. Survey timing and conditions were the probable reasons for the decrease in the buck ratio as there were no other contributing factors to account for the difference from last year’s results, which vary year to year. Noteworthy is the fact that harvest records contain a point-class distribution indicative of a buck segment in the population higher than that observed during surveys. As in past surveys the majority of deer in Unit 194 were found at tree-line and from Highway 431 north to Verdi. The deer in Unit 196 usually concentrate on the south facing slopes of Peavine Mountain. Habitat Housing development and the accompanying human recreation associated with it are the most important issues facing the Carson Front deer herds. Although there were no noteworthy fires or other catastrophic habitat changes in 2009, there have been recent fires in Units 194/196 which have had significant impacts on the landscape. The damage to mule deer winter range caused by these fires is exacerbated by the expanding urban interface. Population Estimates and Trend Based on fawn production and winter survival this deer herd, known as the Loyalton-Truckee/Verdi Interstate herd, is probably operating at carry capacity and has been doing so for the past 2 decades. The population limit placed on this deer herd by human encroachment/development is decreased every year because of the decline in available winter range. The 2010 modeled pre-hunt population estimate of 1200-1400 animals includes Nevada’s resident deer within the herd, a proportion estimated at 20-30%. Over the last few years this deer herd has appeared healthy with adequate fawn recruitment rates and generally good age cohort distribution. Despite this, the long-term trend in numbers however continues downward, mostly due to habitat loss and fragmentation, and is mirroring carry capacity. This unit remains a much desired area to hunt deer for locals and non-residents, with high success rates and good point-class distribution. Changes to the season structure (split seasons) for this unit has not had a significant effect on the overall harvest since the inception of a split season in 2008.
MULE DEER
20
Unit 195: Virginia Range Herd; Storey, Washoe and Lyon Counties Report by: Carl Lackey Survey Data Formal post-season and spring surveys have not been completed for Unit 195 since 2002. Habitat The majority of land in this unit is privately owned and therefore difficult to manage for wildlife. Additionally, a significant portion is being developed, commercially and residentially. The resulting fragmentation and loss of habitat, along with increased traffic on U.S 395 has decreased this once migratory herd to a resident herd. Population Estimates and Trend The population estimate for this deer herd is derived only from harvest statistics. Deer are fairly common along the Truckee River corridor on mostly private lands. Hunter success indicates an adequate number of deer for the tags sold. The population estimate for the unit is between 500-700 animals and is thought to be stable at this time. A crude population estimator based on total buck harvest and derived from a Colorado Department of Wildlife model was used to generate this estimate. Units 201, 202, 204 – 206: Walker/Mono Interstate Deer Herd; Douglas, Lyon and Mineral Counties Report by: Jason Salisbury Survey Data The Nevada Department of Wildlife conducted fall surveys in early January and resulted in the classification of 975 mule deer. The sample consisted of 158 bucks, 572 does, and 245 fawns for a ratio of 28 bucks: 100does: 43 fawns. The Nevada Department of Wildlife uses directed search patterns to locate groups of deer. Spring ground surveys were conducted by California fish and Game personnel in late March 2010. The compositions of these animals were classified as 684 adults and 107 fawns for a computed fawn ratio of 16 fawns: 100 adults. Spring green up was prevalent which aided in locating mule deer on toe slopes and benches. Habitat Heavy winter precipitation accumulated in the late winter months of 2010 and resulted in sustained snow depths. Snow lessened following increase daytime temperatures occurring in early March. The increase in late winter and spring precipitation has allowed for short term green-up which will permit mule deer the opportunity to replenish needed nutrition. The Area 20 herd is broken up into 2 distinct wintering groups made up of the East and West Walker herds. The East Walker wintering herd occupies the Pine Grove Hills and the West Walker herd occupies the Sierra Front and Wellington Hills. The East Walker herd lives primarily in a pinyon juniper dominated woodland winter range that receives limited moisture resulting in a degraded browse community. The West Walker area receives increased moisture receipts allowing for a better browse community. Consequently, the West Walker herd can experience extreme temperature periods and snow depths which results in added fawn mortality. On a year to year basis following mild winters the fawn ratios on the West Walker herd are 30% higher than the East Walker segment. Habitat projects needed to improve deer winter ranges include reducing the pinyon and juniper woodland densities allowing for a positive response to brush communities. Presently, migration corridors exist in the Wellington Hills area, Unit 201, and allow mule deer to migrate through to the winter ranges. However, migration corridors are starting to becoming negatively impacted by increased urbanization.
MULE DEER
21
Population Status and Trend The observed fawn count for the springtime represents a 53% over-winter loss which is hard to believe. Two varying survey techniques were used; one fall survey was conducted from the helicopter while the other was conducted from the ground. The fawn recruitment rate for 2010 is 16 fawns: 100 adults and results in a declining population trend. The 2010 fawn recruitment rate may have to be increased in the population model to average out the variances that occurred between fall and spring surveys. The timing of this hunt allows for a high level hunter success. The 5-year average for the Area 20 hunt is 60% which is 21% higher than the 2009 percent success rate for the rest of the units in the state. The pre-hunt adult deer population estimate for the Walker River interstate herd is approximately 5,200 animals. Nevada’s apportionment of the herd is approximately 30% based upon the percentage of the herd that occupies winter range in Nevada. Harvest objectives are then distributed between Unit groups 201 & 204 and Unit groups 202, 205 and 206. This is a 45% and 55% split, respectively. Deer in Unit 205 are actually yearlong residents but harvest levels are not significant enough to warrant a separate management approach. Unit 203: Mason and Smith Valley Resident Herds; Lyon County Report by: Jason Salisbury Survey No surveys were conducted in 2010. Population Status and Trend Mule deer habitat is limited within Mason and Smith Valley’s. Deer habitat in Unit 203 is threatened by the increasing trend of converting brush and other escape and food resources into onion and garlic fields. Without adequate thermal and escape cover the mule deer population cannot consistently increase in population trend with this constant manipulation of habitat. Furthermore, ongoing housing development and infrastructure within Mason and Smith Valleys will eventually impact this herd’s population. An important number of mule deer exist on the Mason Valley Wildlife Management Area which serves as a safe haven for mule deer population located within in the valley. Currently there is no model developed to track herd population dynamics. The mule deer herd that occupies Mason and Smith Valley has declined from what was observed in the 1990’s but has remained stable since 2001. The 1331 any legal weapon hunt can be an indicator of stability. The 2009 overall hunter success rate was 39% and 4-point or better bucks harvested were 35%. The percentage of 4-point or better buck harvested is 25% greater than last year’s estimate. Both hunter success and 4-point or greater percentages are slightly below their 10-year averages of 48% hunter success and 37% of 4-point or better bucks harvested for all hunts. Units 211, 212: Esmeralda County Report by: Tom Donham Survey Data Currently, no formal surveys are conducted in Management Area 21 (MA 21). Past survey efforts have not resulted in sufficient sample sizes for use in monitoring population dynamics. Population Status and Trend Based upon harvest data, random observations, and informal surveys, the MA 21 mule deer population has remained at relatively low levels for quite some time. Since the late 1990’s, very dry conditions experienced more years than not have impacted production and recruitment rates throughout much of Esmeralda County. In addition, conversion of sagebrush habitats to pinyon and juniper woodland as well
MULE DEER
22
as the loss of productivity of browse species due to aging has impacted the amount and quality of available habitat. Considering recent climatic conditions, as well as the increased production and recruitment rates shown in other herds in central Nevada in 2009, the MA 21 population is expected to have experienced similar increases in production and recruitment. The turn to more favorable climatic conditions has benefited degraded range conditions in Esmeralda County, and the mule deer population should benefit, at least in the short term. Presently, the population estimate is approximately 350 adult animals. Units 221 - 223: Northern Lincoln and Southern White Pine Counties Report by: Mike Scott Survey Data Post season aerial surveys were completed during December 2009, and resulted in the classification of 1,313 deer. The sample consisted of 236 bucks, 714 does, and 363 fawns which results in a ratio of 33 bucks:100 does:51 fawns. Yearling bucks comprised 31% of the bucks observed. The previous sample was obtained in December 2008 and consisted of 250 bucks, 608 does, and 274 fawns which results in a ratio of 41 bucks:100 does:45 fawns. Spring surveys were conducted in March 2010 and resulted in the classification of 1,632 deer consisting of 1,196 adults and 436 fawns which results in a ratio of 36.5 fawns per 100 adults. Habitat Area 22 continues to have multiple habitat issues including expansion of Pinyon/Juniper, senescent shrubs, water transfers, high numbers of feral horses, heavy off-road traffic, a large powerline along a major migration corridor and across winter range, new proposals for renewable energy in crucial winter range, and large acreages of wilderness where beneficial projects are precluded. Above average precipitation during the winter of 2009-2010 should result in good range conditions during the spring of 2010. Population Status and Trend The population is stable compared to last year with a 2010 computer-generated population estimate of 4,900 adult animals. Unit 231: Wilson Creek Range; Northeastern Lincoln County Report by: Mike Scott Survey Data Post-season aerial surveys were conducted during December 2009 and resulted in the classification of 1,353 deer. These consisted of 246 bucks, 747 does, and 360 fawns which provides a ratio of 33 bucks and 48 fawns per 100 does. Yearling bucks comprised 50% of the bucks observed, compared to 28% from the previous years’ survey. The previous survey was conducted during December 2008 and resulted in the classification of 1,626 deer. These consisted of 315 bucks, 821 does, and 490 fawns which results in a ratio of 38 bucks:100 does:60 fawns. Spring surveys were conducted during March 2010 and resulted in the classification of 1,310 deer consisting of 989 does and 321 fawns, which provides a ratio of 33 fawns per 100 adults. Habitat Mule deer habitat in Area 23 faces many real and potential threats. A large-scale wind energy facility is proposed for the high elevation summer ranges of Table Mountain and Mt. Wilson, water transfers, high numbers of feral horses, continued expansion of Pinyon/Juniper, shrub senescence, heavy off-road traffic, and development of private lands in crucial winter ranges all have potential to affect mule deer habitat.
MULE DEER
23
Heavy snows that stayed on the ground for several months during the winter likely took a toll on fawns in Area 23. Habitat conditions should be good during the spring of 2010 due to above-average precipitation during the winter of 2009-2010. Two water developments are scheduled to be built in Area 23 in 2010 that should benefit mule deer. Population Estimates and Trend The population is stable compared to last year with a 2010 computer-generated population estimate of 3,100 adult mule deer. Units 241 – 245: Clover, Delamar, and Meadow Valley Mountain Ranges; Lincoln County Report by: Mike Scott Survey Data Post-season aerial surveys were conducted in January 2010 and resulted in the classification of 310 deer consisting of 77 bucks, 157 does, and 76 fawns. These numbers provide a ratio of 49 bucks:100 does:48 fawns. Yearling bucks comprised 31% of the bucks classified. The previous sample was obtained in January 2009 and resulted in a total of 322 deer classified. Of these, 77 were classified as bucks, 155 classified as does, and 90 classified as fawns. Spring aerial surveys were conducted in March 2010 and resulted in a total of 390 deer observed. Of these 299 were classified as adult and 91 classified as fawns which provides a ratio of 30 fawns per 100 adults. Habitat Habitat conditions should be good during the spring of 2010 due to above-average precipitation during the winter of 2009-2010. Heavy snows that covered much of the area likely had a detrimental effect on fawns. Area 24 has somewhat limited mule deer habitat due to an abundance of dense Pinyon/Juniper forests, with little understory. Areas that burned in previous years appear to be recovering well and should provide reasonable forage for mule deer. High numbers of feral horses still roam the Clover and Delamar Mountains, despite BLM’s reduction in the AML to zero. Population Estimates and Trend The 2010 population estimate is 750 adult animals, compared to 800 in 2009. Units 251 - 253: South Central Nye County Report by: Tom Donham Survey Data Presently, neither post-season nor spring surveys are conducted in these units. The last surveys conducted in the area occurred in 1998 and failed to yield a sufficient sample for analysis. Population Status and Trend Management Area 25 (MA 25) has a limited amount of good quality mule deer habitat. The greatest amount and best quality habitat, and therefore the majority of the deer population, in MA 25 occurs in Unit 251. Due to regularly occurring drought periods, impacts from excessive numbers of feral horses, pinyon and juniper expansion, and aging of browse species, the mule deer population in Unit 251 has remained static at relatively low numbers for some time. Based upon the increased production and recruitment seen in other central Nevada herds due to the recent turn to more favorable climatic conditions, the deer population in MA 25 should have seen similar increases. Upcoming feral horse gathers are scheduled to take place in Unit 251, and should provide even
MULE DEER
24
more relief to wildlife species and their habitats. The MA 25 mule deer population currently is experiencing a slightly increasing trend. Presently, the population estimate for Units 251-253 is approximately 350 adult animals. Units 261 – 268: Clark and Southern Nye Counties Report by: Patrick Cummings Survey Data Mule deer habitat in Area 26 is marginal; consequently, deer densities are low and below levels that warrant annual or periodic aerial surveys. The lack of composition data precludes development of a useful model that would demonstrate herd population dynamics and generate population estimates. Habitat Area 26 is in proximity to Las Vegas and other growing cities. Recreational pursuits that include OHV and mountain bike use and the resultant proliferation of roads and trails coupled with suburban sprawl, serve to degrade mule deer habitat. In the Spring Mountains, mule deer habitat is also impacted by feral horses and burros. In June 2004, the Humbolt-Toiyabe National Forest issued a Decision Notice and Finding of No Significant Impact for Spring Mountains National Recreation Area Motorized Trails Designation Project. The decision to implement alternative 5 (with modifications) as summarized in the respective Environmental Assessment involves minimal closure of newly established roads. Thus, the recently authorized management prescription for motorized trails ensures the status quo for the foreseeable future. Population Status and Trend The mule deer population in Area 26 likely experienced a decline as result of drought conditions that have persisted from November 2005 through November 2009. During this period, mule deer coped with reduced availability of quality forage, and subsisted largely on cured and woody vegetation low in digestibility and nutritive value. Thus, the consequences of mule deer in Area 26 surviving on a lower nutritional plane were reduced reproduction and recruitment. As of this writing in April 2010, environmental conditions are greatly improved due to the several fall and winter storm systems that occurred over nearly a 4-month period from December 2009 through early March 2010. In its seasonal outlook, the National Weather Service has not identified the likely development of drought conditions during the period April 1, 2010 through June 2010. Units 271, 272: Southern Lincoln and Northeastern Clark Counties Report by: Mike Scott Survey Data No mule deer surveys were conducted in Units 271 or 272 during the reporting period. Mule deer densities are low enough that standard surveys do not result in enough data for analysis. The harvest strategy is based on hunter demand and success. Habitat Mule deer habitat is limited in Area 27. Better mule deer habitat is found in the Virgin Mountains; however, it is still a low density mule deer area. Both units are within Mojave Desert ecotypes with Pinyon/Juniper found at higher elevations. Water is very limited and mule deer are generally found in areas not far from water, at least during the warmer times of the year. Large-scale wildfires likely
MULE DEER
25
opened up some habitat in recent years, which appears to be recovering. Above-average precipitation during the winter of 2009-2010 should result in good habitat conditions in Area 27. Unit 291: Pinenut Mountain Herd: Douglas County Report by: Carl Lackey Survey Data No formal surveys were conducted in this unit. General observations and anecdotal reports indicate that this herd is stable over the short-term but has declined significantly over the long-term. Habitat Loss of habitat and access to available and adequate habitat in this unit continue to keep the deer population at low levels. Expansion of the pinyon forest over the past few decades, increased human recreational activity and increased urbanization on the perimeter with corresponding traffic have all contributed to loss of habitat and the decline of mule deer in Unit 291. Significant portions of the unit contain monocultures of pinyon-juniper, much of which is dead. Habitat improvement projects have been recommended to reduce the pinyon-juniper coverage, yet short of a catastrophic habitat regime change affecting thousands of acres, the deer herd will not increase significantly in numbers. Population Status and Trend There is no modeled population estimate for this herd. This population is believed to be stable, but has the potential to increase under more ideal habitat conditions. Many of the deer, particularly in the northern part of the management area, are resident deer. The 2010 population for Area 29, estimated at 500 adult animals, based on buck harvest, is well below the historic levels recorded for the Pinenut Mountains and may well be below carrying capacity. The loss of travel corridors, due to Highway 395 traffic and housing development from Topaz Ranch Estates up along the eastern side of Carson Valley, into the unit are the primary cause for this. Still, it is an area that offers a local hunting opportunity with a good buck point-class available and decent hunter success. This is evidenced by demand in the form of 363 first-choice applications for the 84 available tags combining all hunts.
PRONGHORN
PRONGHORN ANTELOPE Units 011 - 015, 021, 022: Washoe and Western Humboldt Counties Report by: Chris Hampson Survey Data A total of 902 pronghorn was classified during helicopter composition surveys in Management Areas 1 and 2. The composition ratios obtained from the September surveys averaged 31 bucks:100 does:46 fawns. In 2008, the average ratio for the 2 management areas was 36 bucks:100 does:44 fawns. The buck ratio objective of 28 bucks per 100 does was met in Unit Group 012-014 and Unit 015 in 2009. Buck ratios remain above management objectives in hunt Unit 011 and Unit Group 021, 022. Pronghorn fawn recruitment was observed to be much improved in 2009. The average fawn ratio for the hunt units in Northwestern Nevada increased from an average of 44 fawns per 100 does in 2008 to 57 fawns per 100 does this past year. Improved habitat conditions due mostly to the near record rainfall received during the month of June helped to increase fawn survival this past summer and fall. Most areas within Washoe County received over 2 inches of rainfall during the month. The area most affected by the drought conditions over the past few years has been Unit Group 012-014. Fawn ratios within this unit group averaged just 30 fawns per 100 does in 2007 and 2008. Due to the improved habitat conditions, the unit group averaged 54 fawns per 100 does in 2009. Table 1. 2009 Post-season pronghorn composition for Washoe County
Habitat Habitat conditions throughout much of Washoe County improved considerably following a near record setting rainfall in June of 2009. However, drier conditions returned and most areas within Washoe County had become very dry by late summer. This past winter has provided a few significant storms that dropped considerable moisture, however, as of March 1st 2010, the basins in the western portion of the state show total precipitation and snowfall totals that are well below average. In fact, the Northern Great Basin which covers much of Northwestern Nevada is the driest Basin in the state when comparing average snowfall and overall precipitation totals. One of the best examples of just how dry it has been over the past several years is the fact that most large lakebeds in northern Washoe County are completely dry. Large lakes and reservoirs such as Crooks Lake and Carter Reservoir in Unit 011 were almost completely dry this past summer. Swan Lake and the lakebeds on Rock Springs Table on the Sheldon were also once again dry by late summer. Pronghorn have had to adjust to the extended drought conditions by moving to areas with reliable water sources and the best available forage. Upper elevation habitats such as those in the Granite Range are in better condition but the lower elevation habitats even within the same mountain range remained dry.
26
PRONGHORN
Despite, the near record rainfall in June, western Nevada is in the midst of experiencing yet another below average water year. This translates into the fourth consecutive dry year for northern Nevada. As of March 1, 2010 the Northern Great Basin in Northwestern Nevada remains well below average for both snow pack and total precipitation values. The Nevada Water Supply Outlook Report shows precipitation totals for the basin at 74% of average while snowpack totals are just 68% of average. The stream flow forecast for the area predicts that flows will be just 60% of average. Cedarville, California has reported the driest month of February on record. The Bureau of Land Management removed over 1900 horses from the Calico Mountains Complex this past fall. The gather was critically important in order to relieve the intense competition between horses and wildlife for food, water and space. The competition between pronghorn and horses was significantly intensified during the severe drought years of 2007 and 2008. The gather and removal of the horses will help all wildlife living in the area. Hopefully, in the future the BLM will be able to keep horse numbers within Appropriate Management Levels so that competition between horses and wildlife are kept at a minimum. Population Status and Trend Pronghorn throughout northwestern Nevada responded favorably to the increased moisture and improved habitat conditions this past year. Recruitment values improved significantly in those areas that had been hardest hit by the extended drought. The only hunt unit to see a slight decrease in recruitment this past year was Unit 011. Affects of the extended drought were obvious in the unit as most lakes and water sources were completely dried up by late summer. Unit 011 had been the most drought resistant area over the past several years and normally receives more moisture than surrounding hunt units. More moisture is desperately needed to refill the large lakes and pit tanks that went dry during late summer 2009. Pronghorn populations in Units 011 and 015 continue to do well. Recruitment values have continued to be very strong in both of these herds. Total buck harvest during the 2009 hunting season exceeded objectives in both of these hunts units. Population estimates show increases of between 8 and 11% in 2010. Recruitment values for the 012 – 014 Unit Group increased significantly to 54 fawns per 100 does this past year. The lower elevations within this large unit group have suffered the most during the extended drought period. In 2007 and 2008, the average fawn ratio for this unit group was just 30 fawns per 100 does. The pronghorn population will show an 8% increase this year, however, due to the poor recruitment observed over the previous 2 years, yearling bucks will make up a higher proportion of the buck segment. The predicted harvest for this unit-group was 104 animals. A total of 103 bucks were harvested during the 2009 hunting season. Fawn recruitment within Unit Group 021, 022 also increased this past year. The average fawn ratio increased to 51 fawns per 100 does in 2009 from 33 fawns per 100 does the previous year. The increased recruitment values will result in an increase of 10% in the 2010 population estimate for this unit group. The harvest objective for this unit group was 18 bucks; hunters harvested a total of 20 bucks during the 2009 season. Housing development, energy development and an overall increase in human activity continue to be the bi-gest threats to this pronghorn population. Difficulties with accessing public hunting areas within portions of this unit group continue to be an issue. Winter survival is expected to be fairly high due to the fact that most winter ranges were devoid of snow for much of the winter. There were occasional snow events that dumped snow on pronghorn winter ranges, but most areas opened up soon afterwards. More snow and rain is needed this coming spring to help replenish water levels in lakes and to help increase flow’s at other water sources. Habitat conditions may once again deteriorate if the below-average precipitation continues through the
27
PRONGHORN
spring and early summer. Due to the improved recruitment, Washoe County pronghorn populations will experience increasing trends in 2010. Units 031, 032, 034, 035, 051: Humboldt County Report by: Ed Partee Survey Data Post-season aerial composition surveys were conducted in Management Areas 3 and 5 during the middle of September and the beginning of October 2009. The total number of antelope observed during these surveys was down again this year due to the late timing of the surveys. Pronghorn were not as concentrated as they have been during past surveys which have historically been conducted during early September. Antelope were in smaller groups and more dispersed. Table 1. 2009 Post-season pronghorn composition for Humboldt County
The total number of animals surveyed this year was below last year’s survey and much lower from 2 years prior. Despite the lower number of individuals surveyed fawn ratios increased and are near the past 5-year average. Buck ratios however, remain below the 5-year average in Units 032, 034, and-035. Both 031 and 051 have ratios which are consistent with the 5-year average. Due to the late timing of the flights pronghorn were more dispersed which made it difficult to find large groups. Habitat Drought conditions continue to impact forage quality within Management Areas 3 and 5. Over the last 2 years winter moisture has been well below-average throughout Humboldt County. Lack of moisture has left many of the pit tanks and water sources dry throughout the summer months. Spring green up has also been marginal over the last 2 years. Many of the grasses and forbs that pronghorn utilize have been impacted by the lack of winter moisture. Population Status and Trend Population estimates for both Management Areas 3 and 5 are showing increases. Unit 031 is experiencing good fawn ratios which have helped increase this population. The rest of area 3 is also showing an increase in its population. These units have also seen an increase in the fawn ratio with good survival. Winter concentrations are not as bad as what is being observed in Unit 031, however, with the increase that take place on a yearly basis we may start to see these affects taking place here as well. Area 5 is seeing some increases like that of area 3. However, these increases are not as major as those in area 3. Fawn ratios have had a major jump from the 5-year average which has helped this population increase. This unit is very large with plenty of habitat available for expansion. There is a strong possibility that some of this herd on the east side of this unit may be wintering in either Oregon or in area 6. Future collaring projects may be able to identify these movements. With the recent addition to “horns shorter than the ears hunt” for area 3, very little effect on the population segment has been observed. Several consecutive years may be needed for this hunt to have an impact on this population.
28
PRONGHORN
Unit 033: Sheldon National Wildlife Refuge; Washoe and Humboldt Counties Report by: Chris Hampson Survey Data Due to several consecutive years of drought, pronghorn distribution has changed dramatically in over the past few years. Most water sources including lakebeds, pit tanks and spring sources had dried up or suffered significantly reduced flows by late summer 2009. Pronghorn had to adjust to the loss of available water sources and were forced to move to areas where water and better forage were still available. This change in pronghorn distribution has also changed the areas where NDOW biologists have conducted their surveys. A good example of this is on Rock Springs Table, where in normal precipitation years, the lakebeds on top of the table are full or have water available to pronghorn. In recent years, these lakebeds have been dry and pronghorn have moved off of the table completely by late summer. This area has historically been flown during post-season surveys and several hundred pronghorn are normally classified from this location. NDOW has not flown this area in recent years due to the lakebeds being completely dry and the pronghorn no longer inhabiting the area during late summer. Post-season composition surveys were conducted on the Sheldon during the second week of September 2009. Areas surveyed were Catnip Mountain, Catnip Reservoir, Round Mountain and Horse Heaven. The survey classified a total of 358 pronghorn which had a computed ratio of 33 bucks:100 does:36 fawns. This is a slight increase in recruitment compared with the average fawn ratio of just 27 fawns per 100 does that was observed between 2006 and 2008. However, the recruitment observed this year is just slightly above maintenance levels. Buck ratios are thought to be skewed slightly lower this year due to the fact that surveys were conducted in the areas where hunting pressure is usually high. In years when normal precipitation fills lakebeds and other water sources, areas that are more remote and that receive less hunting pressure are also surveyed so that reliable buck ratios for the pronghorn population can be obtained. The 33 bucks per 100 does classified during this year’s surveys is still above harvest objectives. Habitat Habitat conditions improved following the near-record setting rainfall received in June 2009. Between June 1 and June 22nd the Sheldon received 3.9 inches of rainfall. However, the extreme dry conditions returned and from June 23rd thru September 30th the area only received another .5 inch of moisture. Unfortunately, the amount of moisture in June was not enough to reverse the impacts of several consecutive years of drought. Major lakebeds on the Sheldon remained dry throughout the late summer and fall of 2009. Pronghorn distribution during the summer months has changed considerably over the past few years as they adjusted to the lack of water and dry conditions. The winter of 2009-10 has thus far been below-average for water year precipitation and snowfall. The Snotel site from the Guano Rim area on the Sheldon shows just 4.4 inches of precipitation since October 1, 2009. This is just 74% of normal for this time of year. The snow water content is just 68% of average for this date. Last year at this time the same Snotel site had 5.1 inches of precipitation. During the ten-year period from 1999 to 2008, the Sheldon received below-average precipitation receipts during 7 of the 10 years. The 2009-10 water year is also below-average and the outlook for significant moisture this spring and summer is doubtful. The current below-average precipitation totals project another dry year on the Sheldon. Habitat conditions will more than likely remain fair to poor unless significant moisture is received this coming spring and summer. Runoff from melting snow is expected to be minimal and many water sources are expected to be dry again during the summer of 2010. In 2009, a total of 364 horses was gathered from the Sheldon refuge with 192 horses being sent to the adoption agent. The remaining animals were turned back on to the refuge after fertility treatments
29
PRONGHORN
were administered. Another 80 burros were also captured and given up for adoption. Similar captures are again planned for the refuge in September 2010. Population Status and Trend Although recruitment figures for this past year showed an increase of around 9 fawns per 100 does, the Sheldon pronghorn populations continues to struggle with persistent drought and poor habitat conditions. Forage quality and water availability are once again expected to be poor in 2010. The population estimate for this herd will remain stagnant due to these conditions. Units 041, 042: Western Pershing and Southern Humboldt Counties Report by: Kyle Neill Survey Data Ground composition surveys were conducted during mid-September in Units 041, 042 over a 4-day period . Table 1. Pronghorn composition survey results for Units 041 and 042.
The 2009 survey sample calculated into age and sex ratios of 48 bucks:100 does:46 fawns. Both the 2009 post-season buck and fawn ratios were considered high and are near their respective 5-year averages. Habitat This past summer, C-Punch Ranch irrigated its newly constructed agricultural fields in Granite Springs Valley. Fortunately, little to no antelope use was documented on these fields during this reporting period. However, this agricultural area is presumed to influence distribution of antelope in the future. Big game guzzlers that were constructed several years ago in the Trinity and Antelope Ranges are now being regularly utilized by pronghorn. Additionally, a new big game guzzler for antelope is scheduled to be constructed sometime in mid-June 2010. This new big game guzzler will be located in the north eastern portion of the Trinity Range. This guzzler is expected to further expand pronghorn use in the northern Trinity Range and animals that encompass the Poker Brown Wash area. Population Status and Trend Since 1990, this population has shown an increasing trend. Mild winters and high recruitment rates fueled high population growth in 2006 and 2007. The 2008 recruitment rate of 32 fawns:100 does resulted in a stable population. The 2009 fawn ratio of 46 fawns:100 does was at the past 5-year average and should provide for an increasing trend in this population. Field observations from this past winter indicated low overwinter fawn mortality. Once again, western Pershing County’s antelope herd will continue to grow. The 2010 population estimate is 1,600 animals and is a 6% increase from what was reported last year.
30
PRONGHORN
Units 061, 062, 064, 071, 073: North Central Elko County Report by: Ken Gray Survey Data A ground survey was conducted in the 061-073 Unit Group in September of 2009. A sample of 930 pronghorn was obtained; yielding sex and age ratios of 36 bucks:100 does:53 fawns. The sample size was the second largest ever obtained. The buck ratio was 5 fawns below the 10-year-average. The fawn ratio was slightly above the 10-year-average (Table 1). Table 1. Observed buck ratios, fawn ratios and sample size for pronghorn in Units 061-073.
Parameter 2009 2008 1999-2008 Average
Bucks:100 does from fall surveys 36 40 41
Fawns:100 does from fall surveys 56 36 53
Sample size from fall surveys 930 571 698
Habitat Significant storms with ample moisture in late May and early June of 2009 provided for excellent vegetative conditions for the summer and fall months. Antelope went into the winter in good condition. The winter of 2009-2010 was mild and snow did not accumulate on the winter ranges. The combination of antelope entering the winter in good condition and the open mild winter facilitated high winter survival. No major fires burned during the summer of 2009 in this unit group. Population Status and Trend The high sample size obtained during this year’s survey indicated the population was higher than estimated. It is believed that the doe harvest during the antlerless hunts for the past 11 years has been slightly overestimated while the number of fawns killed has been underestimated. A slight correction in the harvest for the past several years, combined with good fawn recruitment, has resulted in approximately a 250 animal increase in the population estimate. The antelope population is slightly over the estimated carrying capacity of the winter range. Harvest recommendations will attempt to keep this population within the confines of their limited winter range. Units 065, 142, portion of 144: Southern Elko County, Northern Eureka County Report by: Russell Woolstenhulme Survey Data Post-season herd composition surveys were conducted from the ground in December 2009. A total sample of 209 antelope was obtained; yielding sex and age ratios of 43 bucks:100 does:36 fawns. In 2008 the sample of 381 antelope resulted in ratios of 37:100:34. Habitat Approximately 35,000 acres of habitat burned within this unit group during the summer of 2006. The Webb and Sneekee fires in particular affected range used by antelope during the summer and fall months. Several fires have burned areas that were previously burned during fires in 1999. These burns are expected to provide good summer and fall habitat in the future. Most of the important antelope winter habitat in this unit group was unaffected by the burns. Winter habitat is a limiting factor within this unit group which may limit herd growth potential and create depredation problems in Unit 144 as antelope continue to disperse further into Eureka County.
31
PRONGHORN
Population Status and Trend Population estimates for this unit group have increased over the past few years. Fawn and buck ratios were both up in the short-term, and the population is showing long-term growth. Unit 066, Owyhee Desert: Northwestern Elko County Report by: Ken Gray Survey Data A helicopter survey was conducted within this unit in August of 2009. A sample of 264 antelope was obtained; yielding sex and age ratios of 34 bucks:100 does:28 fawns. Habitat The 9 antelope water developments constructed on the Owyhee Desert were used extensively by antelope during the summer of 2009. Most other water sources were dry. Population Status and Trend The Owyhee Desert segment of the population continues to struggle with low fawn production. While the Owyhee Desert portion of the population has remained static, the pronghorn populations on the west side of the Snowstorm Range and in the Petan Ranch area have slowly increased for the past several years. Overall this year’s population estimate increased by 10% from last year. Units 067, 068: Western Elko and Northern Lander and Eureka Counties Report by: Ken Gray Survey Data A winter ground survey was conducted in January 2010. A sample of 887 pronghorn was obtained; yielding ratios of 49 bucks:100 does:35 fawns (Table 1). The buck ratio was 6 bucks:100 does above the 10-year-average. The fawn ratio was 11 fawns:100 does higher than last year’s ratio and was slightly higher than the 10-year-average. Table 1. Observed Buck Ratios, Fawn Ratios and Sample Size for Pronghorn in Units 061-073.
Parameter 2009 2008 1999-2008 Average
Bucks:100 does from fall surveys 49 54 43
Fawns:100 does from fall surveys 35 23 34
Sample size from fall surveys 887 1,060 736
Habitat Significant storms during late May and early June, 2009 contributed to good range conditions for the summer and fall months. Antelope arrived on winter range in good condition. The combination of healthy antelope and a mild open winter facilitated high winter survival. The large seeding projects that were implemented during the past 13 years are being used extensively by wintering antelope. Antelope are especially utilizing the forage kochia associated with these seeded areas. Antelope winter use on forage kochia has averaged between 20% and 40% in some areas over the past 6 years. The Izzenhood seeding project implemented by the Elko BLM, along with the
32
PRONGHORN
Bobs Flat, Dunphy Hills and Sheep Creek Range seedings have been extremely important for wintering antelope. The 1,100 acre seeding project that was implemented by NDOW and the TS Ranch in the northern end of Boulder Valley in January of 2009 designed to improve degraded winter range for antelope was partially successful. The entire area was aerially reseeded again in January of 2010 in an attempt to further improve the success of this seeding. Population Status and Trend The 067-068 antelope population size is similar to last year’s estimate. The 2009 harvest levels were successful at maintaining this population at approximately 1,100 antelope. The recommended quotas for the 2010 season will attempt to maintain this population at current levels. Units 072, 074, 075: Northeastern Elko County Report by: Kari Huebner Survey Data Surveys resulted in 696 antelope being classified in mid-August. The resulting sex and age ratios for the sample were 23 bucks:100 does:31 fawns. The buck ratio is down from 36 bucks:100 does last year, however the fawn ratio showed an increase after 5 years of decreasing ratios. Fawn recruitment is still 25 percent lower than the ten-year average of 39 fawns:100 does. This survey is typically conducted between the archery and rifle season in this unit group due to the migration of antelope out of the northern end of Unit 072 into Idaho during and after the rifle season. This survey is normally collected from the ground however this year’s higher sample size can be attributed to an aerial survey being conducted. Habitat This unit group was affected greatly by wildfire in 2007 and 2008. A large amount of area burned in the northern end of Units 072 and 074 (Murphy, Scott Creek, and East Slide Rock Ridge Fires-nearly 700,000 acres), and a smaller area in Unit 075 (The Hepworth Fire-38,000 acres). The long-term effects of these fires may be beneficial as perennial grasses dominate the recovering burned areas, however the negative short-term effect will be less brush available on winter ranges. Population Status and Trend Overall, this pronghorn herd appears to be stable. The combination of the lack of timely summer precipitation and poorer quality winter range due to fires have contributed to lower fawn survival than expected for this herd. Hopefully, with the extensive seeding efforts in Nevada and Idaho on the burned areas, the herd’s carrying capacity will increase and expand in future years. Units 076, 077, 079, 081, 091: Northeastern Elko County Report by: Kari Huebner Survey Data Post-season surveys in August and September resulted in 204 antelope being classified. The resulting sex and age ratios for the sample were 46 bucks:100 does:27 fawns. The buck ratio was the same as last year, however the fawn ratio increased for the first time in 3 years, up 42 percent from last year’s ratio of 19 fawns:100 does.
33
PRONGHORN
Habitat Major fires impacted this herd in 2007. The West Basin and Eccles Fires (81,741 acres) affected a good portion of Unit 076, and the West Fork Fire (162,151 acres) burned the majority of Unit 081. The long-term effects of these fires should be beneficial to pronghorn as perennial grasses dominate the recovering burned areas, however the negative short-term effect will be less brush available on winter ranges. Population Status and Trend Overall, this pronghorn herd appears to be stable to slightly increasing. This herd had been increasing in the northern areas of Unit 076 with expected movement of antelope from Idaho. This is more than likely a result of the large amount of area that burned in these units during the summers of 2000, 2001, and again in 2007. The area has been seeded heavily and perennial grasses are coming back well. Extensive seeding efforts on the 2007 burned areas in the northern Unit 081 are also showing increases in antelope numbers. Units 078, 105 – 107, 121: Southeastern Elko and Central White Pine Counties Report by: Caleb McAdoo Survey Data All but Unit 078 was surveyed from the ground in late November and Early December. A total of 528 animals was classified, yielding sex and age ratios of 40 bucks:100 does:20 fawns. Habitat The spring of 2009 provided significant moisture; however, it appears the timing of that moisture was too late to facilitate fawn survival. The timing and amount of spring precipitation did result in significant spring growth of grass and forbs in late May and June, however, summer moisture was lacking and subsequently, so was the production of summer forbs and grasses. Despite having good spring moisture in 2009, water availability throughout the year continues to be an issue for both animal water requirements and forage production. Antelope have been especially challenged in areas where they face stiff competition from wild horses for the little water that is available. The Department of Wildlife is in the process of identifying and developing water developments in these unit groups which would provide more consistent water sources for pronghorn on a year-round basis. Population Status and Trend The 2009 population estimate for the 078, 105 – 107, & 121 Unit Group is almost unchanged from last year. Although good precipitation occurred the spring of 2009, low recruitment in both 2008 and 2009 appear to be preventing this population from continuing its previously observed growth trend. Fawn ratios for 2008 and 2009 are well below the long-term average of 30 fawns:100 does. Despite the poor recruitment observed in the last few years, the population demonstrates a positive long-term trend. This trend was bolstered by high fawn ratios in 2004 and 2005. Units 101 – 104, 108, portion of 144: South Central Elko and Western White Pine Counties Report by: Caleb McAdoo Survey Data Units 101, 102, 104, 108, and 144B were surveyed from the ground in late November and early December. A total of 556 animals was classified, yielding a ratio of 43 bucks:100 does:23 fawns.
34
PRONGHORN
Habitat The spring of 2009 provided significant moisture; however, it appears the timing of that moisture was too late to facilitate fawn survival. The timing and amount of spring precipitation did result in significant spring growth of grass and forbs in late May and June, however, summer moisture was lacking and subsequently, so was the production of summer forbs and grasses. Despite having good spring moisture in 2008, water availability throughout the year continues to be an issue for both animal water requirements and forage production. Antelope have been especially challenged in areas where they face stiff competition from wild horses for the little water that is available. Population Status and Trend The current population estimate for the 101 – 104, & 108 Unit Group is up slightly from last year. The long-term pattern is an upward trend, due to pronghorn releases (+86 in 2003) and good to fair levels of fawn recruitment in recent years. The dry range conditions in 2007 likely resulted in the low fawn recruitment observed in 2008. The fawn recruitment in 2008 was one of the lowest observed in the last 25 years. Despite the slight increase in this year’s population estimate, this unit group’s population is likely very similar to last year and so the increase is more indicative of an adjustment in the estimate than actual population growth. Units 111 – 114: Eastern White Pine County Report by: Curt Baughman Harvest Results Two new hunts were initiated in 2009. There were 8 resident tags for a Sept. 25 – Oct. 4 buck-only muzzleloader hunt. The application rate was 5 applicants per tag with 3 tag holders being successful. A 24-tag resident horns-shorter-than-ears any-legal-weapon hunt (Sept. 6 – Sept. 20 season) was also offered which saw 90 applicants with 19 successful hunters. Survey Data The 2009 post-season survey was conducted from both the ground and the air between Oct 2009 and March 2010. Coverage was limited in Spring and Antelope Valleys. The sample of 498 pronghorn yielded sex and age ratios of 37 bucks:100 does:25 fawns. The 2008 post-season survey sample of 976 pronghorn resulted in sex and age ratios of 35 bucks:100 does:16 fawns. Herd composition averaged 36 bucks:100 does:33 fawns for the previous 10 years (1998-2007). Although fawn recruitment was below average for the third consecutive year, the 25 fawns:100 does documented during the 2009 survey was an improvement from the record low 16 fawns:100 does observed during both the 2007 and 2008 post-season surveys. Habitat Following 2.5 years of severe drought, habitat conditions improved in 2009. Precipitation recorded in Ely by the National Weather Service totaled 124% of average for the April through July period and 115% for the year. The condition of vegetation improved, which allowed pronghorn to begin a recovery of body condition. Water distribution was greatly improved by June rains which filled many catchment ponds. It was good that pronghorn entered the 2009-10 winter in good condition. The past fall and winter brought above-average precipitation and twice the usual snowfall to the Ely area. Areas north of Ely received less and areas south received more. The combination of snowfall and persistent cold produced substantial snow-cover that was continuous in many areas from mid-December through mid-March. Most valley bottoms were not spared. In spite of these conditions, spring observations documented improved fawn recruitment over the previous 2 years. As of early April the water-year
35
PRONGHORN
precipitation total for Ely stands at over 110%. Storms continue to add moisture to an above-average snowpack. Habitat conditions should continue to improve during the upcoming spring period. A wind energy facility with 90+ turbines is being planned for a portion of Spring Valley that is heavily used by pronghorn. The BLM has received an application for an additional, even larger site just north of the first. It is unknown how pronghorn will respond to the development of wind energy facilities in these areas. Population Status and Trend Following a period of stable to increasing population trend from 2001 through 2006, this pronghorn population declined in subsequent years due to adverse climatic conditions. Pronghorn fawn recruitment has been below-average for the past 3 years, including the 2 lowest on record. Although conditions for pronghorn became more favorable in 2009, the improvements came too late to translate into strong 2009 production and a complete reversal of the population decline. The 2010 population estimate is slightly below the 2009 estimate and may correspond to a slight reduction in some quotas for the 2010 hunts. In spite of the long recent winter, pronghorn should be in better condition than they were a year ago. Production in 2010 should improve over that of 2009. Habitat restoration projects may result in increased potential for this unit-group to support pronghorn if the benefits are not offset by negative climatic factors. Seven of the past 10 years have seen below-average moisture for this unit-group. Units 115, 231, 242: Eastern Lincoln and Southern White Pine Counties Report by: Mike Scott Survey Data Ground surveys were conducted for pronghorn in this hunt unit during October and November 2009. A total of 209 antelope was classified, consisting of 52 bucks, 126 does, and 31 fawns. This total provides a ratio of 41 bucks:100 does:25 fawns. The antelope were found using more of the pinyon-juniper invaded habitat this year, making observation difficult. Many more antelope were observed but were unable to be classified. Habitat Habitat conditions during the survey were good due to moderate summer and fall precipitation, however, the dry spring conditions during the spring of 2009 likely led to the lower observed fawn ratio. BLM has recently done large habitat projects, designed to improve habitat for sage grouse, in Lake, South Spring, and Hamlin Valleys that may eventually benefit pronghorn. BLM also failed to gather exorbitant numbers of feral horses that are having a dramatic detrimental effect on pronghorn habitat and water sources. It is likely that BLM’s failure to keep feral horses at or even near AML will have a lasting detrimental effect on these new projects. Continued expansion of pinyon-juniper into pronghorn habitat is likely also having some effect on pronghorn habitat. BLM did however clear multiple sites for installation of new water developments, and purchased the materials for these new guzzlers. NDOW and BLM are new trying to find ways to get these new projects constructed. Population Status, and Trend The computer-generated population estimate for 2010 lower than that of 2009.
36
PRONGHORN
Units 131, 145, 163, 164: Southern Eureka, Northeastern Nye, and Southwestern White Pine Counties Report by: Mike Podborny Survey Data Post-season herd composition surveys were conducted from the ground in September and October 2009. There were 490 antelope classified, a record sample; yielding sex and age ratios of 28 bucks:100 does:30 fawns. There were an additional 70 antelope not classified during the survey. In 2008 the sample was 106 antelope yielding age and sex ratio of 29 bucks:100 does:23 fawns. The 10-year-average (1999-2008) fawn ratio was 26 and has ranged from 5 to 40 during that same time period. Habitat The Southwest Intertie Project (SWIP) is a large 500 kV power line proposed from Idaho to Las Vegas and will cross through Jakes Valley in Unit 131. This power line when constructed should have minimal impacts to antelope but disturbance of habitat will occur. Population Status and Trend There were 490 antelope classified and an additional 70 observed but not classified during the post-season survey. This indicates the population estimate of 500 in 2009 may have been conservative. The 2010 computer model was adjusted to reflect a higher base population with an increasing trend due to good fawn recruitment for this herd. This antelope herd has increased in the past 20 years due to ingress of antelope from other areas, transplants, increasing habitat due to water developments and some favorable weather conditions. The larger population size and associated increased distribution has resulted in an increased use of alfalfa fields by antelope over the years. Fencing of some fields and the installation of guzzlers to provide additional water away from fields has lessened the impacts of antelope on private land. As these antelope populations continue to increase in this area, the challenge will be to employ management that minimizes conflicts with private land. Units 132-134, 245: Eastern Nye and Western Lincoln Counties Report by: Mike Podborny Survey Data There were no post-season antelope surveys conducted in 2009 in this unit group. The previous survey was conducted in September and October 2008 with 190 antelope classified; yielding sex and age ratios of 51 bucks:100 does:23 fawns. Habitat Four water developments in Garden and Coal valleys were rebuilt by the NDOW Guzzler Crew in 2007. These water developments will secure a reliable water source for antelope and other wildlife. The Southwest Intertie Project (SWIP) is a large 500 Kv power line proposed from Idaho to Las Vegas and will bisect several valleys in this unit group. The potential impacts to antelope are anticipated to be minimal. The Caliente Nuclear Train Route proposed by the Department of Energy (DOE) from Utah to Yucca Mountain which would have bisected Units 132 and 133 apparently will not be built due to the withdrawal of Yucca Mountain as the nation’s Nuclear Repository. Population Status and Trend In January 2008, 184 antelope were captured in Unit 068 north of Interstate 80 and released in Coal and Garden valleys of Unit 133. It appears the release was successful in increasing the number of antelope in both Sand Spring Valley in Unit 133 and unfortunately, in the agricultural fields near Rachel
37
PRONGHORN
in Unit 245. Adjacent antelope populations averaged 30 fawns:100 does this year and this rate was used to generate the computer modeled population estimate. The excellent forage conditions that existed during the summer from abundant rain in June should have supported the moderate fawn recruitment and population increase estimated for this unit group. Units 141, 143, 151 – 155: Eastern Lander and Eureka Counties Report by: Jeremy Lutz Survey Data Post-season antelope surveys were conducted from the ground in September, October, November, and January of 2009-2010. Areas surveyed included Crescent Valley, Grass Valley, Antelope Valley, Reese River Valley, and the Simpson Park Mountains. There were 522 animals classified during post-season surveys yielding sex and age ratios of 58 bucks:100 does:56 fawns. The previous year’s sample (2008) was 585 antelope classified; yielding ratios of 45:100:54. Habitat Habitat conditions for antelope continue to improve across much of Lander and Eureka counties. The Battle Mountain BLM is in the final stages for completing the remaining 2 allotment evaluations, the Argenta and Battle Mountain allotments. Completion is set for 2010. Two habitat projects were completed in 2010 in Lander and Eureka counties in the Shoshone Mountains. The 2007 Sansinea fire burned approximately 29,000 acres of summer and winter habitat for antelope on the Argenta Rim. This area now contains a robust perennial grass and annual weed community with little to no shrub component. In January and February of 2009 approximately 1400 acres were aerial seeded with sagebrush and forage kochia and over 600 sagebrush seedlings were planted in high wildlife use areas. Success on these projects depends on adequate spring and summer moisture. Population Status and Trend The 2009 hunter success rate of 78% was even higher than last year (71%). This year’s post-season survey sample size was the second largest recorded for this management unit group. The northern half of Units 141 and 152 experienced a relatively mild and open winter. Green-up on grasses and forbs along with a lack of persistent snow cover led to favorable conditions for antelope this winter. This should result in good fawn recruitment and adult survival. The southern portion of Units 152,154, and 155 experienced a much harder winter. Deep snow and cold temperatures persisted till late March without any available green-up. Antelope were always found in sagebrush covered valleys and open south facing slopes. Fawn recruitment and adult survival is expected to be fair for the southern units. The overall fawn ratio for the past 5 years for this management unit was 44 fawns:100 does. This was an above average ratio resulting in good population growth. The population estimate for this management unit has increased due to above-average fawn ratios and mild winters. Units 161, 162: Northern Nye, Southeastern Lander, and Southwestern Eureka Counties Report by: Tom Donham Survey Data During September and October 2009, a total of 82 pronghorn was classified as 19 bucks, 54 does, and 9 fawns in Units 161 and 162. The observed fawn ratio of 17 fawns:100 does is somewhat below the previous 9-year average of 21 fawns:100 does. The previous post-season composition survey took place in 2008 when a total of 102 pronghorn was classified as 34 bucks, 53 does, and 15 fawns.
38
PRONGHORN
Habitat Habitat conditions in central Nevada have suffered due to drought conditions experienced on a regular basis for nearly a decade. In addition to impacts caused by drought, range conditions in many areas of central Nevada have suffered due to large numbers of feral horses. Some relief was provided to portions of the area when the Bureau of Land Management removed 205 feral horses during January and February 2007. The horses were removed from the Stone Cabin HMA, a portion of which lies within Unit 162. If feral horse numbers are kept in check following these gathers, improvements to forage quantity and quality as well as to critical water sources should benefit pronghorn herds. Additional feral horse gathers are planned for the near future in central Nevada, but due to lawsuits filed by pro-horse groups in response to most capture plans, these captures may or may not take place. The completion of 3 water developments in the southern portion of Unit 162 could benefit pronghorn that have been impacted by the downward trend of natural spring sources caused by feral horses and drought. The water development projects were begun in 2005 by the USFS, and to date, only one development has been completed. Unfortunately, the USFS has not fenced the water development that was built, and feral horses are currently utilizing it, which is increasing horse use in the very area where the development was supposed to have provided relief to resident pronghorn. Population Status and Trend During the mid 1980’s favorable climatic conditions allowed pronghorn populations to expand throughout central Nevada, including Units 161-162. Drought conditions experienced during most years from the late 1980’s thru the mid 1990’s slowed, and in some instances reversed this growth. While pronghorn populations remained relatively stable from the late 1990’s thru the early 2000’s, severe drought conditions experienced during 2002 and 2003 once again took a toll on these herds. Drought conditions can result in poor body condition of adult animals due to reduced nutrition, resulting in underweight fawns, as well as reducing fawn hiding cover during the time when they are most susceptible to predation. Unfortunately, dry conditions have occurred during more years than not during the past 9 years. Improved conditions experienced in 2009 may have set the stage for an increase in central Nevada pronghorn herds, but conditions will need to remain favorable for some time in order for this to occur. The Unit 161-162 pronghorn herd has suffered very low production throughout the past decade, and overall the herd continues to experience a downward trend in most areas. Despite the slight downward trend, this year’s published population estimate is the same as last year’s because the population estimate in 2009 was believed to be slightly low, and was increased accordingly through the modeling process. Although pronghorn continue to struggle due to poor habitat conditions throughout most of Units 161 and 162, an increase in numbers over the past several years has occurred around agricultural areas in Big Smoky Valley, Unit 161. This increase can be attributed to transplants of pronghorn in neighboring units, as well as the availability of higher quality forage and more reliable access to water in these areas during critical periods. Units 171 – 173: Northwestern Nye and Southern Lander Counties Report by: Tom Donham Survey Data No formal post-season survey was conducted in Management Area 17 during the fall of 2009. Despite the lack of a formal post-season survey, observations of pronghorn during random encounters throughout the summer in MA 17 indicate the herd in this area also experienced reduced production in 2009. The previous post-season composition survey was conducted from the ground in the fall of 2008. During that survey a total sample of 35 pronghorn was classified as 9 bucks, 21 does, and 5 fawns.
39
PRONGHORN
Habitat Three water developments have been installed in Unit 172 over the past several years and pronghorn have benefited from the reduction of competition with feral horses and livestock at natural waters. These waters have also allowed pronghorn to utilize habitats and associated forage that are unavailable to feral horses and livestock for a large part of the year due to a lack of natural water. The water developments have become even more important to the population during the recent series of drought periods. Population Status and Trend From 1988 to 2003, a total of 173 pronghorn was released into Ione Valley, Unit 172. Following these releases, many animals dispersed into adjoining areas, which slowed the growth of the MA 17 pronghorn herd, but at the same time, benefited surrounding areas. During much of the past decade, the MA 17 pronghorn herd experienced somewhat better production than other central Nevada herds, which allowed this population to show moderate growth while others did not. Unfortunately, during the past 3 years this has not been the case. Currently, the MA 17 herd is experiencing the same lowered production rates as other central Nevada herds. Unless the improvement in climatic conditions experienced in 2009 continues into the foreseeable future, the MA 17 pronghorn herd is expected to continue to struggle. Similarly to other central Nevada herds, while the pronghorn population struggles throughout much of MA 17, increases in numbers are occurring in and around agricultural areas. Population increases in agricultural areas in Unit 184 have begun to stimulate population growth in the northern reaches of Unit 172, which is reflected in the slightly increased population estimate for this year. Due to the fact that pronghorn regularly move between Nye, Esmeralda, Mineral, and Churchill counties, it is very difficult to develop a population estimate for this area. Currently, the Unit 171-173 pronghorn population appears to be experiencing a slightly increasing trend due to ingress. Units 181-184: Churchill, Southern Pershing, Western Lander and Northern Mineral Counties Report by: Jason Salisbury Survey Data A post-season composition survey was conducted from the ground in Units 181-184 during the fall of 2009. A total of 368 pronghorn was classified as 91 bucks, 187 does, and 90 fawns. The resulting ratios were 49 bucks:100 does:48 fawns. This year’s survey is a record survey for these unit groups. The sample recorded this year is a 59% increase when compared to the previous year. Habitat Habitat conditions are improving significantly because of an increase in late winter and early spring precipitation. Upper elevation toe slopes and mountain sides are experiencing significant green up. The improved moisture receipts should dramatically improve forage conditions and water availability at spring sources for this antelope herd. Future water resources are needed to allow for continued expansion and growth. Some pronghorn populations within Churchill County rely solely on winter livestock water haul sites. These water haul sites are not dependable water sources for this expanding herd. Future water developments are needed to provide dependable water sources as well as reducing competition with livestock. The Bureau of Land Management is currently working on a plan to prescribe herbicide usage within the Edwards Creek Valley to control Cheat grass. Following the herbicide treatment, native grasses as well
40
PRONGHORN
as forage kochia will be planted in large green strips to control future incidents with fire. If forage kochia becomes established in this seeding it will provide an alternative food source for the Area 18 pronghorn herd. Population Status and Trend Pronghorn numbers within Churchill County have steadily increased over the past 7 years. The future outlook for this herd is promising. Continued fawn ratios in the high forties will allow for continued growth of this herd. This year’s sample size coupled with a 91% hunter success rate indicates a healthy buck ratio and will provide ample pronghorn for harvest well into the future. Additionally the 2009 harvest indicates 54% of the bucks harvested were 15” and greater in size with the statewide average running around 36%. The 2010 population estimate is a 30% increase over the 2009 estimate. This increase is based on antelope observed during fall surveys. It is believed that the Area 18 pronghorn herd was slightly underestimated in previous years. Units 202, 204: Lyon and Mineral Counties Report by: Jason Salisbury Survey A total of 71 pronghorn was classified during a late February ground survey in 2010. The sample consisted of 21 bucks, 43 does, and 7 fawns. The resulting ratio consists of 49 bucks:100 does:16 fawns. The 2010 fawn ratio is the second consecutive year of low fawn production. Habitat For several years now below average precipitation has negatively affected the quality of forage on both summer and winter ranges. Feral horse gathers were conducted in the Bodie Hills and Aurora Peak and a total of 200 feral horses was removed. This should lessen competition for forage and water resources. The horse roundup occurred primarily on antelope summer range, which is in the upper elevations of the Bodie Hills of California. Population Status and Trend For the last 3 years fawn production has been in the teens and twenties. This year’s decreased fawn recruitment is a direct result of below average precipitation levels, resulting in poor vegetation conditions on summer and winter ranges. This degradation of vegetation can account for poor body condition of does resulting in poor fawn recruitment. On the whole, this herd is experiencing a static population trend. Units 203, 291: Lyon, Douglas Counties Report by: Jason Salisbury Survey Data A shortened post-season ground survey was conducted in Units 203 and 291 during the fall of 2009. During the survey a total of 39 antelope was classified as 18 bucks, 15 does, and 6 fawns. The resulting ratio of 40 fawns per 100 does will produce a slight increase in this population. Habitat The Adrian valley fire burned 18,000 acres in the summer of 2007. A reseeding effort of grasses and forbs occurred in the winter of 2008 and should allow for the recovery of the burn and provide needed forage resources for the antelope herd that summers on the table tops of the Pine Nut Mountain Range.
41
PRONGHORN
Future needs require the placement of water developments into the Buckskin and Singatse Mountain Ranges to extend the summer range of this antelope herd. Population Status and Trend Fawn production and recruitment within these unit groups fluctuate on a yearly basis depending on the amount of precipitation received and forage quality. The slight increases in fawn production allows for above maintenance level recruitment. These slight bumps in fawn production in the recent past have been followed by below maintenance level recruitment resulting in a static population growth trend within this herd. The population estimate approximates the 60 animals reported last year. Units 205, 206: Eastern Mineral County Report by: Jason Salisbury Harvest Results In 2009 the any legal weapon hunt 1331 was changed from late August to late September. The reasoning for this change was past conflicts that have occurred between hunters and the North and South Off-road Race that ran concurrent with the hunting season. The 2009 hunter success was 6% lower than in 2008. The reduced success may be attributed to pronghorn dispersing away from water sources. Survey Data A sample of 52 antelope was classified, yielding a composition ratio of 84 bucks:100 does:24 fawns. Areas surveyed include Calvada Flat, Whiskey Flat, Pilot Mountain, Garfield Flat and Win Wan Valley. Habitat The Calvada Summit guzzler is an important water development used by the pronghorn herd in Unit 205. In 2010 additional apron and tanks were installed to meet the demands of the herd. Also in 2010 the Wildhorse canyon water development was rebuilt and should provide a new dependable water source for the antelope that occupy the Win Wan Flat area. Additionally the Sunrise Flat water development was rebuilt providing a new dependable water source. Population Status and Trend The Mineral County antelope herd occupies a large expanse of land. Small scattered groups of antelope occupy small home ranges in and around water during the summer time. The last several years has had low fawn production creating a static population trend. The population estimate for the Area 20 antelope herd is 320 animals. This herd will only experience significant population growth following considerable increases in moisture. Some areas associated around agriculture should allow for increased population growth, but following extensive drought periods the population may succumb to reduced recruitment of fawns into the population. Units 221 – 223, 241: Lincoln and Southern White Pine Counties Report by: Mike Scott Survey Data Ground surveys were conducted for pronghorn in these units during October and November 2009. A total of 147 antelope was classified consisting of 28 bucks, 93 does, and 26 fawns, which results in a ratio of 30 bucks:100 does:28 fawns. Pronghorn were observed in Delamar, Dry Lake, Cave, White River, Steptoe, and South Spring Valleys. The survey was conducted later in the year than normal and lower numbers than expected were seen.
42
PRONGHORN
43
Habitat and Population Status and Trend Habitat conditions appeared to be good during the survey due to moderate summer and fall precipitation. Dry conditions existed during the spring of 2009 that likely led to the low observed fawn ratio. BLM has recently completed large scale habitat projects in Cave Valley for the benefit of sage grouse that should result in improved habitat for pronghorn as well. Extremely high numbers of feral horses can be observed in Dry Lake, Muleshoe, and Cave Valleys which likely have a detrimental effect on pronghorn habitat and water sources, and may have a dramatic detrimental effect on the new projects. Added threats to pronghorn habitat include new powerline projects and solar energy projects which are proposed for this area. Additionally, BLM continues to approve OHV races that run through pronghorn winter and fawning habitat. The computer-generated population estimate for 2010 is slightly lower than the 2009 estimate. Unit 251, Central Nye County Report by: Tom Donham Survey Data Post-season composition surveys were conducted in Unit 251 during early October 2009. A total of 209 pronghorn was classified as 61 bucks, 118 does, and 30 fawns. Of the 209 animals observed, 192 of them were located on private alfalfa pivots, and 105 of those animals were located on pivots immediately adjacent to the Nellis Test and Training Range boundary. The previous survey was conducted during the fall of 2008 when a total of 177 pronghorn was classified as 50 bucks, 78 does, and 49 fawns. Habitat Pronghorn habitat in Unit 251 has been severely impacted by drought and unreasonable numbers of feral horses for quite some time. Some natural water sources that have been damaged by feral horses for years have gone dry due to recent drought conditions. Forage conditions, which have suffered from high numbers of horses, have been even more severely impacted by the additional stress of recent drought. While 2009 saw an improvement in climatic conditions, a continuation of these circumstances will be necessary for any significant benefits to be realized. During January and February 2007, the BLM conducted several feral horse gathers in central Nevada. A total of 461 feral horses was removed from the Stone Cabin, Reveille, and Saulsbury HMA’s, as well as the surrounding area. The majority of these feral horses were removed from Unit 251. The removal of these feral horses should help improve habitat conditions as well as provide some relief to critical water sources that have been severely impacted by feral horse abuse. Although the gathers are a step in the right direction, numbers are still above appropriate levels and impacts to pronghorn, other wildlife, and their habitats will likely continue until further reductions occur. Additional feral horse gathers are planned for the near future in central Nevada, but due to lawsuits filed by pro-horse groups in response to most capture plans, these captures may or may not take place. Population Status and Trend Due to recent drought conditions and impacts from feral horses, pronghorn are increasingly attracted to nearby agricultural areas. A large portion of the resident Unit 251 pronghorn herd resides on private land for a large portion of the year. An even larger number of pronghorn have begun to drift out of the NTTR to an increasing number of private alfalfa pivots along the NTTR boundary. Presently, due to movements of animals into the Unit from the NTTR, and the tendency for a few of these animals to remain on the public land side of the boundary, the Unit 251 population is considered to be slightly increasing. This estimate does not include the majority of those animals that spend the largest portion of the year within the NTTR.
ELK
ROCKY MOUNTAIN ELK Units 061, 071: Bruneau River and Merritt Mountain Area; Northern Elko County Report by: Ken Gray Harvest Results A total of 111 rifle bull elk tags, including incentive and nonresident, was available for the 2009 season. This represented a 67% tag increase from the 2008 quota. Hunter success for the resident rifle bull hunt was 49%. Antlerless rifle tags were increased from 44 tags in 2008 to 147 tags in 2009. The hunter success rate for this hunt was 35%. Survey Data A total of 1,679 elk was classified from a helicopter during February of 2010. The sex and age ratios of the sample were 35 bulls:100 cows:46 calves (Table 1). The calf ratio was 10 calves:100 adults below last year’s record level but was still 2 calves above the 10-year-average. Table 1. Observed bull ratios, calf ratios and sample size for elk in Units 061-071.
Parameter 2009 2008 1999-2008 Average
Bulls:100 cows from winter surveys 35 38 31
Calves:100 cows from winter surveys 46 56 44
Sample size from winter surveys 1679 1466 596
Habitat The Murphy fire burned approximately 550,000 acres during the summer of 2007. This fire burned most of the Bruneau River drainage, parts of the Mahogany Range and over half of the Diamond A Desert. The grass and forb components continued to show excellent recovery throughout the burn in 2009. In addition, significant aspen sprouting was noted in many of the stands that burned. The recovery of the grass and forb segment of the burn, combined with mostly good over-all range conditions, once again facilitated an above average calf ratio. A rangeland consultant, hired by the Forest Service, conducted monitoring in this unit group during the summer of 2009 to determine if elk were having any negative impacts on the vegetation. The monitoring results showed there was very little elk use occurring on the native grasses on any of the seasonal ranges. The consultant also stated that increases in the elk population from current levels could possibly contribute to the detriment of aspen communities that are currently in poor condition. Population Status and Trend The 061-071 elk population continued to increase this past year. The population estimate for 2010 is approximately 1,950 animals which is about 350 elk higher than last year’s estimate. Most of this increase was due to the above average calf crop that was recruited into the population this year combined with the lower than expected cow harvest. It has been reported by a number of sources that approximately 250 to 300 of these elk are residing in the deserts of Idaho on a yearlong basis. In addition, a segment of this herd lives on the Duck Valley Indian Reservation for most of the year. To further complicate the management of this herd is the fact that an unknown number of elk leave Nevada during the hunting season and move into Idaho where hunting pressure is either non-existent or minimal. This was confirmed by a quick helicopter flight 4 days after the close of the Nevada elk
44
ELK
season in which several bulls were observed in Idaho along the Nevada border. Meetings are scheduled with Idaho Fish and Game to coordinate hunting seasons between the 2 states to address this situation. Hunter congestion in this area is expected to increase along with tag levels. Season structure strategies may have to be explored that address this issue but still maintain adequate harvest levels. Units 062, 064, 066 – 068: Independence and Tuscarora Ranges; Western Elko and Northern Eureka and Lander Counties Report by: Ken Gray Hunt Data Thirty-three rifle bull tags were issued in 2009. Hunter success for the resident rifle hunters was 54% which represents a 17% decrease from the 2008 hunter success rate. An antlerless season was offered for the first time in this hunt unit. Forty-four tags were issued and the success rate was 41%. Survey Data A total of 210 elk was classified in March of 2010 while conducting deer surveys. The calf to cow ratio was 49 calves:100 cows. Very few bulls were found during this survey. Habitat No large fires burned in this unit group during the summer of 2009. However, from 2005-2007 over 677,000 acres burned within occupied elk habitat. Many of these burns have recovered and are now dominated by perennial grasslands. The shrub component will take years to recover. The grass dominated vegetative communities favor elk which is evident by the high calf crop. Population Status and Trend The 2010 population estimate is approximately 525 elk which is up from the 450 estimated from the previous year. The increase is attributed to the high calf recruitment documented this past year. The objective of the recommended antlerless and bull quotas will be to reduce the elk population to about 500 elk which is consistent with the Western Elko County Elk Plan. Units 072, 074: Jarbidge Mountains; Northern Elko County Report by: Kari Huebner Harvest Results Seventeen of the 65 bulls harvested from this unit group were taken in Unit 074 during the 2009 season. Due mostly to the recent fires, this elk herd has continued to expand their range both to the east and the south. As a result, antlerless hunts were initiated for the 073 and 074 Units for the 2009 season. The bull hunt in Unit 073 is currently separate from this unit group. For specific 2009 hunting results, please refer to Harvest Tables in the Appendix Section. Survey Data Post-season surveys conducted in February resulted in the classification of 1,155 elk with observed sex and age ratios of 50 bulls:100 cows:29 calves. The post-season calf ratio indicates that the herd experienced 45 percent lower recruitment than the 5-year average production of 42 calves:100 cows. This is the third year in a row of decreasing calf ratios.
45
ELK
Habitat This herd was impacted by severe fire seasons in 2007 and 2008. The Murphy Fire (578,401 acres) burned mostly north and west of the Unit 072 boundary, however the fire had significant impacts in Idaho where this herd often winters. The Scott Creek Fire (55,658 acres) mostly impacted the northern portion of Unit 074. The East Slide Rock Ridge Fire (54,549 acres) burned the northeastern portion of the Jarbidge Wilderness and on out to the north and east towards Idaho. The Jarbidge Mountains Elk Herd Management Plan states that the population objective was 1,000 elk by the year 2010 and that this objective “will be evaluated and may be formally adjusted after 2010.” In order to address this section of the plan, NDOW will be working with the US Forest Service and the Bureau of Land Management to monitor elk use on vegetation at current population levels during the 2010 field season. Population Status and Trend Although the fires affecting this herd may prove to be beneficial to elk in the long term with grasses and aspen communities coming back especially at the higher elevations, they may have negatively impacted the survival of calves this winter due to significant portions of their winter range having been burned. The Jarbidge Mountains Elk Herd Management Plan identifies an elk herd population objective of 1,000 elk on the Forest portion of Units 072 and 074. In order to slow down the growth of this elk herd, antlerless hunts in Unit 072 and Unit 074 have been scheduled for the 2010 hunting season. Although calf recruitment was low again this year, the low success of antlerless elk hunters in this area will require antlerless tag recommendations to increase in order to keep up with population growth. It is believed that elk found on winter survey in Unit 073 may be spending a portion of the year in Unit 072. To help address this unknown distribution several elk were outfitted with telemetry collars to track their movements. Elk management actions will be further refined as results from this collaring project become available. Unit 073: Stag Mountain Area; Elko County Report by: Kari Huebner and Ken Gray Harvest Data In 2009 elk hunts were offered for the 073 Elk Herd for the first time. Fifteen rifle bull tags were available. The success rate was 67% for the rifle bull hunt and 93% of all the bulls killed in this unit were 6-point of better. Thirty antlerless rifle tags were available for the regular antlerless season. In addition, 98 antlerless tags were available for a late season hunt that included Units 072-075. In all, 32 antlerless elk were killed in Unit 073 (17 in the early season, 9 in the late season and 6 with muzzleloader and archery). Survey Data Post-season surveys conducted in November resulted in the classification of 793 elk with observed sex and age ratios of 20 bulls:100 cows:41 calves. Of the 793 elk classified in 073, 430 were classified on the west side of the unit while 363 were classified on the east side of the unit.
46
ELK
Habitat Unit 073 has been severely impacted by fire during the past 10 years. The Charleston fire burned nearly 150,000 acres while the Gopher and Sugarloaf fires burned another 35,129 acres in 2006. The recovery of perennial grass has been phenomenal in much of the areas that burned. In addition, these fires were heavily seeded with a mixture of plant species which has accelerated the recovery of these burns, especially the grass component. The resulting habitat created by these burns has been excellent for elk and has facilitated high calf production. Population Status and Trend The population estimate in November of 2009 for the entire Unit 073 Elk Herd was 854 elk. At this point it is unknown how many of these elk reside in 073 on a year-round basis. To provide a better understanding of this herd, 7 cows, 3 on the west side of the unit and 4 on the east side, were fitted with radio collars in January of 2010. The major objectives of this project are to determine seasonal use within Unit 073 and to determine if elk are moving into Unit 073 from surrounding units. The information obtained from this project will help determine 073 population levels and harvest strategies for future hunts. One of the concerns with hunting this area was that the open country combined with the high road densities would move elk out of the hunt unit during the hunting seasons. This did not appear to be the case with the levels of tags issued in 2009 as a high number of elk, especially cows and calves, were classified following the bull season. Hunter congestion is expected to become an issue in this area with increased quotas and future harvest strategies may have to be developed to address this situation. Unit 075: Snake Mountains; Elko County Report by: Kari Huebner Harvest Results In order to stay within the population objective of 100 elk outlined in the 075 elk sub-plan, adequate harvest of both sexes must be maintained. The split and longer seasons have allowed elk hunters to be more effective at antlerless elk harvest. Survey Data Post-season surveys resulted in the classification of 153 elk yielding age and sex ratios of 42 bulls:100 cows:52 calves. The bull and calf ratios both increased this year, in contrast to the decreases we saw in both ratios last year. This year sample size also increased. Habitat A 16,720 acre wildfire burned in the Deer Creek portion of this unit in the summer of 2006. Although the initial impacts to wildlife were negative, the elk herd is again utilizing this area due to the release of the perennial grasses, forbs, and aspen as the burn recovers. It will be several years until the brush component begins to recover. Population Status and Trend Both antlerless and antlered quotas will remain aggressive to keep this herd at population objective levels. Due to growing resident elk herds in Unit 074 the unit was managed separately and not combined with Unit 075 for the antlerless hunt as in past years.
47
ELK
Nearly half of the land in Unit 075 is private. Due to an increase in antlered elk tags last year, this year the 3 applicants that qualify for elk incentive tags saw an increase in tags. Hunters must be aware that due to low elk numbers and amount of private land access to elk during the hunting season can be difficult. Units 076, 077, 079, 081: Thousand Springs, Goose Creek, and Pequop Mountains Area; Northern Elko County Report by: Kari Huebner Harvest Results In 2009, bull tags were slightly reduced in this area and antlerless tags were increased again. This was in response to a good bull harvest the previous year and the herd reaching the population objective set for the area. Bull hunter success was down slightly from last year’s numbers by any legal weapon, muzzleloader, and archery hunters. The 2007 hunting season was the first year of a split antlered elk season was held in this unit group. So far the split seems to be effective as both success and percentage of 6-points or better was consistent for both the early and late seasons. Unit 081 was split out from the rest of the unit group for antlerless tags in the 2009 hunting season. Hunter success in 2009 was the same as 2008 for antlerless hunters in Unit 081 however it was higher in the rest of the unit group. Survey Data Post-season surveys resulted in the classification of 1,115 elk yielding age and sex ratios of 45 bulls:100 cows:37 calves. The observed bull ratio was above the 5-year average of 38 bulls:100 cows, however the calf ratio was 30 percent lower than the previous 5-year average of 48 calves:100 cows. Habitat Nearly 240,000 acres burned in this unit group during the summer of 2007. Extensive seeding efforts were expended to rehabilitate these fire ravaged areas. The habitat seems to be responding favorably as it did after the fires in 1999 and 2000. The long-term outlook is good for elk. Most of water developments proposed for the area have been built and are currently being used by elk. This increased water availability is helping distribute the elk throughout the unit group. It will be important in the future to replace existing cable fences with pipe-rail fences on the water developments in an attempt to more effectively exclude livestock.
In 2007 a private consultant conducted a habitat monitoring study for the BLM to assess elk use of vegetation at current elk densities since the population objective has been reached. The results of that study indicated that elk were not competing with livestock for forage at the current population level. The study also discovered that use was fairly high in isolated aspen and mixed shrub communities. This use was suspected be a combination of cattle, elk, antelope, and deer use. A fecal analysis study was conducted to determine which species may be having the most impact. The results showed that mule deer were having the most impact on bitterbrush, whereas the cattle, elk, and antelope were concentrating on grasses. There was some use of serviceberry and snowberry by elk and antelope. Population Status and Trend The population will show a slight increase this year to account for the addition of Unit 079 to this unit group. The low calf recruitment observed and effective antlerless harvest will contribute to the ability to keep this herd at objective level.
48
ELK
A good majority of this unit group is comprised of checkerboard lands, meaning every other section is either public or private. The elk are spending a good deal of time on private lands in this area. There are currently 10 landowners that participate in the elk incentive tag program who qualified for 35 elk incentive tags in this unit group. Incentive tag numbers went up largely due to elk spending more time on private land in Unit 081 due to the flush of perennial grasses in the burns. It should also be noted that the boundary of Unit 081 was split out from the rest of the unit group for antlerless tags again this year. This is due to low hunting pressure in the past and increasing elk due to the recovering burns in this unit. The hope is to reduce elk numbers in this area. Units 078, 104A, 105 – 107: Spruce Mountain; Elko County Report by: Caleb McAdoo Harvest Results For 2009, 6 any legal weapon tags were available and 4 hunters were successful. Of those successful, 3 hunters harvested bulls which were 6-points or better. One muzzleloader tag and one archery tag were also available. For specific 2009 hunting results, please refer to Harvest Tables in the Appendix Section. Survey Data Elk surveys were conducted for this unit in January, February, and March 2010 in conjunction with spring and fall deer surveys. A total of 336 elk was observed yielding sex and age ratios of 10 bulls:100 cows:21 calves. The calf ratio was down from last year’s observed ratio of 28 calves:100 cows. This year’s data were consistent with historic trends of weak calf ratios for this unit group. The calf ratio in this unit group continues to be one of the lowest calf ratios observed in the state and with the exception of 2006 (46 calves per 100 cows), has been well below the long-term average of 34 calves per 100 cows, for several years. Weather and Habitat Despite mild winters in this unit group, 2009 survey data continues to suggest that calf production and recruitment remain low and hinder this population’s growth potential. Forage production and quality in this area are largely dictated by spring and summer precipitation. Despite the favorable conditions which were present in the spring and summer of 2009 calf ratios continue to remain low. Population Status and Trend In the winter of 1997, 146 elk were released in Unit 105 on Spruce Mountain. It has been 13 years since the releases and the elk have established themselves throughout Unit 105. Although production remains low, several mature bulls have been observed and harvested. Continued elk observations documented in Unit 078 indicate the herd is still expanding its distribution and range. Movement between adjacent units such as 077 and especially Unit 121 is also occurring and evidenced by the elk numbers observed in Unit 105 during late winter surveys in 2010. The total number of elk classified during winter helicopter surveys exceeded the modeled estimate for the unit group and were believed to include elk from Unit 121. Poor recruitment in recent years would not have allowed this elk herd to expand on its own without immigration from adjacent areas. Until follow-up radio-collaring work can be accomplished to see if all of the elk that winter in this area also summer there, the current elk population estimate for this unit group will not be drastically altered. Despite the low levels of calf recruitment observed in this unit, the 2009 population estimate shows an 11 percent increase over 2009 and may be attributed in part, to ingress from adjacent Unit 121. Harvest management has been designed to promote herd growth towards the population objective of 340 elk. A continued focus will remain on identifying the causal factors for low observed calf ratios and working towards developing
49
ELK
solutions where possible and practicable. Several habitat projects in the area, including chainings, seedings, and water developments, should continue to assist the population Unit 091: Pilot Range; Eastern Elko County Report by: Kari Huebner Harvest Results Nine bulls were harvested in Unit 091 in the 2009 hunting season, 4 by Utah hunters and 5 by Nevada hunters. Due to at least one PIW choosing to harvest in this unit most years, 3 tags will be offered for the 2010 hunting season. Survey Data An aerial survey was conducted in July this last year. The survey resulted in the classification of 130 elk, yielding sex and age ratios of 28 bulls:100 cows:35 calves. Population Status and Trend Unit 091 was formerly designated as Unit 079. Hunters that draw this tag are now only be able to hunt Pilot Mountain (both in Utah and Nevada) with the new western boundary being the Pilot Valley Road. This herd remains stable at this time. Drier conditions on Pilot Mountain are thought to be the reason for lower calf recruitment and adult survival. Unit 101 – 103: East Humboldt and Ruby Mountains; Elko County Report by: Caleb McAdoo Tag Quotas and Harvest Results Cow tags in this unit group have ranged from 30 in 2005 to 45 in 2006, 60 in 2007, and back down to 40 in 2008. The bull tag quota has ranged from 15 in 2005 to 20 in 2006, and 30 in 2007, 2008 and 2009. Although very few resident elk exist in these units, elk from adjacent units moving in and out of the area require maximum quota flexibility. Despite having 40 cow tags, only 6 cows were harvested in 2009 between the 4- month long seasons. For the early depredation hunt, 7 bulls were harvested, of which 71 percent were 6-points or better. Six bulls were harvested in the late depredation hunt, of which 67 percent were 6 -points or better. For specific 2009 hunting season results, please refer to Harvest Tables in the Appendix Section. Survey Data Specific elk surveys are not conducted this unit group, but intensive helicopter surveys are conducted for deer, bighorn sheep, mountain goats, and pronghorn. Elk observations are documented during these surveys, when hunters and others report sightings, or when landowner complaints are received and investigated. Incidental to other wildlife surveys in these units during 2009 and 2010, a single group of 13 elk was observed from the helicopter. Landowner complaints continue to remain low regarding elk damages and remain measure of success in our management practices. Population Status and Trend This is a depredation hunt with the objective of eliminating elk or keeping elk numbers at a level where depredation on agriculture does not occur and a viable elk herd does not become established. This hunt has been very effective to that end. At this time, it is believed that there are very few if any yearlong resident elk in these units. Observations of individual elk have been reported and small groups of elk have been found, within the unit, crossing the unit boundary, or near the periphery of
50
ELK
these hunt units. However, despite these periodic observations, the population remains at extremely low levels throughout most of the hunt units due to the aggressive quotas. Units 111 - 115, 221, 222: Schell, Egan, and Snake Ranges; Eastern White Pine, and Northern Lincoln Counties Report by: Curt Baughman Seasons, Tag Quotas and Harvest Results The total 2009 quota of 881 elk tags for regular hunts follows 1,268 tags in 2008 and a record 1,630 tags in 2007. The management objective for the 2009 harvest was a static population trend and a stable postseason bull:100 cow ratio. There were 419 total bull tags and 355 total antlerless tags issued in 2009. Elk hunters reported a total harvest of 480 elk in 2009, 615 elk in 2008 and the record harvest of 692 elk in 2007. The 2009 harvest included 254 bulls and 227 antlerless elk. Hunter success for 2009 bull hunts was higher than anticipated, and the harvest higher than the objective. The overall success rate for bull elk hunters was 59% in 2009, up from 55% in 2008 and the record low of 48% in 2007. Overall success for cow elk hunters was 44% in 2009 following 45% in 2008 and 40% in 2007. Two bulls were harvested by Heritage tagholders in this unit-group. The 2009 harvest was composed of 62% 6-point or better bulls. This follows 55% in 2008, 61% in 2007 and the record 72% 6-point or better bulls in 2006. The long-term (1981-2008) average has been 50% 6-point or better bulls in the harvest. Changes in hunter success rates and point class data are influenced by a multitude of factors including fluctuations in quotas, male age structure of the herd, weather patterns during the hunt, and habitat conditions which influence body condition and antler growth. The percentage of harvested bulls with main beams measuring 44 inches+ and 50 inches+ was 53% and 27% respectively for the 2009 harvest. There was basically no change from 2008.
Survey Data
Figure 1. Average and maximum age of elk teeth submitted by bull elk hunters from Unit Group 111 – 115, 221, 222 from 2001 – 2008, excluding 2004 and 2005.
The 2009-10 winter survey was flown in combination with a spring deer survey in late February and early March. Conditions were rare for a spring survey with extensive snow-cover and cold temps. These conditions facilitated a record sample as well as insights into winter distribution. A sample of 3,100 elk was classified; yielding sex and age ratios of 26 bulls:100 cows:36 calves. The observed bull:100 cow ratio was limited by scattered and unpredictable distribution of bull groups as well as a below-average presence of
yearling bulls. During the 2008 winter survey, 2,089 elk were classified; yielding sex and age ratios of 34 bulls:100 cows:35 calves. Survey samples have averaged 2,103 elk with sex and age composition of 32 bulls:100 cows:40 calves for the previous 10 years (1999-2008).
In 2001-03 and 2006-08, hunters were asked to provide incisor teeth from bulls for aging. Ages of bulls ranged from yearlings to 16 years. Combined with data on main beam length (obtained for nearly all bulls), the analysis indicated the average ages shown in Figure 1. Figure 2 represents the trend of how the main beam length changes with increasing bull age based on the 2008 data. Data on bull ages and main beam length have shed light on bull age structure and ultimately bull:100 cow ratios that are significantly higher than what can be observed. In 2007, teeth were also collected from harvested antlerless elk. This revealed that the harvest was distribution across age classes from calves to 19 years. Habitat
Figure 2. The relationship of bull elk age and its main beam antler length from 2008 Unit Group 111, - 115, 221, 222 harvested bulls. Each dot is a different bull’s age and measured main beam length.
In 2009, abundant spring and early-summer moisture brought relief from 2-1/2 years of severe drought. Elk received the benefits of increased forage quantity, nutrition and water distribution. Precipitation measured at Ely by the National Weather Service totaled 115% for 2009. Precipitation averaged 64% for the previous 2 years. Moisture totals for the critical April through June period were 121% in 2009 following 28% in 2008 and 47% in 2007. The recent drought resulted in 3 consecutive years of below-average calf recruitment. The recent winter brought above-average precipitation and over 200% of normal snowfall to the Ely area. Areas to the south received even more snow. The winter was consistently cold, resulting in 3 months of continuous snow-cover for most areas. As of mid-April 2010, water-year moisture totals stand at close to 120% in east-central Nevada. Good soil moisture and the substantial snowpack should provide continued improvements in habitat conditions in 2010. Elk habitat in White Pine County is under increasing threat from the development of renewable energy facilities and homes. It is unknown how much elk could be impacted from the disturbance, roads and other infrastructure associated with wind energy facilities, some of which are being planned for mountain-top sites located in important habitat. In addition, private parcels in prime habitat are being subdivided and sold. In 2008 a 3,000 acre chaining was completed in Unit 112. The Mule Deer Foundation is working with the Ely BLM to construct 2 water developments in that unit. Numerous additional habitat projects being planned by the land management agencies should be positive for elk. Population Status and Trend The improved conditions of 2009 occurred too late to substantially increase calf production. However, elk entered the recent winter in improved condition and were able to cope with the adverse conditions. Calf production in 2010 may approach levels that are average or above. Management will continue to focus on controlling elk numbers in some of the larger units while allowing for growth where other units have yet to reach objectives. The overall population trend should be static to slightly downward in coming years depending on harvest levels and calf recruitment rates. Bull quota
52
2008 Unit Group 111- 115, 221, 222 Bull Age vs Antler Length
60
• ••~ 50u..•• 40•••~ 30c.;;:; 20- •••~c 100~
oo 1 2 3 4 5 6 7 8 9 10 11 12 13 14 15 16
BULL AGE
• Main Beam length each Bull --Age vs Antler lengthTrendline
2008 Unit Group 111- 115, 221, 222 Bull Age vs Antler Length
60
VIQ,I
.s:. 50ul:
,S: 40EraQ,I
l:Q 30l:'iii~ 201;; •Q,Itlll
10l:0
...J
oo 1 2 3 4 5 6 7 8 9 10 11 12 13 14 15 16
BULLAGE
• Main Beam Length each Bull -- Age vs Antler Length Trendline
ELK
recommendations for 2010 hunts may be slightly lower than last year. Quota recommendations for antlerless elk will increase. Based on the latest information, the 2010 population estimate is 8% higher than the 2009 estimate. Unit 121 and portion of Units 104 and 108: Cherry Creek, North Egan, Butte and Medicine Ranges; Northern White Pine County Report by: Russell Woolstenhulme Survey Data No specific surveys were conducted for this unit. However, incidental to post-season helicopter deer surveys a total of 108 elk was classified resulting in ratios of 27 bulls:100 cows:33 calves. Habitat Precipitation for Unit 121 was significant during the spring of 2009 leading to excellent summer range conditions. Precipitation for the winter of 2009-2010 was slightly above average in Area 12. Small fires north of Piscevich Summit, within the Cove and near Augustine Springs, as well as vegetation modification in Smith Valley in the Egan Range could provide some quality elk habitat in the next few years. Following horse round-ups that were conducted in the Cherry Creek Range and Butte Valley during the summer of 2006, habitat appeared to be improving. However, horse numbers seem to be increasing rapidly and range conditions in much of the hunt unit is in poor condition. Population Status and Trend This elk herd is believed to have realized steady population increases over the last couple of years. If annual precipitation continues to be at normal or above normal, the herd has the potential to advance towards the population objective. An antlerless elk season will be considered in the near future to more intensely manage the herd as it approaches that population objective. Bull tag quota recommendations are expected to remain similar to last year.
Units 131,132: White Pine, Grant and Quinn Canyon Ranges; Southern White Pine and Eastern Nye Counties Report by: Mike Podborny Survey Data A helicopter post-season herd composition survey was conducted in February 2010. The survey conditions were fair with good snow cover, calm winds but a cloudy sky. There were additional elk classified during the spring deer survey in March for a total sample of 118 elk; yielding ratios of 60 bulls:100 cows:43 calves. The previous survey in 2009 yielded ratios of 54 bulls:100 cows:26 calves. Following the record sample of 207 elk in 2009, a more abbreviated survey in 2010 resulted in a smaller sample size and no elk classified in Unit 132. In addition, portions of Unit 131 were also not surveyed. Elk were classified in Unit 108 just north of Highway 50 and included in the sample since recent telemetry follow-up data indicate these elk cross between Units 131 and 108 regularly throughout the year. Habitat There have been 7 water developments built for big game in the White Pine and Horse Range in the last 10 years with 2 projects completed in 2009. These projects have been built with volunteer labor from sportsmen working with the Forest Service and with funding from RMEF and NDOW. Elk, deer and other wildlife have been documented using these projects. Ongoing fencing projects in the Grant Range and White Pine Range were designed to protect spring sources from all ungulate grazers and reduce impacts to range fences from elk. A water development project has been planned near the Robinson
53
ELK
Mine in an attempt to attract elk away from mining activity. This is a cooperative project between the Robinson Mine, BLM, NDOW, RMEF and local sportsman with funding from the Wildlife Heritage Account. There is a tremendous opportunity to improve habitat for elk and other wildlife through vegetation projects in the extensive pinion-juniper forests that exist throughout both of these units. Population Status and Trend The increase of antlerless elk harvest from 9 in 2008 to 21 in the 2009 along with the bull harvest negated some of the potential increase in the population that would have resulted from the high calf recruitment documented this year. This resulted in only a slight increase in the population estimate from 300 elk in 2009 to 310 elk this year. The 2010 antlerless quota recommendations will be designed to keep the population within the objective level identified in the White Pine County Elk Management Plan(300 elk + or - 20%). Five adult cow elk were captured and radio collared in January 2009 along Highway 50. Three of these collars are scheduled to fall off in May 2010. The data from these collars will be used to make future management recommendations regarding elk in Units 131 and 108. Units 161 - 164: North-Central Nye and Southern Lander and Eureka Counties Report by: Tom Donham Survey Data During late January 2010, an aerial composition survey was conducted in Management Area 16, Units 162 and 163. Favorable weather and ground conditions resulted in the most successful elk survey conducted in this area of central Nevada in the past few years. Although survey conditions were very conducive to finding cow/calf groups in the valleys, the same conditions had pushed bull groups out of their usual higher elevation haunts into thick tree cover, which made them difficult to locate. Due to the difficulty of locating bull groups, the observed bull/cow ratio is considered biased low. During the survey, a record total of 488 elk was classified as 319 cows, 95 calves, and 74 bulls. Cow/calf ratios remain below average despite improved conditions, which resulted in increased deer production. The previous survey took place in January 2009 when a total of 362 elk was observed. The 2009 sample included 59 bulls, 247 cows, and 56 calves. The observed ratio of 23 calves:100 cows obtained during the 2009 survey represented a record low production level. Habitat Over the past several years, the USFS has been actively conducting prescribed burns in the Monitor Range, Unit 162. Burns have taken place in the Elkhorn Canyon area on the south end of the Monitors, and in the Seven Mile/Savory area on the north end of the Monitors. Over 6,000 acres have been burned in the Elkhorn Canyon/House Canyon area (some of this total acreage was due to a prescribed burn getting out of control), and over 2,000 acres have been burned in the Seven Mile/Savory area, to date. These burns are intended to reduce pinion and juniper encroachment into sagebrush habitats. These burns are expected to benefit not only elk, but also sage grouse, many other species of wildlife, and domestic livestock. Additional pinion and juniper reduction projects in the Austin/Tonopah Ranger District are currently in the planning process. Population Status and Trend The Unit 162 elk population is the result of a release of 50 elk into the Monitor Range in January 1979. Following the 1979 release, the population increased steadily, and the inaugural elk hunt in Unit 162 took place in 1984. From 1984 to 2000, tag quotas remained conservative in order to allow the population to expand. Once the herd reached population objectives, tag quotas were increased in order to stabilize herd growth. At about this same time, the Nevada Board of Wildlife Commissioners asked the Nye County Advisory Board to Manage Wildlife to take the lead in creating an elk sub-plan covering all of central Nevada in accordance with the Nevada Elk Species Management Plan. Following a long and arduous process, the plan was completed and approved by the Commission in January 2004.
54
ELK
The CNEP provides management direction for Management Areas 16, 17, 21, and 25. During the planning process new population objectives were set in place, allowing for growth in the Management Area 16 elk population. During the 2004-05 elk season, reductions in tag quotas reflected this change in harvest strategy. As the population moves towards the new objective, the NDOW will likely increase tag quotas in order to control and keep up with growth of the population. The majority of the Management Area 16 elk population continues to occupy the Monitor Range, Unit 162. The population in Unit 162 consists of 2 core herds. The Table Mountain herd, which is the larger of the 2 herds, spends much of the year within the Table Mountain Wilderness, and winters in the southern half of the Monitor range. The Butler/Willow herd spends much of the year in the Butler Basin/Willow Creek area and winters in the northern portion of the Monitor Range. In recent years, a small herd has established itself in Unit 163 in the Hot Creek Range, and observations of both bulls and cows have become more common in the Toquima Range, Unit 161. Elk movement from Management Area 16 into Management Area 17 to the west has also resulted in an established herd there. In December 2007, 5 cow elk were fitted with radio collars in Unit 173 in order to determine seasonal use areas and movement patterns of this newly established herd. Due to reduced production rates experienced since 2008 as well as increased antlerless harvest, the Management Area 16 elk herd is presently exhibiting a stable trend. Unit 231: Wilson Creek Range; Lincoln County Report by: Mike Scott Survey Data Aerial surveys were conducted during January 2010 and resulted in the classification of 287 elk consisting of 107 bulls, 118 cows, and 62 calves. These totals result in a ratio of 91 bulls:100 cows:53 calves. Of the 107 bulls observed, 48% were classified as spikes to 4-points. Heavy snow conditions existed through much of the traditional elk wintering areas and elk were found using areas where they haven’t been observed in previous years. Reports from Wildlife Services indicate high numbers of elk may have moved across the border into Utah to spend the winter. Habitat The list of threats to elk habitat is long in Area 23. BLM has failed to keep feral horses anywhere near AML. Feral horses have degraded traditional areas that elk have used for many years and elk have been forced to utilize other areas, including private lands, which results in increased depredation damages, increased time spent on depredation issues, and less elk tags available for sportsmen. Wind energy proponents continue to target Area 23 for a wind energy project despite the protests of sportsmen, wildlife enthusiasts, county commissioners, and the general public. All comments point to the fact that people support wind energy but not in this particular area. In other words, wind energy facilities should not be located in important wildlife habitat areas. To date, BLM continues to ignore the residents of Lincoln County in this matter, and even appear to be pushing the project. Large areas of degraded pinyon-juniper habitat still exist in Area 23, with little or no understory or forage for elk. BLM continues to suppress wildfires in these areas although these areas greatly benefit elk in the years after they burn. BLM did however clear several sites for elk guzzlers in various areas in Area 23. NDOW plans to build 2 projects in the Prohibition area in May of 2010. Despite all the threats to elk habitat in Area 23, the habitat conditions were poor in 2009 following a dry spring but improved to good because of decent summer and fall precipitation. Heavy snows during the winter of 2009-10 should result in very good habitat conditions in the spring of 2010.
55
ELK
Population Status and Trend A total of 225 elk was harvested in Area 23 during the 2009 season. These included 143 cows and calves and 82 bulls. This represents the highest recorded harvest in Area 23. The number of elk in Area 23 remains fairly high despite the high harvest numbers. A total of 572 elk tags was available for all seasons in Area 23. This area is likely the destination for emigrating elk from adjacent areas. Wilderness areas provide elk with places to avoid heavy hunting pressure. The population objective for Area 23 remains at 350, which was agreed to in the Lincoln County Elk Management Plan. The quotas recommended will reflect NDOW’s goal to keep elk numbers near the objective. Unit 241-242: Delamar and Clover Mountains; Lincoln County Report by: Mike Scott Survey Data Surveys were conducted during January 2010, but did not result in any elk being observed. The seasonal use areas are largely unknown at this time. NDOW still plans to attach radio-telemetry collars to elk to identify seasonal use areas and assist with population estimates. Habitat Habitat appears to be suitable for elk across broad acreages in Area 24. Fires have opened up large areas of PJ that elk tend to favor. Feral horses are still found in high numbers despite BLM’s decision to reduce the AML in this area to zero. Elk are commonly observed using private lands during the summer months, but become difficult to find during the other times of year. NDOW assisted BLM with 2 fire rehabilitation projects in the Clover Mountains in 2010. BLM has also cleared several additional wildlife water development sites that may eventually benefit elk. Population Status and Trend Return card data indicate that 2 cows and 3 bulls were harvested from Area 24 in 2009. Reports and sightings indicate that there may be up to 60 elk in the area during the summer months. Unit 262: Spring Mountains; Clark and Southern Nye Counties Report by: Patrick Cummings Survey Data In December 2009, a 3.7-hour aerial survey conducted in the Spring Mountains yielded a sample of 62 elk. The survey sample was comprised of 6 bulls, 40 cows and 16 calves. As in past years, the aerial survey was focused in the area around the Cold Creek Community. Elk were encountered on the north side of Willow Peak, in the Willow Creek Drainage and near Trough Spring. No elk were encountered on the McFarland Burn. Habitat Severely degraded vegetative conditions on the McFarland Burn were noted in 8 aerial surveys conducted between 2002 and 2009, and likely the reason fewer elk have been encountered in the area. Degraded habitat is largely the result of an over population of feral horses superimposed on effects of drought conditions.
56
ELK
57
In December 2005, the Las Vegas District, Bureau of Land Management (BLM) issued a Decision Record and Finding of No Significant Impact for establishment of Appropriate Management Levels (AML) in the Johnnie, Muddy Mountains, and Wheeler Pass Herd Management Areas (HMA). The established AMLs for horses in the Johnnie HMA and Wheeler Pass HMA are 0 and 47-66, respectively. The established AMLs for burros in the Johnnie HMA and Wheeler Pass HMA are 54-108 and 20-35, respectively. In January 2007, BLM and United States Forest Service (USFS) conducted gathers of feral horses and burros in the Johnnie HMA and Wheeler Pass HMA. Through these efforts, 368 horses and 400 burros were captured. In the Wheeler Pass HMA, of the 289 horses gathered 240 were removed and 45 were released back into the Spring Mountains. BLM has indicated 61 horses were left in the Wheeler Pass HMA. Thirty-seven burros captured in the Wheeler Pass HMA were removed, resulting in an estimated 30-45 burros remaining in the HMA. In the Johnnie HMA, of the 79 horses captured 49 were removed and 30 were released back into the Spring Mountains. BLM has indicated 41 horses were left in the Johnnie HMA. All of the 363 burros gathered in the Johnnie HMA were removed, resulting in an estimated 75-110 burros remaining in the HMA. In an inter agency coordination meeting held on 13 March 2008, the BLM horse specialist in the Las Vegas District indicated horse numbers were well above AML in Johnnie HMA and Wheeler Pass HMA, and that the next gather will not occur for another 5 years. Evidence of elk avoidance of roads and decrease in habitat use adjacent to roads is abundant in literature. Moreover, avoidance behavior becomes exacerbated in roaded areas adjacent to openings (burns) and meadows. Based on well-documented findings, another factor that has influenced elk distribution has been increased off-highway vehicle (OHV) use. In recent years, recreational use of OHVs in the Cold Creek area and on the McFarland Burn has increased substantially. In June 2004, the Humbolt-Toiyabe National Forest issued a Decision Notice and Finding of No Significant Impact for Spring Mountains National Recreation Area Motorized Trails Designation Project. The decision to implement alternative 5 (with modifications) as summarized in the respective Environmental Assessment involves minimal closure of newly established roads on the McFarland Burn. Thus, the recently authorized management prescription for motorized trails ensures the status quo on the McFarland Burn for the near future. Population Status and Trend The population estimate for elk inhabiting the Spring Mountains is 130, and approximates the estimate reported last year. Elk habitat quality throughout most of Unit 262 is marginal. Elk have existed on a low nutritional plane limiting reproduction and recruitment. Calf recruitment in recent years has been below levels necessary to maintain the population. Formerly, under ideal conditions marked by lower horse numbers and normal precipitation receipts, the McFarland Burn afforded early seral, quality forage necessary for maintenance, growth, and reproduction. In the near future, meaningful efforts to improve elk habitat must entail management of horse and burro numbers consistent with AMLs and completion of habitat improvements. Elk habitat in the Spring Mountains can be enhanced through seeding areas recently burned, increasing water availability and decommissioning/restoring newly created roads and trails. As of this writing in April 2010, environmental conditions are greatly improved due to the several fall and winter storm systems that occurred over nearly a 4-month period from December 2009 through early March 2010. In its seasonal outlook, the National Weather Service has not identified the likely development of drought conditions during the period April 1, 2010 through June 2010.
DESERT BIGHORN
DESERT BIGHORN SHEEP Units 044, 182: East and Stillwater Ranges; Pershing and Churchill Counties Report by: Jason Salisbury Survey Data An aerial desert bighorn sheep composition survey was conducted during the fall of 2009 and yielded a total of 95 sheep. The resulting ratio was 52 rams:100 ewes:38 lambs. The lamb ratio of 38 lambs:100 ewes observed in 2009 should result in a slight increase in the population. Habitat Increased late winter precipitation provide for minor improvement in native shrubs and perennial bunch grasses. Large groups of feral horses on the west central side of the Stillwater Range need to be removed to allow further expansion of bighorn into that area. Pinyon and juniper encroachment is a major concern within the Stillwater Mountain Range. In areas deemed appropriate lighting caused fire should be left to burn naturally to allow for the reestablishment of brush and browse species. Population Status and Trend On November 3, 2009, 25 desert bighorn sheep were captured from the Silver Peak Range, Esmeralda County with in Unit 211S. Captured bighorns were released into the base of Shirttail Canyon, on the south west side of the Stillwater Range, Churchill County, within Unit 182. The release complement was composed of 21 adult ewes, 1 female lamb and 3 ram lambs. Each bighorn was marked with an orange ear tag. Additionally, 2 ewes were fitted with Sirtrack GPS/VHF collars and 3 ewes were collared with ATS VHF/drop off store on board GPS collars to aid in monitoring. The initial release of desert bighorns into the Stillwater Range occurred in 1981. Augmentations have occurred in 1982, 1984, 1985-1987 and 1989. Prior to this augmentation a total of 100 bighorn sheep have been released on the eastern side of the Stillwater Range have 100 animals. The 2009 augmentation of 25 bighorns is the first release effort into the western side of the Stillwater Range and is intended to establish a sub-population on the southern most extent of the Stillwater Mountain Range. Initial satellite collar data suggests bighorn have dispersed to both the east and west side of the Stillwater Mountain range. Data obtained from these collars suggests that bighorns utilizing the east face of the Stillwater’s move toward the release site on the west face from time to time. Future monitoring will occur to determine the home range use areas of the newly released complement of sheep. The Stillwater bighorn sheep herd is considered to have a stable population trend. This year’s lamb recruitment will allow for maintenance level recruitment. The population within the Stillwater Mountain Range experiences increases in lamb production when forage conditions are optimal. Unit 045: Tobin Range; Pershing County Report by: Kyle Neill Harvest Results One tag was issued for the inaugural bighorn sheep hunt in Unit 045 and resulted in the harvest of a 7 year old ram in Cottonwood Canyon on opening day. Survey Data In mid-September 2009, ground bighorn composition surveys were conducted for 2 days in conjunction
58
DESERT BIGHORN
with telemetry surveys on animals released in 2008. A total of 50 bighorns was classified as 13 rams, 23 ewes and 14 lambs that resulted in a composition ratio of 57 rams:100 ewes:61 lambs. Survey timing occurred during desert bighorn rutting activity; A period when rams are with ewes and afford maximum detection. Areas examined were Cottonwood Canyon south to Miller Basin. Population Estimate and Trend
Desert bighorn sheep were first released into Unit 045, Tobin Range in 1984. This re-establishment effort consisted of 34 bighorns from the River Mountains that were released into Miller Basin. In 1991, an augmentation of 18 bighorns from the Black Mountains was released into Indian Canyon. For a multitude of reasons, bighorns failed to establish themselves in the Tobin Range. However, 23 bighorns from the Toquima Range, Unit 161 were released into Golconda Canyon in 2003. Additionally, an augmentation of 22 bighorns from the Toquima Range was released into Golconda Canyon in 2008. Follow up telemetry surveys and sightings from releases made in 2003 and 2008 have indicated that some bighorns had moved into the Mount Moses area, Unit 151(14 bighorns were observed in the fall of 2009 and 12 were encountered in 2008). Composition surveys and sightings from 2004 through 2010 imply that the majority of the released bighorns have stayed in the Tobin Range and prospered. Furthermore, post-release mountain lion control conducted by APHIS/Wildlife Services has occurred in this unit for the past 2 years in the late winter/early spring months. Telemetry data and observations made in the field suggest that bighorns in Unit 045 have been utilizing the area from Miller Basin north to Cherry Creek. Core use areas are around Little Miller Basin north to Cottonwood Canyon. Moreover, bighorns often use the Mount Tobin area in the summer months. Recruitment rates that have averaged 56 lambs:100 ewes over the last 5- years coupled with the 2008 augmentation have enabled this herd to grow at a rapid rate since 2003. The 2010 population estimate is 90 bighorns. Units 131 and 164: White Pine Range; Southern White Pine and Eastern Nye Counties Report by: Mike Podborny Harvest Results There were 2 6-year olds rams, 1 8-year-old ram and 1 9-year-old ram harvested in this unit group in 2009. One of the 6-year-olds was a Rocky Mountain Bighorn. Survey Data In August 2009 a helicopter survey was conducted with 70 bighorns classified; yielding sex and age ratios of 63 rams:100 ewes: 56 lambs. There were 46 classified in Unit 131 and 24 classified in Unit 164. The previous survey was conducted from the ground in January and February 2009 and resulted in 89 bighorn classified; yielding sex and age ratios of 73 rams:100 ewes:30 lambs. During both surveys the sample was obtained from 3 distinct areas including: The White Pine Range near Currant, the Duckwater Hills and the Pancake Range. Additional ground follow-up occurred in January and February 2010 to observe bighorns for any signs of distress after a disease event was documented in the Ruby and East Humboldt herds located 100+ miles to the north. Observations by several biologists over several weeks resulted in all animals appearing healthy with no coughing bighorns and good numbers of surviving lambs. This indicated no apparent disease problems were occurring in this herd. Habitat The habitat ranges from rocky ridges of low sage and bunchgrasses with few trees in the Pancake Range of Unit 164 and the Duckwater Hills of Unit 131 to steep mountains with thick tree cover of pinion pine, Utah juniper, mountain mahogany, white fir and bristlecone pine and sheer granite cliffs above 11,000 feet in the White Pine Range. Bighorns inhabit all of these habitat types. Snow at higher elevations and springs at lower elevations provide water for bighorns in some areas while water is lacking in other
59
DESERT BIGHORN
areas now occupied by bighorns. An artificial water development was built by the Forest Service and sportsman volunteers in 1989 near White Pine Peak. This guzzler is now in the Currant Mountain Wilderness and in need of repair. The Forest Service with sportsman assistance is scheduled to build a guzzler outside of the Currant Wilderness in the White Pine Range in 2010. Population Status and Trend There were 2 releases of 49 bighorns into the White Pine Range of Unit 131 since 1999. There have been no mortalities of the 7 collared bighorns from the 2007 release from Mt. Jefferson indicating a high survival rate. The 2010 population estimate is 110 bighorns, an increase from the 2009 population estimate. The high recruitment rate of 56 lambs: 100 ewes and high survival of marked bighorns account for the continued population increase. Several groups of bighorns in outlying areas are wintering in close proximity to domestic sheep. The potential for disease transmission between domestic sheep and bighorns in these areas has existed for 10 years but no disease outbreak has occurred. Five bighorns in the Duckwater Hills were captured in November 2009 with a helicopter net gun crew. Biological samples were taken from all 5 bighorns and 3 ewes were fitted with GPS/VHF collars. The collared ewes will be monitored to determine movement and distribution patterns and possible interaction with domestic sheep. Two rams harvested in Unit 131 since 2008 have been documented as Rocky Mountain Bighorn through DNA testing. These bighorns are believed to have moved south from the Ruby Mountains. There are other rams in the population that also appear to have Rocky Mountain Bighorn characteristics. Rams harvested from these units will only be accepted into official record books as Rocky Mountain Bighorns because of the mixing of sub-species that has occurred. Unit 132: Grant Range; Eastern Nye County Report by: Mike Podborny Harvest Results Desert Bighorn Sheep have resided as a naturally occurring population in the Grant Range with the earliest reports from the 1940’s.The population has experienced several highs and lows since these early reports. The hunting season for bighorn sheep in Unit 132 was closed from 1968 through 1985. The season was open from 1986 to 1997 with 17 rams harvested out of 21 tags issued for 81% success. The season has been closed since 1998 because of a decline in the population to low levels. Subsequently there have been 2 releases of bighorns into the Grant Range since 2005. The first release of 26 bighorns from the Gabbs Valley Range, Monte Cristo Range and Toiyabe Range occurred in November 2005 and was partially successful in increasing the herd. Half of the collared bighorns died in the first 2 weeks after being released. Capture stress was believed to be the cause of death as it was determined that predation was not a factor. Additionally 2 bighorns from this release traveled west across Railroad Valley to the Pancake Range. The second release occurred in December 2006 and January 2007 with a total of 22 bighorns from Mt. Jefferson. This release was very successful with all released bighorns staying in the Grant Range and the first mortalities not occurring until 3 years after the release. The cause of death of 3 collared ewes that died in the fall of 2009 could not be determined but all 3 were over 10–years-old at the time of death. Survey Data In addition to ground and fixed-wing telemetry surveys there was a helicopter composition survey conducted in August 2009 with 77 bighorns classified; yielding ratios of 34 rams:100 ewes:53 lambs. Bighorns were classified from 6,200 feet in elevation in Irwin Canyon to 11,000 feet in upper Scofield Canyon. Additional observations occurred in February 2010 from the ground to look for any signs of disease after the large scale disease event began in the Ruby and East Humboldt herds. A group of over 20 bighorns with many lambs was observed for over an hour with no coughing or other signs of distress indicating no apparent disease issues existed.
60
DESERT BIGHORN
Habitat The majority of bighorns live on the west side of the Grant Range from Irwin Canyon to Little Meadows Creek. Some bighorns reside in the lower rocky ridges while others spend the summer and fall months in the high timbered ridges and sheer cliffs near Troy Peak. There have been several small fires in the mid to upper elevations of the range that have been beneficial to bighorns by opening up some of the heavy tree cover. There is permanent water in Irwin Canyon, Troy Canyon and Little Meadows Creek. Population Status and Trend The population has expanded in size and distribution since the 2 releases in Troy Canyon in 2005. The population is mostly comprised of younger age class animals but there are a limited number of older age class rams available for harvest. Unit 133, 245: Pahranagat and Mount Irish Ranges; Lincoln County Report by: Mike Scott Survey Data No surveys were conducted during the reporting period. The previous survey was conducted in August 2008 and resulted in a total of 52 sheep observed, consisting of 17 rams, 24 ewes, and 11 lambs which provides a ratio of 70 rams : 100 ewes : 46 lambs. Population Status, and Trend This population has appeared to be on a very modest upward trend. The computer-generated populations estimate is slightly increased over the 2009 estimate. Unit 134: Pancake Range; Nye County Report by: Tom Donham Survey Data An aerial composition survey was conducted in Unit 134 in September 2009. During the survey, a total of 203 desert sheep was classified as 66 rams, 103 ewes, and 34 lambs. Animals were found well distributed throughout the unit. The previous survey was conducted in September 2007, when a total of 176 sheep was observed including 42 rams, 98 ewes, and 36 lambs. The next survey is scheduled to take place during the fall of 2011. Population Status and Trend Nearly 30 years ago, 26 desert sheep were released in Unit 134 in an attempt to reestablish a viable population in the Palisade Mesa area of central Nevada. The reintroduction effort was so successful that the Unit 134 sheep population has been used as a source of transplant stock on 3 different occasions. Trapping and transplanting operations conducted in 1996, 1998, and 2003 resulted in the translocation of 78 animals into other mountain ranges of the state. Beginning in 2003, the Unit 134 sheep population began to experience below average lamb production rates, which resulted in a decreasing trend for the herd. Severe drought conditions in addition to relatively high sheep densities are believed to be the major factors contributing to the decline. More recently, production rates have increased due to more favorable climatic conditions, and the herd appears to be stable at a moderate population level. The population model for Unit 134 estimates the same number of adults as last year.
61
DESERT BIGHORN
Unit 161: Toquima Range; Northern Nye County Report by: Tom Donham Survey Data No aerial composition survey was conducted in Unit 161 during the 2009 survey period. The next composition survey is scheduled to take place during the fall of 2010. The previous survey flight was conducted during early October 2008. A total of 244 sheep was observed in the Mount Jefferson area including 75 rams, 120 ewes, and 49 lambs. A comparatively small amount of time was spent flying the more rugged, precipitous terrain around the perimeter of Mount Jefferson, which is believed to have resulted in the somewhat low observed ram ratio. Although lamb production and recruitment levels have remained fair to good for this herd, recent drought conditions have impacted forage conditions even at high elevations. During both the 2007 and the 2008 surveys, sheep were observed to be more widely scattered and in smaller groups than is typically the case on Jefferson due to reduced forage quality and quantity. Population Status and Trend The Unit 161 desert sheep population is a direct result of a reintroduction effort initiated in 1982, with the release of 22 desert sheep. In 1983, an additional 4 animals were released. The population level of this desert sheep population has surpassed earlier predictions by a large margin. The population has fared so well in fact, that it has served as a source of transplant stock on 5 occasions. A combined total of 123 sheep has been captured and relocated during trapping operations occurring in 2002, 2003, 2006, 2007, and most recently in 2008. Animals from Mount Jefferson have been relocated to the Clan Alpine and Tobin Ranges of Churchill and Pershing Counties, respectively, and to the Grant/Quinn and southern White Pine Ranges of Nye County. The vast majority of the Unit 161 herd inhabits the Mount Jefferson area within and around the Alta Toquima Wilderness. A smaller herd has recently established itself north of the main herd in the Northumberland area. Although the core herd experienced lowered production rates from 2003 – 2006, production still remained high enough to have resulted in some growth of the population. The trapping operations that have taken place in Unit 161 over the past several years have been designed to maintain the herd at current levels due to concern over very high densities of animals occupying summer habitats. The Unit 161 desert sheep population is currently exhibiting a stable to slightly increasing trend. The population model for Unit 161 predicts the same number of adult animals as last year. Units 162, 163: Monitor and Hot Creek Ranges; Nye County Report by: Tom Donham Survey Data No composition flight was conducted during the 2009 survey period. The next composition survey is scheduled to take place during the fall of 2010. The previous composition survey was conducted during early October 2008 when a record total of 110 desert sheep was classified as 24 rams, 69 ewes, and 17 lambs. Population Status and Trend The Unit 163 desert sheep population is the result of the NDOW’s Big Game Trapping and Transplanting Program. Sheep releases took place in the Hot Creek Range in 1994 and 1995. Following the releases, the herd quickly established itself and increased to moderate levels. Beginning in 2001, the Hot Creek herd began a decreasing trend due to drought conditions. This trend continued until 2005, when a boost in production stabilized the population. Despite challenging conditions experienced most years
62
DESERT BIGHORN
since then, the Unit 163 sheep population has managed to show a stable to slightly increasing trend in the face of below average production and recruitment rates. In order to take advantage of an increasing number of sheep inhabiting the southern portion of the Monitor Range, Unit 162 was combined with the Unit 163 desert sheep hunt in 2005. While the population in Unit 162 is not considered robust enough to warrant its own hunt, potential exists for some limited harvest in the hunt unit. The population model for Unit 163 shows a slight increase over 2009. A population model for Unit 162 has yet to be developed. Unit 173: Toiyabe Range; Northern Nye County Report by: Tom Donham Survey Data No aerial composition survey was conducted in Unit 173 during the 2009 survey period. The most recent aerial survey was conducted during early October 2008. During the 2008 survey a total of 86 sheep was classified as 17 rams, 54 ewes, and 15 lambs. The 2008 survey took place from Peavine Canyon on the south end of the Toiyabe Range to the Twin Rivers area. Population Status and Trend The Unit 173 desert sheep population is 1 of several remnant sheep herds that exist in central Nevada. The Toiyabe herd was reduced to an estimated 50 animals by the early 1980’s due to human impacts. NDOW released a total of 21 desert sheep from southern Nevada during the years 1983 and 1984 as well as an additional 9 rams in 1993. The releases were intended to augment and stimulate the remaining herd. In 1988, the desert sheep hunting season, which had been closed since 1969, was reopened. In 2005, a total of 12 sheep was captured from the Seyler Peak area due to concerns over increasing private land depredation problems as well as increasing densities. The animals captured from the Seyler Peak area were combined with animals captured from the Monte Cristo and Gabbs Valley Ranges to be released in the Grant/Quinn Range in eastern Nye County. The majority of the Unit 173 herd, as well as the highest densities of animals, occurs in the southern portion of the Toiyabe Range in the Peavine Canyon, Seyler Peak area. During the past decade, the number of desert sheep depredating private agricultural areas in the Peavine Canyon area has steadily increased. While the number of sheep occupying the area has remained relatively stable, the increasing frequency of drought conditions has encouraged sheep to use the moister and lusher areas of private lands in the valley bottom. This behavior has been passed along to several successive generations of sheep at this point, and the problem is likely to continue even if climatic conditions return to more favorable patterns. Although sheep do occur throughout the Toiyabe Mountain Range, expansion of the population in the more northern reaches of the area will not be encouraged until domestic sheep grazing is discontinued in the Kingston/Big Creek area. Although reduced production and recruitment rates experienced over the past several years have impacted the herd. Improved conditions in 2009 have allowed for a slight increase in the population. The computer population model predicts a few more adult animals than 2009.
63
DESERT BIGHORN
Unit 181: Fairview Peak, Slate Mountain, and Sand Springs Range; Churchill County Report by: Jason Salisbury Survey Data Aerial surveys occurred in August of 2009 and resulted in the classification of 130 bighorn sheep. This resulted in a calculated lamb ratio of 38 lambs:100 ewes and a ram ratio of 66 rams:100 ewes. Areas surveyed include the Sand Springs, Fairview and Slate Mountain Ranges. Habitat Throughout Unit 181 water availability is limited. In the summer of 2010 a large capacity water development will be constructed on Navy land within the Bravo 17 bombing range. This water development will secure adequate water for the future growth of the bighorn herd occupying the Fairview area. Future needs for the sustainability of the Unit 181 herd includes the building of at least 2 water developments in the Sand Springs Range and 1 unit within the Monte Cristo Mountains. Population Status and Trend Aerial surveys are conducted during the late summer months to take advantage of bighorns concentrating near water sources. This year’s survey was conducted after a major storm event. This increase in moisture allowed bighorns to disperse making it harder to locate animals. The bighorn sheep population in Unit 181 was established in 1996 and has experienced accelerated population growth up until the 2007 disease event that occurred on Fairview and Slate Mountains. Last year’s lamb ratio of 20 lambs per 100 ewes was the lowest recorded lamb ratio since the inception of the herd. This year’s ratio of 38 lambs per 100 ewes is promising but nowhere near the highs experienced from 1996-2007. The Unit 181 bighorn herd has dynamic growth tendencies and will do well when climatic and habitat conditions are optimal. When the population fully recovers and bighorn numbers are at carrying capacity this population will have to be controlled through the trapping and transplanting program or the sport take of ewes. Older age class rams are available for harvest throughout Unit 181. The most significant number of mature rams occurs in the Sand Springs Range. Unit 183: Clan Alpine Range; Churchill County Report by: Jason Salisbury Survey Data An aerial composition survey was conducted in the Clan Alpine Range of Unit 183 during August 2009. During the Clan Alpine survey 28 rams were classified along with 42 ewes and 15 lambs for a lamb ratio of 36 lambs:100 ewes. Habitat In the spring of 2010 the Lauderback water development was upgraded with a new pipe rail fence, gutter, and drinker. These new design features replace archaic designs and will allow for easier access and functionality of the water development. Also in 2010 the Hercules water development will be rebuilt and will allow for more connectivity between the Wonder and the Horse Creek use areas. Population Status and Trend Over the long term the Clan Alpine population continues to grow and expand and is estimated at 280 animals. This year’s lamb ratio of 36 lambs:100 ewes will allow for static trend in this population. Over the last 2 years the observed lamb ratios have been the lowest on record since the inception of the herd. Drought like conditions has contributed to low lamb production and higher mortality rates. Adequate precipitation is needed to improve conditions.
64
DESERT BIGHORN
During the latter part of the 2009 hunters reported coughing sheep in portions of the Clan Alpine Range. During the month of December biologists responded by monitoring numerous areas including Chalk Mountain, Little Angel Spur, Bench Creek Spur, and Horse Creek. Out of all the observations made 1 2- year-old ram was observed coughing once or twice in an hour time frame. Because of the close proximity to 30 or more bighorns this 2-year-old ram was euthanized. Tests on this ram showed that it had an advanced case of pneumonia. According to the State veterinarian this individual would have succumbed to pneumonia within 2 weeks. Additional follow-up occurred in January but no sick or dead animals were observed. It is believed that a small number of animals may have succumbed to isolated cases of pneumonia but no known catastrophic loss was documented. An aerial follow up flight occurred in late March 2010 prior to the setting of tag quotas. A total of 91 sheep was observed during a 2.5 hour survey. The observed sex and age ratios were 72 rams and 40 lambs per 100 ewes. Areas surveyed included the Bench Creek Spur, Little Angel Spur, Lauder backs, and Horse Creek. A ground survey was also conducted in the Cow Canyon area on April 1, 2010 because it was not surveyed during the previous flight. A total of 54 bighorns was observed in 3 different groups located in the lower stretches of the Cow Canyon drainage. The observed sex and age ratios were 158 rams and 59 lambs per 100 ewes. Total number of animals observed during these surveys coupled with observations of lambs support the belief that no large scale die-off occurred during this past year. Unit 184: Desatoya Range; Churchill and Lander Counties Report by: Jason Salisbury Harvest A split season frame work was established to reduce hunter pressure and provide opportunity for the upper elevations within the Desatoya Range to be hunted prior to heavy snowfall events which have kept hunters from accessing this area in the past. Comments from hunters this past year were positive towards this split season concept. Survey Data During August 2009 aerial surveys resulted in the observation of 92 bighorn with a ratio of 79 rams:100 ewes:35 lambs. Habitat The Greyback hills water development was upgraded in the summer of 2007 with new pipe rail fence designs as well as new gutters, additional apron, and a new drinker. The Broken Hills water development was built in the south-western portion of Unit 184 in 2007. This water development provides a water source at the southern most end of Unit 184 and should enable bighorn to occupy habitat surrounding the water development as well as encourage sheep movement between the Greyback Hills, Broken Hills, and the Monte Cristo Range. Population Status and Trend Lamb recruitment in this population has averaged between 40 and 63 lambs:100 ewes since 1998. The past 5-year average lamb ratio is 52 lambs:100ewes. The 2009 desert bighorn sheep population estimate for the Unit 184 herd is 200 animals and reflects a 5% increase relative to 190 animals reported last year.
65
DESERT BIGHORN
Unit 202: Wassuk Range; Mineral County Report by: Jason Salisbury Harvest An early October season structure was adopted for the Unit 202 hunt. This season structure was needed to allow hunters the ability to locate desert bighorn sheep closer to water resources. Because of the topography and woodland landscape hunters have had difficulty in the past locating mature rams for harvest. Because of this early time structure 2009 hunters were able to locate some older age class rams for harvest. Survey Data A ground survey was conducted in late October of 2009. The survey resulted in an observation of 40 bighorn sheep with a ratio of 43 rams:100 ewes: 48 lambs. Areas surveyed included the Cliffs and Dry Creek. Population Status and Trend The Unit 202 bighorn sheep herd is doing well. The 2007 augmentation of 28 bighorns has helped strengthen this herd. Last year’s lamb ratio of 70 lambs:100 ewes as well as this year’s lamb ratio of 48 lambs:100 ewes are well above maintenance level recruitment and will provide for an increasing population trend. It is believed at this time that there may be some movement of rams from Unit 204 to Unit 202. New observations of older age class rams with different horn characteristics have been recently observed. The outlook for the Unit 202 herd is excellent. Favorable habitat conditions have resulted in increased lamb production which will provide for increases in this herd. Recent reports from Hawthorne Ammunition Depot personnel indicate bighorn have been utilizing certain portions of the upper elevations of Mount Grant itself. Hopefully continued use will occur and a resident group of bighorn will utilize the upper elevations of Mount Grant where forage and water are abundant. Unit 204: Pine Grove Range; Lyon County Report by: Jason Salisbury Survey Data In August of 2009 an aerial survey yielded a sample of 31 bighorn sheep. The composition ratio consisted of 13 rams:100 ewes:17 lambs. This survey was conducted after a large rain event and it is thought that this event may have dispersed animals resulting in a low survey sample. Habitat The Pine Grove and East Walker River drainages experienced dry range conditions in 2009. The recent winter of 2009-2010 has seen an increase in moisture. Population Estimates and Trend The population in the East Walker drainage is estimated at 60 animals, and approximates the population estimate derived last year. The decrease in observed lambs has contributed to be below maintenance level recruitment. This was the first year since the inception of the herd where maintenance level or above was not observed. Biologists believe that there is some emigration from Unit 204 into Unit 202 due to the units close proximity to each other. It is also thought that the
66
DESERT BIGHORN
bighorn habitat in Unit 204 is relatively small in geographic size, which may have contributed to the dispersal of bighorns into the adjacent Wassuk Mountain Range. Unit 205: Gabbs Valley Range, Gillis Range, Pilot Mountains; Eastern Mineral County Report by: Jason Salisbury Survey Data Aerial surveys were conducted in August 2009 and resulted in a total of 106 sheep observed. These included 26 rams, 52 ewes, and 28 lambs which results in a ratio of 50 rams:100 ewes:54 lambs. Areas surveyed include the Gillis Range, Pilot Mountain, and Gabbs Valley Range. This year’s sample size of 106 animals was lower than previous years. Reasoning behind the decrease in observance of animals includes a weather event just prior to survey. This increase in available water will allow for bighorn dispersal away from traditional survey areas. Habitat Over the last several years water developments within Unit 205 have been repaired and rebuilt to meet the ever demanding needs of the bighorn sheep herd. These actions have allowed for easier use of water developments by sheep and a greater supply of available water. These upgrades on water developments have resulted in increased dispersal of bighorn sheep from traditional use areas. The former designs were adequate with the first reintroduction that occurred in the early 1990’s, but with a increase in sheep numbers new reliable water resources were needed to sustain the needs of this bighorn herd. A new water development has been approved for Unit 205 South. Currently gold exploration is occurring north of state route 336 in Unit 205 North. If significant gold deposits are discovered and capitalized upon, it may have a negative effect on bighorn use in these areas. Important use areas that will be affected include the Benton Springs area. Population Status and Trend The Area 205 herd has seen very good production rates over the past several years. This year’s lamb ratio of 54 lambs:100ewes should allow for an increase in this population. The current population estimate encompassing all of Unit 205 is 430 animals and represents a 10% increase from what was reported last year. This population will continue to show strong growth following favorable habitat conditions. The recent rebuilding of water developments are expected to allow for greater dispersal of animals in this unit. Unit 206: Excelsior Range; Mineral County Report by: Jason Salisbury Survey Data Aerial surveys were conducted in the Excelsior Mountains in August of 2009, and resulted in the classification of 46 bighorn sheep. These included 15 rams, 20 ewes, and 11 lambs which results in a ratio of 75 rams:100ewes:55lambs. Habitat Projects that have been completed in the recent past include upgrading the current Excelsior water development with new tanks, apron, gutter, and pipe rail fence design. After making the necessary adjustments to this water development, increased use has been documented. As of February 2010, 5 new water developments have been cleared by the Carson City Bureau of Land Management. These new water developments once completed will extend the distribution of sheep in this unit. The completion of these projects will help alleviate competition between burros and bighorns on natural
67
DESERT BIGHORN
occurring water sources. NDOW and the Carson City District of the BLM are working toward addressing pinyon and juniper encroachment in the Excelsior Mountain Range. The reduction of the pinyon juniper should increase forage potential for bighorn sheep as well as mule deer. Population Status and Trend The Area 206 herd is currently estimated at 90 animals which is a 13% increase over what was reported last year. Favorable habitat conditions over the past 4 years have allowed for strong lamb recruitment and continued growth. A strong cohort of older age class rams is available and will provide for sustained harvest well into the future. Unit 211: North, Monte Cristo Range; Esmeralda County Report by: Tom Donham Survey Data No aerial composition survey was conducted during the 2009 survey period. The previous aerial survey was conducted during early October 2008. During the survey, a record sample of 287 sheep was classified as 77 rams, 149 ewes, and 61 lambs. Although 2008 saw a decrease in production and recruitment rates compared to the past several years, the Monte Cristo herd continues to maintain rates somewhat above the rest of central Nevada sheep populations. Habitat A 4th water development was constructed in the Monte Cristo Range during the spring of 2005. The development is intended to augment natural water sources on the south end of the range that have been impacted by drought conditions. Another water development located on the northeast end of the Monte Cristo Range has developed leaks in the storage tanks which have rendered it unusable. Prior plans to move the location of the drinker to reduce exposure of sheep to predation had already been made. Repair or replacement of the storage tanks will take place along with the drinker relocation. Due to the availability of alternative waters relatively nearby, the project is of moderate project priority. Population Status and Trend Historically, the Monte Cristo Range is believed to have served primarily as winter range for the desert sheep populations inhabiting Lone Mountain and the Silver Peak Range. More recently, significant movement appears to have ceased between the 3 areas and each supports a relatively distinct population. Production has been very good in the Monte Cristo Range over the past several years, and the population is showing an increasing trend. Due to concerns voiced by sportsmen over perceived lion predation in the Monte Cristo Range, a heritage project consisting of monitoring 10 water sources in the area with trail cameras to document lion presence and distribution was conducted during the summer of 2009. Over a 4 month period, over 30,000 images were reviewed. A single image of a mountain lion was captured in October. Currently, it appears that the Monte Cristo Range receives incidental use by transient lions, or may serve as a small portion of a larger territory. It is obvious, based upon results of the heritage project, as well as the overall rate of increase of the herd, that lion predation is not a limiting factor at this time in the Monte Cristo Range. The population model for Unit 211N predicts a pre-hunt adult population showing a slight increase compared to 2009.
68
DESERT BIGHORN
Unit 211: South, Silver Peak Range and Volcanic Hills; Esmeralda County Report by: Tom Donham Survey Data The 2009 aerial composition survey was conducted during mid September. A record sample of 294 animals was classified as 56 rams, 177 ewes, and 61 lambs. The sample size was nearly double the maximum number of animals ever observed in Unit 211S. The previous survey was conducted during September 2007 when a sample of 148 animals was classified as 43 rams, 83 ewes, and 23 lambs. Population Status and Trend Historically, the Monte Cristo Range served as winter range for the desert sheep population inhabiting the Silver Peaks. Sheep regularly moved between the ranges as evidenced by past survey data and random observations. Today, the 2 ranges support relatively distinct herds with little movement taking place between the areas. Desert sheep primarily inhabit the Silver Peak Range and the Volcanic Hills in Unit 211S. Some incidental use occurs on the Nevada portion of the White Mountains as well, but the bulk of the White Mountain herd resides in California. The survey sample obtained during the latest survey indicates that the Unit 211S population is currently larger than previously estimated. Future surveys should indicate whether this increase in numbers was caused by immigration of animals from other areas, or if the animals were simply using areas of Unit 211S that had not been included in past surveys. Based upon latest observed numbers, the Unit 211S desert sheep population is showing an increasing trend. Unit 212: Lone Mountain; Esmeralda County Report by: Tom Donham Survey Data An aerial composition survey was conducted during mid September 2009. A sample of 161 animals was classified as 45 rams, 77 ewes, and 39 lambs. The total sample obtained during the 2009 survey was the highest since 1987. The previous aerial survey took place in 2007 when a total of 157 sheep was observed including 34 rams, 93 ewes, and 30 lambs. Population Status and Trend During the late 1800’s and early 1900’s, many desert sheep herds in central Nevada were extirpated due to human impacts. Due to the rugged and inaccessible nature of Lone Mountain, a small portion of the desert sheep population inhabiting the area escaped annihilation from unregulated hunting and mining impacts. Interestingly, during the 1920’s and 30’s, whiskey nearly accomplished what unregulated hunting and mining did not. It is well known that during the prohibition era nearly all the available water sources on Lone Mountain were used for making bootleg liquor. This severely impacted the herds’ access to water. Having survived these challenges, the Lone Mountain sheep population increased quickly once regulations protecting them were put into place. By the 1980’s it is estimated the herd had increased to over 200 animals. The population was used as transplant stock on 2 occasions in the late 1980’s. Following the 1988 capture, the herd experienced a sharp decline. By 1991 the herd was estimated to total only approximately 50 animals. Following a period during which the herd remained relatively static, the population began a slow but steady recovery, and is once again at a moderate level. Despite regularly occurring drought conditions experienced throughout central Nevada recently, the Unit 212 desert sheep population appears to be experiencing a slightly increasing trend.
69
DESERT BIGHORN
Unit 221: South Egan Range; Lincoln County Report by: Mike Scott
Survey Data
No formal surveys were conducted in the South Egans during the reporting period. Very low numbers of sheep have been observed during deer surveys. This population appears to have undergone a rapid decrease in total population. NDOW has chosen to hot hunt this 1 until a more thorough investigation can be completed showing a stable bighorn population. Habitat, Population Status, and Trend The 2009 bighorn sheep tag-holder raised alarms within NDOW by reporting a complete absence of sheep prior to the season. The individual was able to harvest a ram on the opening day of the hunt, but only saw a few sheep. Domestic sheep and goats have been reported on several occasions throughout recent years. Hopefully, an investigation will determine the sheep population is stable and the season can be re-opened soon, Existing survey data cannot provide enough information to make a reasonable population estimate. Unit 223, 241: Hiko, Pahroc, and Delamar Ranges; Lincoln County Report by: Mike Scott
Survey Data
Aerial surveys were conducted in the Hiko, Pahroc, and Delamar Ranges in August 2009 and resulted in the classification 99 sheep consisting of 14 rams, 70 ewes, and 15 lambs. This provides a ratio of 20 rams:100 ewes:21 lambs.
Habitat Several of the water developments in the Hiko Range have been repaired or upgraded in recent years. This should allow sheep better access to water during the hot summer months. Good winter precipitation should result in adequate forage conditions for sheep. Some areas of these hunt units are threatened by development, wildfires, and off-road vehicles. Bighorn distribution has changed due to rock-crawling trails and wildfires. The bulk of the habitat is still intact, however, and sheep are typically found throughout the 3 ranges in relatively low densities. Population Status and Trend The Hiko and Pahroc sheep populations appear to be stable, despite recent burns, OHV events, domestic sheep issues, and interaction with private lands. Although this population has increased and decreased over the past 2 decades, it remains relatively stable. Trail cameras show sheep use in the South Pahrocs, although they were not observed during the sheep survey. Eleven rams were captured from the River Mountains and released in the Delamar Mountains in January 2010. NDOW has been releasing sheep in the Delamar for many years in the hopes of establishing a thriving herd. Although many of the sheep have stayed in the Delamars, radio-telemetry and observations indicate that many of the released sheep have moved into adjacent ranges. Recent trail camera observations show 2 ewes in the Sheep Range that were released in the Delamars in 1997. One ewe that was released in the Delamars in 2001 was observed in the East Mormons in 2009. Sheep ear-tagged when released in the Delamars have been observed in the Hikos, East Pahranagats, and Meadow Valleys. This indicates that although the Delamar releases have met with modest success, all of the adjacent mountain ranges have also benefitted from the Delamar project. Bighorn sheep in the Delamars continue to be taken by various predators, despite the ongoing predator control project. The computer-generated population estimate for 2010 is slightly below 2009.
70
DESERT BIGHORN
Unit 243: Meadow Valley Mountains; Lincoln County Report by: Mike Scott
Survey Data
No surveys were completed during the reporting period. The most recent survey was done in August 2008 and resulted in a total of 39 sheep observed. These were classified as 8 rams, 24 ewes, and 7 lambs which results in a ratio of 33 rams:100 ewes:29 lambs. Habitat
One new water development was built in 2009 south of Tri-Canyon. This unit should be full and functional with above average moisture that fell during the winter of 2009-10. Forage conditions should be very good for sheep during the spring of 2010. There is potential that the higher amount of precipitation will allow exotic annual grasses to grow and expand which increases the potential for wildfires in an environment where fire can be devastating. Motorized access into the Meadow Valleys remains extremely limited, which may be problematic for tag-holders. Population Status and Trend
Five rams were captured from the River Mountains and released into the Meadow Valley Mountains in January 2010. Additionally, the 2008 release, combined with movement of sheep released into the Delamars that move into the Meadow Valleys, should result in an upward population trend in the Meadow Valleys. The computer-generated population estimate shows an increase over 2009. Unit 244: Arrow Canyon Range; Northern Clark County Report by: Patrick Cummings Survey Data No survey was conducted in the Arrow Canyon Range in 2009. In September 2008, a 5.1-hour aerial survey yielded a sample of 98 bighorn sheep. The observed sex and age ratios were 69 rams and 35 lambs per 100 ewes. Bighorn sheep were encountered throughout much of the interior of the Arrow Canyon Range, and within 2.25 miles of available water. No sheep were observed on northern and southern extensions of the range. Five ewes and 4 rams were encountered in the adjacent Battleship Hills. Habitat Bighorn sheep inhabiting the Arrow Canyon Range and Meadow Valley Mountains will likely be impacted by impending infrastructure construction and other influences in conjunction with and emanating from the Coyote Springs master planned community. The 42,000-acre parcel is situated northeast of the junction of U.S. 93 and State Route 168, and is the largest privately held property for development in Southern Nevada. Construction of the master planned community commenced in 2005. The Southwest Intertie Project (SWIP) corridor spans 235 miles long from north of Las Vegas to near Ely, and involves construction of a 500-kV transmission line. The new line will provide transmission access to otherwise isolated renewable energy projects in parts of northern and eastern Nevada, and will enhance reliability and efficiency between Nevada Energy’s northern and southern service areas. The transmission line will be constructed along the southwest portion of the Arrow Canyon range and cross the range approximately 1.5 miles south of the Arrow Canyon #1 water development. Population Status and Trend Severe drought conditions from 2000 through 2002 impacted the bighorn sheep population inhabiting
71
DESERT BIGHORN
the Arrow Canyon Range. Successive years of drought resulted in lowered recruitment and reduced survivorship. Improved environmental conditions brought about by above average precipitation receipts in 2003 and 2004 allowed the herd to expand. Subsequently, drought conditions prevailed in 2006 and 2007. In 2006, an aerial survey reflected 17 lambs per 100 ewes. Aerial survey data collected in 2002, 2004 and 2006 coupled with population model projections suggested the bighorn population declined. Thus in early 2008, the population estimate was reduced, and the associated hunt quota was reduced from 3 to 2 tags. However, a larger than expected survey sample later in 2008 necessitated refinement of the population model. As such, the Arrow Canyon bighorn sheep population estimate reflected a more moderate population decline and increased ram survivorship. In 2010, the population is estimated reflects reduced recruitment as result of prevailing drought conditions in 2009. Unit 252: Stonewall Mountain; Nye County Report by: Tom Donham Survey Data In late September 2009, an aerial composition survey was conducted in Unit 252 which yielded a sample of 192 animals. The sample consisted of 44 rams, 128 ewes, and 20 lambs. The observed lamb ratio represents the lowest level seen since 1997. The previous aerial survey was conducted in 2008 when a record total of 301 sheep was classified as 91 rams, 147 ewes, and 63 lambs. Both the 2008 and 2009 surveys were limited to Stonewall Mountain and a small portion of Pahute Mesa. Population Status and Trend The current desert sheep population inhabiting Stonewall Mountain is the direct result of the NDOW’s trap and transplant program. The population was reestablished through 3 transplant efforts which occurred in 1975, 1978, and 1983. The Stonewall herd quickly established itself and steadily increased in number. The population experienced a major decline in 1996 in the Stonewall Mountain area. The decline appeared to have been due to a major exodus of sheep out of the area, as opposed to a disease related die-off. The mass movement is believed to have been caused by drought conditions and excessive numbers of feral horses which severely impacted habitat conditions. Removal of feral horses has improved range conditions and the herd has returned to former levels. Sheep regularly move into and out of the Stonewall Mountain area from within the Nellis Test and Training Range (NTTR), making it very difficult to estimate population status and trend. In 2008, a record sample of 301 sheep was observed during an aerial survey. It is likely that severe drought conditions experienced during 2007 and part of 2008 caused sheep inhabiting areas deeper in the NTTR to move into the Stonewall Mountain area temporarily, where water and forage availability was better. Following a more favorable year of moisture patterns, and resultant improvements in range conditions, numbers of animals observed during the 2009 survey were back to expected levels on Stonewall Mountain. While animals continue to move into and out of the Stonewall area, it appears that there is a core population of resident animals that inhabit Stonewall Mountain. Due to very low production and recruitment levels experienced in 2009, the herd is currently experiencing a slight decline. Currently, the population model for Unit 252 includes only that portion of the sheep population that inhabits the Stonewall Mountain area on a consistent basis. The population model for Unit 252 predicts a decrease in total population.
72
DESERT BIGHORN
Unit 253: Bare Mountain and Specter Range; Southern Nye County Report by: Patrick Cummings Seasons and Hunt Quotas Separate quotas have been allotted to Bare Mountain and Specter Range since 2005. The objectives in splitting Unit 253 were to disperse harvest pressure and potentially increase hunter opportunity. Seven rams were harvested in 2009, as there was widespread interest among all recipients of Wildlife Heritage Tags and Partnership in Wildlife Tags to hunt sheep on Bare Mountain. Survey Data In late October 2009, an aerial survey on Bare Mountain yielded a sample of 174 bighorn sheep. The sample was the largest recorded and reflected sex and age ratios of 61 rams and 26 lambs per 100 ewes. No survey was conducted in the Specter Range in 2009. In early September 2008, 70 bighorn sheep were observed during a 2.8-hour aerial survey. The sample reflected sex and age ratios of 42 rams and 42 lambs per 100 ewes. Habitat Southern Nye County experienced drought conditions in 2009. Despite ample precipitation receipts during the winter of 2008-09, drought conditions prevailed through November 2009. Bighorn sheep in the Specter Range and on Bare Mountain coped with limited forage resources, and relied on free-standing water throughout much of 2009. The overall dry conditions resulted in inadequate recharge of 2 water developments on Bare Mountain. In February 2009, water development inspections revealed 3 projects on Bare Mountain were collectively charged to 64% of capacity. Although Bare #3 situated on the east side of the mountain was full, Bare #1 and #2 on the west side were charged to 48% and 44%, respectively. In May 2009, the prevailing drought conditions prompted water haul activities. In a collaborative effort, critical funding support from Fraternity of the Desert Bighorn and Nevada Bighorns Unlimited—Reno Chapter enabled payment for helicopter and fuel truck services. In the course of 26 sorties, a Nevada Division of Forestry Bell 204 UH-1 “Huey” helicopter delivered 3,100 gallons to Bare #1. Water was not hauled to Bare #2 (estimated to be storing 2,500 gallons). In filling Bare #1, it was reasoned the 3 water developments were collectively charged to approximately 75% of capacity in advance of summer. Heavy sheep use of the 3 water developments during the summer resulted in total depletion of stored water. Bare #2 was dry by late August, and the remaining 2 projects were depleted by mid September 2009. In late summer and fall 2009, bighorn water requirements were met through utilizing Specie Spring and troughs furnished by Sterling Mine general manager Chuck Stevens. In August 2009, the Bureau of Land Management (BLM) issued a Decision Record approving the Reward Mine project on Bare Mountain. The CR Reward Corporation (CRRC) will build an open pit gold mine and heap leach processing facility. CRRC holds claims on an area of approximately 2,006 acres. The project is located on the west side of Bare Mountain including and surrounding the site of the old Gold Ace Mine. The northern boundary of the project area is within one-half mile of Bare #2. In late April 2010, Fraternity of the Desert Bighorn members and NDOW personnel are scheduled to upgrade Bare #3. The improvements will include increased storage capacity and installation of a cross-leveling system that incorporates new, low-profile tanks and a new drinker. In February 2008, the Eagle Basin water development in the Specter Range was upgraded. The water storage capacity of the new, cross-leveling system was expanded from 6,900 gallons to 9,000+ gallons.
73
DESERT BIGHORN
Population Status and Trend In 2010, the population estimate for bighorn sheep inhabiting Bare Mountain is 150. The current population estimate represents a substantial increase relative to the 110 adult sheep reported last year. The apparent magnitude and suddenness of the expansion cannot be simulated in the population model. It is reasoned that much of the recent population expansion is due to ewe and ram ingress from adjacent areas administered by Department of Defense (DOD-Nellis Test and Training Range) and Department of Energy (DOE-Nevada Test Site). Ingress to Bare Mountain may be a response to prevailing drought conditions since 2007. Over the recent winter and spring, greatly improved environmental conditions may have prompted a level of sheep egress from Bare Mountain back to withdrawn federal lands. Bighorn sheep movements through the Beatty Wash—west Yucca Mountain area serve to maintain connectivity between sheep on Bare Mountain and sheep in adjacent mountains on DOD and DOE lands. The area may be characterized as hills bisected by washes. Due to relatively low topographic relief and lack of water, bighorn sheep use of the area is reasoned to be primarily seasonal (late fall/winter/spring). Although the Beatty Wash area is not high quality bighorn habitat, its value as a movement corridor should be recognized in land use planning. Last year, the Bureau of Land Management (BLM) made a land use decision that may jeopardize continued bighorn sheep use of the Beatty Wash—west Yucca Mountain area. The BLM Tonopah Field Station issued a Decision Record that approved the August 2009, TSCO Vegas to Reno Race. Prior to the race last summer, it was anticipated up to 350 motorcycles, ATVs, UTVs, high clearance SUVs, 4x4 trucks, and dune buggies would compete in the event that had been billed as the greatest long-distance, off-road event in this decade on U.S. soil. The decision to approve the race is an indication that BLM officials failed to adequately consider impacts from establishment of a new road segment through a roadless area recovering from the 2006 Beatty Fire. NDOW remains concerned the decision process failed to adequately analyze direct, indirect and cumulative impacts of the annual race and newly created thoroughfare. One of the anticipated impacts of a race course through the Beatty Burn and Beatty Wash area centers on bighorn sheep avoidance as a result of the route becoming a year-round attractant for users of recreational OHVs. In the Specter Range, events beginning at least as early as Fall 2002 suggest the population had been impacted by disease. Available evidence suggests bacterial pneumonia may have been a factor in high mortality among lambs. Recruitment in 5 consecutive years (2003-07) was negligible. In spring 2008, several observations were made of ewes with attendant lambs. Remote cameras installed at water developments in late spring and summer documented lamb survival through summer 2008. Lamb survival was further noted in the subsequent aerial survey conducted on September 5, 2008. The observed lamb to ewe ratio in the aerial survey was 42 lambs per 100 ewes. The Specter Range bighorn sheep population may no longer be on a downward trend. However, due to successive years of poor recruitment there are comparatively fewer rams in older age cohorts. In the near future, hunt quotas will need to be adjusted to account for underrepresented age cohorts. The population estimate approximates the estimate reported last year. Unit 261: Last Chance Range; Southeastern Nye County Report by: Patrick Cummings Survey Data In late October 2009, an aerial survey conducted in the Last Chance Range yielded a sample of 162 bighorn sheep. The sample was the largest recorded and reflected sex and age ratios of 54 rams and 41
74
DESERT BIGHORN
lambs per 100 ewes. Bighorn sheep were widely dispersed and were encountered on all major ridges and mountains that comprise the Last Chance Range. No aerial surveys were conducted in Unit 261 in 2007 and 2008. In October 2006, an aerial survey yielded a sample of 133 bighorn sheep. The observed sex and age ratios were 58 rams and 22 lambs per 100 ewes. Habitat Southern Nye County experienced drought conditions in 2009; however, bighorn sheep in the Last Chance Range fared well. Unlike other areas in southern Nye county and Clark County, the Last Chance Range may have intercepted midsummer monsoonal activity based on recorded precipitation amounts (unofficial) at Hidden Hills Airport in Pahrump Valley. In 2006 and early 2007, overall dry conditions resulted in inadequate recharge of several water developments in the Last Chance Range. In early March 2007, water development inspections revealed 7 projects were collectively charged to 45%. In May and June 2007, the prevailing drought conditions prompted water haul activities. In a collaborative effort, critical funding support from Fraternity of the Desert Bighorn, Nevada Bighorns Unlimited—Reno Chapter and Foundation for North American Wild Sheep enabled payment for contract helicopter services. In the course of 107 sorties, a helicopter delivered nearly 8,000 gallons to 2 water developments. In 2003, bighorn sheep habitat improvements entailed construction of a 7th water development, and upgrade of an existing unit. The new water development is situated on the prominent ridge north of Pahrump. On the north end of the range, the upgrade of a unit involved added water storage capacity and installation of a steel apron. A consequence of the expanding human population in the Pahrump Valley is habitat degradation resulting from dispersed recreational use of off-highway-vehicles (OHV), and in the recent past, permitted OHV races. Population Status and Trend In the Last Chance Range, the 2010 bighorn sheep population estimate is 170, and reflects a sharp increase relative to 120 reported last year. The higher than expected population estimate is consistent with recent aerial survey sample size and gender and age classifications. In that the apparent scale and abruptness of the expansion could not be simulated in the population model, it was postulated that there was ingress of ewes and older age-class rams from adjacent ranges. Nearby areas from which sheep may have originated include: Nopah Range, Resting Spring Range, Funeral Mountains and Spring Mountains. In October 2007, 2 Pahrump residents encountered an undetermined number of bighorn carcasses at and near the Last Chance #5 water development. Based on the initial report and follow up investigation, it was believed that 10 bighorn sheep died during summer 2007. In the absence of rain, the 2 central water developments were expected to go dry in early summer 2007. It was deemed cost prohibitive to haul water to LC #5 and LC #4, and reasoned that sheep under hydration stress in the central areas would move to water developments situated to the north or south.
75
DESERT BIGHORN
Unit 262: Spring Mountains (La Madre, Red Rock and South Spring Mountains) and Bird Spring Range; Western Clark County Report by: Patrick Cummings Survey Data No aerial surveys were conducted in the Spring Mountains or Bird Spring Range. In October 2007, an aerial survey conducted south of State Route 160 from Potosi Mountain to the southern terminus of the Spring Mountains yielded a sample of 38 bighorn sheep. The sample included 18 rams, 16 ewes and 4 lambs. In October 2006, an aerial survey conducted in the La Madre Ridge and Red Rock Escarpment areas yielded a sample of 104 bighorn sheep. The observed sex and age ratios were 55 rams and 42 lambs per 100 ewes. The survey effort resulted in the largest recorded sample despite conditions of reduced observability due to reattachment of aircraft doors prior to survey in the Red Rock Escarpment. Bighorn sheep were well distributed along the prominent south ridge that defines Box Canyon. In this area, 12 groups comprised of 77 sheep were encountered within 1.7 square miles. Habitat Unit 262 tends to receive more precipitation from year to year than most other areas in Clark County. Bighorn sheep generally benefit from adequate range conditions on a consistent basis; however, due to proximity to Las Vegas, recreational pursuits (e.g., OHV and mountain bike use/proliferation of roads and trails), feral horses and burros, and suburban sprawl serve to degrade habitat. On June 22, 2005, lightning strikes in the higher elevations near Potosi Peak ignited the Goodsprings Fire. The heavy accumulation of fine fuels coupled with high winds allowed the fire to spread along ridgelines and ultimately consume vegetation across 33,484 acres. The Goodsprings Fire consumed plants within 3 vegetative associations: Creosote-Bursage Flats, Mojave Desert Scrub, and Pinyon-Juniper Woodland along a 3,940’-elevation gradient. Landmark areas within the Goodsprings Fire included: northern portion of the Bird Springs Range; eastern portion of Cottonwood Valley, northern portion of Goodsprings Valley, eastern and southern Potosi Mountain and Shenandoah Peak. Severely and extensively burned areas with little to no remaining vegetation included: northern portion of Goodsprings Valley, Double Up Mine canyon, Cave Spring canyon and Shenandoah Peak. Areas burned that contained few small mosaics of remaining vegetation included: northern portion of the Bird Spring Range, Ninety-nine Spring canyon, and areas southwest, south and east of Shenandoah Peak. In addition, vegetation associated with approximately 3 springs and numerous wash complexes were impacted by fire. Population Status and Trend North of State Route 160, bighorn sheep inhabit the Red Rock Escarpment and La Madre portions of the Spring Mountains. South of State Route 160, bighorn occur in lower densities throughout the Bird Spring Range, Potosi Mountain, Table Mountain, Little Devil Peak and Devil Peak. In recent years, several motorists traveling along U.S. 95 adjacent to the Specter Range claimed to have observed bighorn sheep south of the highway on the north end of the Spring Mountains. The reports remain unsubstantiated. In 2010, the population estimate approximates the estimate reported last year. Desert bighorn sheep in the Spring Mountains face a host of challenges with respect to habitat degradation, fragmentation and loss. In the La Madre Ridge area, human encroachment in the form of suburban sprawl and OHV use has eliminated and degraded bighorn sheep habitat. Increasingly, land management emphasis in the Red Rock area is to accommodate human recreational pursuits that are often incompatible with habitat and wildlife conservation. Future large-scale projects include upgrade
76
DESERT BIGHORN
of Sandy Valley Road and the likely development of a wind energy power generation plant in the Table Mountain area. In the late 1990s, the Las Vegas District Bureau of Land Management (BLM) administratively designated a large area (approximately 3,641 acres) east of La Madre Ridge as Lone Mountain Community Pit (LMCP). The intent of the designation was to accommodate local demand for an additional source of sand and gravel to support development in Southern Nevada. However, the BLM designated LMCP without adequate evaluation of environmental impacts or review of existing documents. In the 1960s, BLM identified much of the area now within the boundary of LMCP as seasonally important for bighorn sheep. Unit 263: McCullough Range and Highland Range; Southern Clark County Report by: Patrick Cummings Survey Data In October 2009, aerial bighorn sheep surveys were conducted in the Highland Range and McCullough Range. In the Highland Range, 14 rams, 24 ewes and 3 lambs were encountered. In the McCullough Range, 127 sheep were classified reflecting sex and age ratios of 53 rams and 21 lambs per 100 ewes. Bighorn sheep in the McCullough Range were widely distributed and not encountered at lower elevations or in close proximity to water sources. Habitat Cogentrix Solar Services, LLC is proposing to develop 2 300-megawatt solar thermal power generating facilities on sites located immediately west of McCullough Pass and west of Sheep Mountain. Based on project applications submitted to BLM, the surface areas applied for equated to 19,840 acres west of McCullough Pass and 9,760 acres west of Sheep Mountain. Several projects to construct trails are in planning phase. The City of Henderson intends to construct trails on the north end of the McCullough Range, and BLM will ultimately construct trails in Sloan Canyon National Conservation Area and in 2 wilderness areas. An unresolved issue centers on relocation of a segment of the local helicopter scenic tour operations from McCarran International Airport. The widely supported project is intended to direct helicopters enroute to and from the Grand Canyon to an unpopulated area. One proposal identifies a heliport south of Sloan. Under this scenario, tour helicopters departing and arriving at a heliport south of Sloan would necessarily fly over the McCullough Range. The direct routes to and from the proposed heliport would entail potentially 120-200+ low-level flights over the central portion of the McCullough Range within 1 mile of 2 water developments. The issue and details will be resolved through federal legislation. Population Status and Trend The bighorn sheep population inhabiting the Highland Range and McCullough Range is estimated at 310 adults, and reflects a contraction from 330 reported last year. The decline is attributed to reduced survivorship in the McCullough Range, ram harvest in 2009 and low recruitment in 2010. Reduced survivorship was simulated in the population model to account for the impacts of elimination of critical water sources during summer. The relative importance of 4 water developments situated in the north McCullough Range has changed. Formerly, the Roy water development was extensively used by sheep during summer months. Since 2006, sheep reliance on the 2 northernmost water developments, Penny and Poppy, has increased while use at Roy has substantially decreased. During summer 2008, Penny and Poppy were depleted. In 2009, it was noted that Penny was fully depleted by 1 August, and Poppy was drawn-down to below 20% of capacity (900 gallons remaining) by 5 August.
77
DESERT BIGHORN
The expectation that Poppy would be fully depleted in mid August 2009 prompted water haul activities. In a collaborative effort, Nevada Bighorns Unlimited—Reno Chapter and Fraternity of the Desert Bighorn provided essential funding for helicopter services. Within 1 week of assessing the water shortage, a helicopter delivered 1,875 gallons of water to Poppy. In early November 2008, 14 ewes and 2 male lambs were captured from the south central and north central portions of the McCullough Range to achieve an augmentation of the herd inhabiting the Meadow Valley Mountains. In October 2006, 27 sheep comprised of 22 ewes, 2 female lambs and 3 male lambs were captured from the northeast and central portions of the range to achieve an augmentation of the herd inhabiting the Virgin Mountains. In October 2003, the first capture and removal of bighorn sheep in the McCullough Range was conducted to achieve an augmentation of the herd inhabiting the Delamar Range. Fifteen sheep comprised of 14 ewes and 1 male lamb were captured from the east-central portion of the range. In an isolated incident in late July 2005, 22 bighorn sheep were found to have died in proximity to the Roy water development. An extensive investigation ensued into what caused the deaths of 11 rams, 6 ewes and 5 lambs. Dr. Dan Crowell, a veterinarian with Nevada Department of Agriculture, coordinated the investigation. Bighorn sheep tissue and water samples were submitted to California Animal Health and Food Safety Laboratories at University of California, Davis. The considered possible causes of death included: lightning, dehydration, toxic compounds and metals and disease. Diagnostic findings were inconclusive as to the cause of death of the 22 bighorn sheep. Lightning was reasoned as not a causative factor. A confounding aspect that limited the scope of testing was extreme high temperatures prior to and during the narrow timeframe within which the bighorn sheep died. The record high temperatures in late July served to hasten decomposition. The rapid decomposition of the carcasses limited the number and types of tissue samples collected. All tissue samples were autolyzed and unsuitable for bacteriology tests. Additional critical factors that likely hampered detection of a toxin in the drinker were the dismantled float valve at the drinker and heavy rainfall that occurred the night before and early morning of the day the sheep were discovered. The inoperable float valve resulted in an open, flow-through system that when it rained the drinker was thoroughly flushed. Thus, if a toxin were present in the drinker it likely would have been eliminated through prolonged flushing action shortly after rainfall began the night prior to discovery. Bighorn sheep in the northern portion of the McCullough Range face a variety of human imposed challenges in the near future. On the west flank of the range, suburban sprawl and flood control measures have already claimed much of the lower elevation habitat. To the north, the movement corridor between the River Mountains and the McCullough Range across US 93/95 at Railroad Pass has been effectively eliminated. Additional urban sprawl southward along I-15 is expected to degrade bighorn sheep habitat in the Hidden Valley area. Unit 264: Newberry Mountains; Southern Clark County Report by: Patrick Cummings Seasons and Hunt Quotas Units 264 and 265 have constituted a bighorn sheep hunt unit group since 1998. Survey Data No aerial survey was conducted in Unit 264 last year. In October 2008, an aerial survey in the Newberry Mountains yielded the highest recorded sample of 51 bighorn sheep. The sample was comprised of 23 rams, 17 ewes and 11 lambs Table 1.
78
DESERT BIGHORN
Habitat Duke Energy has proposed to build about 160 wind turbines east of Searchlight, across approximately 24,000 acres. The $500 million plant could generate 370 megawatts of power. The apex of the blade sweep for each structure would stand 415 feet tall. The BLM expects to have a final environmental impact statement and decision by April 2011. NDOW is concerned that if constructed under the latest wind turbine array configuration, bighorn sheep will be impacted by turbine structures, appurtenances and human activity during construction and operational phases. Structures and roads will span the movement corridor linking the Eldorado Mountains and Newberry mountains. Table 1. Bighorn composition obtained through aerial surveys in the Newberry Mountains.
Population Status and Trend The population in the Newberry Mountains approximates the estimate derived last year. Population data over the long term suggest the small herd is stable. Unit 265: South Eldorado Mountains; Southeastern Clark County Report by: Patrick Cummings Seasons and Hunt Quotas Units 264 and 265 have constituted a bighorn sheep hunt unit group since 1998. Survey Data No aerial survey was conducted in Unit 265 last year. In October 2003, 2 rams, 6 ewes and 4 lambs were observed during a 4.5-hour survey (Table 1). The next aerial bighorn sheep survey in the south Eldorado Mountains is scheduled for fall 2010. Table 1. Bighorn composition obtained through aerial surveys in the south Eldorado Mountains.
Since 1969, survey sample sizes have varied widely; samples have ranged from 0 to 50 animals. In some years, aerial survey data portray a disproportionate number of rams in the unit. In many of the 20 aerial surveys conducted since 1969, the number of rams observed either equaled or far exceeded the number of ewes. Habitat Duke Energy has proposed to build about 160 wind turbines east of Searchlight, across approximately 24,000 acres. The $500 million plant could generate 370 megawatts of power. The apex of the blade sweep for each structure would stand 415 feet tall. The BLM expects to have a final environmental impact statement and decision by April 2011. NDOW is concerned that if constructed under the latest wind turbine array configuration, bighorn sheep will be impacted by turbine structures, appurtenances and human activity during construction and operational phases. Structures and roads will span the movement corridor linking the Eldorado Mountains and Newberry mountains. Population Status and Trend The southern Eldorado Mountains support a low-density resident bighorn herd as well as a fall migrant segment from the northern portion of the range. The 2010 population estimate for the herd inhabiting the entire Eldorado Mountains (Units 265 and 266) is 170, and reflects a slight contraction compared to the 180 reported last year. Unit 266: North Eldorado Mountain;: Southeastern Clark County Report by: Patrick Cummings Survey Data No aerial survey was conducted in Unit 266 last year. In October 2008, an aerial survey conducted in the northern portion of the Eldorado Mountains yielded a sample of 99 bighorn sheep. The observed sex and age ratios were 56 rams and 35 lambs per 100 ewes. Bighorn sheep were encountered along the prominent east-west oriented ridge situated northeast of Boulder City and south of US 93 and north of US 93 on Hemenway Wall and west of Lakeview Point. The 5.5-hour aerial survey terminated south of Burro Wash. Habitat On the northern end of the Eldorado Mountains, the herd has coped not only with persistent drought conditions (2000-02 and 2006-08), but also periodic deaths consequential to collisions with vehicles along U.S. 93. The highway traverses through a bighorn sheep core use area and likely represents a population sink. The magnitude of the problem is somewhat unclear as it is expected only a fraction of bighorn-vehicle collisions are reported. The bighorn sheep herd in the Eldorado Mountains has and will continue to face additional human imposed challenges. Two massive projects, 1 of which is underway, are intended to divert highway traffic from traveling along existing U.S. 93 over Hoover Dam and through Boulder City. The Hoover Dam Bypass is nearing completion, and entails construction of a bridge that will span the Colorado River as well as a new U.S. 93 alignment. The Hoover Dam Bypass Project is a 3.5-mile corridor beginning at approximately milepost 2.2 in Clark County, Nevada and crossing the Colorado River approximately 1,500 feet downstream of the Hoover Dam, then terminating in Mohave County, Arizona near milepost 1.7 on U.S. 93. Construction on the nearly 2,000 foot long bridge began in late January 2005, and is scheduled to be completed by September 2010. The Bypass is scheduled to be fully completed, with traffic moving on it, by November 2010. The second bypass project will extend the new U.S. 93 alignment east of Boulder City through the northern portion and western flank of the Eldorado Mountains.
80
DESERT BIGHORN
In October 2003, in efforts to better understand how the Hoover Dam Bypass project will impact bighorn sheep, the Federal Highway Administration, National Park Service and Nevada Department of Wildlife cooperated in capture of 20 bighorn sheep subsequently fitted with GPS and VHF telemetry subsystems. The objective was to monitor bighorn movements and distribution before and during construction phases. Ultimately, as the project nears completion, bighorn movement and distribution data are anticipated to illuminate impacts that may be addressed and mitigated, as well as impacts that may be irreversible. Population Status and Trend The southern Eldorado Mountains support a low-density resident bighorn herd as well as a fall migrant segment from the northern portion of the range. The 2010 population estimate for the herd inhabiting the entire Eldorado Mountains (Units 265 and 266) reflects a slight contraction compared to the estimate reported last year. Unit 267: Black Mountains; Eastern Clark County Report by: Patrick Cummings Survey Data In October 2009, an aerial survey yielded a sample of 188 bighorn sheep. The observed sex and age ratios were 70 rams and 16 lambs per 100 ewes. Given generally higher bighorn sheep density, the majority of the aerial survey was focused between Echo Bay and Boathouse Cove Road. In the interval between 1986 and 2004, aerial survey sample sizes and encounter rates generally trended downward. Over this period, greater than 75% of observed ewes were without attendant lambs. The recent survey sample was similar in size and encounter rate to the sample obtained last year. Habitat Drought conditions prevailed in the Black Mountains in 2009. However in April 2010, environmental conditions are greatly improved due to the several fall and winter storm systems that occurred over nearly a 4-month period from December 2009 through early March 2010. Population Status and Trend Over the long term, recruitment of young animals appears below levels necessary to maintain the bighorn sheep herd inhabiting the Black Mountains. Aerial survey data (i.e., lamb-to-ewe ratio, sheep per hour, total observed) portray a steady population decline that began in the latter half of the 1980s. Recently, data collected during 3 aerial surveys since 2005, indicate the herd has expanded. Desert bighorn sheep occupying the Black Mountains and Muddy Mountains comprise a single population given the high degree of movement between ranges. However, environmental conditions and local population dynamics have differed markedly. Over the long term, aerial survey data portray a decline in the number of bighorn sheep inhabiting the Black Mountains, while data reflect an increase in sheep numbers in the adjacent Muddy Mountains. The 2010 population estimate for bighorn sheep inhabiting the Black Mountains and Muddy Mountains reflects a contraction from that reported last year. The decline is attributed to reduced survivorship in the Muddy Mountains, ram harvest in 2009 and low recruitment in 2010. Unit 268: Muddy Mountains: Clark County Report by: Patrick Cummings Survey Data In October 2009, 8.4 hours of flight time were expended over a 2-day period to conduct aerial bighorn
81
DESERT BIGHORN
sheep surveys in the Muddy Mountains. The survey efforts yielded a sample of 331 bighorn sheep. The observed sex and age ratios were 95 rams and 26 lambs per 100 ewes. Bighorn sheep were widely distributed and encountered throughout much of the survey route north and south of S.R. 169. The low bighorn encounter rate over Muddy Peak was likely the result of the lack of water availability at 2 water developments over the summer. Habitat Drought conditions prevailed in the Muddy Mountains in 2009. However in April 2010, environmental conditions are greatly improved due to the several fall and winter storm systems that occurred over nearly a 4-month period from December 2009 through early March 2010. Dry conditions in 2008 and early 2009 resulted in inadequate recharge of 3 water developments in the Muddy Mountains. In a collaborative effort, critical funding support from Fraternity of the Desert Bighorn and Nevada Bighorns Unlimited—Reno Chapter enabled payment for helicopter services. In May 2009, in the course of about 84 sorties, a Nevada Division of Forestry Bell 204 UH-1 “Huey” helicopter delivered 10,000 gallons of water to 3 water developments. Through these efforts and in advance of summer, 5 Ram was filled to capacity (10,430 gallons), the 4 Boss Tanks at Flipper were filled to capacity (7,200 gallons) and White Basin received 3,500 gallons of water (4,400 gallons available). Population Status and Trend Desert bighorn sheep occupying the Black Mountains and Muddy Mountains comprise a single population given the high degree of movement between ranges. However, environmental conditions and local population dynamics have differed markedly. Over the long term, aerial survey data portray a decline in the number of bighorn sheep inhabiting the Black Mountains, while data reflect an increase in sheep numbers in the adjacent Muddy Mountains. The 2010 population estimate for bighorn sheep inhabiting the Muddy Mountains and Black Mountains is 800, and reflects a contraction from 850 reported last year. The decline is attributed to reduced survivorship in the Muddy Mountains, ram harvest in 2009 and low recruitment in 2010. Reduced survivorship was simulated in the population model to account for the impacts of elimination of critical water sources during summer. In late August 2009, water was no longer available at White Basin. In conducting aerial bighorn sheep surveys in early October 2009, 3 other water developments were noted as dry. Water was unavailable at the 2 water developments situated on the south end of Muddy Peak and at 5 Ram. In early November 2009, 19 ewes and 1 lamb were captured in the Muddy Mountains and furnished to biologists with the Utah Division of Wildlife Resources. The sheep were released into the Grand Staircase—Escalante National Monument in southern Utah. In early November 2008, a bighorn sheep capture and removal operation was conducted in the Muddy Mountains to achieve augmentations of herds inhabiting the Delamar Mountains and Meadow Valley Mountains. In the course of 2 days, a total of 41 bighorn sheep was captured and translocated. In the first day, 25 sheep comprised of 20 ewes, 4 female lambs and 1 male lamb were captured and later released in the Delamar Mountains. On the second day, 15 ewes and a single male lamb were captured and subsequently released in the Meadow Valley Mountains. In December 2007, a bighorn sheep capture and removal operation was conducted in the Muddy Mountains to achieve an augmentation of the herd inhabiting the Delamar Mountains. Twenty-five sheep comprised of 22 ewes, 2 female lambs and 1 male lamb were captured from the eastern portion of the Muddy Mountains.
82
DESERT BIGHORN
Unit 271: Mormon Mountains; Lincoln County Report by: Mike Scott Survey Data Aerial surveys were completed in August 2009 and resulted in the classification of 213 sheep consisting of 62 rams, 109 ewes, and 42 lambs. This results in a ratio of 57 rams:100 ewes:39 lambs. The previous survey was conducted in August 2008 and resulted in the classification of 170 sheep. These were classified as 52 rams, 83 ewes, and 35 lambs for a ratio of 63 rams:100 ewes:2 lambs. This is the highest total observed since 1993. Habitat A large portion of the Mormons burned in 2005, and sheep continue to be observed in burned areas frequently. Sheep were observed throughout the Mormons during this survey, and as usual, generally associated with water sources. Densities of sheep appear to be climbing in the Mormons, with the exception of the north ridges, which have had very low densities of sheep for the past several years. The Hackberry water development was dry, possible due to high densities of sheep. Water does not appear to be available at several of the historic springs such as Hackberry, Wiregrass, Peach, of Gourd Springs. Habitat conditions should be very good due to above average precipitation during the winter of 2009 – 2010. However, with increased precipitation comes the potential for large-scale summer wildfires. Population Status, and Trend The Mormon Mountain bighorn population continues to show an upward trend. Unit 272: Virgin Mountains and Gold Butte; Northeastern Clark County Report by: Patrick Cummings Survey Data In October 2009, an aerial bighorn sheep survey was conducted over the Bunkerville Ridge, Virgin Mountains and northern portions of the Gold Buttes. In the course of the 4.6-hour survey, 8 rams, 19 ewes and 10 lambs were encountered. The majority of the bighorn observations were in the northern portions of the Gold Buttes. The aerial survey did not extend south to include Azure Ridge, Indian Hills, Millions Hills, Iceberg Canyon and Hells Kitchen. No aerial surveys were conducted in Unit 272 in 2007 and 2008. In September 2006, an aerial survey conducted in the Virgin Mountains and Gold Buttes yielded a sample of 62 bighorn sheep. The observed sex and age ratios were 70 rams and 37 lambs per 100 ewes. Bighorn sheep were encountered in the Whitney Pocket area, Iceberg Canyon, Bitter Ridge and the north end of Lime Ridge. Habitat In May 2004, the Virgin #1 water development was constructed northwest of Whitney Pocket as a measure to enhance habitat prior to the bighorn sheep release (augmentation) that was accomplished in October 2005. On 18 March 2006, Virgin #2 was constructed north of Whitney Pocket. Bighorn sheep habitat in the Hiller Mountains remains in degraded state due to an existing burro population and dry conditions. A bighorn sheep release in the Hiller Mountains was approved in Fiscal Year 1996. However, the augmentation was never accomplished due to degraded habitat conditions. In July 2006, lightning strikes ignited 4 wildland fires in the southern portion of the Virgin Mountains. The aptly named Whitney Pass Fire consumed vegetation across 230 acres on the northeast end of
83
DESERT BIGHORN
Whitney Ridge. The Virgin Gold Fire burned to within yards of the Virgin #2 water development before a slurry drop extinguished the fire. The Virgin Gold Fire consumed mid-elevation (Mojave Desert Scrub) and upper-elevation (piñon-juniper woodland) vegetative communities across 2,700 acres. At its northern point, the Virgin Gold Fire burned to within a half mile of the Virgin #1 water development. The Jeep Fire occurred northeast of the Virgin #1 water development in the vicinity of the Virgin Gold Fire, and consumed vegetation over 196 acres. East of the Key West Mine, the Double Nickel Fire consumed vegetation across 523 acres. In late June 2005, lightning strikes in the Gold Buttes ignited the Fork Fire and Tramp Fire. Landmarks within the burned areas included: Tramp Ridge, Gold Butte, Mica Peak, Cedar Basin, Jumbo Peak, Jumbo Basin, Anderson Ridge, Rattlesnake Peak, Garnet Valley and the north face of Bonelli Peak. Burned over areas that included Tramp Ridge, Gold Butte, Cedar Basin and Mica Peak had few remaining small mosaics of vegetation. Areas marked by little to no remaining vegetation included Jumbo Peak, Jumbo Basin, Anderson Ridge, Rattlesnake Peak, Garnet Valley and the north face of Bonelli Peak. In addition, vegetation associated with approximately 11 springs and at least 7 wash complexes were impacted by fire. The Fork Fire consumed plants over 44,314 acres along a 3,300’-elevation gradient (2,460’ to 5,760’) within 3 vegetative associations: Creosote-Bursage Flats, Mojave Desert Scrub, and Pinyon-Juniper Woodland. The Tramp fire consumed vegetation over 26,817 acres. Population Status and Trend In recent years, few bighorn sheep have been found to inhabit the Virgin Mountains; most occur in the southern portion of the unit commonly referred to as the Gold Buttes. In October 1998, 20 bighorn sheep (one ram, 12 ewes, and 7 lambs) captured in the Muddy Mountains were released north of Bonelli Peak. Based on monitoring data from 3 telemetered ewes, some bighorn sheep dispersed from the release site. Results of 4 aerial surveys conducted since 2000 suggest the 1998 augmentation did not hastened expansion of the population segment inhabiting the Gold Buttes. In October 2005, in accordance with NDOW’s biennial Big Game Release Plan (FY 2006-07), 25 bighorn sheep were released at Virgin #1 water development. The release contingent was comprised of 17 ewes and 8 lambs. Eight ewes were fitted with conventional VHF radio telemetry subsystems. Shortly after the release, 4 ewes were known to have died. Three ewes succumbed to capture myopathy. The proximate cause of death of the 4th ewe was predation, although capture myopathy may have been an underlying factor. In early October 2007, a 4th telemetered ewe from the 2005 release died on a minor ridge in Mud Wash. The ewe was completely intact upon discovery, but exhibited an apparent profound infestation of psoroptic mites. In October 2006, 27 bighorn sheep were released midway between Virgin #1 water development and Whitney Pocket. The release contingent was comprised of 22 ewes and 5 lambs. Nine ewes were fitted with conventional VHF radio telemetry subsystems. By late February 2007, 5 telemetered ewes had died. The cause of death among 3 ewes was predation, while the death of another was determined not to be the result of predation. Due to extreme difficulty in accessing the site of the remaining known mortality, no investigation into cause of death was conducted. In mid April 2007, 2 additional telemetered ewes from the 2006 release died. The causes of death were not determined. In October 2008, an 8h ewe mortality from the 2006 release contingent was confirmed. The ewe’s remains were found beneath a juniper approximately 0.6 miles northeast of the Virgin #1 water development. The ewe’s death was suspected to be the result of predation. As of March 11, 2010, 4 of 17 telemetered ewes from 2005 and 2006 release contingents remain. A fifth ewe affixed with a faulty telemetry collar and 3 other ear-tagged sheep were observed during the October 2009 aerial survey. On January 17, 2010, 9 rams captured in the River Mountains were released in Unit 272. Five of the 9 rams were fitted with GPS store-on-board telemetry collars. As of March 11, 2010, all of the telemetered rams were determined to be alive.
84
DESERT BIGHORN
The 2010 population estimate for the Gold Buttes and Virgin Mountains approximates the estimate reported last year. Unit 280: Spotted Range; Northwestern Clark County Report by: Patrick Cummings Survey Data In September 2009, a 3.6-hour aerial survey yielded a sample of 61 bighorn sheep. The sample was comprised of 24 rams, 29 ewes and 8 lambs. Bighorn sheep were encountered on South Ridge near Spotted #5 water development and on the northwest side of the range. In September 2007, an aerial survey conducted in the Spotted Range yielded the highest recorded sample (Table 1). The observed sex and age ratios were 51 rams and 60 lambs per 100 ewes. Table 1. Bighorn composition obtained through aerial surveys in the Spotted Range
Population Status and Trend The bighorn sheep population in Unit 280 was established through releases in 1993 and 1996. The initial release complement captured from the River Mountains, Clark County was comprised of 2 rams, 13 ewes and 10 lambs. The 1996 release contingent was also obtained from the River Mountains and consisted of 8 rams, 16 ewes and 1 lamb. In 2010, the estimated number of bighorn sheep inhabiting the Spotted Range approximates the estimate derived last year. Habitat improvements in the Spotted Range involve 6 water developments. Unit 281: Pintwater Range; Northwestern Clark County Report by: Patrick Cummings Survey Data In September 2009, a 5.4-hour aerial survey yielded a sample of 102 bighorn sheep. The survey sample was the largest recorded in the last 20 years. The observed sex and age ratios were 51 rams and 22 lambs per 100 ewes. Given time of year, the survey was focused over areas within proximity to water sources. The majority of bighorn sheep encountered were within 2 miles of springs and water developments. The Dain Peak water development was noted as dry during aerial surveys in each of the last 3 years.
85
DESERT BIGHORN
Population Status and Trend In 2010, the estimated number of bighorn sheep inhabiting the Pintwater Range reflects a slight contraction relative to the estimate reported last year. The ram harvest in 2009 and low recruitment in 2010 are major contributors to this population estimate decline. Unit 282: Desert Range and Desert Hills; Northwestern Clark County Report by: Patrick Cummings Survey Data In September 2009, a 5.0-hour aerial survey yielded a sample of 85 bighorn sheep. The survey sample was the largest recorded in the last 21 years. The observed sex and age ratios were 92 rams and 26 lambs per 100 ewes. Given time of year, the survey was focused over areas within proximity to water sources. Nearly all bighorn sheep were encountered within 2 miles of water developments. During the aerial survey in 2008, the Black Top water development was noted as dry, and as having recent heavy sheep use. Population Status and Trend In 2010, the estimated number of bighorn sheep inhabiting the Desert Range approximates the estimate reported last year. Over the long term, the observed proportion of lambs to ewes obtained through aerial surveys has been low. Historically, many of the bighorn sheep occupying the Desert Range were fall and winter migrants from the adjacent Sheep Range. Units 283, 284: East Desert Range and Sheep Range; Northern Clark County Report by: Patrick Cummings Seasons, Hunt Quotas and Harvest Results In 2003, unit designations in Area 28 were simplified. The 4 units comprising the Sheep Range and East Desert Range were consolidated into 2 units. Former Units 283 and 287 were designated Unit 283; former Units 284 and 285 were designated Unit 284. Survey Data In September and October 2009, aerial bighorn sheep surveys were conducted on the northwest, northeast, south and southwest portions of Sheep Range, Enclosure Ridge, East Desert Range and Black Hills. In the course of 14.3 survey hours, 122 bighorn sheep were encountered. The observed sex and age ratios were 44 rams and 10 lambs per 100 ewes. The low ratio of lambs per ewes was among the lowest ever recorded. Given time of year, bighorn distribution was expectedly clumped and associated with water sources. Habitat In a 3-year period (2004-06), wildland fires sparked by lightning strikes during summer months burned vegetation along thousands of acres on the east side of the Sheep Range. In bighorn sheep habitat, fires consumed vegetation at low, mid and high elevations. Much of the fire-caused damage occurred at low elevations. Present concerns relate to the likely establishment of fire-adapted invasive and exotic annual grasses at low and mid elevations.
86
DESERT BIGHORN
87
Population Status and Trend The 2010 population estimate for bighorn sheep inhabiting Units 283 and 284 is 180. The apparent contraction in the population since the estimate (210) reported last year reflects an expected low level of recruitment in 2010. Later this year, an important objective in conducting aerial surveys will be documentation of yearling sheep. Emphasis will be placed on detecting yearling bighorns to better assess recruitment in 2010. In an effort to hasten recovery of the bighorn population in the Sheep Range, and in conformance with NDOW’s Big Game Release Plan, 35 sheep captured in late October 1998 from the Muddy Mountains, Arrow Canyon Range, and Specter Range were released at the mouth of Joe May Canyon. Subsequent monitoring efforts and aerial survey data suggest the release was not effective in achieving the objective. Unit 286: Las Vegas Range; Clark County Report by: Patrick Cummings Survey Data In October 2009, an aerial survey conducted in the Las Vegas Range yielded a sample of 35 bighorn sheep. The survey sample was comprised of 10 rams, 23 ewes and 2 lambs. The low ratio of lambs per ewes was among the lowest ever recorded. Bighorn sheep were encountered on Gass Peak, near Quail Spring, in the Peek-a-boo Canyon area and on the northeast portion of the range. Habitat In 2005 and 2006, wildland fires sparked by lightning strikes during summer months burned vegetation along thousands of acres in the Las Vegas Range. In bighorn sheep habitat, fires consumed vegetation at low, mid and high elevations. Much of the fire-caused damage occurred at low and mid elevations. Present concerns relate to the likely establishment of fire-adapted invasive and exotic annual grasses at low and mid elevations. Members of the Fraternity of the Desert Bighorn and NDOW personnel repaired fire-caused damage to 3 water developments (Juniper Peak, Hidden Valley and Frozen Toe). The Las Vegas Range is situated immediately north of the Las Vegas valley and in recent year’s suburban development has approached the southern boundary of the Desert National Wildlife Range. Increasingly, off-highway-vehicle (OHV) use has resulted in proliferation of unauthorized roads and trails. Despite federal regulation prohibiting the use of unlicensed vehicles on the refuge, the newly established network of roads and trails allows OHV users access to formerly undisturbed bighorn habitat. Population Status and Trend In 2010, the population estimate for bighorn sheep inhabiting the Las Vegas Range is 100, and represents a decline relative to the 120 reported last year. The abrupt decline is primarily related to an expected low level of recruitment in 2010. Later this year, an important objective in conducting aerial surveys will be documentation of yearling sheep. Emphasis will be placed on detecting yearling bighorns to better assess recruitment in 2010. Fires that occurred during summer months in 2005 and 2006 impacted approximately half of the bighorn sheep habitat in the Las Vegas Range. Post-fire establishment of fire-adapted invasive and exotic annual grasses at low and mid elevations has occurred. The Las Vegas Range supports a resident bighorn population, and during cooler months, a migrant segment from the Sheep Range.
CALIFORNIA BIGHORN
CALIFORNIA BIGHORN SHEEP Unit 012: Calico Mountains and High Rock Canyon; Western Humboldt and Washoe Counties Report by: Chris Hampson Harvest Results Tag quotas for Unit 012 were increased to 10 tags in 2009. All 10 of the tagholders reported being successful in harvesting their rams. Boone and Crockett scores ranged between 144 and 163 inches. Average age for the 10 harvested rams was 7.3 years. Survey Data A total of 115 bighorn was classified during bighorn composition surveys in September 2009. The sample provided a composition ratio of 34 rams:100 ewes:35 lambs. Areas surveyed in 2009 were the Calico Mountains, Little High Rock Canyon, High Rock Canyon and the Chukar Gulch area. The 2009 lamb recruitment dropped by an average of 7 lambs per 100 ewes when compared with the 2008 ratio of 42 lambs per 100 ewes. This year’s average recruitment rate of 35 lambs per 100 ewes is the same as the 2007 ratio which was the lowest recruitment rate ever observed for this herd. The long-term average lamb ratio for the 012 population was 56 lambs per 100 ewes (1994-2007). The persistent drought conditions over the past several years have negatively impacted habitat conditions for bighorn in this hunt unit. Ram ratios for this population are estimated to be near 70 rams per 100 ewes. This is a typical ram ratio for a large, long established bighorn population.
Habitat Despite, the significant amount of moisture received during the month of June, very little additional moisture was received during the months of July, August and September. Drought conditions returned and habitat conditions within western Nevada had once again deteriorated by the end of September. Many of the water sources that were given a boost from the abundant moisture received during the month of June had dried up entirely or suffered reduced flows by the end of the summer. For the current water year beginning October 1, 2009, all major river basins within western Nevada remain below average for total precipitation and snowfall. The prolonged drought conditions and the intense competition between horses, cattle and bighorn have negatively impacted this herd in recent years. Lamb recruitment has averaged just 37 lambs per 100 ewes between 2007 and 2009. Competition has increased dramatically during the recent drought years and is especially intense near or close to the limited water sources. The Bureau of Land Management recently removed over 1900 horses from the Calico Complex. The removal of the horses will help to reduce the amount of competition between feral horses, bighorn and other wildlife. Most riparian areas within Unit 012 are in poor condition due to the drought and long-term over-utilization by livestock and feral horses. With little to no ground cover, evaporation rates are very high and cause many of the water sources to dry up by late summer. In 2008, the Bureau of Land Management determined that several of the riparian areas within the National Conservation Area of Unit 012 were in non-functioning condition with a downward trend. It was also determined that current grazing practices and high horse numbers were in fact impacting these water sources and hampering recovery. With horse numbers now near manageable levels, riparian areas will have a better chance to slowly recover. The removal of the excess horses will allow for increased forage and water for all wildlife species.
88
cc
CALIFORNIA BIGHORN
The Bureau of Land Management could further help bighorn and other wildlife by approving big game watering devices (guzzlers) that NDOW has recommended. This would help to offset the current impacts from the drought as well as provide important water sources over the long-term as riparian areas slowly heal and recover. Water source inventories and assessments will need to be conducted throughout the area in order to strategize on how best to protect and restore these important water sources. Future gathers will be needed to keep horse numbers within the appropriate management level. Trapping and Transplanting The Unit 012 California bighorn population provides source stock for transplanting opportunities within the state of Nevada. Trapping and removal of bighorn for source stock is usually conducted every 2 to 4 years in order to keep the Unit 012 bighorn population at optimal levels. In January of 2010, a trapping operation was conducted in an attempt to provide source stock for a planned release in the Jackson Mountains. However, due to an unexpected Soremouth outbreak within the herd, only 6 healthy animals were captured and removed from Unit 012. An additional 9 bighorn were captured from the adjacent Negro Creek subpopulation in hunt Unit 014. During the bighorn capture in Unit 012, it was noted that approximately 75% of the herd was experiencing the disease outbreak. The disease event was believed to be the first of its kind in northern Nevada bighorn populations. NDOW biologists will continue to monitor the herd to determine whether the disease has an effect on current and future lamb survival. Soremouth outbreaks generally last from 4 to 6 weeks and can easily spread through the herd when animals are concentrated near water sources. Recent drought conditions are thought to have exacerbated the spread of the outbreak. Population Status and Trend The 2010 population estimate for this herd shows a stable trend for the Unit 012 bighorn population. The estimate remains at 270 animals. Unit 014: Granite Range; Washoe County Report by: Chris Hampson Harvest Results The Unit 014 bighorn hunting season was re-opened in 2005 following 4 closed seasons between 2001 and 2004. One-hundred percent of the harvest since the season was re-opened has occurred from the Negro Creek subpopulation in the northeastern portion of hunt Unit 014. Mature rams are present in several other location’s, however easier access to bighorn that inhabit the Negro Creek area seems to draw hunters to this portion of the hunt unit. Bighorn habitat in the southern portion of the unit is very steep and difficult to access. In 2009, both harvested rams were once again taken from the Negro Creek subpopulation. Survey Data In 2009, twenty minutes of helicopter time was used to classify 38 bighorn sheep in Unit 014. The animals classified were from the Negro Creek subpopulation on the northeastern portion of the hunt unit. The average composition ratio for the sample was 8 rams:100 ewes:44 lambs. The survey located 2 groups of sheep that were made up of ewes, lambs and a few young rams. Distribution within the Granite Range continues to slowly expand into the large amount of habitat available. One sportsman recently reported observing 3 different groups of sheep to the west of Fox Mountain over the past few years. These sheep are more than likely bighorn expanding into and exploring the good quality sheep habitat adjacent to the Negro Creek subpopulation. Observations of bighorn sheep crossing back and forth between hunt Units 012 and 014 continue to be reported.
89
cc
CALIFORNIA BIGHORN
Habitat Habitat conditions in the upper and mid elevations of Unit 014 are in much better shape than many other areas of Washoe County. The Granite Range is a steep high elevation mountain range that captures more moisture from passing storms than does the mid and lower elevation plateau type sheep habitats that encompass much of northern Washoe and western Humboldt Counties. The steep topography associated with the Granite Range reduces the amount of direct sunlight and helps the area to be more drought resistant than surrounding hunt units. Although, the Negro Creek subpopulation inhabits all elevations of the Granite Range depending upon the time of year, there is a portion of the sheep population that is almost always associated with the lower elevation habitats near Shovel Spring. The groups of sheep associated with this lower elevation habitat are usually larger groups of ewes and lambs. Ram groups are often associated with the mid to upper elevations of Buckhorn Peak to the north of Negro Creek. Cheatgrass is the predominant grass species at the lower elevations near Negro Creek. The annual grass quickly invaded the site following a large wildfire that occurred in the late 1980’s. These lower elevation areas were very dry this past summer and fall. Smaller patches of sagebrush and native bunchgrasses survived the fire but are generally located on ridge tops at the mid to upper elevations. The recent gather of over 1900 feral horses by the Bureau of Land Management will help to reduce the competition between horses and wild sheep. Horse numbers within the Granite Range were well above AML prior to the recent capture. Due to the current drought conditions especially at the lower elevations, many of the water sources were dry or experiencing reduced flows. The winter of 2009-10 saw continuous cold fronts pass through the area. Although, most areas within Washoe County remain well below average for both snowpack and total precipitation, the mid to upper elevations of the Granite Range received more snowfall than most other areas within Washoe County. It is believed that the spring runoff will help improve water flows at important springs and seeps that are located at the lower elevations. Trapping and Transplanting In January 2010, NDOW initiated a California bighorn capture operation in hunt Unit 012. The target for the capture operation was to trap 30 bighorn from Unit 012 and transport them for release into the Jackson Mountains of Humboldt County. However, due to an unexpected disease event (Soremouth) only 6 animals were removed from the Unit 012 population. The need to come up with a minimum number of animals (approximately 15 animals) for a decent sized release complement, led NDOW to make the decision to move the capture operation to the Granite Range in hunt Unit 014. A total of 9 bighorn was captured from the Negro Creek area in Unit 014 and loaded into the trailer with the 6 animals from 012. The bighorn were released later that same day into the Jackson Mountains. Sore mouth is usually not lethal to adult bighorn sheep. However, in severe cases it may reduce bighorn lamb recruitment. NDOW will continue to monitor the health and lamb recruitment of those herds affected by this disease outbreak. Population Status and Trend The observed recruitment level for the Granite herd was measured at 44 lambs per 100 ewes in 2009. Due to the affects of the prolonged drought, potential health related issues with the recent Soremouth outbreak, and the trapping and removal of 9 animals this past winter, the population estimate for this herd remains similar to the 2008 estimate at 110 bighorn.
90
cc
CALIFORNIA BIGHORN
Unit 022: Virginia Mountains; Washoe County Report by: Chris Hampson Harvest Results During 2009, 2 tags were allocated to hunt California bighorn sheep in hunt Unit 022. Both hunters reported harvesting a ram. The 2 harvested rams were both 6-years of age and scored 148 Boone and Crockett inches. One of the hunters harvested his ram on opening day, while the other hunter expended 10 days of hunting effort. Survey Data Thirty-seven bighorn were located during composition surveys in September 2009. The 2 groups of bighorn that were located during the survey were in East Cottonwood Canyon and Juniper Basin. The sample provided a composition ratio of 9 rams:100 ewes:59 lambs. Two fairly large ewe/lamb groups were located during the survey. Bighorn in this hunt unit can be difficult to locate from the helicopter due to extensive tree cover and expansive habitat. Ground access can be a challenge due to private land ownership and reservation lands. Population Status and Trend The Virginia Mountain bighorn herd continues to slowly expand into the large amount of good sheep habitat available. A few observations of bighorn to the west of the Virginia Mountains continue to be reported. One mature ram was observed this past summer in the Petersen Mountains. Another report of several rams was reported on Fort Sage Mountain late last year. The collared ewes from the 2007 sheep release are all still alive and well. One collared ewe remains south of the Big Canyon release site near Water Hole Canyon. Telemetry information indicates that many of the collared sheep have imprinted on good sheep habitat near Cottonwood and East Cottonwood Canyons. The mountain lion control project that was started in 2008 is ongoing. One large male lion was recently removed from the control area by the Wildlife Services lion hunter. Since the project was initiated in early 2008 there have been 6 lions removed from the northern portion of the Virginia Mountains. The 2010 population estimate for the Virginia Mountain bighorn herd has grown to 95 animals. Sufficient mature rams exist in the population to continue with a limited hunt and a similar quota of 2 tags will be recommended. Unit 031: Double H, Montana and Trout Creek Mountains; Humboldt County Report By: Ed Partee Survey Data Composition flights were conducted in the Double H, Montana and the Trout Creek Mountains during early October 2009. The timing of these flights was approximately 2 weeks later than previous flights. Flight time was limited during this survey period so an abbreviated survey was conducted in this unit. A total of 73 animals was observed which is significantly lower than the 5-year average. Much of this can be attributed to a lack of time spent in any given area. Ratios obtained from this survey were 161 rams:100 ewes:57 lambs. Despite the low sample size, ratios obtained from this survey showed good lamb production and strong ram recruitment. Sheep continue to increase throughout this unit. Habitat Drought conditions continue throughout all of Humboldt County. The past 3 winters have been very mild with moisture levels well below average. In June 2009, this unit received nearly 3 inches of precipitation which improved forage conditions over the short term. However, lack of winter
91
cc
CALIFORNIA BIGHORN
precipitation, has resulted in reduced spring runoff and below average soil moisture. Warm temperatures in January 2010 resulted in early green-up that provided only minimal amounts of forage during this time period. These warm periods experienced during past winters have accelerated evaporation and added to the lack of soil moisture resulting in dusty dry conditions. Population Status and Trend This population has shown a steady increase in numbers since the first hunt in 1996. The 2010 population estimate is 190 animals and is up slightly when compared to last year’s estimate of 180 animals. The Double H Mountains have shown steady increases over the last 2 years due to good production and recruitment. The bulk of the animals observed during surveys this year were located in the Double H Mountains. Two of the rams harvested this past year came out of the Double H Mountains which is the first year an animal has been harvested in this area. These animals were transplanted to this area in 2003 and the population has increased yearly. The Montana Mountains are still producing good numbers of lambs each year and animals are dispersing throughout both ranges. Several small ram groups were observed in the Trout Creeks. Exploration activities associated with a future mining operation may cause some displacement of bighorn. Several animals have been collared and monitoring is taking place to see what affects exploration may have on these populations. This monitoring project should allow for the observation of movement taking place between ranges as well as lambing areas within this unit. Unit 032: Pine Forest Range and McGee Mountain; Humboldt County Report by: Ed Partee Survey Data Aerial surveys were conducted in early October 2009, approximately 2 weeks later than normal. McGee Mountain, Pueblos, and the Pine Forest Range were surveyed with most of the sheep observed in the Pine Forest Range. A total of 166 sheep was classified as 35 rams, 89 ewes, and 42 lambs with a ratio of 39 rams:100 ewes:47 lambs. This is the second highest number of sheep ever observed during surveys in this unit. The lamb ratio was slightly below the 5-year average while the ram ratio was the lowest recorded since the late 90’s. Habitat Below average winter precipitation continues to plague northern Humboldt County. In June 2009 approximately 3 inches of rain was received in this unit. These rains provided temporary relief at a critical time of the year. Vegetation in the area is showing signs of stress due to the lack of moisture. Declining lamb production rates over the last 3 years may be an indication that drought conditions are affecting production and recruitment rates of bighorn is this unit. Two water developments were built within this unit during the last year. These units will provide additional habitat that was unusable in the past due to a lack of water. Observations have already been made that indicate sheep are using these new guzzlers. Population Status and Trend Sheep numbers in this unit remain comparable to last year at approximately 200 bighorn. Surveys indicate that all age classes are well represented and lamb production and recruitment has been strong which has provided for steady increases in this population. Current drought conditions and the effects it is having on vegetation and water availability throughout Humboldt County may create problems for this population and others as sheep densities increase. There is currently a good contingent of older age class rams in this population.
92
cc
CALIFORNIA BIGHORN
Unit 033: Sheldon National Wildlife Refuge; Washoe and Humboldt Counties Report by: Chris Hampson Harvest Results All 5 bighorn sheep tag holders, from the 2009 hunting season, reported being successful. The average age of the harvested rams was 6.8 years and the 5 hunters expended an average of 8.4 days to harvest their rams. The Boone & Crockett scores ranged between 143 and 163 inches. Age class data and Boone and Crockett scores of the rams show that mature rams are available and present in the population. However, hunters will generally have to expend more days hunting in Unit 033 to harvest their rams than hunters in surrounding hunt units. Survey Data Bighorn sheep surveys on the Sheldon were conducted in early September in conjunction with pronghorn surveys. A total of 33 bighorn was classified with a computed ratio of 39 rams:100 ewes:44 lambs. Lamb ratios observed this year are near long-term averages for this herd. Ram ratios are known to be much higher than the survey sample provided. The computer model ram ratio is estimated at 73 rams per 100 ewes. Four of the 7 rams observed during the survey were aged at 6+ years. Habitat Several years of drought have negatively affected habitat conditions on the Sheldon. Most major water sources are completely dry by the end of summer. Lake beds located on upper elevation tables have also been dry by late in the summer. Spring sources have gone dry and suffered reduced flows. Forage quality is poor due to extended drought. Drought conditions increase the competition between horses and bighorn. Feral horses consider water sources part of their territory and do not allow bighorn or pronghorn access to the water. As of April 1, 2010, the Sheldon Snotel site near Guano Rim shows the area to be well below average for both snowfall and overall precipitation. So far this water year, which begins October 1, the area has received 4.7 inches of rainfall. The long-term average for the site is 9.99 inches of rainfall per year (since 1990). At this same time last year, the Snotel site showed 5.1 inches of rainfall. Significant moisture is needed between April and September or the 2009-2010 water year will once again be below average. Over the last decade the Sheldon has experienced more dry years (below average) than normal or above average water years. Population Status and Trend Despite the persistent drought conditions, bighorn on the Sheldon continue to do fairly well. The 44 lambs per 100 ewes are near the long-term average recruitment level for this herd. Harvest records continue to show that mature rams are available for harvest. The Sheldon bighorn population continues on an upward trend and is now estimated at 210 animals. The population model for the Sheldon bighorn herd shows a 5% growth rate. Unit 034: Black Rock Range; Humboldt County Report by: Ed Partee Survey Data Aerial surveys were conducted in the Black Rock Range during mid September 2009. A total of 95 animals was classified as 28 rams, 43 ewes, and 24 lambs. These numbers yielded a ratio of 65 rams:100 ewes:56 lambs. Both the ram ratio and the lamb ratio were up from what was observed last year. The number of animals classified is well within the 5-year average for this unit. Sheep continue to do well in this range with good age structure for the rams. Sheep are well distributed throughout the
93
cc
CALIFORNIA BIGHORN
range. Increase use is being observed in both Coleman Creek as well as Rough Canyon. The number of sheep around Big Mountain remains stable with several mature rams classified. Despite the number of rams that have been harvested the last several years, many mature rams are still being observed during surveys. Habitat Dry conditions persist within this unit. Moisture receipts during the 2009-10 winter were below average. During June 2009 approximately 2.5 inches of rain was received which provided some short term relief. Despite dry conditions sheep in this unit have been doing well over the last several years. During flights in September, it was very evident that competition for water was occurring between horses and wildlife and in particular bighorn. In January 2010 BLM removed approximately 400 horses from the Black Rock Range. This removal should reduce competition for both forage and water. Monitoring of wildlife and horse numbers will continue and information gathered will be shared with the Bureau of Land Management. Population Status and Trend Sheep numbers in this unit remain comparable to last year at approximately 200 bighorn. Several years of low lamb recruitment from 1999 through 2002 is becoming evident in the older age classes. There is a strong age class between 3-5 years of age and an increase in lamb ratios over the last several years has kept this population stable. Sheep are dispersing well throughout this range providing plenty of opportunity for harvest in several different locations. The highest densities of bighorn can be found in association with Big Mountain, Coleman Creek, and the Rough Canyon area. Hunter access has been altered by the designation of the Black Rock/High Rock Immigrant Trail National Conservation Area (NCA) and Wilderness Areas within the NCA. The BLM has marked the majority of the restricted access points and hunters who apply for this area need to understand these restrictions. Despite access issues in this area, hunter success has been good in this unit. Unit 035: Jackson Mountains; Humboldt County Report by: Ed Partee Survey Data Aerial surveys were conducted during mid September 2009. A total of 47 sheep was classified as 12 rams, 22 ewes and 13 lambs that resulted in a ratio of 55 rams: 100 ewes: 59 lambs. Both lamb and ram numbers were above the 5-year average. Habitat Drought conditions continue throughout all of Humboldt County. The past 3 winters have been very mild with moisture levels well below average. In June 2009, this unit received nearly 3 inches of precipitation which improved forage conditions over the short term. However, lack of winter precipitation, has resulted in reduced spring runoff and below average soil moisture. Warm temperatures in January 2010 resulted in early green-up that provided only minimal amounts of forage during this time period. These warm periods experienced during past winters have accelerated evaporation and added to the lack of soil moisture resulting in dusty dry conditions. A horse gather that took place in 2007 has helped reduce competition for available forage and water. Population Status and Trend An augmentation to this population took place in early January 2010. Fifteen California bighorn sheep captured in the Granite Range and High Rock Canyon area of Washoe County were released on the west side of the range below King Lear Peak. With this addition and a reduction in horse numbers perhaps
94
cc
CALIFORNIA BIGHORN
this population will show improvements in the near future. Harvest this past year showed a slight increase in the quality of animals harvested. Continued monitoring for both released and existing animals will determine the success of these changes. Hunter access has been influenced by the designation of the Black Rock/High Rock Immigrant Trail National Conservation Area and Wilderness Areas (NCA). The NCA boundaries embrace bighorn concentration areas of King Lear Peak and Parrot Peak. The Bureau of Land Management (BLM) has marked the majority of the restricted access points and hunters who apply for this area need to understand these restrictions. Unit 051: Santa Rosa Range; Humboldt County Report by: Ed Partee Survey Data Aerial bighorn sheep surveys were conducted during mid September 2009 over a 2-day period in the Santa Rosa Range. A total of 90 bighorn was observed which was an increase from the previous year and well above the 5-year average. There were 19 rams, 44 ewes, and 27 lambs observed yielding a ratio of 43 rams:100 ewes:61 lambs. Lamb production looked good while ram numbers remained low. Of the 19 rams observed only one was a mature ram. During surveys in the Hinkey Buttermilk area 10 animals were observed and 2 of the 10 had white ear tags from a previous release in the Martin Creek Drainage. Twenty-seven bighorn were located in the Buckskin area after considerable effort was made to find sheep in the north end of the range. Sheep numbers in the north end of the range remain well below historic highs. Sawtooth Mountain continues to support the bulk of the bighorn sheep in the Santa Rosa Range. Habitat Drought conditions continue throughout all of Humboldt County. The past 3 winters have been very mild with moisture levels well below average. In June 2009, this unit received nearly 3 inches of precipitation which improved forage conditions over the short term. However, lack of winter precipitation, has resulted in reduced spring runoff and below average soil moisture. Warm temperatures in January 2010 resulted in early green-up that provided only minimal amounts of forage during this time period. Population Status and Trend Lamb production observed during aerial surveys suggest that there should be a strong increasing trend in this population over the last 5 years yet sample sizes and mature rams available to harvest have not increased. Bighorn numbers observed in the north end of the range remain well below historic highs. Recent radio collaring of bighorn in this range indicate movement of bighorn from Nevada into Oregon. A single ram collared last year moved fifteen miles into Oregon. Population estimates of bighorn in this range have shown slight increases over the last 5 years but remain 30 to 40 percent below historic highs observed during the late 1990’s. Additional animals have been radio collared on the north end range and monitoring work will continue to follow movement patterns between Oregon and Nevada. Units 066, 068: Snowstorm and Sheep Creek; Western Elko and Northern Lander and Eureka Counties Report by: Ken Gray Harvest Results Six tags were available in 2009 for combined Units 066 and 068 including a non-resident tag. Five of the 6 hunters were successful in harvesting a ram. Three of the rams were harvested in Unit 066 and 2
95
cc
CALIFORNIA BIGHORN
96
were taken in Unit 068. The average age for the 5 rams was 6.2 years and the average B&C score was 150. Survey Data A helicopter survey was conducted in Unit 066 in August of 2009. A total of 98 bighorns was classified; yielding sex and age ratios of 43 rams:100 ewes:49 lambs. In Unit 068 a group of 43 bighorns was classified from the ground in January of 2010 yielding ratios of 15 rams:100 ewes:50 lambs. Habitat A change in the grazing system in the upper portion of the South Fork of the Little Humboldt River drainage has vastly improved habitat conditions which encompasses some of the bighorn habitat in Unit 066. The west side of the range however has been impacted by fires and livestock grazing. Population Status and Trend Good lamb production facilitated growth in both herds. The combined population estimate is approximately 210 sheep which represents an increase of about 20 animals over last year’s estimate.
cc
ROCKY MOUNTAIN BIGHORN
ROCKY MOUNTAIN BIGHORN SHEEP Unit 074: The Badlands; Elko County Report by: Kari Huebner Harvest Results Two tags were offered in the unit for the 2009 season, 1 resident and 1 non-resident. Both hunters were successful in harvesting rams during the 2009 hunting season. One of the rams was 7 years old and the other 6 years old. The non-resident tag will not be offered for the 2010 hunting season. Survey Data A composition survey was conducted in February 2010. A total of 46 bighorns was classified. The resulting sex and age ratios were 48 rams:100 ewes:22 lambs. Almost twice as many bighorns were classified on this year’s survey however the resulting ram and lamb ratios were both lower than last year. Habitat There was a small burn (Black Mountain Fire) in the southern area of the unit and a larger 1 (Scott Creek Fire) in the northern portion of the unit in 2007. These fires are expected to have minimal affect on this bighorn herd. Population Status and Trend This bighorn herd appears to be stable. Bighorn herds in the nearby East Humboldt and Ruby Mountain ranges experienced a significant disease event this past winter. A special survey effort was made to see if the outbreak was occurring in this population. No sick or dying sheep were observed during the flight however lamb ratios were lower than expected. The herd will be continually monitored for health. The last detectable die-off event for these bighorn was in 1999 and the population has since recovered back to pre-disease levels. Unit 091: Pilot Peak; Elko County Report by: Kari Huebner Harvest Results A single tag will be offered to a Utah resident this year. Survey Data A composition survey was conducted in July 2009. A total of 61 bighorns was classified. The resulting sex and age ratios were 70 rams:100 ewes:96 lambs. This was the largest sample of bighorn classified in the herd since 1993. Habitat A big game water development was built in the Leppy Hills in 2008. A rebuild of an older saucer style of water development is scheduled this summer. These alternative water sources will hopefully enable the bighorns to stay in the mountains, instead of seeking water in nearby town of Wendover or traveling down to the salt flats. Population Status and Trend Twenty bighorn were released into Unit 091 in 1987 near Miner’s Canyon. In 1998, and additional 32
97
ROCKY MOUNTAIN BIGHORN
bighorns were released into the unit. The sheep for the initial release were from Basalt, Colorado and the 1998 release was a combination of sheep from the Contact and East Humboldt populations. Unit 091 is managed cooperatively between Utah and Nevada. A hunting season has not been offered since 1997. It was thought that a combination of predation and a possible disease outbreak caused this herd to decline drastically. In an effort to facilitate mountain lion hunting by sportsmen from both Utah and Nevada to encourage lion hunting, a separate mountain lion quota was set for Pilot Mountain. For the most part this has not resulted in an increase in lion harvest mostly because lion densities are low and hunters have to spend too much time with little success. Recent surveys indicate that this herd is healthy and stable. Since the last tag was offered to a Nevada hunter, this year’s tag will be allocated to a Utah hunter. If the population remains stable a tag may be offered in both states in future seasons. Unit 101: East Humboldt Range; Elko County Report by: Caleb McAdoo Tag Quotas and Harvest Results In 2009, 4 sheep tags were issued for Unit 101, 1 less than the 2008 quota. Each of the tag holders was successful in harvesting a ram. For specific 2009 hunting season results, please refer to Harvest Tables in the Appendix Section. Survey Data In late December of 2009, prior to winter surveys, Department of Wildlife biologists confirmed a bacterial pneumonia disease was running its course in the bighorn sheep herd in Unit 101. As such, typical aerial surveys were not conducted in this area in order to minimize stress on the animals. Various ground surveys have been conducted during the disease event since December 2009. Despite initially observing over 130 sheep in Unit 101, as of April 2009, these data are irrelevant for depicting current population status due to high mortality realized from the bacterial pneumonia infection. Weather and Habitat Spring and summer moisture appear to have provided high quality forage on the summer range and hunter reports confirmed the animals should have been going into the fall/winter in good body condition. The winter, however, provided atypical conditions on the primary winter range in the East Humboldt Range. For much of the winter season, bare slopes were present to over 9,000 feet in elevation, providing the opportunity for the sheep to utilize areas outside of what is normally available due to excessive snow accumulation. These favorable conditions decreased densities typically seen on the winter range and sheep were more evenly distributed across the landscape. Despite these ideal conditions, large temperature fluctuations and inconsistent moisture patterns likely exacerbated the effects of the pneumonic outbreak. The snowpack is currently above average and as such, the Rocky Mountain bighorn sheep which survive the pneumonic disease event should continue to benefit from high quality forage on summer range in the East Humboldt’s. Due to the overall population reduction, habitat resources will be more readily available on winter range and will minimize any intra-specific competition or habitat impacts due to bighorn sheep. Population Status and Trend As discussed above, the bighorn sheep population in the East Humboldt Range experienced a catastrophic pneumonic disease event in the winter of 2009-2010. This was the first measureable disease event in Unit 101 since the sheep were released in 1992, including the 1995-96 winter when the adjacent bighorn population in Unit 102 experienced considerable loss from a similar pneumonic die-off. The herd had been showing a strong growth trend from the original 35 animals released in 1992 to an estimated 180 animals in 2009. The observed mortality rate attributable to pneumonia as of April, 2010 was 41 percent and included 21 rams, 48 ewes, and 5 lambs. Both mature and immature animals alike had succumbed to the
98
ROCKY MOUNTAIN BIGHORN
disease. Ongoing monitoring suggests mortality rates of between 60 and 80 percent across all age classes and sexes have occurred during the 2009-2010 winter. It is anticipated poor lamb recruitment will be realized in the next several years to come, initially suppressing population growth. The Department of Wildlife is conducting ongoing monitoring efforts to help better understand the extent this disease outbreak has had on the population and to attempt to identify causal agents or catalysts that may have been involved. To that end, thirteen sheep in Unit 101 have been outfitted with radio collars to monitor movements, lambing recruitment, and survival. These animals will be used to gauge overall herd health and to conduct individual follow-ups for health assessments. Unit 102: Ruby Mountains; Elko County Report by: Caleb McAdoo Tag Quotas and Harvest Results Three tags were issued in 2009, down 1 tag from 2008. All 3 of the tag holders were successful. For specific 2009 hunting season results, please refer to Harvest Tables in the Appendix Section. Survey Data In early December of 2009, prior to winter surveys, Department of Wildlife biologists confirmed a bacterial pneumonia disease was running its course in the bighorn sheep herd in Unit 102. Aerial surveys were kept at a minimum during the initial investigation to determine what extent the disease may have affected the herd. Brief aerial helicopter surveys were conducted in some of the remote winter ranges in Unit 102. The low number of observed animals during these surveys along with ground survey observations confirmed the worst – bacterial pneumonia was present in sheep in all of the major wintering areas. Aerial and ground surveys initially identified over 70 sheep within Unit 102; however, these data are irrelevant for depicting current population status due to high mortality realized from the bacterial pneumonia infection. Weather and Habitat Spring and summer moisture appear to have provided high quality forage on the summer range and hunter reports confirmed the animals should have been going into the fall/winter in good body condition. However, the winter provided atypical conditions on the primary winter range in the Ruby Mountains. For much of the winter season, bare slopes were present to over 9,000 feet in elevation, providing the opportunity for the sheep to utilize areas outside of what is normally available due to excessive snow accumulation. These favorable conditions decreased densities typically seen on the winter range and sheep were more evenly distributed across the landscape. Despite these ideal conditions, large temperature fluctuations and inconsistent moisture patterns likely exacerbated the effects of the pneumonic outbreak. The snowpack is currently above average and as such, the Rocky Mountain bighorn sheep which survive the pneumonic disease event should continue to benefit from high quality forage on summer range in the Ruby Mountains. Due to the overall population reduction, habitat resources will be more readily available on winter range and will minimize any intra-specific competition or habitat impacts due to bighorn sheep. Population Status and Trend Prior to the winter of 2009-2010, the bighorn sheep population in the Rubies was recovering very well from a die-off that occurred in 1996. Unfortunately, disease has yet again stricken the Rocky Mountain bighorn sheep in the Ruby Mountains. As of April, 2010 the observed mortality rate was 17 percent and included 14 rams, 8 ewes, and 6 lambs. Both mature and immature animals alike had succumbed to the disease. Although the observed mortality percentage is lower than that observed in the adjacent Unit 101, it is likely a result of a decrease in detection rate rather than actual mortality. The terrain is less conducive for finding deceased animals than that of the winter range in Unit 101. Similar to what was seen during
99
ROCKY MOUNTAIN BIGHORN
the past disease event, it is anticipated poor lamb recruitment will be realized in the next several years to come, initially suppressing population growth. The Department of Wildlife is conducting ongoing monitoring efforts to help better understand the extent this disease outbreak has had on the population and to attempt to identify causal agents or catalysts that may have been involved. To that end, twelve sheep in Unit 102 have been outfitted with radio collars to monitor movements, lambing recruitment, and survival. These animals will be used to gauge overall herd health and to conduct individual follow-ups for health assessments. Unit 114: North Snake Range – Mount Moriah; Eastern White Pine County Report by: Curt Baughman Harvest Results Two tags were available again in 2009. Two rams were harvested including a 7 year-old and a 10 year-old. This follows the 2008 harvest of 2 rams aged at 3 and 8 years. The 1 tag offered in 2007 was the first since 1991 and resulted in the harvest of 1 7-year-old ram. Survey Data In March 2010, a helicopter bighorn survey was flown in combination with a spring deer and elk survey. Conditions for the survey were very good and 51 bighorn were classified. The resulting sex and age ratios were 59 rams:100 ewes:17 lambs. In comparison, the 2008 postseason helicopter survey resulted in the classification of 38 bighorn with sex and age ratios of 55 rams:100 ewes:35 lambs. Weather and Habitat Wet conditions returned in 2009 bringing some relief from 2-1/2 years of drought. June and July brought twice the average precipitation and the year ended with 115% received at Ely according to the National Weather Service. Monitoring equipment at higher elevations (Snotel Sites) recorded similar results. Habitat conditions began to recover from the crippling effects of drought. Forage, cover and water distribution were improved for both the high elevation summer range and winter ranges at lower elevations. The winter of 2009-10 brought above-average snowfall and overall precipitation. Because of persistent cold temperatures, most areas experienced continual snow-cover from mid December through late February. This was not a serious issue for the low elevation winter range where winter conditions were prone to moderation. As of early April 2010, the water-year moisture total for Ely stands at over 110%, with local Snotel sites reporting between 115% and 120%. It appears that east-central Nevada will have a slow-melting snowpack which bodes well for vegetative conditions and water distribution during the upcoming summer. Snowbanks will persist at high elevations long into the summer. This will provide water availability and enhanced forage resources. Habitat conditions should be superior to those seen for many years. Longer term habitat limitations are related to the dense band of mixed conifer and mountain mahogany that effectively separate seasonal ranges in much of the area presently occupied by bighorn. The use of prescribed fire and managed natural fire are key components to future habitat modifications that could benefit bighorn sheep in this unit. Population Status and Trend In January 2006, this herd was augmented with 30 bighorn sheep from the East Humboldt Range in Elko County. This provided a population boost. Unfortunately lamb recruitment declined with the drought of 2007-08. The benefits of increased 2009 precipitation came too late to influence strong lamb production. In addition, telemetry surveys of radio-marked ewes documented increasing rates of mortality in 2008 and 2009 with mountain lion predation being the cause of at least half of these. Wildlife Services removed 3 male lions that had been frequenting bighorn winter range during the 2009-10 winter. The increased rate of predation may have been related to the downward trend in the Unit 114-115 deer population and a shift in prey selection. No additional losses of collared ewes have occurred since late 2009. The persistent snow-cover of the past winter facilitated an increase in lion harvest from the Snake Range. A total of 14
100
ROCKY MOUNTAIN BIGHORN
101
lions was removed by sport hunters and Wildlife Services from March 2009 through February 2010. This is an impressive total for this unit-group considering the presence of a National Park that covers much of this unit where no hunting is permitted. The removal of that many lions is likely to reduce lion predation on bighorn sheep. The combination of lion removal and improving habitat conditions should result in increased lamb production and overall survival of bighorn in 2010. Population modeling indicates a slight decrease in the 2010 base population. The number of mature rams in the population is sufficient to sustain continued harvest. As a part of the efforts to understand the recent bighorn pneumonia outbreak in the Ruby and East Humboldt Ranges, 3 marked ewes from the East Humboldt Range that were part of the 2006 Mt. Moriah release compliment were recently recaptured, sampled and released. Samples tested positive for Mycoplasma ovipneumonia. Mycoplasma is a bacterium that appears to predispose bighorn to pneumonia outbreaks under certain conditions. To date, no bighorn pneumonia outbreaks have ever been documented in Snake Range bighorn sheep.
MOUNTAIN GOAT
102
MOUNTAIN GOAT Unit 101: East Humboldt Mountains; Elko County Unit 102: Ruby Mountains; Elko County Unit 103: South Ruby Mountains; Elko and White Pine Counties Report by: Caleb McAdoo Tag Quotas and Harvest Results There were 27 general season mountain goat tags and 1 PIW tag available in the 2009 season. Of the 27 goats harvested, 30% were nannies in 2009. The percentage of nannies in 2008 was 22%, and 21% in 2007. For the last 3 years, the percent of nanny harvest of the total goats harvested has been above the long-term average of 17%. Success continues to be good and most hunters reported seeing many goats in the 2009 season. For specific 2009 hunting season results, please refer to Harvest Tables in the Appendix Section. Survey Data Mountain goat surveys were performed in February 2010. A total of 190 goats was observed and classified in Units 101 and 102. Due in part to inclement weather during surveys, no goats were observed in Unit 103. In Unit 101, 88 goats were observed, yielding a ratio of 17 kids:100 adults. In Unit 102, 102 goats were observed, yielding a ratio of 34 kids:100 adults. Weather and Habitat Goats live amongst the highest, rockiest, and steepest slopes in the mountains. Fortunately, snow banks accumulate throughout the winter and sustain preferred forage for goats during most of the hot and dry summer months. Even in the dry years with little precipitation, sufficient snow usually falls in the high country to facilitate goat survival. As of April 2010, the snowpack remains well above average and should provide the goats with adequate high quality forage on summer range. Many of the snow banks on which they depend should persist through the summer. The goats in Nevada, like most goat populations, are more limited by winter range and heavy spring snow loads that cover their forage, limit their movements, or increase their chances of fatalities from falls and avalanches. The 2009-2010 winter was relatively mild and as long as moderate winters persist and sufficient snowfall occurs in the upper elevations, goat populations should benefit from good habitat conditions. Population Status and Trend This year, goat populations in both Units 101 and 102 experienced increased mortality caused by bacterial pneumonia. For Unit 103, it is uncertain as to exactly what extent the bacterial pneumonia may have affected the population. However, it is anticipated that Unit 103 likely experienced similar mortality as did Units 101 and 102. Prior to this year, all three Units (101, 102, and 103) had been exhibiting a stable to slightly upward trend. However, this year, populations are believed to be exhibiting a substantial decline (estimated at 30 percent) attributable to the disease. Recruitment was also significantly lower over last year’s observations for both Units 101 and 102. Hunters who observe any abnormal animal behavior in wild goats such as coughing, abnormal nasal discharge, etc. should report their findings to the Nevada Department of Wildlife.
MOUNTAIN LION
MOUNTAIN LION Western Region Areas: 1, 2, 3, 4, 5, 18, 19, 20, and 29 Report by: Carl Lackey Harvest Results Referencing all available reports for this report period, March 1st, 2009 through February 2010, biologists have recorded 47 mountain lion mortalities for the Western Region (Table 1). This includes 33 animals taken under valid sport tags and 12 by USDA - Wildlife Services. The sport harvest declined relative to the previous season (Table 2).
Table 1. Western Region mountain lion harvest limits and mortalities by type for 2009-2010.
Unit Harvest Limit
Harvest Type Sport Depredation Other Total
011-015
Regional 103
6 6 0 12 021-022 1 1 0 2
031,32,34,35 2 2 0 4 041-045 5 0 0 5
051 4 0 0 4 181-184 4 0 0 4
192,194-196 7 0 0 7 201-206 3 3 2 8
291 1 0 0 1 Totals 103 33 12 2 47
Table 2. Western Region mountain lion sport harvest by unit for 2009-10 and the previous 5 years.
Unit 2004-05 2005-06 2006-07 2007-08 2008-09 Previous 5 yrs Average 2009-10
The sport harvest consisted of 19 male lions and 14 females, with average ages of 4.4 and 3.4 years, respectively (Table 3). The total of 33 lions killed during the sport hunt is the lowest in 5 years and is about 23% below the 5-year average (Table 2). Roughly 50% (16 of 33) of sport hunters hired professional guides and the lions taken by these hunters averaged 3.4 years old, similar to unguided hunters. Nevada residents took 21 of the lions through the sport harvest while non-resident hunters killed 12. Time spent by hunters actively hunting lions is measured by the number of days hunted. The average for the 2009-2010 season was 2.6 days/hunter. While hunting with hounds is typically the method most often employed by lion hunters there are some that hope to fill their tag while hunting some other type of big or small game. This type of incidental harvest is infrequent, and there were no reported mortalities in this
103
MOUNTAIN LION
harvest category during the report period. Typically most of the cougars killed under authority of a sport tag are taken from fall to late winter when climatic conditions favor hound hunting. Not surprisingly, there were no lions killed by licensed tag holders between March and October 2009. This is usually the case and is a clear indication that the year-around season has had little effect on total sport harvest. However, the 365-day season does mean that the potential exists for lions to be pursued year-around. Table 3. Western Region mountain lion sport harvest - sex and age comparisons since 1999.
Season/Year Harvest Average Age
# Males # Females Ratio Male:Female Males Females All Lions
(note: two unknown sex mortalities in 08) The United States Department of Agriculture’s Wildlife Services personnel killed 12 lions with a sex ratio of 4 males and 8 females. The average age of these lions was 3.3 years. Five of the 12 lions killed by Wildlife Services were depredating lions responsible for killing a total of 22 sheep with a total estimated value of $2,800.00. Three of these were taken on a ranch along the East Walker River in Area 20 – an area known for depredation issues with 15 lions killed on the ranch in the last 10 years. The other 7 lions taken by Wildlife Services were killed for predation management projects to protect ungulate populations. All salvageable lion hides from around the state are skinned, dried and sent to the Western Region where they are then sold at the Nevada Trapper’s Association’s annual fur sale in Fallon. A total of 22 hides was sold this year bringing an average price of $385 with a high of $647. Population Trend Population structure and trends are based on the available harvest data and reports from guides and hunters. Major shifts in sex ratios or age cohort representation are absent; suggesting the lion population in western Nevada is stable (Table 3). The 2009-2010 sport harvest and total harvest is well below the 10-year average (Table 4). Age cohorts seen in the harvest indicate adequate recruitment and/or immigration is occurring (Table 5). Lions, 2 – 4 years of age, considered being of dispersal age (not yet established in a particular home range), accounted for 64% of the total harvest. NDOW is currently working with the University of Nevada, Reno on a cougar research project in the Western Region. To date 12 lions in 4 different mountain ranges have been fitted with satellite collars for this project. DNA samples have been taken from harvested lions throughout the state and are being fingerprinted as a portion of the ongoing study to establish the genetic flow of mountain lions in Nevada. Corridors of lion immigration have been identified in the Western Region during a predation management project that has been in progress in the Granite Range in Unit 014 since 2005. Immigration of lions back into an area where active removal is taking place has revealed significant movement patterns for lions into that portion of the Region. Management Conclusions Although there are some yearly fluctuations within harvest categories, the average ages and ratio of males/females killed has not changed significantly over past years. As such, regulations and harvest limits
104
MOUNTAIN LION
should remain static until such time that the supporting data indicates a change is required. Results from the aforementioned UNR lion research and predation management projects may result in future harvest management strategies that may include establishing harvest limits specific to single units or unit groups. Table 4. Ten-year Western Region mountain lion harvest trend–all known mortalities.
Table 5. Western Region mountain lion sport mortality – age cohorts 2009-2010.
Sex
Age Kittens Dispersal Prime Adults Older Adults unknown 0.5 - 1.5 yrs 2 – 4 years 5 – 7 yrs 8 yrs +
Female 1 2 9 1 1 Male 0 0 12 7 0
Eastern Region: Areas 6, 7, 8, 9, 10, 11, 12, 13, 14, and 15 Report by: Russell Woolstenhulme Harvest Results The Eastern Region mountain lion harvest limit for the 2009-10 season was 143 lions. Four of those lions were allocated to Game Management Unit 091 (Pilot Peak) which exists as an interstate cooperative hunt with the State of Utah. The remaining objective of 139 was allocated to the remaining hunt units, which make up the Eastern Region. No area closures took place in 2009-10. Eastern Region sport harvest for mountain lions for the 2009-10 season was 74 animals (Table 1). The sport harvest for the previous year (2008-09) was 54. The 2009-10 sport harvest composition was 40 males and 34 females for a ratio of 1.2 males:female. The ratio for the 2008-09 season was 2.4. The average sport harvest for the previous five years (2005-2009) was 57 lions. Average sport harvest reported during those same 5 years averaged 43 males and 29 females for a ratio of 1.8 males:female. The total documented mountain lion harvest for the Eastern Region in 2009-10, including all known causes of take was 98 lions (including five road kills), with a total of 52 males and 46 females being removed from the population.
105
MOUNTAIN LION
Table 1 - Eastern Region sport harvest by area groups for 2009-10 and previous 5 years. Area Group 2004-05 2005-06 2006-07 2007-08 2008-09 2009-10
066 0 2 0 3 1 1
061-068 6 10 4 6 13 19
065 0 0 2 3 2 1
071-081 14 17 11 8 3 6
091 0 1 1 0 0 0
101,105,106,107 5 3 1 6 0 1
102,103,104,108 9 5 7 1 6 13
111, 112 10 8 7 8 7 9
113,114,115 3 4 5 3 6 8
121 2 5 7 1 3 6
131-134 2 0 0 2 0 3
141 0 0 1 1 2 0
142-145 5 2 7 7 4 6
151,152,154,155 3 2 3 6 7 1
Eastern Region Total 59 59 56 55 54 74 Depredation issues in 2009-10 resulted in the removal of 18 lions compared to 11 in 2008-09 (Table 2). Two of those lions were removed by USDA Wildlife Services at the request of NDOW for the protection of bighorn sheep. Depredation harvest for the previous 5 years (2005-2009) averaged 10 lions per year. Table 2 – All Eastern Region mountain lion mortalities by type/distribution for 2009-2010.
Totals: 143 74 18 6 98 Population Trend Mountain lion habitat remains in good condition throughout the Eastern Region with an ample prey base and minimal overall loss of habitat due to development activities. Range fires during previous summers converted tens of thousands of acres of deer habitat to vegetation dominated by grasses and annuals in
106
MOUNTAIN LION
the Eastern Region. Some important deer summer ranges and some key deer winter ranges burned. The future status and trend of deer herds in the burned areas will have the most significant impact on lion productivity and survivability. Documented mortality in the form of harvest and accidental loss has not exceeded the reproductive/recruitment capabilities of the mountain lion resource. The harvest limit for the Eastern Region has not been met in many years. Lion harvest has been under close scrutiny by sportsmen over the last few years. There is some concern over the quantity and quality of lions within the Eastern Region. A review of statistics within the region indicates that although some members of the sporting public may witness a locally reduced population (e.g., they are seeing fewer lions in their favorite canyon or hunting location), regionally the population is holding up well. Lion populations cannot be measured by merely adding up a yearly total of lions harvested. Too many factors such as weather conditions, level of interest, etcetera, affect annual hunting pressure and effort. A more reasonable measure of lion populations can be calculated utilizing the age and sex of harvested animals in a computer population model. Age and sex structure is a good measure of lion populations as over-harvest will result in obvious age structure changes. (e.g., number of mature males harvested will drop while number of adult females and sub-adult males increase). The average age of lions taken by sport hunters in the Eastern Region was 3.8 and has varied little in the past 10 years (10 year average age 4.1 years). The average age of all recorded lion mortalities was 3.8 and includes sport harvest, depredation harvest and other mortalities (Table 3). The overall sex ratio was 1.1 males:female compared to 2.1 males:female last year. Based on population estimates, sex and age ratios in the harvest, long-term harvest data analysis, and recorded mortality, the overall Eastern Region mountain lion population trend is considered to be stable (Tables 3 and 4). Table 3. Eastern Region sport harvest - sex and age comparisons since 1999.
Management Conclusions Hunter interest and participation remained high in the Eastern Region. As usual, the majority of lions were taken in December, January and February. Snow and tracking conditions were excellent in many areas of the Eastern Region during the 2009-10 season. The maximum recommended sport harvest limit for the Eastern Region was 143 lions and sport hunters took 74. No area closures took place in 2009-10. A remaining maximum recommended harvest limit of 69 lions was available to hunters in the Eastern Region. Population trends appear to be stable in the Eastern Region. Although small local populations may be depressed in some areas, there are sufficient base populations of lions to allow for adequate reproduction and population maintenance. The dispersal of lions from adjacent mountain ranges with little or no harvest mortality moderates the effects of harvest in more popular areas. The base populations of prey species on which mountain lions depend most heavily (deer) are currently at levels expected to continue to sustain lion populations.
107
MOUNTAIN LION
Table 4. Eastern Region mountain lion harvest trend – all known mortalities.
Season Year
Season Length
Harvest Limit
Sport Harvest
Depredation Harvest
Other Harvest
Total Harvest
2000-01 272 137 100 17 1 118
2001-02 365 150 98 7 3 108
2002-03 212 167 66 6 3 75
2003-04 365 167 115 9 0 124
2004-05 365 167 59 10 7 76
2005-06 365 167 59 6 5 70 Ten year 2006-07 365 167 56 12 6 74
2007-08 365 167 55 10 0 65
2008-09 365 167 54 11 3 68
2009-10 365 143 74 18 6 98
Averages 340 160 74 11 3 88 Southern Region: Areas 16, 17, 21, 22, 23, 24, 25, 26 and 27 Report by: Mike Scott Harvest Results The 2009-2010 mountain lion season ran from March 1, 2009 through February 28, 2010 in all areas of the Southern Region, with the exception of Area 28, which remains closed to mountain lion hunting. The harvest limits in all areas were combined to form a regional harvest objective of 60 lions. Table 1 displays a comparison of harvest for the last ten years. Table 2 displays the regional lion harvest for the March 1, 2009 – February 28, 2010 season. Table 1. Comparison of Southern Region harvest by area groups for the last 10 years.
Totals: 60 24 0 1 25 Regional sport harvest for the 2009-2010 season consisted of 24 lions which is similar to the 25 sport harvest lions taken during the 2008-2009 season. There was 1 non-sport lion mortality that occurred in Area 25 during the reporting period (Table 2). Regional depredation complaints have averaged 2.7 per year (range 0 to 9) during the last 10 seasons (2000-2010). Population Trend The 2009-2010 Southern Region mountain lion harvest consisted of 13 males and 12 females for a male to female ratio of 1.1. The 5-year average is 1.2. The average age of lions taken during the 2009-2010 season averaged 5.0 years for males (compared to 3.6 in 2008-2009) and 4.5 years for females (compared to 4.0 in 2008-2009). Number of lions taken decreased overall with no depredation harvest during 2009-2010. Average age and male to female ratio both increased compared to the previous year. The total harvest of 25 lions is slightly below the average of 29.2 over the last ten seasons (2000 – 2010). The Southern Region combined harvest was well below the 2009-2010 harvest limit of 60. Table 3. Southern Region sport harvest – sex and age comparisons since 1997.
Table 4. Ten-year Southern Region mountain lion harvest trend – all known mortalities.
Season Year
Season Length
Harvest Limits
Harvest Type
Sport Depredation Other Total
2000-2001 272 67 39 2 0 41
2001-2002 365 67 26 9 0 35
2002-2003 212 68 20 1 0 21
2003-2004 365 68 29 8 3 37
2004-2005 365 68 13 0 0 13
2005-2006 365 68 21 2 0 23
2006-2007 365 68 27 2 1 30
2007-2008 365 68 32 0 2 34
2008-2009 365 68 25 3 4 32
2009-2010 365 60 25 0 0 25
Averages: 340 67 26 2 1 29 Management Conclusions The sport harvest of mountain lions equaled the previous years’ sport harvest of 25 lions. No depredation lions were taken in the southern region during the reporting period. Above average precipitation should result in increased availability of prey species. Lions that prey on wild horses should be in exceptional health. The western portion of the Southern Region (Areas 16 & 17) accounted for 60% of the Southern Region lion harvest. In reviewing the harvest reports, it appears that hunters are observing multiple lion tracks during their hunts, indicating that additional lions are present. Overall, the conclusions to be drawn from the 2009-2010 harvest indicate that the mountain lion population in the Southern Region is stable.
BLACK BEAR
BLACK BEAR Western Region Report by: Carl Lackey Harvest The black bear is classified as a game animal in Nevada; however, the state does not currently hold a hunting season for this species. Following the mid-summer removal of General Fund monies from NDOW’s bear conflict response program, some changes occurred that affected when a physical response is warranted. Summarily, NDOW field personnel will now typically only set a bear trap if there is considerable damage occurring and/or if there is evidence of a heightened public safety threat, i.e. a bear breaking into homes. Often times the latter is at the discretion of responding personnel because of the underlying potential for human injury. Bear Management in Western Nevada This status report contains information for the calendar year 2009. This work is focused principally within Management Area 19 along the Carson Front. Specific data on all black bears handled by department personnel was first recorded in 1997 with a sample size of 5 individuals. Subsequent yearly samples for the last 10 years are depicted as follows in Table 1. The figures are comprised of all bears handled including recaptures and documented mortalities. Table 1. Bears handled in the Western Region, 2000-2009.
41 38 43 44 69 74 88 157 68 39 735 The data includes recaptured bears previously handled and marked in the same or preceding years. Conflicts Bear complaints decreased in 2009, for the second consecutive year. NDOW personnel handled approximately 248 complaints and reports of bears in the calendar year (Figure 1). Wildlife dispatch received about 200 of the total complaints. Approximately 50 calls went directly to the bear biologist, bypassing the dispatch center. Most bear complaints are handled by the wildlife dispatch center who provides advice over the phone without having to forward the call to field personnel.
Figure 1. Black Bear Complaints by Year, 2000 - 2009
In these cases the usual course of action is to offer advice on reducing bear conflicts through proper storage and disposal of garbage and removal of other attractants. However, if there is evidence of severe property damage or an increased risk to human safety then calls are forwarded to the bear biologist, or in his absence, a game warden. The majority of complaints received pertain to nuisance bears accessing
garbage. Other common complaints were bears breaking into garbage enclosures or sheds, damage to fruit trees, bears breaking into homes and vehicles and bears frequenting an area. All of these are directly related to bears having access to human foods, which historically accounts for >95% of the total number of calls received.
Figure 2. Black bear complaints in 2009 by county of origin.
Calls predominantly occurred during the summer months- 48%. Spring and autumn of 2009 were consistent with past years in that fewer calls were received during this time-11% and 38% of the calls respectively. Complaints were predominantly out of Washoe County (Figure 2), and most of these were from Incline Village which accounted for 38% of all calls received statewide. Property damage for the year was estimated at between $40,000 and $60,000. This figure was significantly higher than in past years
and can be attributed to 2 or 3 individual bears in the Incline Village area. These bears were typically entering garages and homes by ripping holes in the garage doors or pushing in and collapsing front or back doors to the houses. Actual damage was likely much higher given that many people do not report these incidences. (Note: as of this writing 2 of these bears have been removed, one in 2009 and one in 2010). Thirty-six individual bears were handled approximately 39 times (includes recaptures). Of the 36, 21 were new bears (those not previously captured or handled) and 15 were recaptures from this and previous years. Included are 6 bears that were captured for research purposes only. Comparatively, 18 bears were captured specifically in response to a conflict situation. Additionally, some bears were caught incidental to ongoing complaints but not necessarily as conflict bears. Sixteen of the 21 new bears handled were tagged and released, while 5 were documented as mortalities on the initial incident (unknown bears hit by vehicles, etc). An account of age cohorts for all new bears handled is summarized below in Table 2 which contains figures for both conflict and research captured bears. Most bears were either caught in culvert traps or by free-ranging capture techniques. The free-range captures were usually in response to requests for assistance from local law enforcement agencies. Table 2. Number sampled, age cohort and sex of all new bears for past 10 years with average age for adults.
Age cohort Sex 2000 2001 2002 2003 2004 2005 2006 2007 2008 2009
Cubs ≤ 12mo.
♂ 3 2 2 4 8 7 9 12 5 5
♀ 1 2 5 4 8 3 4 17 2 0
Sub-adults 1 – 3 yrs
♂ 7 8 4 4 7 9 8 25 12 4
♀ 2 2 3 5 1 5 6 11 4 3
Adults 4+ yrs / Avg. Age
♂ 12 @ 9.2
5 @ 6.4
6 @ 8.2
3 @ 7.0
2 @ 7.5
2 @ 6.5
17 @ 6.2
21 @ 7.6
5 @ 5.2
6 @ 5.2
♀ 5 @ 7.8
5 @ 7.8
8 @ 9.4
2 @ 7.5
6 @ 6.5
2 @ 11.0
5 @ 7.8
23 @ 8.9
1 @ 6.0
2 @ 13.5
112
CarsonOly,15%
WashCount,
65%
BLACK BEAR
The Departments public education program titled I’m Bear Aware – are you? has remained static over the last two years due to funding shortfalls. Handout materials are limited to stock on hand. Regardless, several public presentations were given throughout the year. There was only one documented depredation incident and this occurred in a remote area in the north end of the Sweetwater Mountains. A three year old female was captured after knocking over and eating honey from an unprotected apiary in Hoye Canyon. She was collared and released on-site. Mortalities There were only 14 documented mortalities recorded this year, the lowest in 6 years and less than half the amount in 2008 (Table 3). Nine of these were known bears (recaptures). The total consisted of 8 males, 5 females and 1 cub of unknown gender. Seven were killed as a result of collisions with vehicles. NDOW had to kill 3 female bears in deference to public safety for breaking and/or entering homes. Additionally, 3 bears were captured and euthanized as chronic nuisance bears under the 3-strikes policy including two males and a female. Anthropogenic reasons, other than legal hunting, are the leading cause of documented bear mortalities in Nevada. Table 3. Documented Mortalities 2000-2009
Marked Nevada bears killed in other states are not recorded in Table 1. There have been 14 such cases since 2001. Research
Satellite collars were deployed on 5 female black bears during 2009. They were all considered to be wildland bears with little or no known previous exposure to human foods, even though 2 of these had been captured prior in 2007. This aspect is important to this particular study as NDOW is verifying production of these wildland females and determining dispersal of their offspring. This information is central to the ongoing study between NDOW and the Wildlife Conservation Society which is investigating population source-sink dynamics of Nevada’s bears. Five additional collars will be deployed in 2010 for this project. Three publications were published since the last black bear status report. Carnivores, urban landscapes, and longitudinal studies: a case history of black bears appeared in the journal Human-Wildlife Conflicts in 2008; Using genetic relatedness to investigate the development of conflict behavior in black bears appeared in The Journal of Mammology, also in 2008; and Coexisting with black bears: perspectives from four case studies across North America was a working paper published by the Wildlife Conservation Society. NDOW was represented in all three with co-authorship.
113
BLACK BEAR
114
Expenditures Expenditures for the time period covered by this report include monies spent on drugs and medical supplies, bear trap maintenance, equipment and research supplies and the Bear Aware-public education program. Monies spent on controlled substances and capture supplies totaled $370.86. An additional $1956.63 was committed to bear trap maintenance and repair. No monies were spent on the Bear Aware program. For all operating accounts (Category 58) a total of $2518.99 was expended in calendar year 2009 for bear management related activities. Summary Given that the 2008 field season was considered mild for bear/human conflicts, this past season, 2009 was very slow in comparison. Spring precipitation helped, as it did in 2008, providing a boost to the grasses, forbs and berries favored by bears. Douglas County continues to readily enforce their trash ordinance, and that coupled with the removal of a chronic nuisance adult female bear in the stateline area, reduced complaints from the region. Carson City passed a similar ordinance in the fall of 2009. Washoe County continues to dodge the issue but insists they are still considering it. Given that almost half of all bear conflicts occurred in Washoe County, the need for an ordinance requiring bear-proof trash containers is clearly evident. Nevada’s bear population appears to be at healthy and stable numbers based on data collected from captured bears, empirical data documented by NDOW biologists, harvest data collected by other states and from sighting data in Nevada. The latter, which may indicate an expanding population, eastward into Nevada, includes reliable sightings of bears and/or bear sign recorded from such places as the Santa Rosa Mountains (2007), Caliente (2005 & 2007), the Bull Run Mountains (2004), Jarbidge (2005), the Vya Rim (2004 & 2006), Fallon (2000), Goldfield (2007) and a few incidences of bears hit by cars on Highway 95 and 95-Alternate. Information gathered from tagged bears has proven enlightening over the last few years. Not only are some bears captured again in Nevada after being marked several years previous, as occurred this year, but some bears have traveled significant distances from Nevada and the area of initial capture. Harvest data from other states consists of the following: a dispersal age male bear tagged near Washoe Valley and later killed in the sport hunt 2 years later 20 miles north of Lakeview, Oregon; a nuisance bear shot by California authorities roughly 80 miles north of Susanville, California; and at least 2 other bears shot by California hunters after crossing the Sierra Nevada Range, 1 in Auburn and 1 closer to Sacramento. When compared with the record number of new bears captured by NDOW in 2007, new bears captured in subsequent years significantly decreased, suggesting Nevada’s bear population represents the far eastern edge of a core population in California. Further genetic analysis is needed to confirm this. Habitat fragmentation plus the loss of travel corridors and the resulting potential loss of genetic diversity are concerns for Nevada’s black bear population. Currently, viable and reproducing populations are thought to exist in the Carson Range (eastern Sierra Nevada), and the Pinenut, Sweetwater, Wassuk, Pinegrove and Virginia Mountains. Current estimates remain within the range of past years, between 200-400 animals. A population ecologist at the University of Nevada, Reno is analyzing mark/recapture data to shore up this estimate but results are not yet available. Further studies such as the current research study under way are needed in the more wildland areas to determine bear population densities and the age and sex structure of the population. It is believed that once this information is acquired it will be determined that Nevada’s bear population could support a small annual recreational harvest. In May of 2009, NDOW hosted the 10th Western Black Bear Workshop, a Western Association of Fish & Wildlife Agencies (WAFWA) sanctioned event in Reno. Near record attendance representing 4 countries and 19 U.S. states helped make the conference very successful.