61
........................................................................................................................ A P P E N D I X E N OI S E REPORTS
........................................................................................................................
A P P E N D I X E
N O I S E R E P O R T S

........................................................................................................................

........................................................................................................................
W O O D B U R Y H I G H L A N D S R E S I D E N T I A L D E V E L O P M E N T

........................................................................................................................

Prepared for:
Attn: Mike BranaghBranagh Development100 School StreetDanville, California 94526
Prepared by:
j.c. brennan & associates, Inc.
Luke Saxelby, INCE Bd. Cert.Vice PresidentBoard Certified, Institute of Noise Control Engineering (INCE)
Woodbury Highlands Residential Development
City of Lafayette, California
April 21, 2016
jcb Project # 2015-143
1287 High Street, Auburn, California 95603 * 530-823-0960 (p) * (530)823-0961 (f)

j.c. brennan & associates, Inc. Job # 2015-143
Environmental Noise AnalysisWoodbury Highlands – City of Lafayette, California
Page 1 of 9
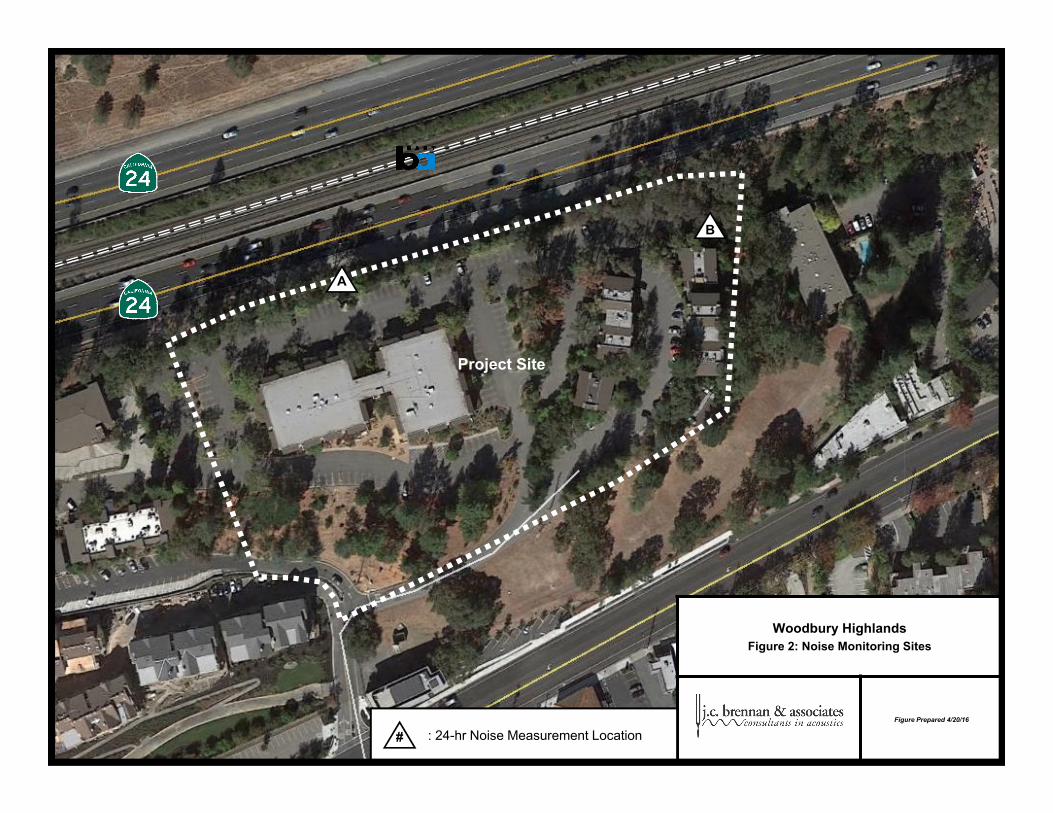
INTRODUCTION The Woodbury Highlands project consists of a 94-unit multi-family residential development located north of Mt. Diablo Boulevard and south of State Route 24 (SR-24). The project is located in the City of Lafayette, California. Figure 1 shows an aerial photo of the project site. Figure 2 shows the project site plan.
ENVIRONMENTAL SETTING
Fundamentals of Acoustics
Acoustics is the science of sound. Sound may be thought of as mechanical energy of a vibrating object transmitted by pressure waves through a medium to human (or animal) ears. If the pressure variations occur frequently enough (at least 20 times per second), then they can be heard and are called sound. The number of pressure variations per second is called the frequency of sound, and is expressed as cycles per second or Hertz (Hz). Noise is a subjective reaction to different types of sounds. Noise is typically defined as (airborne) sound that is loud, unpleasant, unexpected or undesired, and may therefore be classified as a more specific group of sounds. Perceptions of sound and noise are highly subjective from person to person.
Measuring sound directly in terms of pressure would require a very large and awkward range of numbers. To avoid this, the decibel scale was devised. The decibel scale uses the hearing threshold (20 micropascals), as a point of reference, defined as 0 dB. Other sound pressures are then compared to this reference pressure, and the logarithm is taken to keep the numbers in a practical range. The decibel scale allows a million-fold increase in pressure to be expressed as 120 dB, and changes in levels (dB) correspond closely to human perception of relative loudness.
The perceived loudness of sounds is dependent upon many factors, including sound pressure level and frequency content. However, within the usual range of environmental noise levels, perception of loudness is relatively predictable, and can be approximated by A-weighted sound levels. There is a strong correlation between A-weighted sound levels (expressed as dBA) and the way the human ear perceives sound. For this reason, the A-weighted sound level has become the standard tool of environmental noise assessment. All noise levels reported in this section are in terms of A-weighted levels, unless otherwise noted.
The decibel scale is logarithmic, not linear. In other words, two sound levels 10 dB apart differ in acoustic energy by a factor of 10. When the standard logarithmic decibel is A-weighted, an increase of 10 dBA is generally perceived as a doubling in loudness. For example, a 70 dBA sound is half as loud as an 80 dBA sound, and twice as loud as a 60 dBA sound.
Community noise is commonly described in terms of the ambient noise level, which is defined as the all-encompassing noise level associated with a given environment. A common statistical tool is the average, or equivalent, sound level (Leq), which corresponds to a steady-state A weighted sound level containing the same total energy as a time varying signal over a given time period (usually one hour). The Leq is the foundation of the composite noise descriptor, Ldn, and shows very good correlation with community response to noise.

Woodbury HighlandsFigure 1: Project Site Plan and Unit Designations
Figure Prepared 4/21/16
Vista Flats Units

Woodbury HighlandsFigure 2: Noise Monitoring Sites
Figure Prepared 4/20/16
Project Site
: 24-hr Noise Measurement Location #
A
B

j.c. brennan & associates, Inc. Job # 2015-143
Environmental Noise AnalysisWoodbury Highlands – City of Lafayette, California
Page 4 of 9
The day/night average level (Ldn or DNL) is based upon the average noise level over a 24-hour day, with a +10 decibel weighing applied to noise occurring during nighttime (10:00 p.m. to 7:00 a.m.) hours. The nighttime penalty is based upon the assumption that people react to nighttime noise exposures as though they were twice as loud as daytime exposures. Because Ldn represents a 24-hour average, it tends to disguise short-term variations in the noise environment.
Table 1 lists several examples of the noise levels associated with common situations. Appendix A provides a summary of acoustical terms used in this report.
TABLE 1 TYPICAL NOISE LEVELS
Common Outdoor Activities Noise Level (dBA) Common Indoor Activities
--110-- Rock Band
Jet Fly-over at 300 m (1,000 ft.) --100--
Gas Lawn Mower at 1 m (3 ft.) --90--
Diesel Truck at 15 m (50 ft.),at 80 km/hr. (50 mph)
--80-- Food Blender at 1 m (3 ft.) Garbage Disposal at 1 m (3 ft.)
Noisy Urban Area, DaytimeGas Lawn Mower, 30 m (100 ft.)
--70-- Vacuum Cleaner at 3 m (10 ft.)
Commercial AreaHeavy Traffic at 90 m (300 ft.)
--60-- Normal Speech at 1 m (3 ft.)
Quiet Urban Daytime --50-- Large Business Office
Dishwasher in Next Room
Quiet Urban Nighttime --40-- Theater, Large Conference Room (Background)
Quiet Suburban Nighttime --30-- Library
Quiet Rural Nighttime --20-- Bedroom at Night, Concert Hall (Background)
--10-- Broadcast/Recording Studio
Lowest Threshold of Human Hearing --0-- Lowest Threshold of Human Hearing
Source: Caltrans, Technical Noise Supplement, Traffic Noise Analysis Protocol. November, 2009.

j.c. brennan & associates, Inc. Job # 2015-143
Environmental Noise AnalysisWoodbury Highlands – City of Lafayette, California
Page 5 of 9
Effects of Noise on People The effects of noise on people can be placed in three categories:
Subjective effects of annoyance, nuisance, and dissatisfaction
Interference with activities such as speech, sleep, and learning
Physiological effects such as hearing loss or sudden startling
Environmental noise typically produces effects in the first two categories. Workers in industrial plants can experience noise in the last category. There is no completely satisfactory way to measure the subjective effects of noise or the corresponding reactions of annoyance and dissatisfaction. A wide variation in individual thresholds of annoyance exists and different tolerances to noise tend to develop based on an individual’s past experiences with noise.
Thus, an important way of predicting a human reaction to a new noise environment is the way it compares to the existing environment to which one has adapted: the so-called ambient noise level. In general, the more a new noise exceeds the previously existing ambient noise level, the less acceptable the new noise will be judged by those hearing it.
With regard to increases in A-weighted noise level, the following relationships occur:
Except in carefully controlled laboratory experiments, a change of 1 dBA cannot be perceived;
Outside of the laboratory, a 3 dBA change is considered a just-perceivable difference;
A change in level of at least 5 dBA is required before any noticeable change in human response would be expected; and
A 10 dBA change is subjectively heard as approximately a doubling in loudness, and can cause an adverse response.
Stationary point sources of noise – including stationary mobile sources such as idling vehicles – attenuate (lessen) at a rate of approximately 6 dB per doubling of distance from the source, depending on environmental conditions (i.e. atmospheric conditions and either vegetative or manufactured noise barriers, etc.). Widely distributed noises, such as a large industrial facility spread over many acres, or a street with moving vehicles, would typically attenuate at a lower rate.

j.c. brennan & associates, Inc. Job # 2015-143
Environmental Noise AnalysisWoodbury Highlands – City of Lafayette, California
Page 6 of 9
REGULATORY CONTEXT
Federal
There are no federal regulations related to noise that apply to the Proposed Project.
State
California State Building Codes
The State Building Code, Title 24, Part 2 of the State of California Code of Regulations establishes uniform minimum noise insulation performance standards to protect persons within new buildings which house people, including hotels, motels, dormitories, apartment houses and dwellings other than single-family dwellings. Title 24 mandates that interior noise levels attributable to exterior sources shall not exceed 45 dB Ldn or CNEL in any habitable room.
Title 24 also mandates that for structures containing noise-sensitive uses to be located where the Ldn or CNEL exceeds 60 dB, an acoustical analysis must be prepared to identify mechanisms for limiting exterior noise to the prescribed allowable interior levels. If the interior allowable noise levels are met by requiring that windows be kept closed, the design for the structure must also specify a ventilation or air conditioning system to provide a habitable interior environment
City of Lafayette General Plan Noise Element The City of Lafayette General Plan establishes an acceptable exterior noise level of 65 dB Ldn
for small decks and patios of multi-family residential uses. An acceptable interior noise level standard of 45 dB Ldn is also established for all residential uses. EVALUATION OF FUTURE TRAFFIC NOISE LEVELS AT THE PROJECT SITE Existing Traffic Noise Levels j.c. brennan & associates, Inc. staff conducted continuous 24-hour noise level measurements at the project site on Wednesday, May 13th 2015. See Figure 1 for noise measurement locations. A Larson Davis Laboratories (LDL) Model 820 precision integrating sound level meter was used for the ambient noise level measurement survey. The meter was calibrated before and after use with an LDL Model CAL200 acoustical calibrator to ensure the accuracy of the measurements. The equipment used meets all pertinent specifications of the American National Standards Institute for Type 1 sound level meters (ANSI S1.4). The sound level meter was programmed to collect hourly noise level intervals during the survey. The maximum value (Lmax) represents the highest noise level measured during each one-hour period, the average value (Leq) represents the energy average of all of the noise measured during each one-hour period, and the median value (L50) represents the sound level exceeded 50 percent of the time during each one-hour period.
j.c. brennan & associates, Inc. Job # 2015-143
Environmental Noise AnalysisWoodbury Highlands – City of Lafayette, California
Page 7 of 9
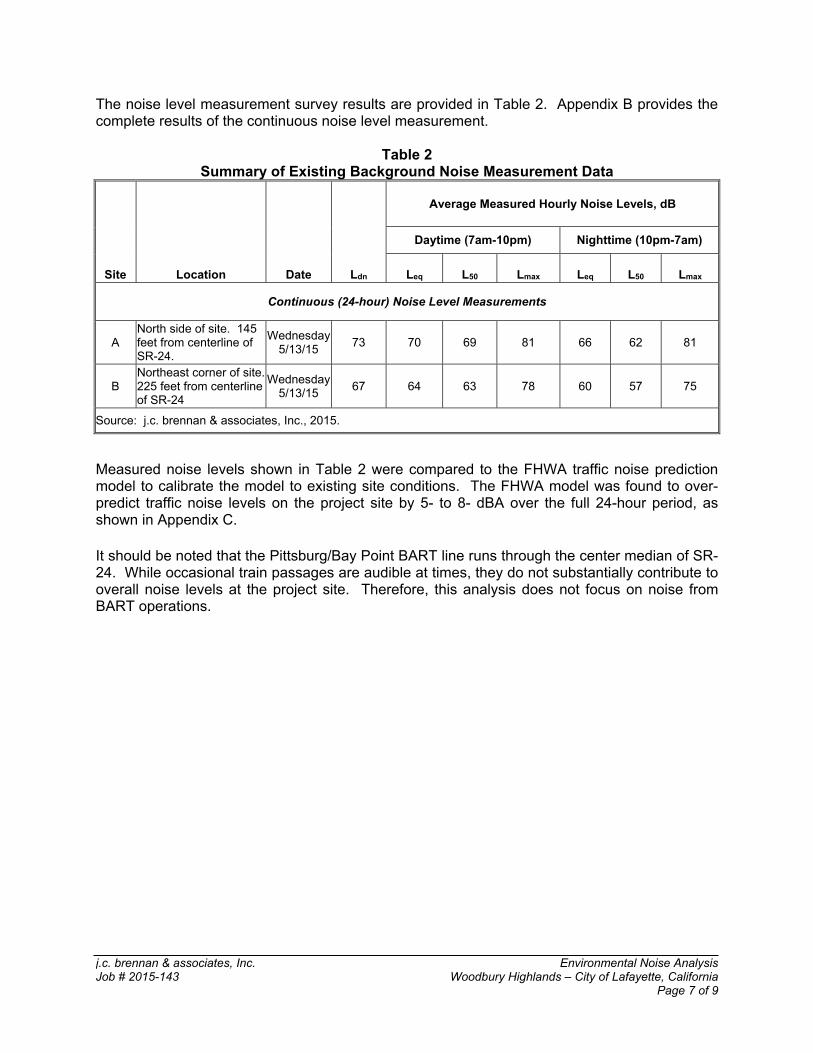
The noise level measurement survey results are provided in Table 2. Appendix B provides the complete results of the continuous noise level measurement.
Table 2 Summary of Existing Background Noise Measurement Data
Location Date Ldn
Average Measured Hourly Noise Levels, dB
Site
Daytime (7am-10pm) Nighttime (10pm-7am)
Leq L50 Lmax Leq L50 Lmax
Continuous (24-hour) Noise Level Measurements
A North side of site. 145 feet from centerline of SR-24.
Wednesday5/13/15
73 70 69 81 66 62 81
B Northeast corner of site. 225 feet from centerline of SR-24
Wednesday5/13/15
67 64 63 78 60 57 75
Source: j.c. brennan & associates, Inc., 2015.
Measured noise levels shown in Table 2 were compared to the FHWA traffic noise prediction model to calibrate the model to existing site conditions. The FHWA model was found to over-predict traffic noise levels on the project site by 5- to 8- dBA over the full 24-hour period, as shown in Appendix C.
It should be noted that the Pittsburg/Bay Point BART line runs through the center median of SR-24. While occasional train passages are audible at times, they do not substantially contribute to overall noise levels at the project site. Therefore, this analysis does not focus on noise from BART operations.
j.c. brennan & associates, Inc. Job # 2015-143
Environmental Noise AnalysisWoodbury Highlands – City of Lafayette, California
Page 8 of 9
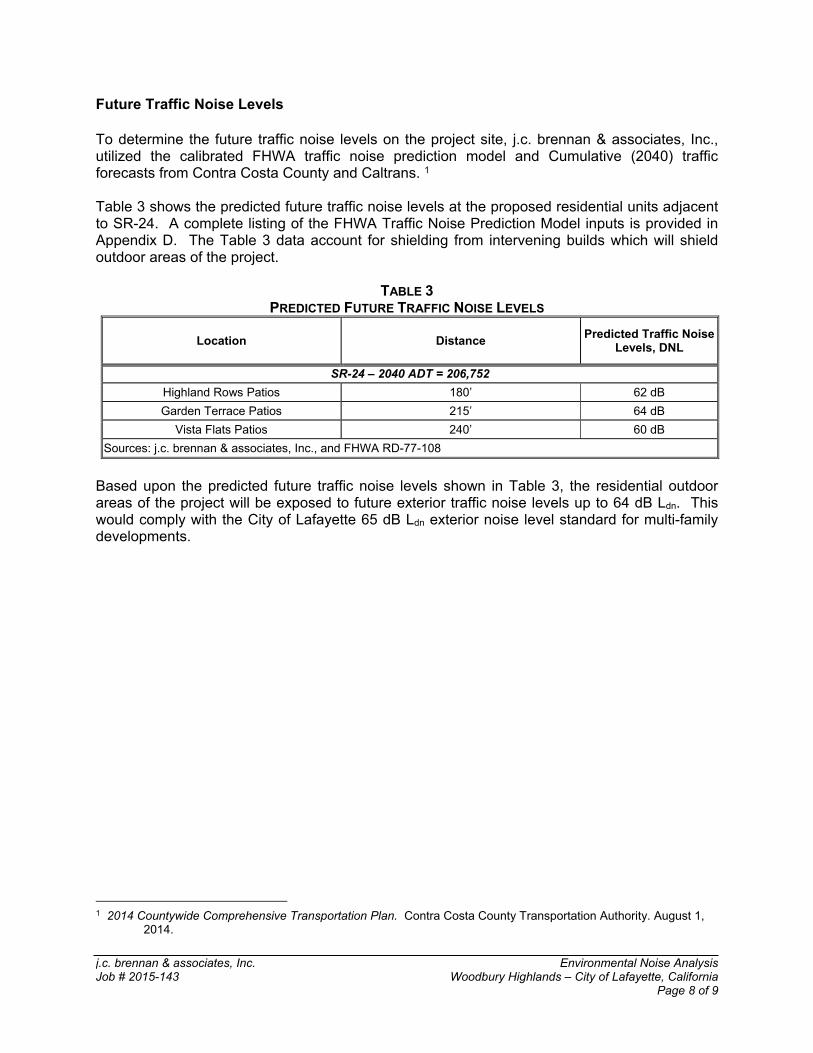
Future Traffic Noise Levels To determine the future traffic noise levels on the project site, j.c. brennan & associates, Inc., utilized the calibrated FHWA traffic noise prediction model and Cumulative (2040) traffic forecasts from Contra Costa County and Caltrans. 1 Table 3 shows the predicted future traffic noise levels at the proposed residential units adjacent to SR-24. A complete listing of the FHWA Traffic Noise Prediction Model inputs is provided in Appendix D. The Table 3 data account for shielding from intervening builds which will shield outdoor areas of the project.
TABLE 3 PREDICTED FUTURE TRAFFIC NOISE LEVELS
Location Distance Predicted Traffic Noise
Levels, DNL
SR-24 – 2040 ADT = 206,752
Highland Rows Patios 180’ 62 dB
Garden Terrace Patios 215’ 64 dB
Vista Flats Patios 240’ 60 dB
Sources: j.c. brennan & associates, Inc., and FHWA RD-77-108
Based upon the predicted future traffic noise levels shown in Table 3, the residential outdoor areas of the project will be exposed to future exterior traffic noise levels up to 64 dB Ldn. This would comply with the City of Lafayette 65 dB Ldn exterior noise level standard for multi-family developments.
1 2014 Countywide Comprehensive Transportation Plan. Contra Costa County Transportation Authority. August 1,
2014.

j.c. brennan & associates, Inc. Job # 2015-143
Environmental Noise AnalysisWoodbury Highlands – City of Lafayette, California
Page 9 of 9
Interior Traffic Noise Levels: Standard construction practices, consistent with the uniform building code typically provides an exterior-to-interior noise level reduction of approximately 25 dB, assuming that air conditioning is included for each unit, which allows residents to close windows for the required acoustical isolation. Therefore, as long as exterior noise levels at the building facades do not exceed 70 dB Ldn, the interior noise levels will typically comply with the interior noise level standard of 45 dB Ldn.
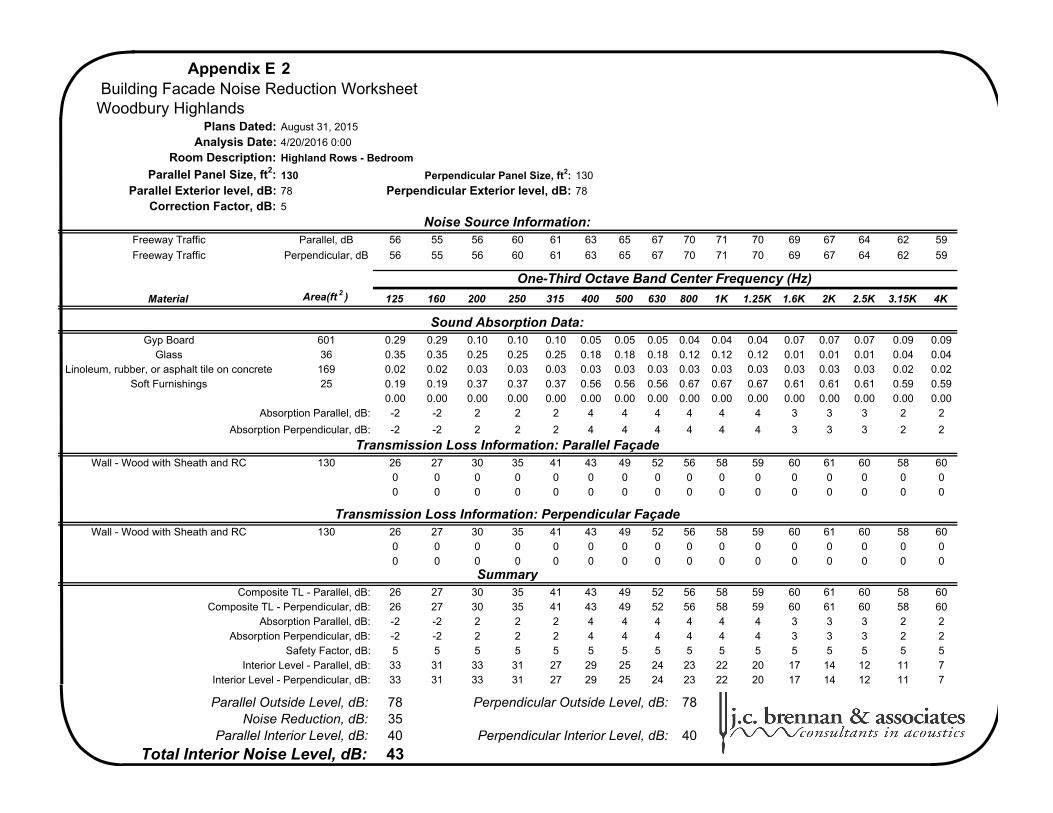
Exterior noise levels at the second floor façade of the Highland Row units are predicted to be up to 78 dB Ldn, as shown in Appendix E. Upper floors of the second row units (Garden Terrace / Vista Flat) are predicted to be exposed to exterior noise levels of up to 74 dB Ldn. Therefore, additional interior noise reduction measures would be required for these units.
It is expected that interior noise control measures would include the use of resilient channels (RC) and sound transmission class (STC) 35 rated windows assemblies to achieve compliance with the City of Lafayette 45 dB Ldn interior noise level standard for all units facing towards SR-24. Additionally, the Highland Row units located along the SR-24 right-of-way should have minimal glazing facing the highway. Any windows facing SR-24 would likely require an STC rating of 38-40. Because the project is still undergoing design development, a detailed analysis of interior noise control measures should be developed as the project design progresses.
CONCLUSIONS
The proposed project is predicted to be experience exterior noise level which meet the City of Lafayette 65 dB Ldn noise level standard for small decks and patios exposed to transportation noise from SR-24. However, the future residential used could be exposed to noise levels exceeding the City of Lafayette interior noise level standards. Therefore, the following interior noise control measures would be required:
A detailed analysis of interior noise control measures should be conducted prior to the completion of building plans. The analysis should outline specific wall and windows requirements to achieve the City’s 45 dB Ldn interior noise level standard. The analysis should be prepared by a qualified noise control engineer.
Air conditioning should be included in all residences to allow occupants to close
doors and windows as desired for acoustical isolation.

Appendix A Acoustical Terminology
Acoustics The science of sound.
Ambient Noise The distinctive acoustical characteristics of a given space consisting of all noise sources audible at that location. In many cases, the term ambient is used to describe an existing or pre-project condition such as the setting in an environmental noise study.
Attenuation The reduction of an acoustic signal.
A-Weighting A frequency-response adjustment of a sound level meter that conditions the output signal to approximate human response.
Decibel or dB Fundamental unit of sound, A Bell is defined as the logarithm of the ratio of the sound pressure squared over the reference pressure squared. A Decibel is one-tenth of a Bell.
CNEL Community Noise Equivalent Level. Defined as the 24-hour average noise level with noise occurring during evening hours (7 - 10 p.m.) weighted by a factor of three and nighttime hours weighted by a factor of 10 prior to averaging.
Frequency The measure of the rapidity of alterations of a periodic signal, expressed in cycles per second or hertz (Hz).
Ldn Day/Night Average Sound Level. Similar to CNEL but with no evening weighting.
Leq Equivalent or energy-averaged sound level.
Lmax The highest root-mean-square (RMS) sound level measured over a given period of time.
L(n) The sound level exceeded a described percentile over a measurement period. For instance, an hourly L50 is the sound level exceeded 50% of the time during the one hour period.
Loudness A subjective term for the sensation of the magnitude of sound. Noise Unwanted sound.
NRC Noise Reduction Coefficient. NRC is a single-number rating of the sound-absorption of a material equal to the arithmetic mean of the sound-absorption coefficients in the 250, 500, 1000, and 2,000 Hz octave frequency bands rounded to the nearest multiple of 0.05. It is a representation of the amount of sound energy absorbed upon striking a particular surface. An NRC of 0 indicates perfect reflection; an NRC of 1 indicates perfect absorption.
Peak Noise The level corresponding to the highest (not RMS) sound pressure measured over a given period of time. This term is often confused with the AMaximum@ level, which is the highest RMS level.
RT60 The time it takes reverberant sound to decay by 60 dB once the source has been removed.
Sabin The unit of sound absorption. One square foot of material absorbing 100% of incident sound has an absorption of 1 Sabin.
SEL Sound Exposure Level. SEL is s rating, in decibels, of a discrete event, such as an aircraft flyover or train passby, that compresses the total sound energy into a one-second event.
STC Sound Transmission Class. STC is an integer rating of how well a building partition attenuates airborne sound. It is widely used to rate interior partitions, ceilings/floors, doors, windows and exterior wall configurations.
Threshold The lowest sound that can be perceived by the human auditory system, generally considered to be 0 dB for of Hearing persons with perfect hearing.
Threshold Approximately 120 dB above the threshold of hearing. of Pain Impulsive Sound of short duration, usually less than one second, with an abrupt onset and rapid decay. Simple Tone Any sound which can be judged as audible as a single pitch or set of single pitches.

Appendix B-1
Hour Leq Lmax L50 L900:00:00 64 85 62 511:00:00 62 75 58 44 High Low Average High Low Average2:00:00 61 80 56 44 Leq (Average) 70 68 70 69 61 663:00:00 61 85 56 47 Lmax (Maximum) 89 77 81 85 75 814:00:00 63 80 61 55 L50 (Median) 70 68 69 68 56 625:00:00 67 83 65 61 L90 (Background) 67 63 66 64 44 546:00:00 69 82 68 647:00:00 70 77 70 67 Computed Ldn, dB 738:00:00 70 81 70 67 % Daytime Energy 80%9:00:00 70 79 69 66 % Nighttime Energy 20%10:00:00 69 79 69 6511:00:00 69 78 69 6512:00:00 70 79 70 6713:00:00 70 84 69 6714:00:00 70 82 70 6715:00:00 70 86 69 6716:00:00 69 89 68 6717:00:00 69 81 68 6618:00:00 69 86 69 6519:00:00 70 82 70 6720:00:00 69 78 69 6521:00:00 68 80 68 6322:00:00 68 78 68 6323:00:00 67 81 66 60
Statistical SummaryNighttime (10 p.m. - 7 a.m.)
Mt Diablo Blvd MultiFam Res24hr Continuous Noise Monitoring - Site A
Daytime (7 a.m. - 10 p.m.)
Wednesday, May 13, 2015

Ldn = 73 dB
Mt Diablo Blvd MultiFam Res24hr Continuous Noise Monitoring - Site A
Wednesday, May 13, 2015
Appendix B-1
30
40
50
60
70
80
90
100
12 AM 4 AM 8 AM 12 PM 4 PM 8 PM
So
un
d L
eve
l, d
B
Hour of Day
Leq Lmax L50 L90

Appendix B-2
Hour Leq Lmax L50 L900:00 55 73 53 441:00 55 76 52 44 High Low Average High Low Average2:00 56 78 52 45 Leq (Average) 66 62 64 65 55 603:00 57 75 56 51 Lmax (Maximum) 100 70 78 78 73 754:00 61 76 60 56 L50 (Median) 64 62 63 64 52 575:00 63 75 62 60 L90 (Background) 62 58 61 62 44 526:00 65 74 64 627:00 65 73 64 62 Computed Ldn, dB 678:00 64 73 63 61 % Daytime Energy 79%9:00 64 75 63 60 % Nighttime Energy 21%10:00 64 76 63 6011:00 64 100 64 6112:00 64 74 64 6113:00 64 74 64 6214:00 64 80 64 6215:00 66 87 64 6216:00 64 77 63 6117:00 64 76 63 6118:00 64 76 64 6219:00 63 78 63 6020:00 62 74 62 5821:00 62 70 62 5922:00 61 76 60 5623:00 59 75 57 50
Mt Diablo Blvd MultiFam Res24hr Continuous Noise Monitoring - Site B
Daytime (7 a.m. - 10 p.m.)
Wednesday, May 13, 2015
Statistical SummaryNighttime (10 p.m. - 7 a.m.)

Ldn = 67 dB
24hr Continuous Noise Monitoring - Site BWednesday, May 13, 2015
Appendix B-2Mt Diablo Blvd MultiFam Res
30
40
50
60
70
80
90
100
12 AM 4 AM 8 AM 12 PM 4 PM 8 PM
So
un
d L
eve
l, d
B
Hour of Day
Leq Lmax L50

Existing182,000
80201165
Soft
Medium HeavyLocation: Description Distance Offset (dB) Autos Trucks Trucks Total
1 24-hr Site A - Measured 73 dBA 145 -5 72 58 62 732 24-hr Site B - Measured 67 dBA 225 -8 66 52 56 67
Ldn Contour, dB
75706560
Notes:
Intervening Ground Type (hard/soft):
10062167
Percent Nighttime Traffic:Percent Medium Trucks (2 axle):
Job Number:Project Name:
Roadway Name:
Year:
Project Information:
Traffic Data:
Traffic Noise Levels:
Traffic Noise Contours (No Calibration Offset):
-----------------Ldn, dB------------------
Distance from Centerline, (ft)
217
2015-143Woodbury Highlands
Appendix C
467
SR 24
Percent Heavy Trucks (3+ axle):Assumed Vehicle Speed (mph):
FHWA Traffic Noise Prediction Model (FHWA-RD-77-108) Noise Prediction Worksheet
Average Daily Traffic Volume:Percent Daytime Traffic:

Future 2040206,752
80201165
Soft
Medium HeavyLocation: Description Distance Offset (dB) Autos Trucks Trucks Total
1 24-hr Site A - Measured 73 dBA 150 -5 72 59 62 732 24-hr Site B - Measured 67 dBA 225 -8 67 53 56 673 Highland Rows Upper Floor Façades 150 0 77 64 67 784 Highland Rows Patios 180 -15 61 47 51 625 Garden Terrace Upper Floor Facades 215 -2 73 59 63 746 Garden Terrace Patios 215 -12 63 49 53 647 Vista Flats Upper Floor Facades 190 -2 74 60 64 748 Vista Flats Patios 240 -15 59 46 49 60
Ldn Contour, dB
75706560
Notes:
Appendix D
508
SR 24
Percent Heavy Trucks (3+ axle):Assumed Vehicle Speed (mph):
FHWA Traffic Noise Prediction Model (FHWA-RD-77-108) Noise Prediction Worksheet
Average Daily Traffic Volume:Percent Daytime Traffic:
Project Information:
Traffic Data:
Traffic Noise Levels:
Traffic Noise Contours (No Calibration Offset):
-----------------Ldn, dB------------------
Distance from Centerline, (ft)
236
2015-143Woodbury Highlands
Percent Nighttime Traffic:Percent Medium Trucks (2 axle):
Job Number:Project Name:
Roadway Name:
Year:
Intervening Ground Type (hard/soft):
10952359

Appendix E 1
Plans Dated:Analysis Date:
Room Description:
Parallel Panel Size, ft2: 250 200
Parallel Exterior level, dB: 78 78
Correction Factor, dB: 5
Freeway Traffic Parallel, dB 56 55 56 60 61 63 65 67 70 71 70 69 67 64 62 59
Freeway Traffic Perpendicular, dB 56 55 56 60 61 63 65 67 70 71 70 69 67 64 62 59
One-Third Octave Band Center Frequency (Hz)
Material Area(ft 2 ) 125 160 200 250 315 400 500 630 800 1K 1.25K 1.6K 2K 2.5K 3.15K 4K
Gyp Board 1399 0.29 0.29 0.10 0.10 0.10 0.05 0.05 0.05 0.04 0.04 0.04 0.07 0.07 0.07 0.09 0.09Glass 36 0.35 0.35 0.25 0.25 0.25 0.18 0.18 0.18 0.12 0.12 0.12 0.01 0.01 0.01 0.04 0.04
Linoleum, rubber, or asphalt tile on concrete 500 0.02 0.02 0.03 0.03 0.03 0.03 0.03 0.03 0.03 0.03 0.03 0.03 0.03 0.03 0.02 0.02Soft Furnishings 50 0.19 0.19 0.37 0.37 0.37 0.56 0.56 0.56 0.67 0.67 0.67 0.61 0.61 0.61 0.59 0.59
0.00 0.00 0.00 0.00 0.00 0.00 0.00 0.00 0.00 0.00 0.00 0.00 0.00 0.00 0.00 0.00-2 -2 1 1 1 3 3 3 4 4 4 2 2 2 2 2
-3 -3 0 0 0 2 2 2 3 3 3 1 1 1 1 1
Wall - Wood with Sheath and RC 240 26 27 30 35 41 43 49 52 56 58 59 60 61 60 58 60Window - Quiet Home STC 38 10 29 28 29 28 32 34 37 38 39 39 38 38 39 41 42 42
0 0 0 0 0 0 0 0 0 0 0 0 0 0 0 0
Wall - Wood with Sheath and RC 200 26 27 30 35 41 43 49 52 56 58 59 60 61 60 58 600 0 0 0 0 0 0 0 0 0 0 0 0 0 0 00 0 0 0 0 0 0 0 0 0 0 0 0 0 0 0
26 27 30 34 40 42 47 49 51 52 51 51 52 54 54 5526 27 30 35 41 43 49 52 56 58 59 60 61 60 58 60-2 -2 1 1 1 3 3 3 4 4 4 2 2 2 2 2-3 -3 0 0 0 2 2 2 3 3 3 1 1 1 1 15 5 5 5 5 5 5 5 5 5 5 5 5 5 5 5
32 31 33 32 27 29 26 26 27 27 27 25 22 18 15 1131 30 32 30 25 27 23 23 21 20 19 16 13 11 10 5
Parallel Outside Level, dB: 78 Perpendicular Outside Level, dB: 78Noise Reduction, dB: 36
Parallel Interior Level, dB: 40 Perpendicular Interior Level, dB: 38
42
Absorption Perpendicular, dB:
Transmission Loss Information: Perpendicular Façade
Transmission Loss Information: Parallel Façade
Composite TL - Parallel, dB:
Interior Level - Parallel, dB:Interior Level - Perpendicular, dB:
Highland Rows - Living/Kitchen
Perpendicular Panel Size, ft2:
Perpendicular Exterior level, dB:
Sound Absorption Data:
Building Facade Noise Reduction Worksheet Woodbury Highlands
August 31, 2015
4/20/2016 0:00
Summary
Noise Source Information:
Absorption Parallel, dB:
Total Interior Noise Level, dB:
Composite TL - Perpendicular, dB:Absorption Parallel, dB:
Absorption Perpendicular, dB:Safety Factor, dB:
Appendix E 2
Plans Dated:Analysis Date:
Room Description:
Parallel Panel Size, ft2: 130 130
Parallel Exterior level, dB: 78 78
Correction Factor, dB: 5
Freeway Traffic Parallel, dB 56 55 56 60 61 63 65 67 70 71 70 69 67 64 62 59
Freeway Traffic Perpendicular, dB 56 55 56 60 61 63 65 67 70 71 70 69 67 64 62 59
One-Third Octave Band Center Frequency (Hz)
Material Area(ft 2 ) 125 160 200 250 315 400 500 630 800 1K 1.25K 1.6K 2K 2.5K 3.15K 4K
Gyp Board 601 0.29 0.29 0.10 0.10 0.10 0.05 0.05 0.05 0.04 0.04 0.04 0.07 0.07 0.07 0.09 0.09Glass 36 0.35 0.35 0.25 0.25 0.25 0.18 0.18 0.18 0.12 0.12 0.12 0.01 0.01 0.01 0.04 0.04
Linoleum, rubber, or asphalt tile on concrete 169 0.02 0.02 0.03 0.03 0.03 0.03 0.03 0.03 0.03 0.03 0.03 0.03 0.03 0.03 0.02 0.02Soft Furnishings 25 0.19 0.19 0.37 0.37 0.37 0.56 0.56 0.56 0.67 0.67 0.67 0.61 0.61 0.61 0.59 0.59
0.00 0.00 0.00 0.00 0.00 0.00 0.00 0.00 0.00 0.00 0.00 0.00 0.00 0.00 0.00 0.00-2 -2 2 2 2 4 4 4 4 4 4 3 3 3 2 2
-2 -2 2 2 2 4 4 4 4 4 4 3 3 3 2 2
Wall - Wood with Sheath and RC 130 26 27 30 35 41 43 49 52 56 58 59 60 61 60 58 600 0 0 0 0 0 0 0 0 0 0 0 0 0 0 00 0 0 0 0 0 0 0 0 0 0 0 0 0 0 0
Wall - Wood with Sheath and RC 130 26 27 30 35 41 43 49 52 56 58 59 60 61 60 58 600 0 0 0 0 0 0 0 0 0 0 0 0 0 0 00 0 0 0 0 0 0 0 0 0 0 0 0 0 0 0
26 27 30 35 41 43 49 52 56 58 59 60 61 60 58 6026 27 30 35 41 43 49 52 56 58 59 60 61 60 58 60-2 -2 2 2 2 4 4 4 4 4 4 3 3 3 2 2-2 -2 2 2 2 4 4 4 4 4 4 3 3 3 2 25 5 5 5 5 5 5 5 5 5 5 5 5 5 5 5
33 31 33 31 27 29 25 24 23 22 20 17 14 12 11 733 31 33 31 27 29 25 24 23 22 20 17 14 12 11 7
Parallel Outside Level, dB: 78 Perpendicular Outside Level, dB: 78Noise Reduction, dB: 35
Parallel Interior Level, dB: 40 Perpendicular Interior Level, dB: 40
43
Safety Factor, dB:Interior Level - Parallel, dB:
Interior Level - Perpendicular, dB:
Total Interior Noise Level, dB:
Transmission Loss Information: Perpendicular Façade
SummaryComposite TL - Parallel, dB:
Composite TL - Perpendicular, dB:Absorption Parallel, dB:
Absorption Perpendicular, dB:
Perpendicular Exterior level, dB:
Noise Source Information:
Sound Absorption Data:
Absorption Parallel, dB:
Absorption Perpendicular, dB:
Transmission Loss Information: Parallel Façade
Building Facade Noise Reduction Worksheet Woodbury Highlands
August 31, 2015
4/20/2016 0:00
Highland Rows - Bedroom
Perpendicular Panel Size, ft2:

Appendix E 3
Plans Dated:Analysis Date:
Room Description:
Parallel Panel Size, ft2: 140 200
Parallel Exterior level, dB: 74 74
Correction Factor, dB: 5
Freeway Traffic Parallel, dB 52 51 52 56 57 59 61 63 66 67 66 65 63 60 58 55
Freeway Traffic Perpendicular, dB 52 51 52 56 57 59 61 63 66 67 66 65 63 60 58 55
One-Third Octave Band Center Frequency (Hz)
Material Area(ft 2 ) 125 160 200 250 315 400 500 630 800 1K 1.25K 1.6K 2K 2.5K 3.15K 4K
Gyp Board 862 0.29 0.29 0.10 0.10 0.10 0.05 0.05 0.05 0.04 0.04 0.04 0.07 0.07 0.07 0.09 0.09Glass 30 0.35 0.35 0.25 0.25 0.25 0.18 0.18 0.18 0.12 0.12 0.12 0.01 0.01 0.01 0.04 0.04
Linoleum, rubber, or asphalt tile on concrete 280 0.02 0.02 0.03 0.03 0.03 0.03 0.03 0.03 0.03 0.03 0.03 0.03 0.03 0.03 0.02 0.02Soft Furnishings 25 0.19 0.19 0.37 0.37 0.37 0.56 0.56 0.56 0.67 0.67 0.67 0.61 0.61 0.61 0.59 0.59
0.00 0.00 0.00 0.00 0.00 0.00 0.00 0.00 0.00 0.00 0.00 0.00 0.00 0.00 0.00 0.00-3 -3 1 1 1 3 3 3 3 3 3 2 2 2 1 1
-1 -1 3 3 3 5 5 5 5 5 5 4 4 4 3 3
Wall - 0.5" OSB and 5/8" Int. Gyp + RC- INSUL 110 20 26 31 35 39 42 45 46 47 49 51 50 45 46 49 53Window - Quiet Home STC 34 30 22 24 22 25 29 32 33 35 35 35 35 36 36 37 37 36
0 0 0 0 0 0 0 0 0 0 0 0 0 0 0 0
Wall - 0.5" OSB and 5/8" Int. Gyp + RC- INSUL 200 20 26 31 35 39 42 45 46 47 49 51 50 45 46 49 530 0 0 0 0 0 0 0 0 0 0 0 0 0 0 00 0 0 0 0 0 0 0 0 0 0 0 0 0 0 0
20 25 27 30 34 37 39 41 41 41 41 42 41 42 43 4220 26 31 35 39 42 45 46 47 49 51 50 45 46 49 53-3 -3 1 1 1 3 3 3 3 3 3 2 2 2 1 1-1 -1 3 3 3 5 5 5 5 5 5 4 4 4 3 35 5 5 5 5 5 5 5 5 5 5 5 5 5 5 5
34 28 31 31 28 30 30 31 33 34 33 30 29 25 22 1936 29 29 28 25 27 26 27 29 28 25 24 27 23 17 10
Parallel Outside Level, dB: 74 Perpendicular Outside Level, dB: 74Noise Reduction, dB: 29
Parallel Interior Level, dB: 43 Perpendicular Interior Level, dB: 40
45
Safety Factor, dB:Interior Level - Parallel, dB:
Interior Level - Perpendicular, dB:
Total Interior Noise Level, dB:
Transmission Loss Information: Perpendicular Façade
SummaryComposite TL - Parallel, dB:
Composite TL - Perpendicular, dB:Absorption Parallel, dB:
Absorption Perpendicular, dB:
Perpendicular Exterior level, dB:
Noise Source Information:
Sound Absorption Data:
Absorption Parallel, dB:
Absorption Perpendicular, dB:
Transmission Loss Information: Parallel Façade
Building Facade Noise Reduction Worksheet Woodbury Highlands
August 31, 2015
4/20/2016 0:00
Garden Terrace - Bedroom
Perpendicular Panel Size, ft2:

Appendix E 4
Plans Dated:Analysis Date:
Room Description:
Parallel Panel Size, ft2: 250 250
Parallel Exterior level, dB: 74 74
Correction Factor, dB: 5
Freeway Traffic Parallel, dB 52 51 52 56 57 59 61 63 66 67 66 65 63 60 58 55
Freeway Traffic Perpendicular, dB 52 51 52 56 57 59 61 63 66 67 66 65 63 60 58 55
One-Third Octave Band Center Frequency (Hz)
Material Area(ft 2 ) 125 160 200 250 315 400 500 630 800 1K 1.25K 1.6K 2K 2.5K 3.15K 4K
Gyp Board 1447 0.29 0.29 0.10 0.10 0.10 0.05 0.05 0.05 0.04 0.04 0.04 0.07 0.07 0.07 0.09 0.09Glass 78 0.35 0.35 0.25 0.25 0.25 0.18 0.18 0.18 0.12 0.12 0.12 0.01 0.01 0.01 0.04 0.04
Linoleum, rubber, or asphalt tile on concrete 625 0.02 0.02 0.03 0.03 0.03 0.03 0.03 0.03 0.03 0.03 0.03 0.03 0.03 0.03 0.02 0.02Soft Furnishings 50 0.19 0.19 0.37 0.37 0.37 0.56 0.56 0.56 0.67 0.67 0.67 0.61 0.61 0.61 0.59 0.59
0.00 0.00 0.00 0.00 0.00 0.00 0.00 0.00 0.00 0.00 0.00 0.00 0.00 0.00 0.00 0.00-3 -3 1 1 1 3 3 3 3 3 3 2 2 2 2 2
-3 -3 1 1 1 3 3 3 3 3 3 2 2 2 2 2
Wall - 0.5" OSB and 5/8" Int. Gyp + RC- INSUL 172 20 26 31 35 39 42 45 46 47 49 51 50 45 46 49 53Window - Quiet Home STC 34 78 22 24 22 25 29 32 33 35 35 35 35 36 36 37 37 36
0 0 0 0 0 0 0 0 0 0 0 0 0 0 0 0
Wall - 0.5" OSB and 5/8" Int. Gyp + RC- INSUL 250 20 26 31 35 39 42 45 46 47 49 51 50 45 46 49 530 0 0 0 0 0 0 0 0 0 0 0 0 0 0 00 0 0 0 0 0 0 0 0 0 0 0 0 0 0 0
21 25 26 29 33 36 37 39 39 40 40 41 40 41 41 4120 26 31 35 39 42 45 46 47 49 51 50 45 46 49 53-3 -3 1 1 1 3 3 3 3 3 3 2 2 2 2 2-3 -3 1 1 1 3 3 3 3 3 3 2 2 2 2 25 5 5 5 5 5 5 5 5 5 5 5 5 5 5 5
34 28 32 32 29 31 31 32 34 35 34 32 30 26 23 2134 27 27 26 24 25 24 25 27 26 23 22 25 21 16 9
Parallel Outside Level, dB: 74 Perpendicular Outside Level, dB: 74Noise Reduction, dB: 29
Parallel Interior Level, dB: 44 Perpendicular Interior Level, dB: 38
45
Safety Factor, dB:Interior Level - Parallel, dB:
Interior Level - Perpendicular, dB:
Total Interior Noise Level, dB:
Transmission Loss Information: Perpendicular Façade
SummaryComposite TL - Parallel, dB:
Composite TL - Perpendicular, dB:Absorption Parallel, dB:
Absorption Perpendicular, dB:
Perpendicular Exterior level, dB:
Noise Source Information:
Sound Absorption Data:
Absorption Parallel, dB:
Absorption Perpendicular, dB:
Transmission Loss Information: Parallel Façade
Building Facade Noise Reduction Worksheet Woodbury Highlands
August 31, 2015
4/20/2016 0:00
Garden Terrace - Living
Perpendicular Panel Size, ft2:
........................................................................................................................
W O O D B U R Y H I G H L A N D S R E S I D E N T I A L D E V E L O P M E N T C E Q A N O I S E A D D E N D U M

........................................................................................................................
www.jcbrennanassoc.com
December 20, 2016 Lisa Vilhauer Branagh Development Inc. 100 School Street Danville CA 94526 Subject: Woodbury Highlands Residential Development CEQA Noise Addendum –
City of Lafayette, California Dear Ms. Vilhauer: Thank you for contacting us to prepare an additional CEQA-related noise analysis for the above-referenced project. The Woodbury Highlands project consists of a 99-unit multi-family residential development located north of Mt. Diablo Boulevard and south of State Route 24 (SR-24). The project is located in the City of Lafayette, California. j.c. brennan & associates, Inc. previously prepared an Environmental Noise Analysis1 (Attachment 1) addressing the impact of transportation noise on the proposed project. This work has been prepared to address the CEQA noise checklist for the proposed project. The following is our review and conclusions relating to the CEQA noise checklist items.
1 Environmental Noise Analysis. Woodbury Highlands Residential Development. j.c. brennan & associates, Inc. April
21, 2016.
Lisa Vilhauer, Branagh Development Inc. December 20, 2016
www.jcbrennanassoc.com
Page 2 of 13
File: Z:\jcb Project Folders\2016 Jobs\2016-156 Woodbury Highlands CEQA Addendum\Woodbury Highlands CEQA Noise Letter 12-20-16.docx
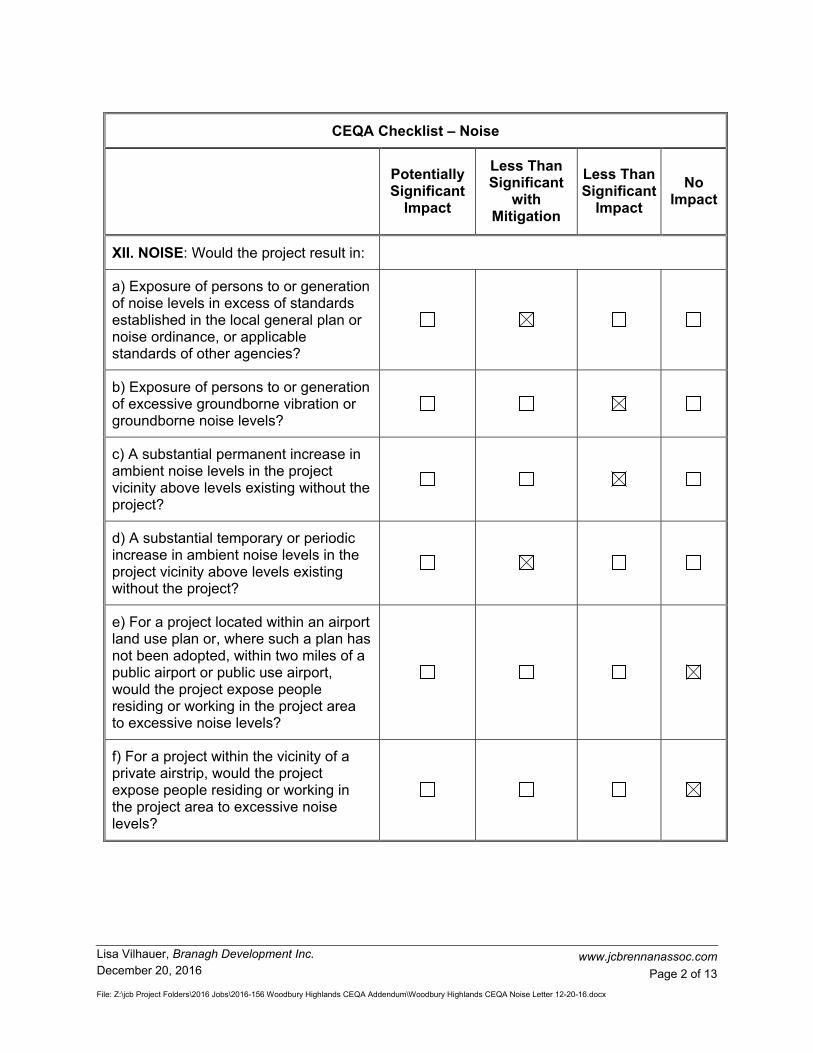
CEQA Checklist – Noise
Potentially Significant
Impact
Less Than Significant
with Mitigation
Less Than Significant
Impact
No Impact
XII. NOISE: Would the project result in:
a) Exposure of persons to or generation of noise levels in excess of standards established in the local general plan or noise ordinance, or applicable standards of other agencies?
b) Exposure of persons to or generation of excessive groundborne vibration or groundborne noise levels?
c) A substantial permanent increase in ambient noise levels in the project vicinity above levels existing without the project?
d) A substantial temporary or periodic increase in ambient noise levels in the project vicinity above levels existing without the project?
e) For a project located within an airport land use plan or, where such a plan has not been adopted, within two miles of a public airport or public use airport, would the project expose people residing or working in the project area to excessive noise levels?
f) For a project within the vicinity of a private airstrip, would the project expose people residing or working in the project area to excessive noise levels?
Lisa Vilhauer, Branagh Development Inc. December 20, 2016
www.jcbrennanassoc.com
Page 3 of 13
File: Z:\jcb Project Folders\2016 Jobs\2016-156 Woodbury Highlands CEQA Addendum\Woodbury Highlands CEQA Noise Letter 12-20-16.docx
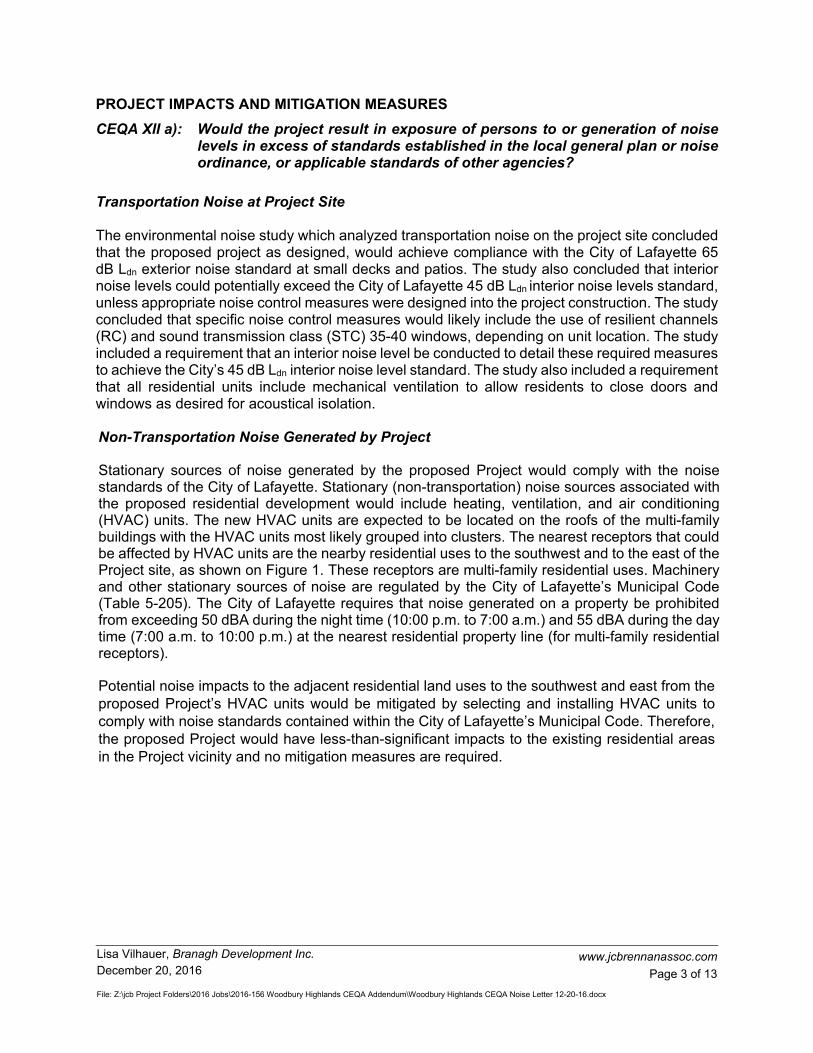
PROJECT IMPACTS AND MITIGATION MEASURES
CEQA XII a): Would the project result in exposure of persons to or generation of noise levels in excess of standards established in the local general plan or noise ordinance, or applicable standards of other agencies?
Transportation Noise at Project Site The environmental noise study which analyzed transportation noise on the project site concluded that the proposed project as designed, would achieve compliance with the City of Lafayette 65 dB Ldn exterior noise standard at small decks and patios. The study also concluded that interior noise levels could potentially exceed the City of Lafayette 45 dB Ldn interior noise levels standard, unless appropriate noise control measures were designed into the project construction. The study concluded that specific noise control measures would likely include the use of resilient channels (RC) and sound transmission class (STC) 35-40 windows, depending on unit location. The study included a requirement that an interior noise level be conducted to detail these required measures to achieve the City’s 45 dB Ldn interior noise level standard. The study also included a requirement that all residential units include mechanical ventilation to allow residents to close doors and windows as desired for acoustical isolation. Non-Transportation Noise Generated by Project Stationary sources of noise generated by the proposed Project would comply with the noise standards of the City of Lafayette. Stationary (non-transportation) noise sources associated with the proposed residential development would include heating, ventilation, and air conditioning (HVAC) units. The new HVAC units are expected to be located on the roofs of the multi-family buildings with the HVAC units most likely grouped into clusters. The nearest receptors that could be affected by HVAC units are the nearby residential uses to the southwest and to the east of the Project site, as shown on Figure 1. These receptors are multi-family residential uses. Machinery and other stationary sources of noise are regulated by the City of Lafayette’s Municipal Code (Table 5-205). The City of Lafayette requires that noise generated on a property be prohibited from exceeding 50 dBA during the night time (10:00 p.m. to 7:00 a.m.) and 55 dBA during the day time (7:00 a.m. to 10:00 p.m.) at the nearest residential property line (for multi-family residential receptors). Potential noise impacts to the adjacent residential land uses to the southwest and east from the proposed Project’s HVAC units would be mitigated by selecting and installing HVAC units to comply with noise standards contained within the City of Lafayette’s Municipal Code. Therefore, the proposed Project would have less-than-significant impacts to the existing residential areas in the Project vicinity and no mitigation measures are required.

Woodbury HighlandsFigure 1: Sensitive Receptor Locations
Figure Prepared 12/20/19
Project Site
B
Multi-Family Residential
Multi-Family Residential

Lisa Vilhauer, Branagh Development Inc. December 20, 2016
www.jcbrennanassoc.com
Page 5 of 13
File: Z:\jcb Project Folders\2016 Jobs\2016-156 Woodbury Highlands CEQA Addendum\Woodbury Highlands CEQA Noise Letter 12-20-16.docx
With the outlined mitigation measure(s), this would be a less than significant impact. Mitigation Measure(s)
A detailed analysis of interior noise control measures should be conducted prior to the completion of building plans. The analysis should outline specific wall and windows requirements to achieve the City’s 45 dB Ldn interior noise level standard. The analysis should be prepared by a qualified noise control engineer.
Mechanical ventilation should be included in all residences to allow occupants to close doors and windows as desired for acoustical isolation.
HVAC units shall comply with the noise standards contained within the City of Lafayette’s Municipal Code at the nearest residential receivers
CEQA XII b): Would the project result in exposure of persons to or generation of excessive groundborne vibration or groundborne noise levels?
Construction vibration impacts include human annoyance and building structural damage. Human annoyance occurs when construction vibration rises significantly above the threshold of perception. Building damage can take the form of cosmetic or structural. Table 1 indicates that the threshold for architectural damage to structures is 0.20 in/sec p.p.v. and continuous vibrations of 0.10 in/sec p.p.v., or greater, would likely cause annoyance to sensitive receptors.

Lisa Vilhauer, Branagh Development Inc. December 20, 2016
www.jcbrennanassoc.com
Page 6 of 13
File: Z:\jcb Project Folders\2016 Jobs\2016-156 Woodbury Highlands CEQA Addendum\Woodbury Highlands CEQA Noise Letter 12-20-16.docx
TABLE 1: EFFECTS OF VARIOUS VIBRATION LEVELS ON PEOPLE AND BUILDINGS
Vibration Level (Peak Particle Velocity)*
mm/s in/sec Human Reaction Effect on Buildings
0.15-0.30 0.006-0.019 Threshold of perception; possibility of intrusion
Vibrations unlikely to cause damage of any type
2.0 0.08 Vibrations readily perceptible
Recommended upper level of the vibration to which ruins and ancient monuments should be subjected
2.5 0.10 Level at which continuous vibrations begin to annoy people
Virtually no risk of “architectural” damage to normal buildings
5.0 0.20
Vibrations annoying to people in buildings (this agrees with the levels established for people standing on bridges and subjected to relative short periods of vibrations)
Threshold at which there is a risk of “architectural” damage to normal dwelling - houses with plastered walls and ceilings Special types of finish such as lining of walls, flexible ceiling treatment, etc., would minimize “architectural” damage
10-15 0.4-0.6
Vibrations considered unpleasant by people subjected to continuous vibrations and unacceptable to some people walking on bridges
Vibrations at a greater level than normally expected from traffic, but would cause “architectural” damage and possibly minor structural damage.
Source: Transportation and Construction Vibration Guidance Manual. Caltrans. September 2013.
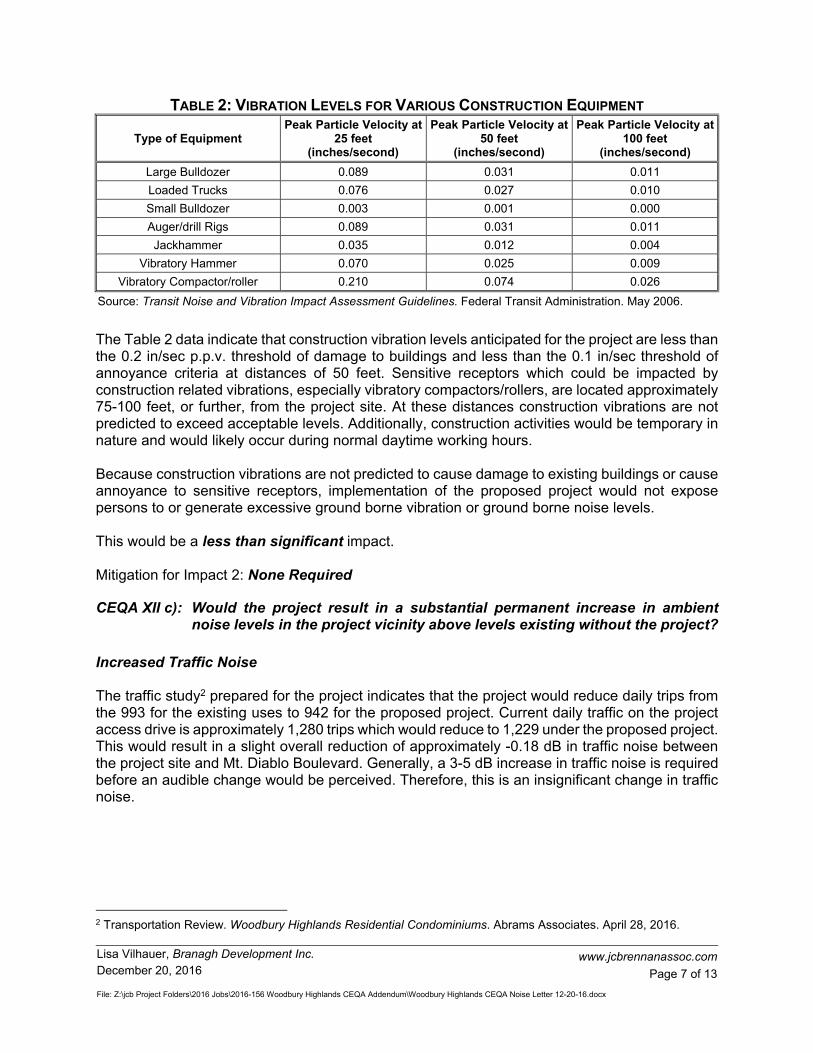
The primary vibration-generating activities associated with the proposed project would occur during construction when activities such as grading, utilities placement, and parking lot construction occur. Table 2 shows the typical vibration levels produced by construction equipment.
Lisa Vilhauer, Branagh Development Inc. December 20, 2016
www.jcbrennanassoc.com
Page 7 of 13
File: Z:\jcb Project Folders\2016 Jobs\2016-156 Woodbury Highlands CEQA Addendum\Woodbury Highlands CEQA Noise Letter 12-20-16.docx
TABLE 2: VIBRATION LEVELS FOR VARIOUS CONSTRUCTION EQUIPMENT
Type of Equipment Peak Particle Velocity at
25 feet (inches/second)
Peak Particle Velocity at 50 feet
(inches/second)
Peak Particle Velocity at 100 feet
(inches/second)
Large Bulldozer 0.089 0.031 0.011
Loaded Trucks 0.076 0.027 0.010
Small Bulldozer 0.003 0.001 0.000
Auger/drill Rigs 0.089 0.031 0.011
Jackhammer 0.035 0.012 0.004
Vibratory Hammer 0.070 0.025 0.009
Vibratory Compactor/roller 0.210 0.074 0.026
Source: Transit Noise and Vibration Impact Assessment Guidelines. Federal Transit Administration. May 2006.
The Table 2 data indicate that construction vibration levels anticipated for the project are less than the 0.2 in/sec p.p.v. threshold of damage to buildings and less than the 0.1 in/sec threshold of annoyance criteria at distances of 50 feet. Sensitive receptors which could be impacted by construction related vibrations, especially vibratory compactors/rollers, are located approximately 75-100 feet, or further, from the project site. At these distances construction vibrations are not predicted to exceed acceptable levels. Additionally, construction activities would be temporary in nature and would likely occur during normal daytime working hours. Because construction vibrations are not predicted to cause damage to existing buildings or cause annoyance to sensitive receptors, implementation of the proposed project would not expose persons to or generate excessive ground borne vibration or ground borne noise levels.
This would be a less than significant impact. Mitigation for Impact 2: None Required
CEQA XII c): Would the project result in a substantial permanent increase in ambient noise levels in the project vicinity above levels existing without the project?
Increased Traffic Noise The traffic study2 prepared for the project indicates that the project would reduce daily trips from the 993 for the existing uses to 942 for the proposed project. Current daily traffic on the project access drive is approximately 1,280 trips which would reduce to 1,229 under the proposed project. This would result in a slight overall reduction of approximately -0.18 dB in traffic noise between the project site and Mt. Diablo Boulevard. Generally, a 3-5 dB increase in traffic noise is required before an audible change would be perceived. Therefore, this is an insignificant change in traffic noise.
2 Transportation Review. Woodbury Highlands Residential Condominiums. Abrams Associates. April 28, 2016.
Lisa Vilhauer, Branagh Development Inc. December 20, 2016
www.jcbrennanassoc.com
Page 8 of 13
File: Z:\jcb Project Folders\2016 Jobs\2016-156 Woodbury Highlands CEQA Addendum\Woodbury Highlands CEQA Noise Letter 12-20-16.docx
Increased Noise Due to New Residential Uses From a land use perspective, residential land uses are considered compatible with other residential uses. Examples of uses which are not compatible with neighboring residential uses include various commercial and industrial type uses. In the case of a commercial or industrial uses abutting a residential use, many jurisdictions require a that a sound wall be constructed between the uses. However, no such requirement would exist for residential uses as the degree of noise generated from one home to the next does not warrant special noise attenuation measures. In general noise generated by new residential uses would include passenger vehicle traffic, people talking, kids playing, air-conditioners, pool pumps, property maintenance, garbage collection, etc. These are all noise sources associated with any residential community and are the same types of noise sources which currently exist at the residences located around the project site. Typical nuisance noise issues which can arise between adjacent residential uses (dogs barking, loud music, etc.) are typically handled through enforcement of the City’s Municipal Code noise ordinance. Chapter 5-2 of the City’s Municipal Code establishes limits for nuisance types of noise, as discussed earlier. Increased Noise Due to Reflected Noise from Buildings and/or Sound Walls The proposed project includes the use of row homes and barriers to shield the project site from traffic noise on SR-24. In theory, this could cause sound to reflect and increase noise levels located on the north side of SR-24. However, based on research conducted by Caltrans, reflected sound from noise barriers has never exceeded 2 dBA, which is not considered to be an audible change. Caltrans provided the following discussion regarding barrier reflections3:
The reflection of noise from barriers can be a source of concern for residences in the vicinity of a barrier. A barrier that reduces noise at receivers on one side of the highway could potentially alter the noise at receivers on the other side. The complex nature of noise barrier reflections, difficulties in measuring them, and controversy surrounding the significance of their impacts deserve detailed discussion.
More noise barriers have been constructed in California than in any other
state, in many different configurations of alignment, profile, and height. These barriers are located along one or both sides of highways of different widths; along ramps, connectors, and interchanges; and in urban, suburban, and, rural regions under varying traffic conditions. The receivers for which they were designed are located in many different types of terrain, topography, and climate. The combinations and permutations associated with the vast variety of conditions inevitably increase the possibility of creating controversies over the extent of noise reflections by barriers. Therefore, it is only natural that noise reflection issues are on the rise in California, especially because almost all noise barriers here are made of noise-reflective material with hard, smooth surfaces, such as masonry and concrete. In most cases, the noise increases from reflections are so small that most people do not notice them. The people who do perceive increases in noise are usually suddenly made aware of freeway noise by an
3 California Department of Transportation. Technical Noise Supplement to the Traffic Noise Analysis Protocol. September 2013.

Lisa Vilhauer, Branagh Development Inc. December 20, 2016
www.jcbrennanassoc.com
Page 9 of 13
File: Z:\jcb Project Folders\2016 Jobs\2016-156 Woodbury Highlands CEQA Addendum\Woodbury Highlands CEQA Noise Letter 12-20-16.docx
event that triggers that awareness (e.g., construction of the noise barrier). Measured increases from noise reflections of more than 2 dBA have never been measured by Caltrans, but claims of 10 and even 20 dBA increases have been made occasionally.
Many complaints of large increases in noise came from residents living
far from the highway and were actually from changes in meteorology. Atmospheric refraction from wind shear and temperature gradients can account for 10- to 15-dBA variations when the same sources are measured from distances of approximately 1 to 2 miles. To measure the effects of noise reflections, before- and after-barrier noise measurements need to be carefully matched by wind speed, wind direction, temperature gradients, air temperature, humidity, and sky cover. Likewise, if a person perceives a noticeable increase in noise levels from a reflective noise barrier, he or she must be able to compare it mentally with a before-barrier condition that included the same meteorology. Of course, this process is very unreliable.
Based upon this information, the proposed project is not predicted to cause an increase in traffic noise exceeding 2 dBA. Generally, a 3-5 dB increase in traffic noise is required before an audible changed would be perceived. This would be a less than significant impact. Mitigation for Impact 3: None Required
CEQA XII d): Would the project result in asubstantial temporary or periodic increase in ambient noise levels in the project vicinity above levels existing without the project?
Construction Vehicles The transport of workers and equipment to the construction site would incrementally increase noise levels along site access roadways. The primary access routes for construction vehicles to the Project site would be Mt. Diablo Boulevard and the project access driveway. Project-related construction worker vehicles, haul trucks, and vendor trucks could pass by existing residential uses along the project access driveway southwest of the Project site. Construction-related activities would generate worker, vendor, and soil haul trips. The site preparation phase would generate the most trips, due to soil haul. Regardless, these construction-related trips would result in negligible noise level increases when compared to the traffic flow noise currently generated by Mt. Diablo Boulevard and State Route 24. In addition, these truck trips would be spread throughout the workday and would primarily occur during non-peak traffic periods. Therefore, noise impacts from construction-related truck traffic would be less than significant at noise-sensitive receptors along the construction route.

Lisa Vilhauer, Branagh Development Inc. December 20, 2016
www.jcbrennanassoc.com
Page 10 of 13
File: Z:\jcb Project Folders\2016 Jobs\2016-156 Woodbury Highlands CEQA Addendum\Woodbury Highlands CEQA Noise Letter 12-20-16.docx
Construction Equipment
The Federal Highway Administration’s (FHWA) Roadway Construction Noise Model (RCNM) was used to predict noise levels for standard construction equipment used for roadway improvement projects. The assessment of potential significant noise effects due to construction is based on the standards and procedures described in the Federal Transit Authority (FTA) guidance manual and FHWA’s RCNM.
The RCNM is a Windows-based noise prediction model that enables the prediction of construction noise levels for a variety of construction equipment based on a compilation of empirical data and the application of acoustical propagation formulas. It enables the calculation of construction noise levels in more detail than the manual methods, which eliminates the need to collect extensive amounts of project-specific input data. RCNM allows for the modeling of multiple pieces of construction equipment working either independently or simultaneously, the character of noise emission, and the usage factors for each piece of equipment.
Construction noise varies depending on the construction process, type of equipment involved, location of the construction site with respect to sensitive receptors, the schedule proposed to carry out each task (e.g., hours and days of the week), and the duration of the construction work.
Noise sources in the RCNM database include actual noise levels and equipment usage percentages. This source data was used in this construction noise analysis. Table 3 shows predicted construction noise levels for each of the project construction phases. The Table 3 analysis is based on the construction equipment assumptions contained in the project’s air quality analysis.4
4 Air Quality Impact Analysis, Woodbury Highlands Project. LSA Associates, Inc. July 2016.

Lisa Vilhauer, Branagh Development Inc. December 20, 2016
www.jcbrennanassoc.com
Page 11 of 13
File: Z:\jcb Project Folders\2016 Jobs\2016-156 Woodbury Highlands CEQA Addendum\Woodbury Highlands CEQA Noise Letter 12-20-16.docx
TABLE 3: CONSTRUCTION EQUIPMENT NOISE LEVELS FOR CONSTRUCTION PHASES
Equipment Quantity Usage (%) Maximum, Lmax (dBA at 50 feet)
Hourly Average, Leq
(dBA at 300 feet)
Demolition
Concrete/Industrial Saws 1 20 90 67
Excavators 3 40 81 66
Rubber Tired Dozers 2 40 82 65
Total: 71
Site Preparation
Rubber Tired Dozers 3 40 82 67
Tractors/Loaders/Backhoes 4 40 79 65
Total: 69
Grading
Excavators 1 40 81 61
Graders 1 40 85 65
Rubber Tired Dozers 1 40 82 62
Tractors/Loaders/Backhoes 3 40 79 64
Total: 70
Building Construction
Cranes 1 16 81 57
Forklifts 3 40 83 68
Generator Sets 1 50 81 62
Tractors/Loaders/Backhoes 3 40 79 64
Welders 1 40 74 54
Total: 71
Paving
Pavers 2 50 77 61
Paving Equipment 2 50 77 61
Rollers 2 20 80 60
Total: 66
Architectural Coating
Air Compressors 1 40 78 58
Total: 58
Source: FHWA, Roadway Construction Noise Model (RCNM), January 2006.
During the construction of the proposed project noise from construction activities would temporarily add to the noise environment in the project vicinity. As shown in Table 3, activities involved in construction would generate maximum noise levels ranging from 74 to 90 dB at 50 feet. Residential receptors located southwest and east of the project are located approximately 75-100 feet from the project site. Assuming worst-case that construction activity was to occur at this distance, maximum construction noise levels would be 68-86 dB Lmax. However, the majority of construction activity on the project site would occur at distances much greater than 75 feet. Construction activity occurring around the center of the project site would be located
Lisa Vilhauer, Branagh Development Inc. December 20, 2016
www.jcbrennanassoc.com
Page 12 of 13
File: Z:\jcb Project Folders\2016 Jobs\2016-156 Woodbury Highlands CEQA Addendum\Woodbury Highlands CEQA Noise Letter 12-20-16.docx
approximately 300 feet from the nearest residential receptors. At this distance, average construction noise levels would be approximately 58-71 dB Leq, as shown in Table 3. Construction could result in periods of elevated ambient noise levels and the potential for annoyance, especially when construction occurs near residential receptors. However, the City of Lafayette establishes allowable hours of operation and noise limits for construction activities to minimize disturbance associated with construction activities. Should construction activities not comply with these standards, construction of the project could result in a potentially significant noise impact.
According to the City of Lafayette Municipal Code, noise sources associated with construction are exempted from the City’s Municipal Code, provided said activities do not take place before 8:00 a.m. or after 8:00 p.m. on weekdays (taken to mean Monday through Saturday) or before 10:00 a.m. or after 6:00 p.m. on Sundays and federal holidays. Additionally, either noise levels produced by individual pieces of equipment shall not exceed 83 dBA at 50 feet, or the noise level at the nearest affected property shall not exceed 80 dBA. Provided that construction activities would comply with the hours stated in the Municipal Code, they would occur during the least noise sensitive portions of the day.
Implementation of the following mitigation measure, which requires compliance with the City of Lafayette construction policies, would ensure that intermittent noise emanating from construction equipment would result in a less-than-significant impact with respect to resulting in a substantial temporary or periodic increase in ambient noise levels in the project vicinity. With the outlined mitigation measure(s), this would be a less than significant impact. Mitigation Measure(s) The construction contractor shall adhere to the following measures during construction activities:
As required by the City of Lafayette’s Municipal Code, construction activities
should only take place between the hours of 8:00 a.m. to 8:00 p.m. weekdays and Saturdays, or between 10:00 a.m. and 6:00 p.m. Sundays and federal holidays.
As required by the City of Lafayette’s Municipal Code, either:
o noise levels produced by individual pieces of equipment shall not exceed 83 dBA at 50 feet, or
o noise levels, as measured on the nearest affected properties, shall not exceed 80 dBA.
Prior to the start of and for the duration of construction, the contractor shall properly
maintain and tune all construction equipment in accordance with the manufacturer’s recommendations to minimize noise emissions.
Prior to use of any construction equipment, the contractor shall fit all equipment
with properly operating mufflers, air intake silencers, and engine shrouds no less effective than as originally equipped by the manufacturer.
Lisa Vilhauer, Branagh Development Inc. December 20, 2016
www.jcbrennanassoc.com
Page 13 of 13
File: Z:\jcb Project Folders\2016 Jobs\2016-156 Woodbury Highlands CEQA Addendum\Woodbury Highlands CEQA Noise Letter 12-20-16.docx
During construction, the construction contractor shall place stationary construction equipment and material delivery (loading/unloading) areas to maintain the greatest distance from the nearest residences.
The construction contractor shall post a sign at the work site that is clearly visible
to the public, providing a contact name and telephone number for lodging a noise complaint.
These measures shall be listed on the grading plan and monitored by the City
during construction.
CEQA XII e): For a project located within an airport land use plan or, where such a plan has not been adopted, within two miles of a public airport or public use airport, would the project expose people residing or working in the project area to excessive noise levels?
There are no airports within two miles of the project site. Therefore, this impact is not applicable to the proposed project. Mitigation for Impact 5: None Required
CEQA XII f): For a project within the vicinity of a private airstrip, would the project expose people residing or working in the project area to excessive noise levels?
There are no private airstrips in the project vicinity. Therefore, this impact is not applicable to the proposed project. Mitigation for Impact 6: None Required I hope this information is helpful. If you have any questions, please contact me at (530) 823-0960 or [email protected]. Respectfully submitted, j.c. brennan & associates, Inc.
Luke Saxelby, INCE Bd. Cert. Vice President Board Certified, Institute of Noise Control Engineering

Prepared for:
Attn: Mike BranaghBranagh Development100 School StreetDanville, California 94526
Prepared by:
j.c. brennan & associates, Inc.
Luke Saxelby, INCE Bd. Cert.Vice PresidentBoard Certified, Institute of Noise Control Engineering (INCE)
Woodbury Highlands Residential Development
City of Lafayette, California
April 21, 2016
jcb Project # 2015-143
1287 High Street, Auburn, California 95603 * 530-823-0960 (p) * (530)823-0961 (f)

j.c. brennan & associates, Inc. Job # 2015-143
Environmental Noise AnalysisWoodbury Highlands – City of Lafayette, California
Page 1 of 9
INTRODUCTION The Woodbury Highlands project consists of a 94-unit multi-family residential development located north of Mt. Diablo Boulevard and south of State Route 24 (SR-24). The project is located in the City of Lafayette, California. Figure 1 shows an aerial photo of the project site. Figure 2 shows the project site plan.
ENVIRONMENTAL SETTING
Fundamentals of Acoustics
Acoustics is the science of sound. Sound may be thought of as mechanical energy of a vibrating object transmitted by pressure waves through a medium to human (or animal) ears. If the pressure variations occur frequently enough (at least 20 times per second), then they can be heard and are called sound. The number of pressure variations per second is called the frequency of sound, and is expressed as cycles per second or Hertz (Hz). Noise is a subjective reaction to different types of sounds. Noise is typically defined as (airborne) sound that is loud, unpleasant, unexpected or undesired, and may therefore be classified as a more specific group of sounds. Perceptions of sound and noise are highly subjective from person to person.
Measuring sound directly in terms of pressure would require a very large and awkward range of numbers. To avoid this, the decibel scale was devised. The decibel scale uses the hearing threshold (20 micropascals), as a point of reference, defined as 0 dB. Other sound pressures are then compared to this reference pressure, and the logarithm is taken to keep the numbers in a practical range. The decibel scale allows a million-fold increase in pressure to be expressed as 120 dB, and changes in levels (dB) correspond closely to human perception of relative loudness.
The perceived loudness of sounds is dependent upon many factors, including sound pressure level and frequency content. However, within the usual range of environmental noise levels, perception of loudness is relatively predictable, and can be approximated by A-weighted sound levels. There is a strong correlation between A-weighted sound levels (expressed as dBA) and the way the human ear perceives sound. For this reason, the A-weighted sound level has become the standard tool of environmental noise assessment. All noise levels reported in this section are in terms of A-weighted levels, unless otherwise noted.
The decibel scale is logarithmic, not linear. In other words, two sound levels 10 dB apart differ in acoustic energy by a factor of 10. When the standard logarithmic decibel is A-weighted, an increase of 10 dBA is generally perceived as a doubling in loudness. For example, a 70 dBA sound is half as loud as an 80 dBA sound, and twice as loud as a 60 dBA sound.
Community noise is commonly described in terms of the ambient noise level, which is defined as the all-encompassing noise level associated with a given environment. A common statistical tool is the average, or equivalent, sound level (Leq), which corresponds to a steady-state A weighted sound level containing the same total energy as a time varying signal over a given time period (usually one hour). The Leq is the foundation of the composite noise descriptor, Ldn, and shows very good correlation with community response to noise.

Woodbury HighlandsFigure 1: Project Site Plan and Unit Designations
Figure Prepared 4/21/16
Vista Flats Units
Woodbury HighlandsFigure 2: Noise Monitoring Sites
Figure Prepared 4/20/16
Project Site
: 24-hr Noise Measurement Location #
A
B

j.c. brennan & associates, Inc. Job # 2015-143
Environmental Noise AnalysisWoodbury Highlands – City of Lafayette, California
Page 4 of 9
The day/night average level (Ldn or DNL) is based upon the average noise level over a 24-hour day, with a +10 decibel weighing applied to noise occurring during nighttime (10:00 p.m. to 7:00 a.m.) hours. The nighttime penalty is based upon the assumption that people react to nighttime noise exposures as though they were twice as loud as daytime exposures. Because Ldn represents a 24-hour average, it tends to disguise short-term variations in the noise environment.
Table 1 lists several examples of the noise levels associated with common situations. Appendix A provides a summary of acoustical terms used in this report.
TABLE 1 TYPICAL NOISE LEVELS
Common Outdoor Activities Noise Level (dBA) Common Indoor Activities
--110-- Rock Band
Jet Fly-over at 300 m (1,000 ft.) --100--
Gas Lawn Mower at 1 m (3 ft.) --90--
Diesel Truck at 15 m (50 ft.),at 80 km/hr. (50 mph)
--80-- Food Blender at 1 m (3 ft.) Garbage Disposal at 1 m (3 ft.)
Noisy Urban Area, DaytimeGas Lawn Mower, 30 m (100 ft.)
--70-- Vacuum Cleaner at 3 m (10 ft.)
Commercial AreaHeavy Traffic at 90 m (300 ft.)
--60-- Normal Speech at 1 m (3 ft.)
Quiet Urban Daytime --50-- Large Business Office
Dishwasher in Next Room
Quiet Urban Nighttime --40-- Theater, Large Conference Room (Background)
Quiet Suburban Nighttime --30-- Library
Quiet Rural Nighttime --20-- Bedroom at Night, Concert Hall (Background)
--10-- Broadcast/Recording Studio
Lowest Threshold of Human Hearing --0-- Lowest Threshold of Human Hearing
Source: Caltrans, Technical Noise Supplement, Traffic Noise Analysis Protocol. November, 2009.

j.c. brennan & associates, Inc. Job # 2015-143
Environmental Noise AnalysisWoodbury Highlands – City of Lafayette, California
Page 5 of 9
Effects of Noise on People The effects of noise on people can be placed in three categories:
Subjective effects of annoyance, nuisance, and dissatisfaction
Interference with activities such as speech, sleep, and learning
Physiological effects such as hearing loss or sudden startling
Environmental noise typically produces effects in the first two categories. Workers in industrial plants can experience noise in the last category. There is no completely satisfactory way to measure the subjective effects of noise or the corresponding reactions of annoyance and dissatisfaction. A wide variation in individual thresholds of annoyance exists and different tolerances to noise tend to develop based on an individual’s past experiences with noise.
Thus, an important way of predicting a human reaction to a new noise environment is the way it compares to the existing environment to which one has adapted: the so-called ambient noise level. In general, the more a new noise exceeds the previously existing ambient noise level, the less acceptable the new noise will be judged by those hearing it.
With regard to increases in A-weighted noise level, the following relationships occur:
Except in carefully controlled laboratory experiments, a change of 1 dBA cannot be perceived;
Outside of the laboratory, a 3 dBA change is considered a just-perceivable difference;
A change in level of at least 5 dBA is required before any noticeable change in human response would be expected; and
A 10 dBA change is subjectively heard as approximately a doubling in loudness, and can cause an adverse response.
Stationary point sources of noise – including stationary mobile sources such as idling vehicles – attenuate (lessen) at a rate of approximately 6 dB per doubling of distance from the source, depending on environmental conditions (i.e. atmospheric conditions and either vegetative or manufactured noise barriers, etc.). Widely distributed noises, such as a large industrial facility spread over many acres, or a street with moving vehicles, would typically attenuate at a lower rate.

j.c. brennan & associates, Inc. Job # 2015-143
Environmental Noise AnalysisWoodbury Highlands – City of Lafayette, California
Page 6 of 9
REGULATORY CONTEXT
Federal
There are no federal regulations related to noise that apply to the Proposed Project.
State
California State Building Codes
The State Building Code, Title 24, Part 2 of the State of California Code of Regulations establishes uniform minimum noise insulation performance standards to protect persons within new buildings which house people, including hotels, motels, dormitories, apartment houses and dwellings other than single-family dwellings. Title 24 mandates that interior noise levels attributable to exterior sources shall not exceed 45 dB Ldn or CNEL in any habitable room.
Title 24 also mandates that for structures containing noise-sensitive uses to be located where the Ldn or CNEL exceeds 60 dB, an acoustical analysis must be prepared to identify mechanisms for limiting exterior noise to the prescribed allowable interior levels. If the interior allowable noise levels are met by requiring that windows be kept closed, the design for the structure must also specify a ventilation or air conditioning system to provide a habitable interior environment
City of Lafayette General Plan Noise Element The City of Lafayette General Plan establishes an acceptable exterior noise level of 65 dB Ldn
for small decks and patios of multi-family residential uses. An acceptable interior noise level standard of 45 dB Ldn is also established for all residential uses. EVALUATION OF FUTURE TRAFFIC NOISE LEVELS AT THE PROJECT SITE Existing Traffic Noise Levels j.c. brennan & associates, Inc. staff conducted continuous 24-hour noise level measurements at the project site on Wednesday, May 13th 2015. See Figure 1 for noise measurement locations. A Larson Davis Laboratories (LDL) Model 820 precision integrating sound level meter was used for the ambient noise level measurement survey. The meter was calibrated before and after use with an LDL Model CAL200 acoustical calibrator to ensure the accuracy of the measurements. The equipment used meets all pertinent specifications of the American National Standards Institute for Type 1 sound level meters (ANSI S1.4). The sound level meter was programmed to collect hourly noise level intervals during the survey. The maximum value (Lmax) represents the highest noise level measured during each one-hour period, the average value (Leq) represents the energy average of all of the noise measured during each one-hour period, and the median value (L50) represents the sound level exceeded 50 percent of the time during each one-hour period.

j.c. brennan & associates, Inc. Job # 2015-143
Environmental Noise AnalysisWoodbury Highlands – City of Lafayette, California
Page 7 of 9
The noise level measurement survey results are provided in Table 2. Appendix B provides the complete results of the continuous noise level measurement.
Table 2 Summary of Existing Background Noise Measurement Data
Location Date Ldn
Average Measured Hourly Noise Levels, dB
Site
Daytime (7am-10pm) Nighttime (10pm-7am)
Leq L50 Lmax Leq L50 Lmax
Continuous (24-hour) Noise Level Measurements
A North side of site. 145 feet from centerline of SR-24.
Wednesday5/13/15
73 70 69 81 66 62 81
B Northeast corner of site. 225 feet from centerline of SR-24
Wednesday5/13/15
67 64 63 78 60 57 75
Source: j.c. brennan & associates, Inc., 2015.
Measured noise levels shown in Table 2 were compared to the FHWA traffic noise prediction model to calibrate the model to existing site conditions. The FHWA model was found to over-predict traffic noise levels on the project site by 5- to 8- dBA over the full 24-hour period, as shown in Appendix C.
It should be noted that the Pittsburg/Bay Point BART line runs through the center median of SR-24. While occasional train passages are audible at times, they do not substantially contribute to overall noise levels at the project site. Therefore, this analysis does not focus on noise from BART operations.

j.c. brennan & associates, Inc. Job # 2015-143
Environmental Noise AnalysisWoodbury Highlands – City of Lafayette, California
Page 8 of 9
Future Traffic Noise Levels To determine the future traffic noise levels on the project site, j.c. brennan & associates, Inc., utilized the calibrated FHWA traffic noise prediction model and Cumulative (2040) traffic forecasts from Contra Costa County and Caltrans. 1 Table 3 shows the predicted future traffic noise levels at the proposed residential units adjacent to SR-24. A complete listing of the FHWA Traffic Noise Prediction Model inputs is provided in Appendix D. The Table 3 data account for shielding from intervening builds which will shield outdoor areas of the project.
TABLE 3 PREDICTED FUTURE TRAFFIC NOISE LEVELS
Location Distance Predicted Traffic Noise
Levels, DNL
SR-24 – 2040 ADT = 206,752
Highland Rows Patios 180’ 62 dB
Garden Terrace Patios 215’ 64 dB
Vista Flats Patios 240’ 60 dB
Sources: j.c. brennan & associates, Inc., and FHWA RD-77-108
Based upon the predicted future traffic noise levels shown in Table 3, the residential outdoor areas of the project will be exposed to future exterior traffic noise levels up to 64 dB Ldn. This would comply with the City of Lafayette 65 dB Ldn exterior noise level standard for multi-family developments.
1 2014 Countywide Comprehensive Transportation Plan. Contra Costa County Transportation Authority. August 1,
2014.

j.c. brennan & associates, Inc. Job # 2015-143
Environmental Noise AnalysisWoodbury Highlands – City of Lafayette, California
Page 9 of 9
Interior Traffic Noise Levels: Standard construction practices, consistent with the uniform building code typically provides an exterior-to-interior noise level reduction of approximately 25 dB, assuming that air conditioning is included for each unit, which allows residents to close windows for the required acoustical isolation. Therefore, as long as exterior noise levels at the building facades do not exceed 70 dB Ldn, the interior noise levels will typically comply with the interior noise level standard of 45 dB Ldn.
Exterior noise levels at the second floor façade of the Highland Row units are predicted to be up to 78 dB Ldn, as shown in Appendix E. Upper floors of the second row units (Garden Terrace / Vista Flat) are predicted to be exposed to exterior noise levels of up to 74 dB Ldn. Therefore, additional interior noise reduction measures would be required for these units.
It is expected that interior noise control measures would include the use of resilient channels (RC) and sound transmission class (STC) 35 rated windows assemblies to achieve compliance with the City of Lafayette 45 dB Ldn interior noise level standard for all units facing towards SR-24. Additionally, the Highland Row units located along the SR-24 right-of-way should have minimal glazing facing the highway. Any windows facing SR-24 would likely require an STC rating of 38-40. Because the project is still undergoing design development, a detailed analysis of interior noise control measures should be developed as the project design progresses.
CONCLUSIONS
The proposed project is predicted to be experience exterior noise level which meet the City of Lafayette 65 dB Ldn noise level standard for small decks and patios exposed to transportation noise from SR-24. However, the future residential used could be exposed to noise levels exceeding the City of Lafayette interior noise level standards. Therefore, the following interior noise control measures would be required:
A detailed analysis of interior noise control measures should be conducted prior to the completion of building plans. The analysis should outline specific wall and windows requirements to achieve the City’s 45 dB Ldn interior noise level standard. The analysis should be prepared by a qualified noise control engineer.
Air conditioning should be included in all residences to allow occupants to close
doors and windows as desired for acoustical isolation.

Appendix A Acoustical Terminology
Acoustics The science of sound.
Ambient Noise The distinctive acoustical characteristics of a given space consisting of all noise sources audible at that location. In many cases, the term ambient is used to describe an existing or pre-project condition such as the setting in an environmental noise study.
Attenuation The reduction of an acoustic signal.
A-Weighting A frequency-response adjustment of a sound level meter that conditions the output signal to approximate human response.
Decibel or dB Fundamental unit of sound, A Bell is defined as the logarithm of the ratio of the sound pressure squared over the reference pressure squared. A Decibel is one-tenth of a Bell.
CNEL Community Noise Equivalent Level. Defined as the 24-hour average noise level with noise occurring during evening hours (7 - 10 p.m.) weighted by a factor of three and nighttime hours weighted by a factor of 10 prior to averaging.
Frequency The measure of the rapidity of alterations of a periodic signal, expressed in cycles per second or hertz (Hz).
Ldn Day/Night Average Sound Level. Similar to CNEL but with no evening weighting.
Leq Equivalent or energy-averaged sound level.
Lmax The highest root-mean-square (RMS) sound level measured over a given period of time.
L(n) The sound level exceeded a described percentile over a measurement period. For instance, an hourly L50 is the sound level exceeded 50% of the time during the one hour period.
Loudness A subjective term for the sensation of the magnitude of sound. Noise Unwanted sound.
NRC Noise Reduction Coefficient. NRC is a single-number rating of the sound-absorption of a material equal to the arithmetic mean of the sound-absorption coefficients in the 250, 500, 1000, and 2,000 Hz octave frequency bands rounded to the nearest multiple of 0.05. It is a representation of the amount of sound energy absorbed upon striking a particular surface. An NRC of 0 indicates perfect reflection; an NRC of 1 indicates perfect absorption.
Peak Noise The level corresponding to the highest (not RMS) sound pressure measured over a given period of time. This term is often confused with the AMaximum@ level, which is the highest RMS level.
RT60 The time it takes reverberant sound to decay by 60 dB once the source has been removed.
Sabin The unit of sound absorption. One square foot of material absorbing 100% of incident sound has an absorption of 1 Sabin.
SEL Sound Exposure Level. SEL is s rating, in decibels, of a discrete event, such as an aircraft flyover or train passby, that compresses the total sound energy into a one-second event.
STC Sound Transmission Class. STC is an integer rating of how well a building partition attenuates airborne sound. It is widely used to rate interior partitions, ceilings/floors, doors, windows and exterior wall configurations.
Threshold The lowest sound that can be perceived by the human auditory system, generally considered to be 0 dB for of Hearing persons with perfect hearing.
Threshold Approximately 120 dB above the threshold of hearing. of Pain Impulsive Sound of short duration, usually less than one second, with an abrupt onset and rapid decay. Simple Tone Any sound which can be judged as audible as a single pitch or set of single pitches.

Appendix B-1
Hour Leq Lmax L50 L900:00:00 64 85 62 511:00:00 62 75 58 44 High Low Average High Low Average2:00:00 61 80 56 44 Leq (Average) 70 68 70 69 61 663:00:00 61 85 56 47 Lmax (Maximum) 89 77 81 85 75 814:00:00 63 80 61 55 L50 (Median) 70 68 69 68 56 625:00:00 67 83 65 61 L90 (Background) 67 63 66 64 44 546:00:00 69 82 68 647:00:00 70 77 70 67 Computed Ldn, dB 738:00:00 70 81 70 67 % Daytime Energy 80%9:00:00 70 79 69 66 % Nighttime Energy 20%10:00:00 69 79 69 6511:00:00 69 78 69 6512:00:00 70 79 70 6713:00:00 70 84 69 6714:00:00 70 82 70 6715:00:00 70 86 69 6716:00:00 69 89 68 6717:00:00 69 81 68 6618:00:00 69 86 69 6519:00:00 70 82 70 6720:00:00 69 78 69 6521:00:00 68 80 68 6322:00:00 68 78 68 6323:00:00 67 81 66 60
Statistical SummaryNighttime (10 p.m. - 7 a.m.)
Mt Diablo Blvd MultiFam Res24hr Continuous Noise Monitoring - Site A
Daytime (7 a.m. - 10 p.m.)
Wednesday, May 13, 2015

Ldn = 73 dB
Mt Diablo Blvd MultiFam Res24hr Continuous Noise Monitoring - Site A
Wednesday, May 13, 2015
Appendix B-1
30
40
50
60
70
80
90
100
12 AM 4 AM 8 AM 12 PM 4 PM 8 PM
So
un
d L
eve
l, d
B
Hour of Day
Leq Lmax L50 L90
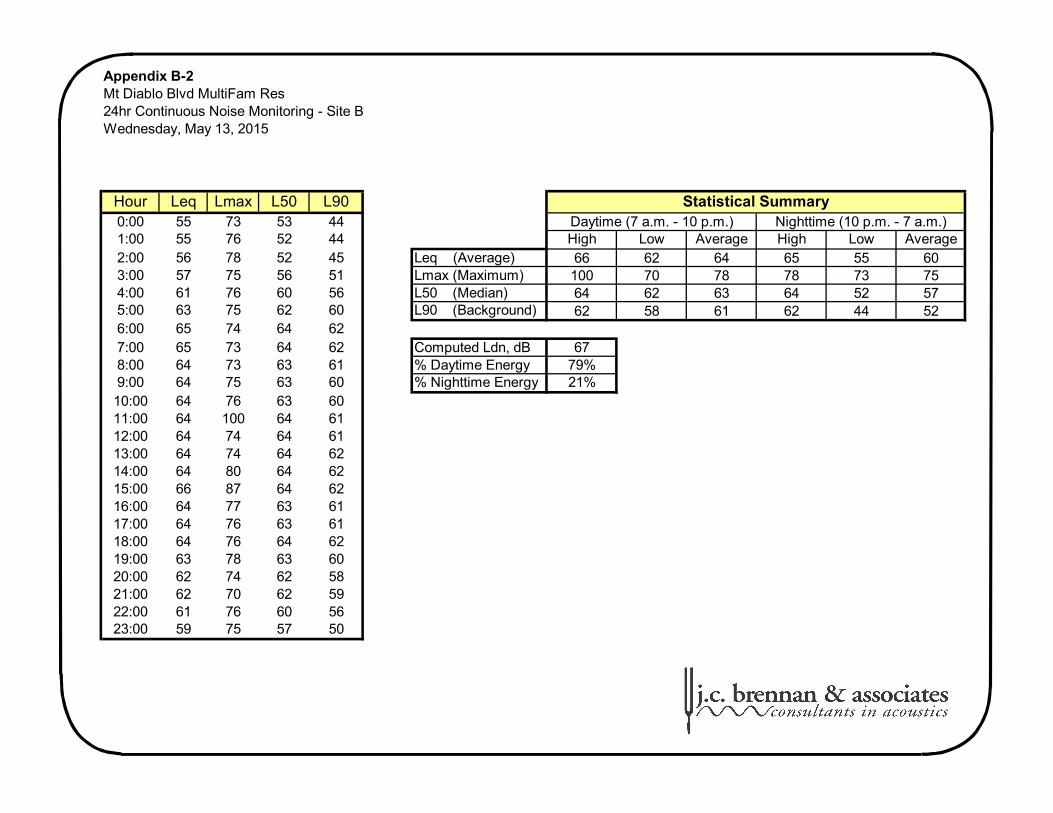
Appendix B-2
Hour Leq Lmax L50 L900:00 55 73 53 441:00 55 76 52 44 High Low Average High Low Average2:00 56 78 52 45 Leq (Average) 66 62 64 65 55 603:00 57 75 56 51 Lmax (Maximum) 100 70 78 78 73 754:00 61 76 60 56 L50 (Median) 64 62 63 64 52 575:00 63 75 62 60 L90 (Background) 62 58 61 62 44 526:00 65 74 64 627:00 65 73 64 62 Computed Ldn, dB 678:00 64 73 63 61 % Daytime Energy 79%9:00 64 75 63 60 % Nighttime Energy 21%10:00 64 76 63 6011:00 64 100 64 6112:00 64 74 64 6113:00 64 74 64 6214:00 64 80 64 6215:00 66 87 64 6216:00 64 77 63 6117:00 64 76 63 6118:00 64 76 64 6219:00 63 78 63 6020:00 62 74 62 5821:00 62 70 62 5922:00 61 76 60 5623:00 59 75 57 50
Mt Diablo Blvd MultiFam Res24hr Continuous Noise Monitoring - Site B
Daytime (7 a.m. - 10 p.m.)
Wednesday, May 13, 2015
Statistical SummaryNighttime (10 p.m. - 7 a.m.)

Ldn = 67 dB
24hr Continuous Noise Monitoring - Site BWednesday, May 13, 2015
Appendix B-2Mt Diablo Blvd MultiFam Res
30
40
50
60
70
80
90
100
12 AM 4 AM 8 AM 12 PM 4 PM 8 PM
So
un
d L
eve
l, d
B
Hour of Day
Leq Lmax L50
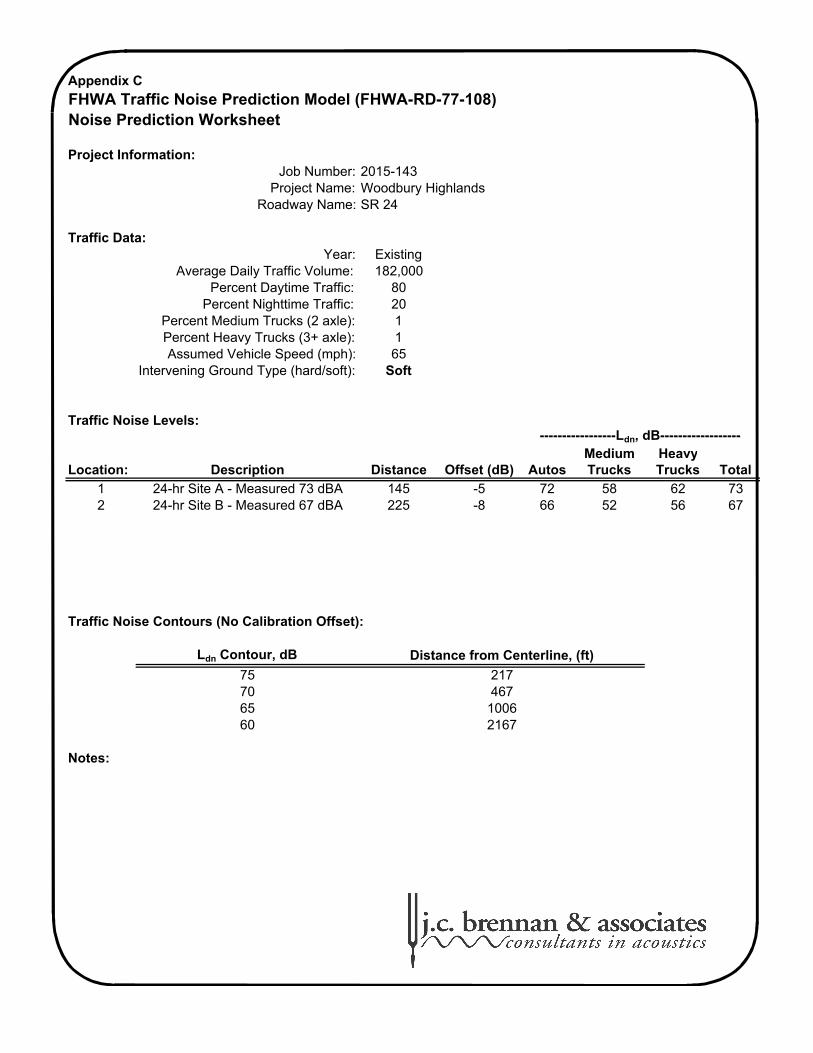
Existing182,000
80201165
Soft
Medium HeavyLocation: Description Distance Offset (dB) Autos Trucks Trucks Total
1 24-hr Site A - Measured 73 dBA 145 -5 72 58 62 732 24-hr Site B - Measured 67 dBA 225 -8 66 52 56 67
Ldn Contour, dB
75706560
Notes:
Intervening Ground Type (hard/soft):
10062167
Percent Nighttime Traffic:Percent Medium Trucks (2 axle):
Job Number:Project Name:
Roadway Name:
Year:
Project Information:
Traffic Data:
Traffic Noise Levels:
Traffic Noise Contours (No Calibration Offset):
-----------------Ldn, dB------------------
Distance from Centerline, (ft)
217
2015-143Woodbury Highlands
Appendix C
467
SR 24
Percent Heavy Trucks (3+ axle):Assumed Vehicle Speed (mph):
FHWA Traffic Noise Prediction Model (FHWA-RD-77-108) Noise Prediction Worksheet
Average Daily Traffic Volume:Percent Daytime Traffic:
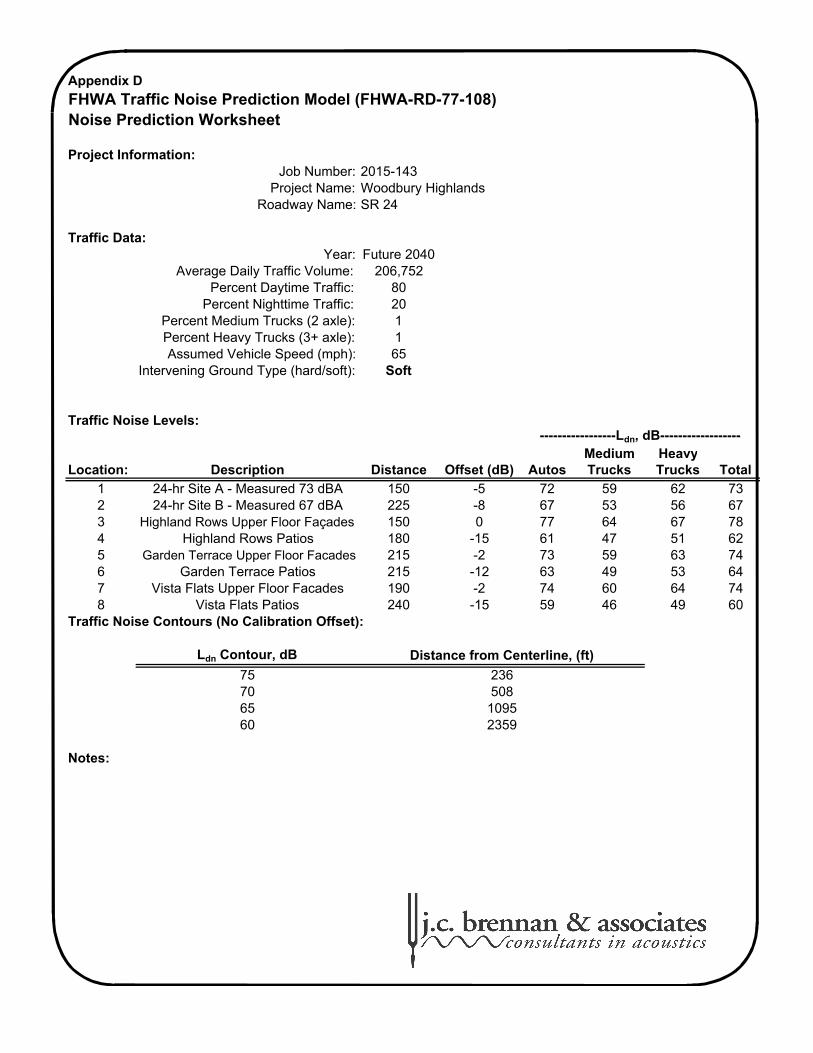
Future 2040206,752
80201165
Soft
Medium HeavyLocation: Description Distance Offset (dB) Autos Trucks Trucks Total
1 24-hr Site A - Measured 73 dBA 150 -5 72 59 62 732 24-hr Site B - Measured 67 dBA 225 -8 67 53 56 673 Highland Rows Upper Floor Façades 150 0 77 64 67 784 Highland Rows Patios 180 -15 61 47 51 625 Garden Terrace Upper Floor Facades 215 -2 73 59 63 746 Garden Terrace Patios 215 -12 63 49 53 647 Vista Flats Upper Floor Facades 190 -2 74 60 64 748 Vista Flats Patios 240 -15 59 46 49 60
Ldn Contour, dB
75706560
Notes:
Appendix D
508
SR 24
Percent Heavy Trucks (3+ axle):Assumed Vehicle Speed (mph):
FHWA Traffic Noise Prediction Model (FHWA-RD-77-108) Noise Prediction Worksheet
Average Daily Traffic Volume:Percent Daytime Traffic:
Project Information:
Traffic Data:
Traffic Noise Levels:
Traffic Noise Contours (No Calibration Offset):
-----------------Ldn, dB------------------
Distance from Centerline, (ft)
236
2015-143Woodbury Highlands
Percent Nighttime Traffic:Percent Medium Trucks (2 axle):
Job Number:Project Name:
Roadway Name:
Year:
Intervening Ground Type (hard/soft):
10952359

Appendix E 1
Plans Dated:Analysis Date:
Room Description:
Parallel Panel Size, ft2: 250 200
Parallel Exterior level, dB: 78 78
Correction Factor, dB: 5
Freeway Traffic Parallel, dB 56 55 56 60 61 63 65 67 70 71 70 69 67 64 62 59
Freeway Traffic Perpendicular, dB 56 55 56 60 61 63 65 67 70 71 70 69 67 64 62 59
One-Third Octave Band Center Frequency (Hz)
Material Area(ft 2 ) 125 160 200 250 315 400 500 630 800 1K 1.25K 1.6K 2K 2.5K 3.15K 4K
Gyp Board 1399 0.29 0.29 0.10 0.10 0.10 0.05 0.05 0.05 0.04 0.04 0.04 0.07 0.07 0.07 0.09 0.09Glass 36 0.35 0.35 0.25 0.25 0.25 0.18 0.18 0.18 0.12 0.12 0.12 0.01 0.01 0.01 0.04 0.04
Linoleum, rubber, or asphalt tile on concrete 500 0.02 0.02 0.03 0.03 0.03 0.03 0.03 0.03 0.03 0.03 0.03 0.03 0.03 0.03 0.02 0.02Soft Furnishings 50 0.19 0.19 0.37 0.37 0.37 0.56 0.56 0.56 0.67 0.67 0.67 0.61 0.61 0.61 0.59 0.59
0.00 0.00 0.00 0.00 0.00 0.00 0.00 0.00 0.00 0.00 0.00 0.00 0.00 0.00 0.00 0.00-2 -2 1 1 1 3 3 3 4 4 4 2 2 2 2 2
-3 -3 0 0 0 2 2 2 3 3 3 1 1 1 1 1
Wall - Wood with Sheath and RC 240 26 27 30 35 41 43 49 52 56 58 59 60 61 60 58 60Window - Quiet Home STC 38 10 29 28 29 28 32 34 37 38 39 39 38 38 39 41 42 42
0 0 0 0 0 0 0 0 0 0 0 0 0 0 0 0
Wall - Wood with Sheath and RC 200 26 27 30 35 41 43 49 52 56 58 59 60 61 60 58 600 0 0 0 0 0 0 0 0 0 0 0 0 0 0 00 0 0 0 0 0 0 0 0 0 0 0 0 0 0 0
26 27 30 34 40 42 47 49 51 52 51 51 52 54 54 5526 27 30 35 41 43 49 52 56 58 59 60 61 60 58 60-2 -2 1 1 1 3 3 3 4 4 4 2 2 2 2 2-3 -3 0 0 0 2 2 2 3 3 3 1 1 1 1 15 5 5 5 5 5 5 5 5 5 5 5 5 5 5 5
32 31 33 32 27 29 26 26 27 27 27 25 22 18 15 1131 30 32 30 25 27 23 23 21 20 19 16 13 11 10 5
Parallel Outside Level, dB: 78 Perpendicular Outside Level, dB: 78Noise Reduction, dB: 36
Parallel Interior Level, dB: 40 Perpendicular Interior Level, dB: 38
42
Absorption Perpendicular, dB:
Transmission Loss Information: Perpendicular Façade
Transmission Loss Information: Parallel Façade
Composite TL - Parallel, dB:
Interior Level - Parallel, dB:Interior Level - Perpendicular, dB:
Highland Rows - Living/Kitchen
Perpendicular Panel Size, ft2:
Perpendicular Exterior level, dB:
Sound Absorption Data:
Building Facade Noise Reduction Worksheet Woodbury Highlands
August 31, 2015
4/20/2016 0:00
Summary
Noise Source Information:
Absorption Parallel, dB:
Total Interior Noise Level, dB:
Composite TL - Perpendicular, dB:Absorption Parallel, dB:
Absorption Perpendicular, dB:Safety Factor, dB:

Appendix E 2
Plans Dated:Analysis Date:
Room Description:
Parallel Panel Size, ft2: 130 130
Parallel Exterior level, dB: 78 78
Correction Factor, dB: 5
Freeway Traffic Parallel, dB 56 55 56 60 61 63 65 67 70 71 70 69 67 64 62 59
Freeway Traffic Perpendicular, dB 56 55 56 60 61 63 65 67 70 71 70 69 67 64 62 59
One-Third Octave Band Center Frequency (Hz)
Material Area(ft 2 ) 125 160 200 250 315 400 500 630 800 1K 1.25K 1.6K 2K 2.5K 3.15K 4K
Gyp Board 601 0.29 0.29 0.10 0.10 0.10 0.05 0.05 0.05 0.04 0.04 0.04 0.07 0.07 0.07 0.09 0.09Glass 36 0.35 0.35 0.25 0.25 0.25 0.18 0.18 0.18 0.12 0.12 0.12 0.01 0.01 0.01 0.04 0.04
Linoleum, rubber, or asphalt tile on concrete 169 0.02 0.02 0.03 0.03 0.03 0.03 0.03 0.03 0.03 0.03 0.03 0.03 0.03 0.03 0.02 0.02Soft Furnishings 25 0.19 0.19 0.37 0.37 0.37 0.56 0.56 0.56 0.67 0.67 0.67 0.61 0.61 0.61 0.59 0.59
0.00 0.00 0.00 0.00 0.00 0.00 0.00 0.00 0.00 0.00 0.00 0.00 0.00 0.00 0.00 0.00-2 -2 2 2 2 4 4 4 4 4 4 3 3 3 2 2
-2 -2 2 2 2 4 4 4 4 4 4 3 3 3 2 2
Wall - Wood with Sheath and RC 130 26 27 30 35 41 43 49 52 56 58 59 60 61 60 58 600 0 0 0 0 0 0 0 0 0 0 0 0 0 0 00 0 0 0 0 0 0 0 0 0 0 0 0 0 0 0
Wall - Wood with Sheath and RC 130 26 27 30 35 41 43 49 52 56 58 59 60 61 60 58 600 0 0 0 0 0 0 0 0 0 0 0 0 0 0 00 0 0 0 0 0 0 0 0 0 0 0 0 0 0 0
26 27 30 35 41 43 49 52 56 58 59 60 61 60 58 6026 27 30 35 41 43 49 52 56 58 59 60 61 60 58 60-2 -2 2 2 2 4 4 4 4 4 4 3 3 3 2 2-2 -2 2 2 2 4 4 4 4 4 4 3 3 3 2 25 5 5 5 5 5 5 5 5 5 5 5 5 5 5 5
33 31 33 31 27 29 25 24 23 22 20 17 14 12 11 733 31 33 31 27 29 25 24 23 22 20 17 14 12 11 7
Parallel Outside Level, dB: 78 Perpendicular Outside Level, dB: 78Noise Reduction, dB: 35
Parallel Interior Level, dB: 40 Perpendicular Interior Level, dB: 40
43
Safety Factor, dB:Interior Level - Parallel, dB:
Interior Level - Perpendicular, dB:
Total Interior Noise Level, dB:
Transmission Loss Information: Perpendicular Façade
SummaryComposite TL - Parallel, dB:
Composite TL - Perpendicular, dB:Absorption Parallel, dB:
Absorption Perpendicular, dB:
Perpendicular Exterior level, dB:
Noise Source Information:
Sound Absorption Data:
Absorption Parallel, dB:
Absorption Perpendicular, dB:
Transmission Loss Information: Parallel Façade
Building Facade Noise Reduction Worksheet Woodbury Highlands
August 31, 2015
4/20/2016 0:00
Highland Rows - Bedroom
Perpendicular Panel Size, ft2:
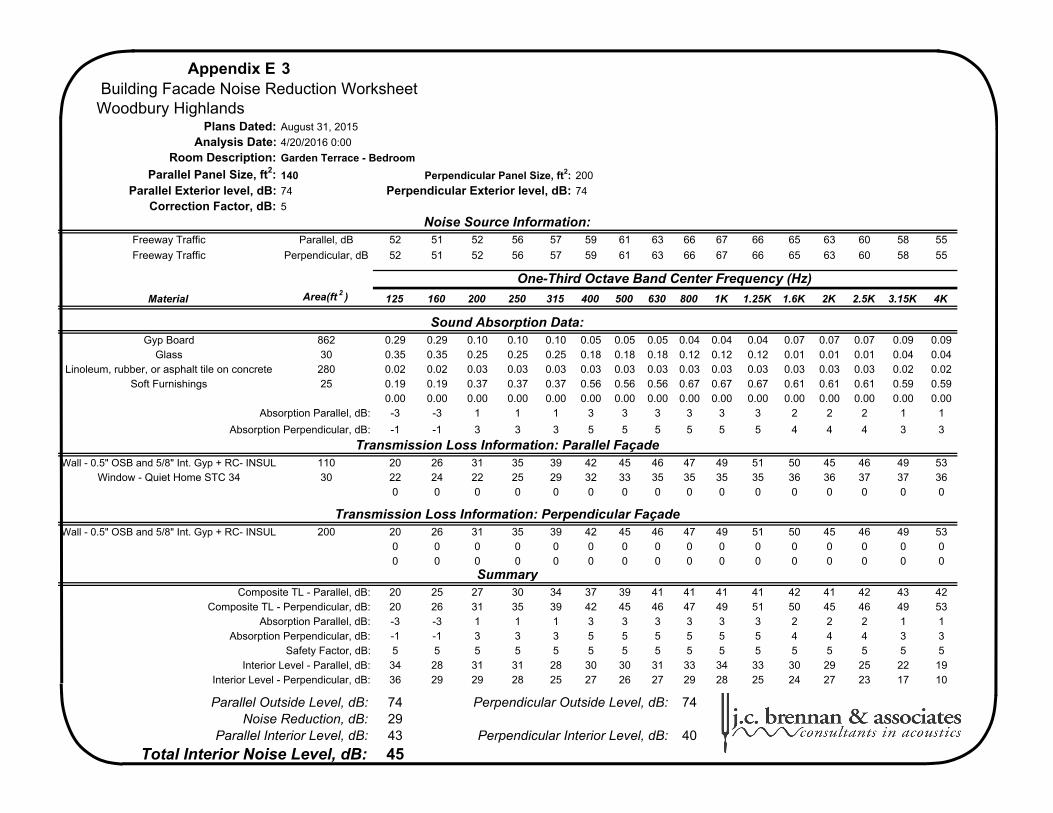
Appendix E 3
Plans Dated:Analysis Date:
Room Description:
Parallel Panel Size, ft2: 140 200
Parallel Exterior level, dB: 74 74
Correction Factor, dB: 5
Freeway Traffic Parallel, dB 52 51 52 56 57 59 61 63 66 67 66 65 63 60 58 55
Freeway Traffic Perpendicular, dB 52 51 52 56 57 59 61 63 66 67 66 65 63 60 58 55
One-Third Octave Band Center Frequency (Hz)
Material Area(ft 2 ) 125 160 200 250 315 400 500 630 800 1K 1.25K 1.6K 2K 2.5K 3.15K 4K
Gyp Board 862 0.29 0.29 0.10 0.10 0.10 0.05 0.05 0.05 0.04 0.04 0.04 0.07 0.07 0.07 0.09 0.09Glass 30 0.35 0.35 0.25 0.25 0.25 0.18 0.18 0.18 0.12 0.12 0.12 0.01 0.01 0.01 0.04 0.04
Linoleum, rubber, or asphalt tile on concrete 280 0.02 0.02 0.03 0.03 0.03 0.03 0.03 0.03 0.03 0.03 0.03 0.03 0.03 0.03 0.02 0.02Soft Furnishings 25 0.19 0.19 0.37 0.37 0.37 0.56 0.56 0.56 0.67 0.67 0.67 0.61 0.61 0.61 0.59 0.59
0.00 0.00 0.00 0.00 0.00 0.00 0.00 0.00 0.00 0.00 0.00 0.00 0.00 0.00 0.00 0.00-3 -3 1 1 1 3 3 3 3 3 3 2 2 2 1 1
-1 -1 3 3 3 5 5 5 5 5 5 4 4 4 3 3
Wall - 0.5" OSB and 5/8" Int. Gyp + RC- INSUL 110 20 26 31 35 39 42 45 46 47 49 51 50 45 46 49 53Window - Quiet Home STC 34 30 22 24 22 25 29 32 33 35 35 35 35 36 36 37 37 36
0 0 0 0 0 0 0 0 0 0 0 0 0 0 0 0
Wall - 0.5" OSB and 5/8" Int. Gyp + RC- INSUL 200 20 26 31 35 39 42 45 46 47 49 51 50 45 46 49 530 0 0 0 0 0 0 0 0 0 0 0 0 0 0 00 0 0 0 0 0 0 0 0 0 0 0 0 0 0 0
20 25 27 30 34 37 39 41 41 41 41 42 41 42 43 4220 26 31 35 39 42 45 46 47 49 51 50 45 46 49 53-3 -3 1 1 1 3 3 3 3 3 3 2 2 2 1 1-1 -1 3 3 3 5 5 5 5 5 5 4 4 4 3 35 5 5 5 5 5 5 5 5 5 5 5 5 5 5 5
34 28 31 31 28 30 30 31 33 34 33 30 29 25 22 1936 29 29 28 25 27 26 27 29 28 25 24 27 23 17 10
Parallel Outside Level, dB: 74 Perpendicular Outside Level, dB: 74Noise Reduction, dB: 29
Parallel Interior Level, dB: 43 Perpendicular Interior Level, dB: 40
45
Safety Factor, dB:Interior Level - Parallel, dB:
Interior Level - Perpendicular, dB:
Total Interior Noise Level, dB:
Transmission Loss Information: Perpendicular Façade
SummaryComposite TL - Parallel, dB:
Composite TL - Perpendicular, dB:Absorption Parallel, dB:
Absorption Perpendicular, dB:
Perpendicular Exterior level, dB:
Noise Source Information:
Sound Absorption Data:
Absorption Parallel, dB:
Absorption Perpendicular, dB:
Transmission Loss Information: Parallel Façade
Building Facade Noise Reduction Worksheet Woodbury Highlands
August 31, 2015
4/20/2016 0:00
Garden Terrace - Bedroom
Perpendicular Panel Size, ft2:

Appendix E 4
Plans Dated:Analysis Date:
Room Description:
Parallel Panel Size, ft2: 250 250
Parallel Exterior level, dB: 74 74
Correction Factor, dB: 5
Freeway Traffic Parallel, dB 52 51 52 56 57 59 61 63 66 67 66 65 63 60 58 55
Freeway Traffic Perpendicular, dB 52 51 52 56 57 59 61 63 66 67 66 65 63 60 58 55
One-Third Octave Band Center Frequency (Hz)
Material Area(ft 2 ) 125 160 200 250 315 400 500 630 800 1K 1.25K 1.6K 2K 2.5K 3.15K 4K
Gyp Board 1447 0.29 0.29 0.10 0.10 0.10 0.05 0.05 0.05 0.04 0.04 0.04 0.07 0.07 0.07 0.09 0.09Glass 78 0.35 0.35 0.25 0.25 0.25 0.18 0.18 0.18 0.12 0.12 0.12 0.01 0.01 0.01 0.04 0.04
Linoleum, rubber, or asphalt tile on concrete 625 0.02 0.02 0.03 0.03 0.03 0.03 0.03 0.03 0.03 0.03 0.03 0.03 0.03 0.03 0.02 0.02Soft Furnishings 50 0.19 0.19 0.37 0.37 0.37 0.56 0.56 0.56 0.67 0.67 0.67 0.61 0.61 0.61 0.59 0.59
0.00 0.00 0.00 0.00 0.00 0.00 0.00 0.00 0.00 0.00 0.00 0.00 0.00 0.00 0.00 0.00-3 -3 1 1 1 3 3 3 3 3 3 2 2 2 2 2
-3 -3 1 1 1 3 3 3 3 3 3 2 2 2 2 2
Wall - 0.5" OSB and 5/8" Int. Gyp + RC- INSUL 172 20 26 31 35 39 42 45 46 47 49 51 50 45 46 49 53Window - Quiet Home STC 34 78 22 24 22 25 29 32 33 35 35 35 35 36 36 37 37 36
0 0 0 0 0 0 0 0 0 0 0 0 0 0 0 0
Wall - 0.5" OSB and 5/8" Int. Gyp + RC- INSUL 250 20 26 31 35 39 42 45 46 47 49 51 50 45 46 49 530 0 0 0 0 0 0 0 0 0 0 0 0 0 0 00 0 0 0 0 0 0 0 0 0 0 0 0 0 0 0
21 25 26 29 33 36 37 39 39 40 40 41 40 41 41 4120 26 31 35 39 42 45 46 47 49 51 50 45 46 49 53-3 -3 1 1 1 3 3 3 3 3 3 2 2 2 2 2-3 -3 1 1 1 3 3 3 3 3 3 2 2 2 2 25 5 5 5 5 5 5 5 5 5 5 5 5 5 5 5
34 28 32 32 29 31 31 32 34 35 34 32 30 26 23 2134 27 27 26 24 25 24 25 27 26 23 22 25 21 16 9
Parallel Outside Level, dB: 74 Perpendicular Outside Level, dB: 74Noise Reduction, dB: 29
Parallel Interior Level, dB: 44 Perpendicular Interior Level, dB: 38
45
Safety Factor, dB:Interior Level - Parallel, dB:
Interior Level - Perpendicular, dB:
Total Interior Noise Level, dB:
Transmission Loss Information: Perpendicular Façade
SummaryComposite TL - Parallel, dB:
Composite TL - Perpendicular, dB:Absorption Parallel, dB:
Absorption Perpendicular, dB:
Perpendicular Exterior level, dB:
Noise Source Information:
Sound Absorption Data:
Absorption Parallel, dB:
Absorption Perpendicular, dB:
Transmission Loss Information: Parallel Façade
Building Facade Noise Reduction Worksheet Woodbury Highlands
August 31, 2015
4/20/2016 0:00
Garden Terrace - Living
Perpendicular Panel Size, ft2:


