90
.

.

,,
,.
,. ,
,
, ,,
,, ,.,,
N
T d o ci d i su t s po tD e po T r a ni t i no ie x cT U nS tG oa n lf i c oo u t h
,,
,,
,,,,, ,

‘d.G.v.r.m..t Acc..si.mN.. 3. R..ipl.nl’. C.t.l.g N..
,ritl. ad Subtltl.
l’” ‘“f’??:?”
P.,f.=i.$ OcganimtlmC.&
P.rf.nni.gO.o..iz.fi.. R.portN..
P.rfor,niII,O,gaIi,efio.Nom.mdAdd,.,, 10. workUnitN.. (TRAIS)
11. C..w..r Gror,tNeNe.4 S t rS
13, Typ.mlR.p.,\..d P.,iodCew.,od3Pmsm,i.IIAgo..YN-. mdAddr.,.
14. ~o.,.tng As,n.yCad.
IS.P#l.montaryNo***
a.
7. Kw W.rd, lE. Di.tiibuli~S~ti.m-9
wSOcuIilyct..sit. (.fwli’ rwart) so. %.ritycl.gsif. (.~ 21.N.. .IB.s.s 22. Prl..
F II-72) Rwmduetlonof.ompl*t*dpqo..thoriad

1

I. HIGHLIGHTS .........................................................
.......................................................
Purpose of Report ..............................................Organizationof Findings .......................................
..................
Person Characteristics.....................................
1. Age ....................................................Sex ....................................................Primary Activity .......................................
Income .......................................................................................
Location ...............................................
...................Inside/OutsideSMSA’S ..............................Census Region ......................................
.....................
a. Nationwide .................................................................
..............................
..................
c .
................................................................
....................................4 Trip Length Categories . . . . . . . . . . . . . . . . . . . . . . . . . . . . . . . . .5 W o r kP ua D o W . . . . . . . . . . . . . . . . . .6 ..................
m1
3
33
5
5
55
1
111
112
2
222
2
2
233333
v

OF )
w
*aracteristica ............................................. 45
1. Age and Trip Purpose ..................................., 45.................................
................................................
.................................................,
.....................................S
STransportation.......................................... 52
1 . . . . . . . . . . . . . . . . . . . . . . . . . . . . . . . . . . . . . . 5
........................
Used ............................................................ 59
Used ............................................................ 59PersonTransportationUsed ............................................. S.
............................................................. 6
Appendixes .......................................................... ?O
A - ...............
B - ......................
C - WTS Public Use Tape Eaquest ......................., 80

—
1 .- ...........................
- ...........................
- Females (By Age of Tripmaker) .........................
- ....................
- ....................
- ..................
...........................................
....................................
.........................................................
EouseholdVehicle Ownership ..............................................
................................
.....................
( PG r et 5 p O(......................................................
Means of Transportation).................................................
~
6
7
8
9
y
1
1
1
1
1
2
2
2
2
2
2
2
2
2
2
3
and..................................
Structure............................................. ...s.., . . . . . . . . . . . .
S.........................
................
.............
Transportation)..........................................................
.....................................
...........
Purpose(By T@ Purpose)................................................
and TripPurpose(By TripPurpose).......................................
TripPurpose .............................................................
Transportation...........................................................
.....................
M.............
.......................................
...............................
3
I3
3
3
3
3
3
3
4
4

g—
3
3
3
3
3
3
3
3
3
4
4
4
4
4
4
workJNonwork Pqoees by .................................... 4
..........................
............................................................
..............
Sum maq Modes of Tranapotiatimn........................................... 47
.........................
...............
................
.....................
A v e
Purpoee ................................................................... 54
PopulationSiae Groups ..................................................... 55
................................................ 5
................................................
Age
...............................................................
.....................................................

OF ‘TASLES(Cont.)
46.................................................
47. Dbtributimn.................
41 ............................
x

1.
of households average person miles oftravel daily.
Starting with age 50, women make a greater percent of their trips by publictransportation than men.
More than two-thirds of all person trips made by public transportation are made bypersons 5-39 years of age andan additional 8.0 percent made by persons 65 yearsof ageand older.
As household income increases, the percent of person trips made by private vehiclesincreases; the percent of person trips made by public transportation decreases.
On the whole, two-vehicle households make about one and one-half as many total persontrips as one and three-or-more-vehicle households. One-vehicle households make twiceasmany public transportation trips as twa-vehicle households and three times as many asthree-or-more-vehicle households. In addition, one-vehicle households make almost oneandane-half times more walking trips than two- or three-ar-more-vehicle households.
Approximately two-thirds of all person trips are made inside SMSA’S and one-third aremade outside SMSA’S.
Compared to other SMSA population size groups, residents of households in SMSAIS of3,000,000 andover make the smallest percent of person tripsby private vehicle (72.6) andthe greatest percent of trips by public transprtation (7.7) andother modes (19.7), suchaswa!king (16.1).
Residents of households in the Northeast makeat least 50 percent more trips by publictransportation than households in all other regions of the Unitec States.
Residents of households in single-family attached housing structures (e.g., townhouses,rowhouses) make 7.8 percentof all trips by public transportation compared to the averageof 2.6 percent for residents of households in all housing structures.
Ofa[l trips made by public transportation, 34.5 percent are made for work purposes and65.5 percentage made for nonwork purposes.
Residents of households located outside an SMSA make a greater percent of privatevehicle trips and a smaller percent of transit trips (due to limited or nonexistentfacilities) than those households located inside an SMSA. Inside the SMSA, residentsofhouseholds located inside the central city make a smaller percent of vehicle trips and alarger percent of transit trips and walking trips than households located outside thecentral city.
Approximately 23.I percent of all person trips are for earninga living, 31.1 percent forfamily and personal business, 12.I percent for civic, education and religious, 24.4 percentfor social and recreation and9.3 percent for other purposes.
The average trip time forall person trips byall modesas well as by private vehicle is 17.7minutes. Trip times are almost twice as long by public transportation, averaging 34.8minutes.
1

The average trip length for all person trips regardless of mode is 8.9 miles. The overagetrip length by private vehicle and public transportation shows little differmce (9.2 and 9.3miles, respectively).
On Mondays through Fridays, person trips ta work constitute almost ane-fif?h(17.4 percent) of all trips. Of all work trips made by private vehfcle, 90 percent are modeon weekdays. Of all work trips made by public transportation, 94.2 percent are madeanMondays through Fridays.
Work trips are very concentrated and accur largely during certain specified hours, whilenarrwark trips, except for the hours from 12s00 midnight to 5:59 a.m. occur pretty mhall day.
Approximately 64.6 percent of a\{ person trips are 5 miles ond less and these tripsconstitute 13.9 percent of all miles traveled. On the other hand, trips af aer 100 milesconstitute Iess than I percent of all person trips, but 22.3 percent of atl person milestrweled.
Within each income category, the ~rcent of trips made in a private vehicle fordlscretianary purposes increases as income increases. The percent of trips for workpurposes shows no ~rticuiar pottern, peaking in the $15,~24,999 income group (1 9.6percent).
The owerage person trip length for work by private vehicle generally increases as incomeincreases fram 7.4 miles for households under $S,000 to iO.1 rnlles for households withincomes from $35,000 to $49,999. The overage trip length then decreases to 8.8miies forhouseholds with incomes of $50,000 and over. Work trip lengths by public trcrnspartatienshaw the same trends.
As vehicle ownership increases, the percent af work trips made by all modes. combinedincreases and the percent of trips ma& for nmwark purposes decreases. Trips by pr~vatevehicles far work as well as nonwork purpases increase os vehicle ownership increases;with the greatest percent increase in trips taking place between one- and two-vehiclehouseholds. Trips by public transportation decrease as vehicle ownership increases.
Within each income category, the percent of trips made by public transportation for workpur~ses is highest for hausehoids with incomes of less than $5,000 (1.8 percent of tataltrips) and lowest for havseholds with incomes of $50,000 and over (0.5 percent of totaltrips), although same variation occurs in the intermediate income graups. Far n~workpurposes, there is a steady decline in the percent of trips made by public transportation,from 3.8 percent to 0.6 percent respectively of total trips os income increases.
2

Il. INTRODUCTION
A. Purpose of Report
This report presents findings from the 1977 Nationwide Personcd Transportation Study(NPTS), pertaining to characteristics of pers~ trips. Aperson tripis defined osaunit ofone-way person travel. When two or more persons travel togetherin the same vehicle,each person is counted as making one person trip.
Inthisr eport,person trips are related to person characteristics, household characteristicsand trip characteristics by means af transportation. Person characteristics include age,sex, and primary activity of the tripmaker. Househald characteristics include income,vehicle awnership, housing type and geographic location-outside/inside SMSA’S bypopulation size groups and inside/outside central city. Trip characteristics include trippurpose as related to hour of day the trip started, trip length and day of the week. Inaddition, the relationships of person/household characteristics and trip characteristics arediscussed.
B. Organization of Findings
The analysisof characteristicsof person trips is divided into four major areas. The firstexamines the use of different modes by person characteristics of the tripmaker, such asage, sex and primary activity, i.e., working, going to school, housekeeping, etc. Thesecand examines the use of different means of transportation by characteristics of thetripmaker’s household, such as income, vehicle ownership, residential location, selectedhousing types and availability of public transportation. The third examines thecharacteristics of trips and travel by meansaf transportation and includes trip time, triplength, day of the week and time of day. The fourth examines the relationship ofperson/hwsehold characteristics and trip characteristics intermsof ageof TrapMaker andtrip purpase, household income and average trip length, household vehicle ownership andtrip purpose, and residential location os related to trip length and trip time. Finally, inaddition, a comparison of changes in person trips and person miles of travel that haveoccurred fram 1969 to 1977 is also included. The report concludes with asummary afthemast important findings.
3

111. SUMMARY OF FINDINGS: PERSON TRIP CHARACTERISTICS
A. Person Characteristics
More than 211.8 billion person trips were made in the United States from April 1977 toMarch 30, 1978. This translates to 992 person trips per person annually or 2.7 person tripsper day. As shown in Table [, more than four-fifths (83.7 percent)of all person trips weremade in a private vehicle, 2.6 percent were made by some form of public transportationand 13.7 percent were made by some other means ofbicycling, airplane, etc.
1. Age
transportation, such as walking,
indicates that triDs in a DrivateThe distribution of person trips by age of triprnakervehicle hovered between 80-90 percent for all ages, except for school children, ages5-15 years, and teenagers, 16-19 years ofage. (Table 1)
The percent distribution of person tripsby public transportation for persons shawed abouta I percent variation, 2.0 percent for persons 049 years of age to 3.3 percent farpersons 65 years and older. In effect, the percent of trips by public trans~rtatiandecreases until ages 40-49 years, and then increases. The increased use of publictransportation facilities by the older persons reflects retirements, those who can nalonger drive, and/or those who finda private vehicletao expensive to own/operate.
Schoolchildren from &15 years of age make one-third of all their person trips by walking(15.9 percent) and school bus (15.6 percent~ walking is also an important mode for16- 19 years olds(15.0 percent) as well as persons 65 years andolder (14.2 percent).
2. Sex
The modal distribution bysexof the tripmaker (Tables 2and 3) indicates that both menand women prefer private vehicles for tripmaking. Overall the percent distribution ofperson trips made in private vehicles bymen and women shows little difference; althoughmen make a slightly greater percent of trips by private vehicle beginning with age 40.Men also makea larger percent of person trips by pickup trucks than do women. Womenmake aslightly greater percent of their person trips by public trans~rtation, (2.8 percentfor women and 2.3 percent for men) specifically, streetcar and bus, especially beginningwith age 50. In addition, women age 60 and older make more walking trips than men inthe same age groups.
Tables 4, 5,and 6indicate that persons between the ages of 20-49 years make more thanhalf (53.4 percent)of all private vehicle person trips. More than two-thirds (66.9 percent)of all person trips made by public transportation are made by persons from 5-39 years afage,af which children from ages 5-15 years make 19.6 percent. An additional 8.0 percentof all person trips made by public transportation are made by persons 65 years of age andolder. Approximately 68.5 percent of all person trips made by other means, especiallybicycling, walking and school busare madeby persons 5-29 years. The modal split byageof tripmaker does nat change appreciably for men and women, however, women ages 60and older make a greater percent of trips by public transportation (14.2) than do men(%2).
5

C u - —m 0 mG&G&&d 0’ -“
0—
6

-* t iN“ O“N”
-.* * -.0 0
* mm 0 am“m”m” mow” 0“ e“
~
7

8

~ o oG O
0 0 0— — -
C O - oN“lri m”&—- —
m rm- “ 6 0 ” -
0 0 0
8 —
* o *. . . . . .F m——
9

m m —. . . .- m -— - —
m — mG<dm”———.
O e o. .riw”w —--
0 . 0 . 0 .
8 % %- - -
o e---. . . . . .h ——-m.—
Nu. w r-m. . . . . .l . m N- -
1

a U4 0r
1

~“”” “-”-””-~
3. Primary Activity
Respondents were asked to indicate what they were doing, i.e., primary activity, for theweek prior to enumeration. Trips by different modes used were tabulated according tothe primary activity of the respondent. As shown in Table 7, more than half of all persontrips were ”made by”persons who reported their primary activity as warking. In addition,warkers age 16 years and older made the largest percent of their trips by private vehicle.However, regardless of the primary activity, the private vehicle continues to be the majarmeansof transportation. Students andpersans looking far work make the largest percentof trips by public transportation, 4.5and 4.0 percent respectively. Students and retiredpersons make 18.7and 11.7 percent of their trips respectively by walking.
Workers are the greatest users of all meansof transportati~ (Table 8). They make morethan half (53.6 percent) af all person trips made by private vehicle and public transpor-tation (50.6 percent) and almost 30 percent (28.6) of all person trips made by other modes,such as walking, airplane, etc. Students make almost 13 percent (12.9)of all trips madeby public transportation, and approximately 15 percent or more of all trips made bywalking, bicycling andschaol bus.
B, Household Characteristics
1. Income
As household income increases, the percent of person trips made by private vehicleincreases from 69.9 percent of total trips for households with incomes under $5,000 to90.7 percent for households with incomesof $SO,OOOand over. The percent aftrips,nadeby public transportation shows the reverse trend (Table 9). Households with incomes ofless than $5,000 make ahmost 5 percent (4.6)af their person trips by public transportation,camparedta 1.1 percent far hauseho!ds with incamesof $50,000 and over.
The percent of persan trips made by ather means, especially walking, also decreases ashousehold incame increases. For example, walking trips for the lowest incornehwseholdsconstitute more than one-fifth (2[.0 percent) of all trips compared to 4.7 percent for thehighest income households
2. Vehicle Ownership
Table 10 indicates that two-vehicle households make about ane and one-half as manyperson trips (42.5 percent) as one (26.8 percent) and three-or-more-vehic!e hausehalds(24.7 percent). Households without avehicle make only6.O Percent of total person trips.
The percent of person trips made in private vehicles by twa-vehicle households (88.5) is6.4 percentage points higher than for one-vehicle households, due largely tothe5 percentincrease in person trips by pickup truck. The distributiarr af person trips by privatevehicle Ievels off for hwseholds with three or more vehicles (89.6 percent).
The opposite trend is observed in person trips by public transportation and other meansoftransportation. One-vehicle households make twice as many ~rsan trips by publictransportation than twa-vehicle households, three timesas many as three-or-more vehiclehouseholds. In addition, one-vehicle hausetrolds make abwt twice as many trips bywalking than twa- and three-or-more-vehicle households. Households without a vehiclemake almost half of all their trips (44.8 percent)by walking.
12

TABLE 7. DISTRIBUTION OF PERSON TRIPS BY MEANSOF TRANSPORTATION AND PRIMARY ACTIVITY
(By
Persons Primary Activity of Persons 16 Years of Age and OlderMeans of tider Looking KeepingTransportation 16 Working f Work House Student Retired Other?/
Private VehiclesAuto, Vanbus, Minibus 82.4 77.6 70.3 83.4 64.1 76.1 59.1Pickup 7.4 1 a 7 5 3 7 5Other Private Vehicle 0.9 1.7 0.9 0.7 0.6 0.9 0.8Subtotal-Private 90.7 89.6 79.9 89.4 67.9 84.8 65,4
Pubiic TransportationEua, Streetcar 0.9 1.7 3.7 1.3 4.0 2.4 2.7
0.4 0.1 0.1 0.2 * 0.1
F Subway, Elevatedw Rail 0 0 0 0 0 0 0
Subtotal-Pubiic 1.2 2.6 4.0 1.5 4.5 2.5 3.0
Other Mean8Walk 5.8 6.3 15.2 8.3 18.7 11.7Bike
15.90 0 0 0 1 0 1
S c h~S 0.1 0.0 * 6 0.0 13.2Airpiane ;:: 0.1 0.0 0.1 0.1 0 0O t0.5 0,9 0.3 0.5 0.5 0.7 0.6Subtotal-Other 8.1 7.8 16.1 9.1 27.6 12.7 31.6
Total 100.0 100.0 100.0 100.0 100.0 100.0 100.0
Di8tributionofPerson Trips 6.6 50.1 1.3 14.6 7.3 3.6 16.5
Peraons
74.58.01.2
83.7
2.10.2
0.32.6
9.30200
1
1
1
~/211,768,900,000 person trips.~ / l n c l u d e s p e r $ o n s u n a b l etoworkas wellas thase who indicated their primary activity as ”other~’

TABLE 8. DISTRIBUTION OF PERSON TRIPS BY MEANSOF TRANSPORTATION AND PRIMARY ACTIVITY
(By Means of Transportation)
PersonsKeeping All
Transportation 16 Working for Work House Student Retired Dther~/ Persons
Private VehiclesAuto, Vanbus, MinibusPickupOther Private VehicleSubtotal-Private
Pubtic Transportationf3us,Streetcar
G TrainSubway, Elevated
Rail%btotal-public
Other MeansWalkBikeSchool BusAirplaneOtherSubtotal-Other
OistributionofPoraon Trips
7.3 52.26.1 64.94.7 69.97.2 53.6
3.2 43.71.8 80.3
4.8 71.13.3 50.6
4.1 33.52.1 27.53.4 2.44.9 64.84.5 63.63.9 28.6
6.6 5 0
1.2 16.3 6.3 3.6 13.11.4 9.7 3 3 11 7 3 2 11 1 5 3 1
2.4 9.3 4.2 14.7 22.50 6 5 0 5
0 5 1 7 92 8 1 3 1
2.1 12.9 14.7 4.5 28.21.2 4.4 18.4 1.2 45.20.0 0.1 17.7 0.0 76.40.0 8.8 4.8 2.7 14.00.5 10.3 3.1 14..41.5 9.7 1::: 3.3 38.2
1.3 14.6 7.3 3.6 16.5
1111
11
11
111111
l
~/211,768,900,000 person trips.~/In~ludesper~on~ unable tO workas well as those who indicated their primary activitY aswo~er.”

15
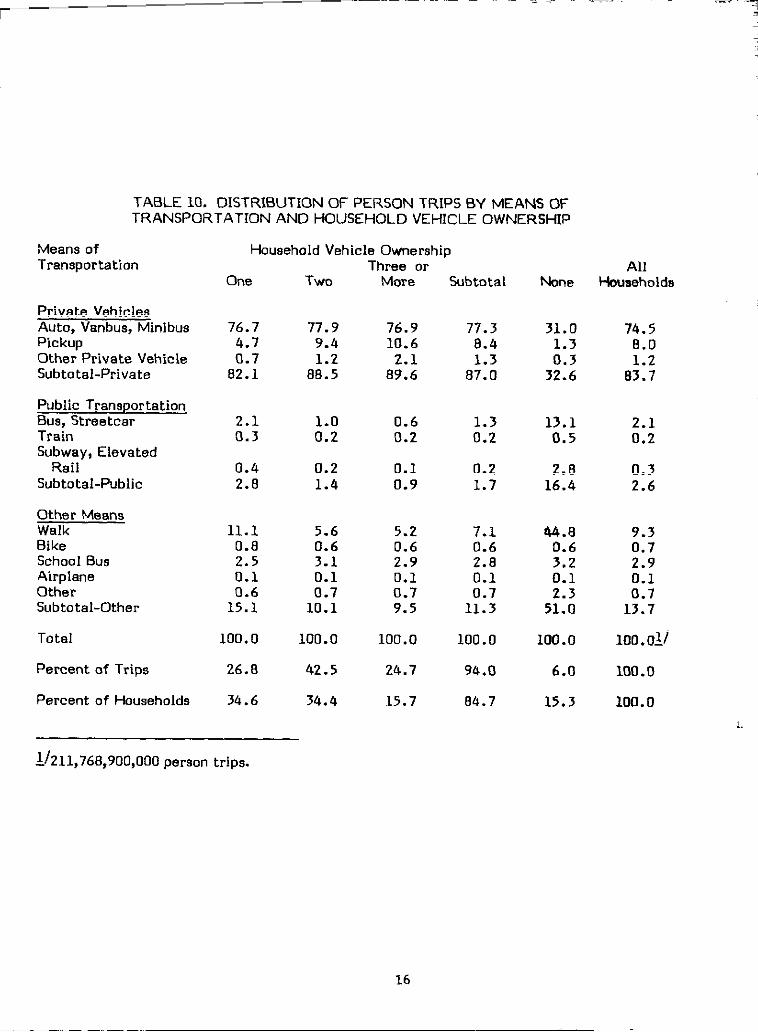
TABLE 10. DISTRIBUTION OF PERSON TRIPS BY MEANS OFTRANSPORTATION AND HOUSEHOLD VEHICLE OWNERSHIP
Means ofTransportation
Auto, Vanbus, MinibusPickupOther Private VehicleSubtotal-Private
Public TransportationB uS t rT rS u bE l e
R aS u b t o t
O tM eW aB iSchool BusAirplaneOtherSubtotal-Other
Total
P e ro T r
Percent of Households
H o uV eO w
One
76.74.70.7
82.1
2.10
02
10200
1
1 0
2
3
Two
77.99.41.2
88.5
10
01
50300
1
1
4
3
T oM
712
8
00
00
502009
1
2
1
S u
701
8
;
01
70200
1
1
9
8
N
310
3
10
21
40302
5
1
6
1
AllHouseholds
781
8
20
02
9.30200
1
1
1
100.0
~ / z l l ,p etriPS.
16

3. Location
a. SMSAtsby Population Size Graups
Approximately twa-thirds (67.4 percent) of all person trips are made by residents ofhouseholds inside SMSAls and 32.6 percentage made by residents of households outside theSMSA’S (Table It). Person trips in private vehicles follow the split of all trips made inSMSA population size groups, and more than one-third (34.4 percent) are made in SMS,4:sof 1,000,000 and over. Person trips by public transportation are greatest in SMSAIS of1,000,000 and over, accounting for 69.6 percent of all trips made by these modes, withtrips in SMSA’S of 3,000,000 and over alone totaling 44.8 percent. Public transportationfacilities are almost nonexistent outside SMSA[s and total iess than IOpercent of all trips.f?esidentsin SMSA!s of 1,~,000 andover make atmost half (49.5 percent)0f all walkingtrips and about one-third of all bike andschaal bus trips.
Excluding residents of households in SMSA)S of 3,000,000 and greater, all other residentsof households in an SMSA make more than four-fifths of their person trips in a privatevehicle, fram 1.5 to 3.0 percent of their trips by public transportation and fram 11.1 to14.3 percent by other transportation modes (Table 12). Residents ofhouseho[dsin SMSA’Sof 3,000,0~ andover ,make the smallest percentof person trips by private vehicle (72.6)and the greatest percentof trips by public trans~rtafion (7.7) and other m (19.7) suchaswalking (16.1 percent).
Residents of households outside an SMSA make the targest percent of person trips byprivate vehicle (87.0), due largely tothe useOf pickups. These households also make thesrrallest percent of trips by public transportation (0.8) due to the lack of facilities. Tripsby all other modes total 12.2 percent, of which walking trips account for7.1 ~rcent.
b. inside/OutsideSMSA’S
Inside an SMSA, residents of households located inside the central city make a smallerpercent of vehicle trips and a larger percent af pub[ic transportation trips and walkingtrips than residentsof households lacated outside fhecentrat city (Tabte 13).
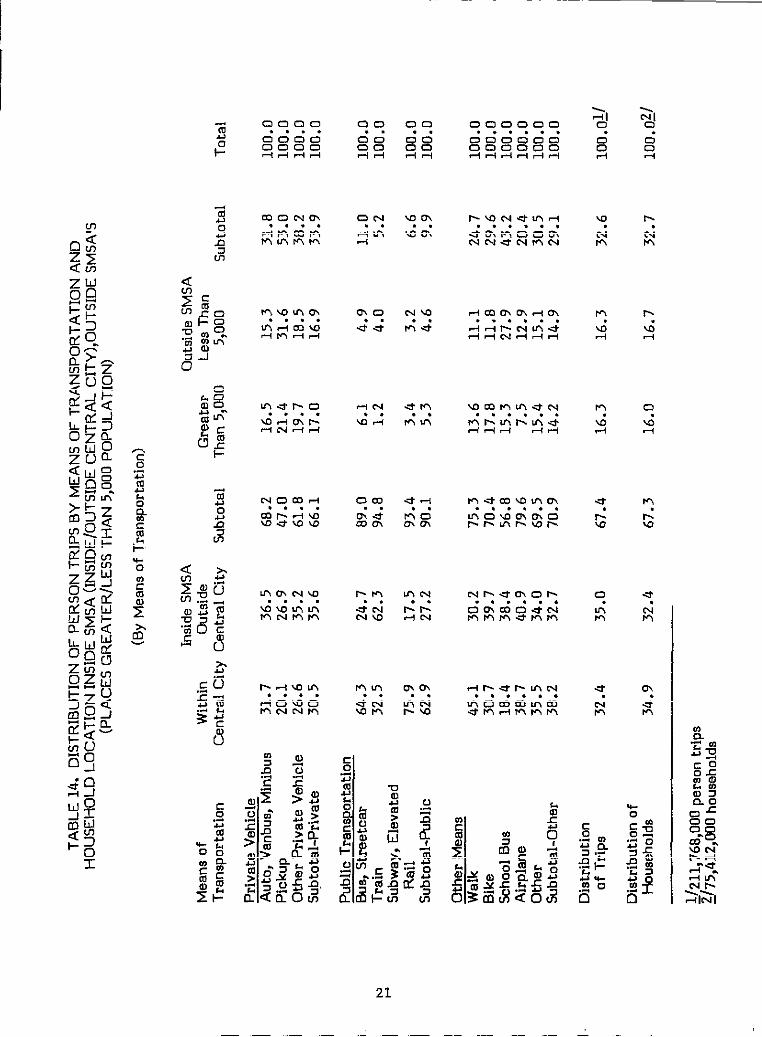
Of all person trips made by private vehicles, the greatest percent (35.6) are made bypersons residing inside an SMSA, but outside the central city (Table 14). The Percent oftrips made by private vehicles by residents outside an SMSA show minor differences inplaces lesser/greater than 5,000 population, except for trips by pickup, which are 10percent higher in places of less than 5,0(10.
Approximately 90.1 percent of all trips made by public transportation are made byresidents of households inside an SMSA, with approximately two-thirds (62.9 percent)being,made by persons Iivinginside the central city. Less than 10 percent (9.9) of all tripsby public transportation are made by residents of households located outside SMSA’S.More than 70 percent (70.9)of trips made by other means of transportation arelmadebyhouseholds insidean SMSA, with residents Of households inside fhecenfral city making thegreatesf percent (45.l)of all walking trips. Outside SMSA!s, the percent of trips madebyresidentsof personsby other means of transportation is almost equally divided betweenplaces less/greater than 5,000, except for trips byschoal bus, where 27.9 percent of totaltrips made by this mode are made by residents in places less than 5,000, compared to15.3 percent in places of greater than 5,000.
17

.-.
1

TABLE 12. DISTRIBUTION OF PERSON TRIPS BY MEANS OF TRANSPORTATION AND HOUSEHOLDLOCATION OUTSIDE SMSA’S AND INSIDE SMSA’S BY POPULATION SIZE GROUPS
(BY Population Size-Groups)
SMSA Population Size GroupsMeans of Outside Under 250,000- 500,000- 1,000,OO@ 3,000,000Transportation SMSA’S
Ail All250,0~ 499,999 999,999 2,999,999 and Over SMSA’S Households
Private VehiclesAuto, Vanbus, MinibusPickupOther Private VehicleSubtotal-Private
Public TransportationBus, StreefcarTrainSubway, Elevated
RailSubtotal-Public
Other MeansWalkBikeSchml BusAirplaneOtherSubtotal-Other
Total
Distributionof Trips
72.612.9
I .587.0
0.80.0
0.00.8
7. I0.63.80.00.7
12.2
I00.0
32.6
76.38.4
8!: ~
1.5*
0.11.6
8.20.82.80. I
l::;
100.0
8.7
78.67.3
8;: ;
1.4*
0.1I .5
7.00.82.5
0.:11.1
100.0
10.8
78.56.2i .5
86.2
I .5*
0.4I .9
::;2.0
;:+I 1.9
100.0
11.4
76.45.2
8:: ~
:::
0.33.0
10.30.7
::7
I :::
I 00.0
21.7
69.02.70.9
72.6
4.8I .2
;:;
16. I0.62.00. I
l!:;
I00.0
14.8
75.55.61.1
82.2
2.60.3
0.53.4
I0.40.72.40. I
1::!
I 00.0
67.4
74.58.0I .2
83.7
::;
0.42.6
:::2.90. I0.7
13.7
I00. OLI
I00.0
~/2 1.1,768,900,000 person trips.*Less than O.I percent

TABLE 13. DISTRIBUTION OF PERSON TRIPS BY MEANS OF TRANSPORTATIONA H O U SL O CI NSMSA’S (lNSIDE/OUTSIDE C EC
O U TS M( p LG R E AT 5 P O P
(By Household L o c
AllHouse-H
781
8
20
02
90200
1
1
1
I nSMSAMeans of Within OutsideTransportation Central City Central City Subtotal
G rT 5
O uSMSALess T
5 S
P r iVehicleAuto, Vanbus, Minibus 7
1
.
71
18
7 611
8
7 251
7 8
76
8
751
8
PickupOther Private VehicleSubtotal-private
P u bT r a n s pB uS t r e2
00
*0.8
●
0*
3.90
10Train
Subway, Elevated05
02
03
*
0 o.;
*0.8
Rail”Subtotal-Public
O tMeansWalkBikeSchool BusAirplaneotherSubtotal-Other
10200
1
6.40400
1
7.802
01
7.10.63.800
1
1 30.6
80300
1
1.600
16.1
100.0 100.0 100.0 1 1Total 100.0
Distributionof Tripa 33 2> 67.4 16.3 1
~/211,768,900,000 t r i p s .●timthanO.l~rcant
2

I
c. Census Region
More than half of all person trips are made by residents of the South (30.3 percent) andNorth Central (27.3) Regions. The South has the greatest percent of trips made in aprivate vehicle (86.5) while the Northeast has the lowest (75.9). The percent of tripsmade in the Northeast by public transportation (4.9) and wolking (14.5) exceed those madein any other region (Table 15).
4. Location of Selected Housing Types
o. Nationwide
Almost three-fourths (72.8 percent) ofali persantrips aremade by residents of householdsin detached single family units; an additional 6.7 percent are made by residents ofhouseholds in attached single family units and trailers, and 16.5 percent ore made byresidents ofhousehoids irr multi-family units (Table 16).
The modal distribution of person trips is similar far households in trailers and detachedsingle-family units. Households in these housing structures make from 86.9 to 90.6percent of their person trips in a private vehicle; trips by public transportation are lessthan 2 percent, and trips by other means constitute from 8.S to 11.6 percent. Wuseholdsin attached single-family units follow the same modal preference as households in multi-family dwelling units. Households in these structures make a smaller percent of theirperson trips in a private vehicle (from 71.7 to 74.5) and a greater percent of trips bypublic transportation and other means, with wolking trips comprising from 15.9 to 18.8percent of their total person trips. Hwseholds in single-family attached housingstructures make 7.8 percent of all trips by public transportation compared to the overageof 2.6 percent for all housing types.
b. SMSA Population Size Groups
Regardless of housing type and househald location inside/outside an SMSA, residents ofhouseholds in S,WSAISof 3,000,000 and aver make the smallest percent of trips in aprivatevehicle, and the largest percent of trips by public transpartatian and walking than allother households. In addition, as the number of family units increases fram single tomulti-family dwellings, the percent of person trips made by residents in SMSA’S of3,000,000 and aver in a private vehicle decreases, while the percent of trips madebypublic transportation ond walking increases (Table 17).
c. inside/OutsideSMSA’S
Table 18 indicates that there is very little difference in the modal split far S.MSAresidents of households in detached single family dwellings by household location, i.e.inside/outside central city. However, there is a modal difference when it comes toresidents of households in multi-family dwelling units and household Iocatim. Theseresidents of households situated autside the central city make a greater percent of theirtrips by private vehicle than those residents living within a centrol city, and the percentof trips made by private vehicle increases as the size of the lnulti-family dwellingincreases. The reverse situation is true for SMSA households in multi-family dwellingswithin a central city. In addition, residents of these hwseholds make a greater percent of
22
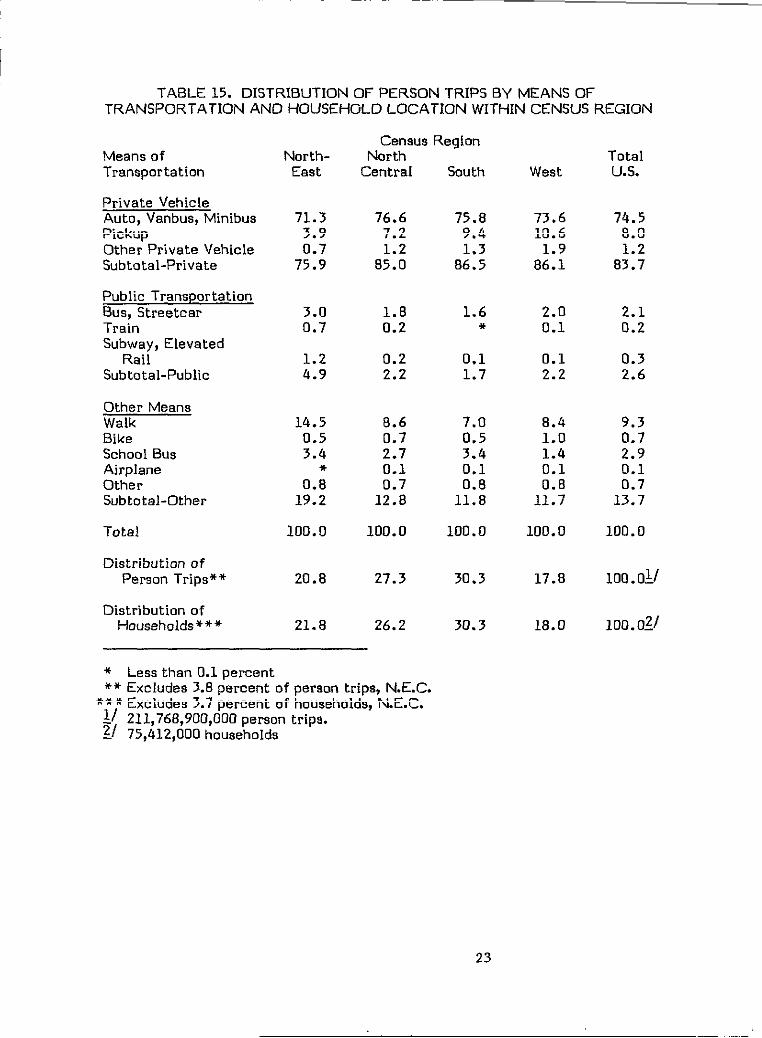
TABLE 15. DISTRIBUTION OF PERSON TRIPS BY MEANS OFTRANSPORTATION AND HOUSEHOLD LOCATION WITHIN CENSUS REGION
Census RegionMeans of NorthTransportation CentraI
Private VehicleAuto, Vanbus, MinibusPickupOther Private VehicleSubtotal-Private
Public TransportationBus,
Other MeansWalkBikeSchool BUSAirplaneOtherSubtotal-Other
Total
DistributionofPerson Trips**
DistributionofHouseholds***
North-East
73
7
3.00
14
103
01
1
2
2
76.67.21.2
8
10
02
80200
1
1
2
2
South
75.89,41.3
86.5
1.6*
0.11.7
7.00.53.40.10.8
11.0
100.0
30.3
30.3
West
73.610.6
1.986.1
2.00.1
0.12.2
8.41.01.40.10.8
11.7
100.0
17.8
18.0
TotalUs.
74.58.01.2
83.7
2.10.2
0.32.6
9.30.72.90.10.7
13.7
100.0
100.01/
100.O?J
* Less than O.l percent** Excludes 3.8 percent of persmn trips, N.E.C.
***Excludes 3.7 percent of households, N.E.C.~/ Z11,76E,900,000 peraon trips.~/ 75,412,000 hOusehold~
23

TABLE 16. DISTRIBUTION OF PERSON TRIPS BY MEANS WTRANSPORTATION AND HOUSING STRUCTURE
Means ofTransportation
Oetached
Private VehicleAuto, Vanbus, MtnibuaPickupOther Private VehicleSubtotal-Private
Public Transportationma, StreetcarTrainSubway, Elevated
RailSubtotal-Public
Other MeansWalkBikeSchool BusAirplaneOtherSubtotal-Other
Total
Percent of Trips
Percent of I-buseholds
76.59.11.3
86.9
1.20.2
0.11.5
6.90.73.20.10.7
11.6
100.0
72.8
64.4
Housina Structure AIlSingle Family - Multi-Familv I-kn18inoAttached Trailer 2-4tiits Dver4’Lhlits hits=
66.64.1
7;:;
6.20.9
0.77.8
15.913.1
0:520.5
1
3.3
3.9
75.912.32.4
90.6
4.10.43.0
*1.08.5
100.0
3.4
4.1
69.3 67.34.0 2.8
0.97::: 71.0
‘4.4 5.00.5 0.4
0.8 1.95.7 7.3
17.3 18.80.3 0.61.4 0.90.1 0.20.7 1.2
19.8 21.7
100.0 100.0
7.8 8.7
10.2 12.5
74.58.0
8;:;
2.00.2
0.42.6
9.30.72.90.10.7
13.7
100.OZI
loo.df
100.02/
●LESSthan 0.1 percent
~/zll,76E,900,000 person trips,Z/Excludes 0.9 percent specified as “other” and 3.1 percent as NA.Z/Excludes an additional 4.9 percent specified as “other” or “not reported.”
24

.
8i
25

- ‘- 7
26

trips by public transportation and walking, as the size of the multi-family unit increases.Walking trips constitute almost one-fifth (19.9 percent) of all trips made by households in2-4 multi-family dwelting units and over one-fourth (25.3 percent) af all trips forhouseholds inmu}ti-family dwe}llngs comprised of over four units.
Residents of detached single-family unit households Iacated outside of SMSA’S show noappreciable differences in m~al split; hOwe~er, this is not true for residents ofhouseholds in multi-family units. Residenfs of households in 2-4 unit mulfi-fami[ydwellings located inpl~cesaf over 5,000 population make a greater percent of their tripsby private vehic!es and asma!lerpercenf inplacesaf lessthan 5,000. For multi-family dwellings of more than 4 units, residents of householdslocated in places of aver 5,000 make a slighfly lesser percent of their trips by privatevehicie buta larger percenf of walking frips fhan residents of hausehokts in placesof lessthan 5,000.
5. Availability of Pub)ic Transportation
Table 19 indicates that 59.Opercenfof all persan trips were made by households whichhave some form of public transportation available within 2 miles of fheir homes. Thesehouseholds also made 56.7 percenf of all person frips made in a privafe vehicle, 90.2percent of all trips made by public transportation, and75.9percenf of all walk trips.
Tabie 20 indicates that households which indicafed that public transportation was nofavailable ta them made 88.6percentaf fheirfrips in a private vehicle, Iess than I percent(0.6) af fheir trips by pubhc transportation and 10.8 percent by ofher means such aswalking (5.4 percent).
C. Trips and Travel Characteristics by Means of Transpartafion
1. Trip Purpose
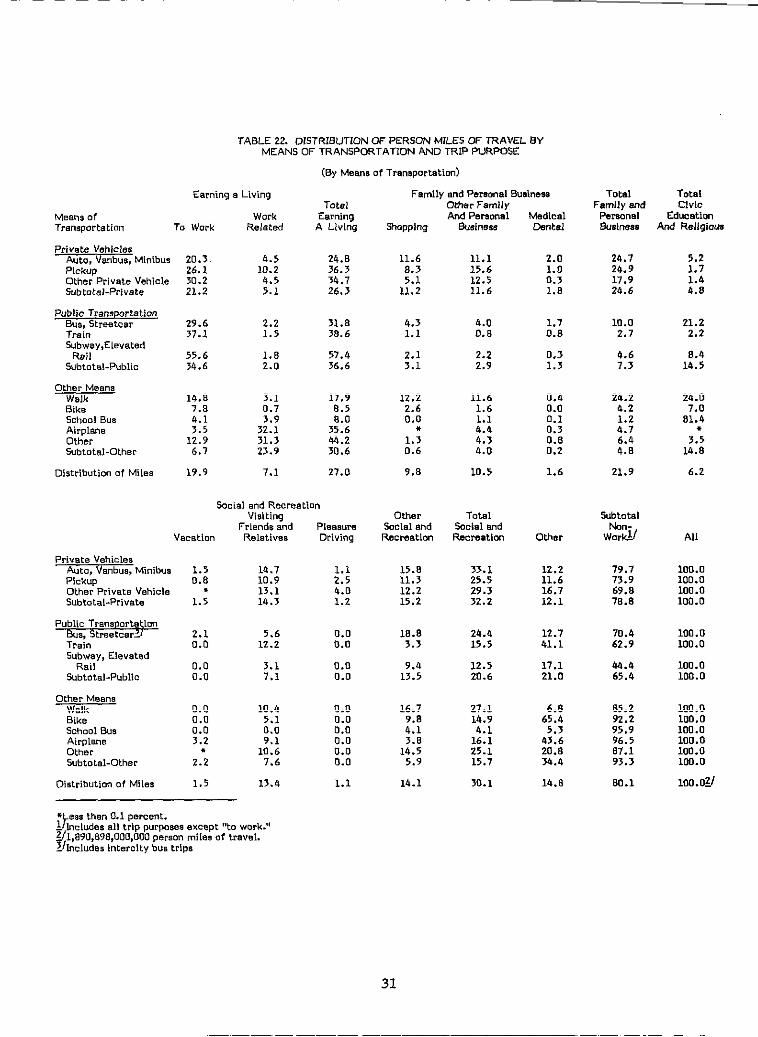
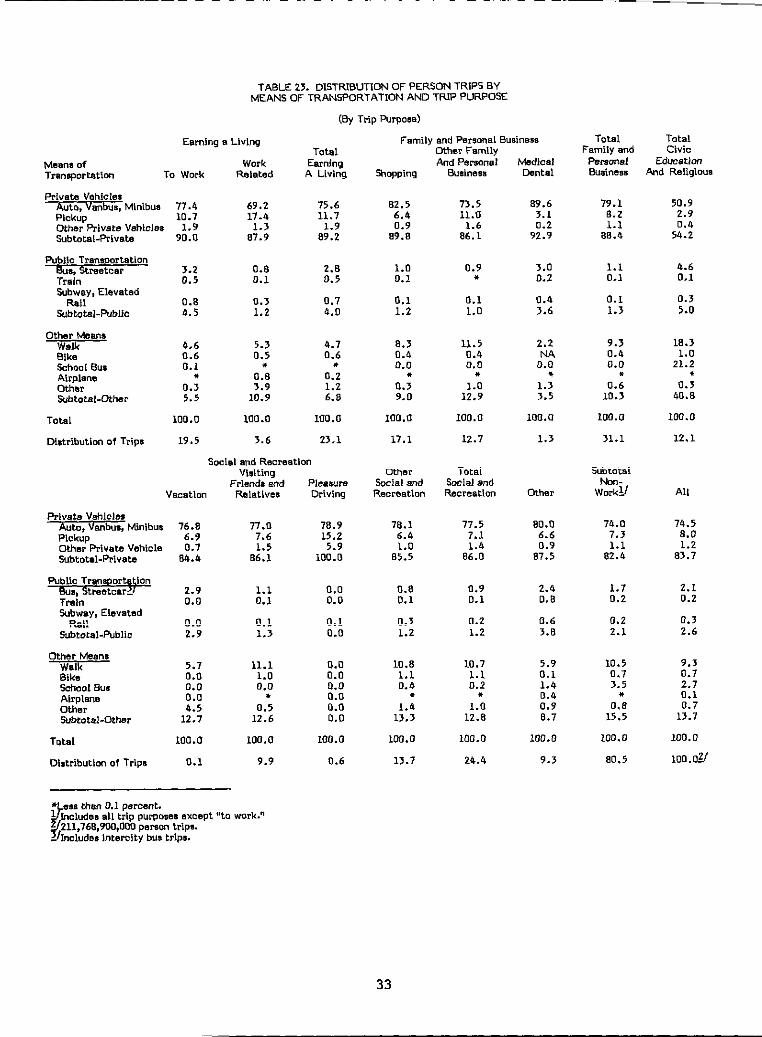
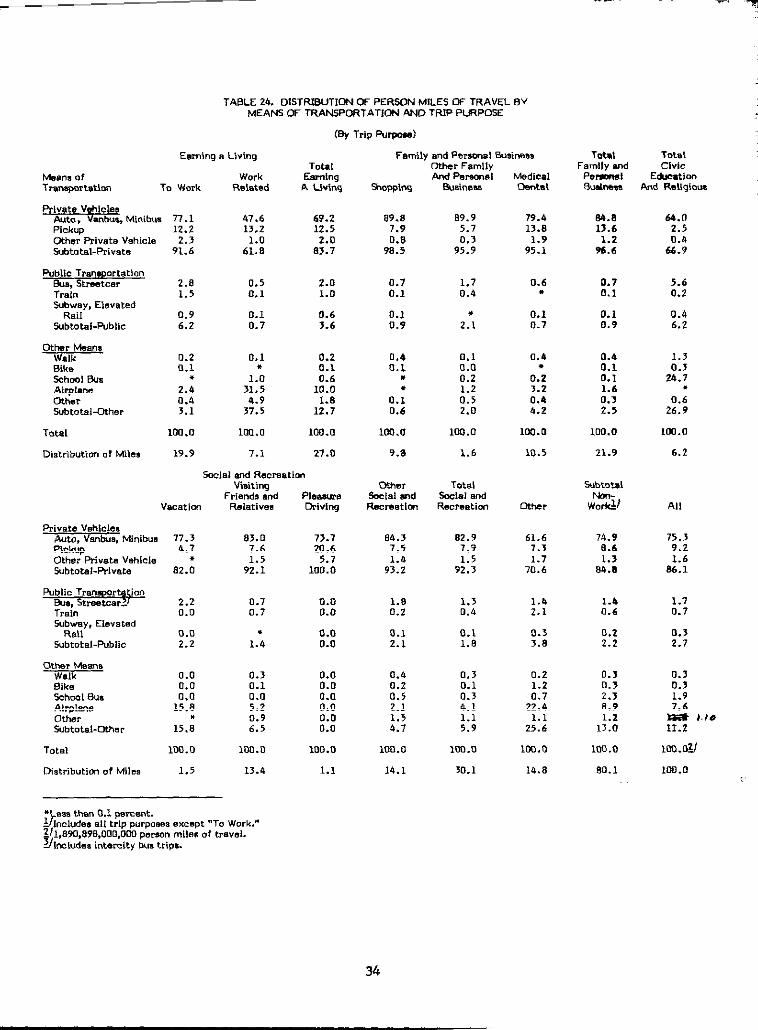
As shown in Table 21, the greafest percenf of trips is for family and ~rsonal business(31.1), followedby social and recreation (24.4) and earning aliving (23.1). Trips far civic,education and religiaus purpases (12.I percent) and ofher ~rpases (9.3) camprise theremainder. Table 22 indicates that the Iargesf percenf af miles traveled are for socialand recreation purposes (30.1), followed by earning a !iving (27.0 percent), family andpersonal business (21.9 percent), other (14.8 percenf), and civic, educafian and religiousfrip purposes (6.2 percent). If we subtract fhetrips andtrovel for work relafed purposesfrom eorning aliving, 19.5 percent of all frips and 19.9 percent of all miles are forwarkpurposes and the remaining 00.5 percent af trips and 80.1 percent of miles are fornonwork purposes.
The modal distribution indicates that person trips and travel madeby private vehiclesclosely followsfhe trip purpose distribution. Specifically, approximately one-fiffh of allperson frips and persan miles traveled in a private vehicle are for work purposes and fwr-fiffhsfor nanwork purposes. fiowever, fhisisnof true farpersonfrips and travel madebypublic framparfation for different trip purposes. Of all trips and travel made by pub[ictransporfafian, approximately one-fhird ore for work purposes, and appreximafely twcr-fhirdsare for nonwork
27
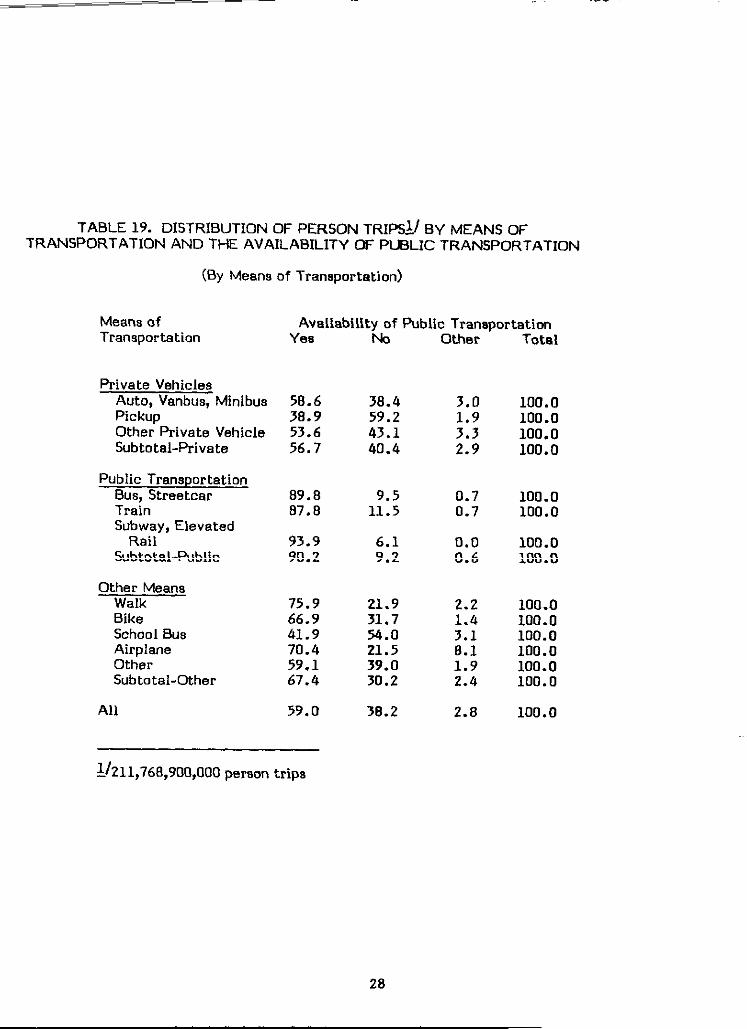
TABLE 19. DISTRIBUTION OF PERSON TRIPS~ BY MEANS OFTRANSPORTATION AND THE AVAILABILITY OF PUBLIC TRANSPORTATION
(By Means of Transportation)
Means of Availability of Public TransportationTransportation Yes No Other Total
Auto, Vanbus, Minibus 58.6Pickup 38.9Other Private Vehicle 53.6Subtotal-Private 56.7
Public TransportationBus, Streetcar 89.8Train 87.8Subway, Elevated
Rail 93.9Subtotal-Public 90.2
MeansWalk 75.9Bike 66:9School Bus 41.9Airplane 70.4Other 59.1Subtotal-Other 67.4
All 59.0
38.459.243.140.4
9.511.5
69
21.931.7S4.o21.539.030.2
30.2
3.0
;:;2.9
0.70.7
0.00.6
2.21.43.18.11.92.4
2.8
1111
11
11
111111
1
l/zll,7613,900,000 person trips
28
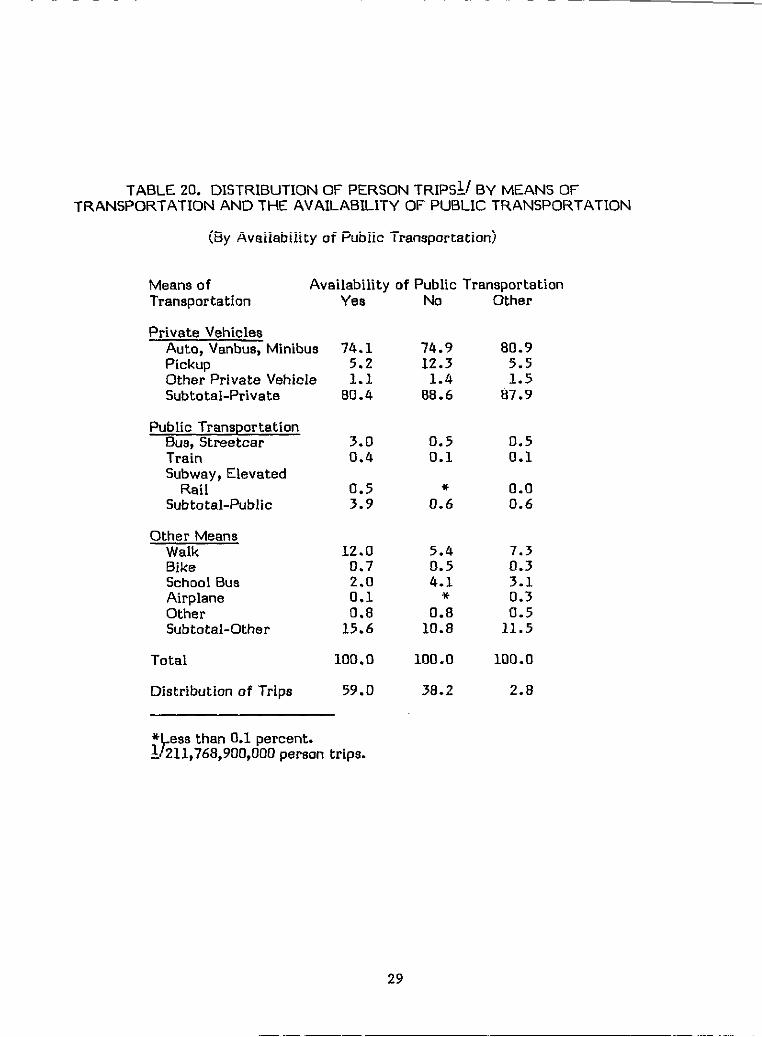
TABLE 20. DISTRIBUTION OF PERSON TRIPS~/ BY MEANS OFTRANSPORTATION AND THE AVAILABILITY OF PUBLIC TRANSPORTATION
(By Availability of Public Transportation)
Means of Availability of Public TransportationTransportation
Private VehiclesAuto, Vanbus, MinibusPickupOther Private VehicIeSubtotal-Private
Public TransportationBus, StreetcarTrainSubway, Elevated
RailSubtotal-Public
Other MeansWalkBikeSchool BusAirplaneOtherSubtotal-Other
TotaI
Distribution ofTrips
Yes -
74.15.21.1
80.4
3.00.4
0.53.9
12.00.72.00.10.8
15.6
100.0
59.0
N O
74.9 80.912.3 5.5
1.488.6 8~:~
0.5 0.50.1 0.1
* 0.00.6 0.6
5.4 7.30.5 0.34.1 3.1
* 0.30.5
1::: 11.5
100.0 100.0
38.2 2.8
* essthan O.1 percent.k~ 211,768,900,000 person trips.
29

TA8LE21. I3ISTR1BUTIONOF BN
a
k
●
A
O
S t l - B * t . . P : l
18.es
B
*
Io
loe.o
o
1eQ.0
1OB.OLI
30
O B
a
M e a n s
a
A
*
●
*
1 11 51 2s1 1
m M
●
A

As shown in Tables 23 and 24, approximately 90 percent of all person trip6 and 91.6percent of 011person miles to work are made by private vehicles compared to 82.4 percentof all trips and 84.8 percent of person miles for nonwork purposes. The greetest percentof person trips and person miles traveled for nmwork purposes by private vehicles is forfamily and personal business, 88.4 percent and 96.6 percent respectively. The smallestpercent of person trips and miles traveled by private vehicles is far civic, education andreligious trip purposes, 54.2 percent and 66.9 percent respectively, because of thepredominance of trips by the schoal bus. The percent of trips mode to work by publictransportation is over twice (4.5 percent) that made for nonwark purposes (2.1 percent);person miles of travel show no appreciable differences. However, 15,5 percent of allperson trips made for nonwork ~rposes are mode by other means such os wcdking (10.5percent) andschml hs (3.5 percent), compared to 5.5 percent for work purposes. Thepercent of persan miles troweled by other means is faur times higher for nonwork purposesthan for work purposes because of miles troveled by airplane.
2. Trip Purpose and Average Trip Time
The overage trip time for all person trips, regardless of trip purpose and mode, is 17.7minutes (Table 25). Person trips for family ond personal business hove the shortest triptime ([4.1 minutes) while social and recreation trips have the Ion-t trip time (20.2minutes). The average trip time far nonwork purposes (19.4 minutes) is 2 minutes shorterthan for work purposes.
The overage trip time by private vehicle is 17.7 minutes. Trip times are almost twice asIarrg by public transportation (34.8 minutes)as by private vehicle. Trips by other meansoverage 14.8 minutes because of the short duration of walking (9.6 minutes) md bicycletrips (13.1 minutes).
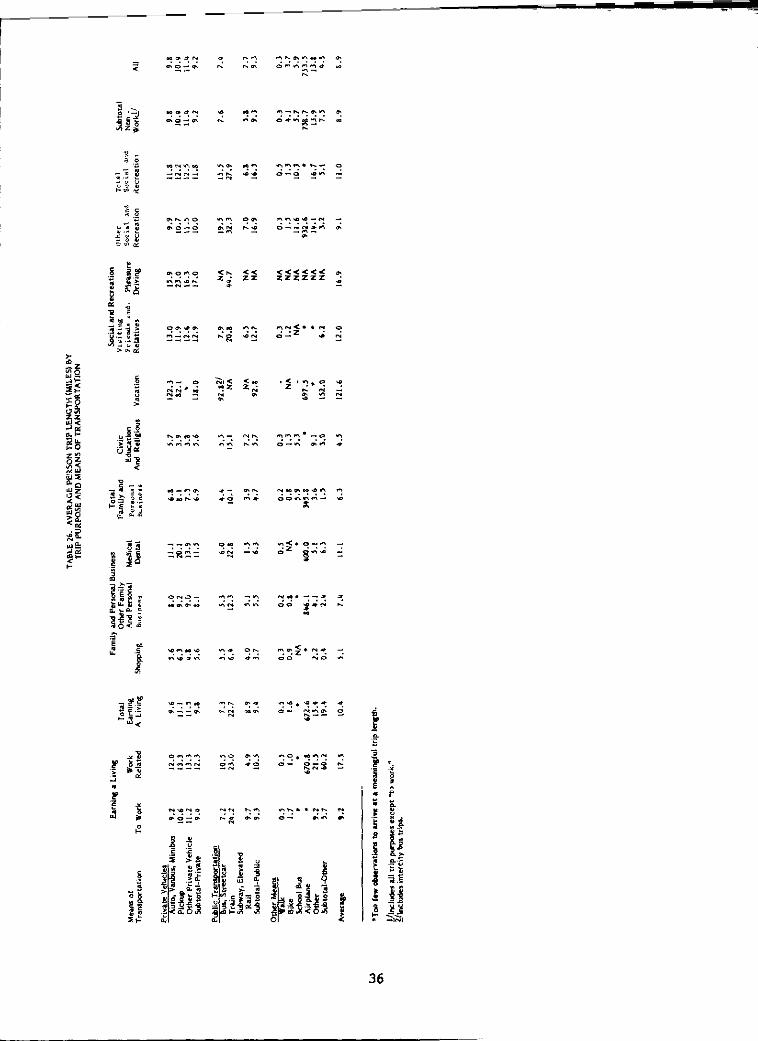
3. Trip Length (Miles)
The overage trip length for all trips, regardless of means of transportation is 8.9 miles(Table 26). The shortest trip length is far civic, education and religious (4.5 miles) and thelongest trips )ength, excluding vacation travel is fer work related trips (17.5 miles). Workond nonwork trips both average 8.9 miles. The averoge trip length by private vehicle andpublic transportation shows little difference (9.2 and 9.3 miles respectively). Trip lengthsby other means of transportation average 4.3 miies and are the shortest due to thepreponderance of walking and bicycling trips.
4. Trip Length Categories
Tables 27 and 28 indicate that approximately 64.4 percent of all trips ore 5 miles and lessandthese trips constitute }3.9 percent of al) person miles traveled. On the other hand,trips of over 100 miles constitute less than I percent (0.7) of all person trips ard 22.3percent of ali miles traveled. Trips by private vehicles follow the same pattern.
,More than half (57.1 percent) of all person trips made by public transportatim are 5 milesand less and these trips constitute only 16.3 percent of miles troveled, indicating t shortbut frequent trips. Similar to person trips by private vehicle, trips of ower 100 milesconstitute less than I percent (0.7)of all trips but 16.3 percent of all miles. Of all public
B
a
W a n .. fA
A u t
oth8rP r i v a t ev0hlcle8
Stmtcar0 . s0 .
● #●
Vac.tlon
R i v e . t .
1 1 .
: :*
0 .1 2 .
1 0 0 .
9 .
*
●
O
●
●
.
t i dD O ”
8 9309 2
30 .
N
*
a
E&
7818
10
01
9
.
o
W $
77
8
1
*
40
0
●
7818
902001
O
100.$1
33
W C E
&
. .
b o
Vahicle,Auto,
str80tceP
M W .
*
.
●
o
*
●
●
9 .
M BS o c im% m a t
0 4 .7 ,1 .9 3 .
1 .0 .
0 .2 .
0 .0 .0 .2 .
: :
l r l a
1 4 .
8 95 .0 .9 5
*
,
. :::
o7 .
m o
1 .6
●
%
●
::;
.
O1 . 51 3 .1 .
34

T A2 A V EP ET T ( M IB M O T R AA T P
Means oTransportation
V e hS u b t o t a
P u bT r a n s pB uStreetcarT rS u bE l e
R aS u b t o t a
O tM eW aBikeSchool BUSAirplaneOtherS u b t o t
T o
20.918.8
36.653,5
43.539.9
8.512,823.9
164.428,912,8
19.5
C *W P e r s o n a lE d ua
R eB u sR e lR e
20.9 14.323.4 16.024.6 13.821.4 14.4
40.3 28.749.2 42.2
4 14 n .
9 82 85 2
1 263 13 9
2 1
1111
25
42
112
3 ;1
1
20.920.425.521.0
39.776.0
29.340.8
9.812.722.9
273.243.213.1
20.2
w1121
B .5
33
12
131
1
Other
19.124.250.719.8
;::
28.634.9
5?::22.4
135.131.520.2
20.4
AP
1121
35
33
912
131
1
* Tf o b s e rt a ra a m e at t i~ / I ~a t rp u re x“ Work.”

M e a n soTransportation
P i cO tP r iV e hS u b t o t a l
P u bT r a n s pB uS t r eT rS u bE l e v
w R a. S u b t o t a
Ot&r Mean8W aB iS c hBA i r pO tS u b t o t a
D i s t r io T r
TABLE27. DISTRIBUTION OFPERSONTRIPS BY MEANSOFTRANSPORTATION AND TRIP LENGTH(MILES) CATEGORIES
( M eo T r a n
M d3
3 63 33 03 6
3 22
1 62 7
9 78 53 4
N3 78 0
4 2
3
2 42 22 42 4
3 17
2 82 9
11 03 5
N2 19
2 2
6-10
17.719.319.517.9
18.015.1
31.519.5
0.31.2
17.2N
14
1
Trip Length (Miles)
11-20 21-30
12.5 4.014.0 4.613.2 4.312.7 4.1
8.822.5 1::;
18.9 1.011.3 3.6
* *0.2 N7 1N N9 42 0
1 3
3
2342
1
02
*00050
2
5
1111
09
N1
*N
130
1
O
0010
02
N0
**
710
0
NotR
0000
37
33
022
111
0
Total
100.0100.0100.0100.0
100.0100.0
100.0100.0
100.0100.0100.0100.0100.0100.0
100.O4I
* e t h0 p e r~ } 2 1 1 , 7 6p e rt r

U m
0 Go’m”i
3

transportation modes, trips by train are the longest. Approximately 89.6 percent of traintrips are more than 5 miles and these trips comprise 98.7 percent of miles traveled.Approximately 91.0percent of trips made by other modes are 5milesand less due to thepreponderanceof walking and bicycle trips and these trips constitute only 9.4 percent ofmiles traveled. Trips of aver 100 miles comprise 0.7 percent of all trips by ather modesand73.8percent of person miles traveled due to airplane trips and travel.
Tables 29 and 30 indicate that the percent of person trips and travel by private vehiclesincrease as trip distance increases up ta 30 miles, and then shows a slight decrease asdistance increases. For trips andtrovel over 100miies, 10.1 percent of all trips and34.1percent of all miles are madeby airplane.
5. For Wark/Nanwork Purposes and Dayaf the Week
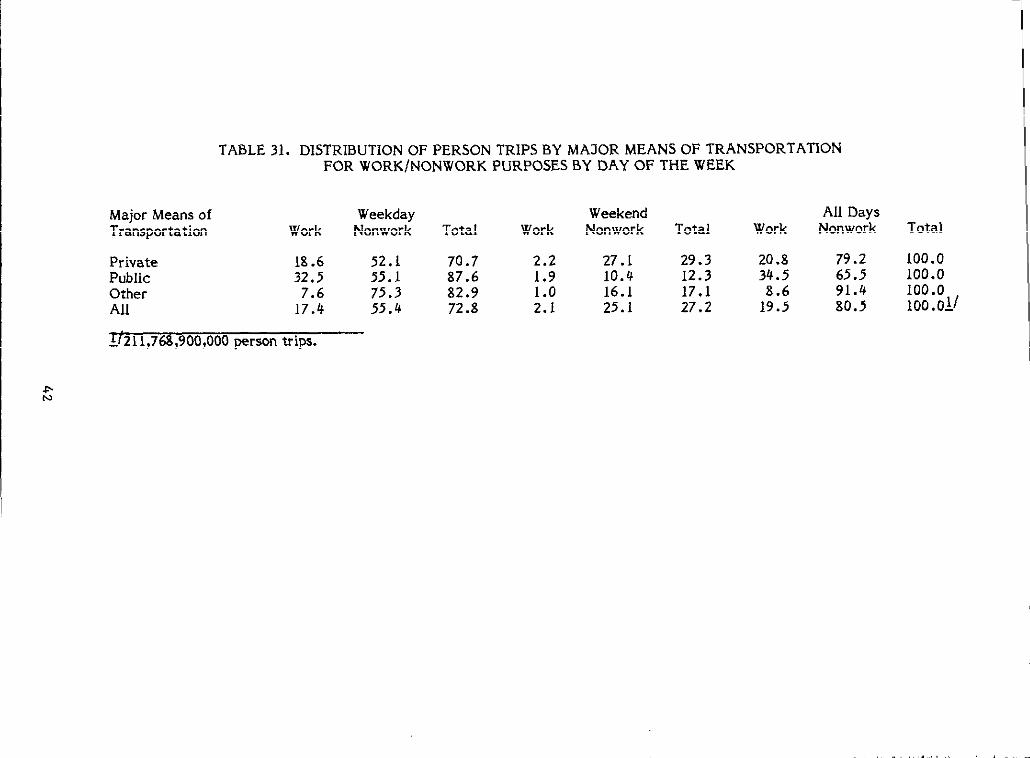
During afu!l week, work trips constitute almost one-fifth (19.5 percent)af all trips, andthe remaining 80.5 percent are nonwark trips (Table 31). Almost three-fourths (72.8percent)of all trips are madeon Mondays through Fridays, of which wark trips constitute17.4 percent of all trips and nanworktrips,55.4 percent. Approximately 27.2 ~rcentofall trips are made on weekends and work trips drop to a minimum of 2.1 percent andnonwork trips to almost half of the weekday percent !025.I.
Work trips constitute 20.8percent of all person frips made in a private vehicle during thefull week and 18.6of the 20.8 percent, or 90 percent, of these trips toke placeon Mondaythrough Friday. Work trips comprise 34.5 percent of all person trips made by publictransportation during a 7-day period and 32.5 percent of the 34.5 percentor 94.2 percentare made on weekdays. Weekdays also predominate for wark trips by other means oftransportation when 88.4 percent (or 7.6 percent of the total 8.6 percent) of all tripsbythese mades are made.
6. For Wark/Nonwork Purposes and Time ofDay
Table 32 indicates that during the week, more than twa-thirds (67.5 percent)of all tripsare made from 12:OON-11:59 PM and 32.1 percent are made from 12:OOM-5:59 AM. Worktrips are concentrated during the hours af 6:00-8:59 AM and 4:00-6:59 PM whenapproximately 62.5 percent of all work trips are made. An additional 16.1 percent of allwark trips are made from 12:OON-3:59 PM. Nonwork trips predominate from 9:00-11:59AM (17.9 percent) and then continue for the remainder of the day when an additional 70.6percent of all trips are made.
Of all work trips made in a private vehicle, approximately 62.3 percent are made from6:00-8:59 AM and 4:00-6:59 PM. Likewise, af all work trips made by publictransportation, 75.3 percent occur during these hours.
Of all nanwork trips made in a private vehicle, 72.1 percent take place between i2:OON-11:59 PM. Of all nonwork trips made by public transportation, approximately 63.O percentalso occur during these hours. Trips by other modes peak from 9:00-1 [:59 AM and againfram 12:OON-3:59PM due Iargely to the preponderance of nonwork trips.
Asshown in Table 33,the distribution and peaking of all trips, aswell as work and nan-work trips, on weekdays does not change appreciably from that taking place during the
3

Means o
P r iV e hA uV a nM i n
P u bT r a n s pB uS t r eT rS u bE l e
R aSubtotal-Public
O tM eW aBikeS c hBA i r pO tS u b t o t
T o
D i s t r io f T
TABLE29. DISTRIBUTION OFPERSONTRIPS BYMEANSOFTRANSPORTATION ANDTRIP LENGTH CATEGORIES
( T L e
T L e( MUnder
3
64.96.3
7!:?
1.6*
0.11.7
21.81.32.4
ON7A26’.2
100.0
42.0
3
8~.1
9
20
03
004
06
1 0
3
6
891
9
20
03
0
3N
03
1 0
1
1
891
9
10
02
*
2N
02
1
1
●L et h0 percent
~/~]~es 0.6 per~nt trips where trip length was not reported.
2
811
9
I1
02
*N
1
O2
1
3
3
71
9
11
02
00
*
:
1
2
5
81
9
;
N3
0N
0023
1
1
Over 100
712
8
10
2
001
11
1
1
0
I
T
781
8
20
02
902
:1
1
1
: “d

4
I
T A3 D I S T RO P ET RB M M O T R AF W O R KP UB D O T W
M aM eo W e eW eA DT r a n s p oW oN o nT oW N oT W N T
P r i1 85 27 2 2 2 2 7 1P u b3 25 58 1 1 1 3 6 1O t7 7 58 1 1 1 8 9 1A 1 75 57 2 2 2 1 8 1 O
~ 1 2 1 1 , 7 ~p e rt r

Ai 26 :9 :subtotal
P1 24 :7 :
N
Total
A1 26 :9 1S u
P1 24 :7 :s u
N
A1 M6 :9 :
P1 24 :7 :
N
T
T D I S T R 1 B U 7 T OO F P E R S O N T RF 0W O R K / N OP U R P O S E S B YT I M E O F D AA NM A S O R M EO F T R A N S P O
P r i v a t e L l
535
4
1215
0
1
26
12
2227
0
1
3113
27.023.418.168.5
0
1
4.132.17.3
43.5
17.124.814.656.5
1.0
100.0
4:::5.3
48.3
44.44.4
5::?
0.4
100.0
0.742.2
d:;
43.35.22.8
51.3
0.2
100.0
~ t r ”s b~ /s te s4 /~ tw a o m n r~ / 4p w tE / 1
3 45 4
4 5
2 315 4
0 0
1 1
N
2 08 1
1 12 3
3 32 21 67 6
0 0
1 1
A
2113
2214
2 22 216 5
0 0
1 100.0
N
29
3
22
96
0
>
1113
3116
O
1
1113
3116
0
1
TotaI
5.333.86.1
45.2
16.128.7
5;:;
0.3
100.O2I
2.09.0
17.928.9
31.620.818.270.6
0.5
100.OEI
2.?13.815.632.1
28.622.316.667.5
0.4
100.OZJ
4

‘ - “ - “ “ “
T 3 D IO W P T F WP B T O D A M M O T
( M o T r
T o D
A1 26 :9 1S u
P1 24 C7 ! I:S u
N
T
A1 26 O9 I I:S u
P1 24 :7 :S u
N
T
Ai 26 :9 :S u
P1 24 ,7 :S u
N
T
P r
3S
4
12
5
0
1
28
12
2227
0
I
l[3
2216
0
1
M M o T b T PO V S P N
33
4
1215
0
1
04
54
441
5
0
1
04
54
44
s
0
1
l pz /( cs3 $ ~ te s~ / Aw a m n r
S3 45 4
4 5
0 0
1 1
N
0I L21 12 3
3 32 21 57 6
0.5 0.4
100.0 100.0
A P
l ;31 13 4
2 22 21 46 5
0.3 0.5
100,0 100.0
32
3
Z38
6
0
I
l~3
4[16
0
i
1113
3116
0
1
Toial
35
4
12
95
0
1
1112
3217
0
I
2113
2216
0
t
4

week. Neither does the modal splii. Table 33 clearly indicates that work trips are veryconcentrated and occur largely during certain specified hours; while nonwork trips, exceptfor thehoursfrorn 12:OOM-S59 a.mvoccur preftymuchali day.
As Table34 indicates, the private vehic[e is the major mode used for work and nonworkpurposes from Monday through Friday, and accounts for 81.4 percent of all trips. Othertransportation modes, such as walking and bicycling account for 11,2 percent, and areu p rfor nonwork trips. Other vehicles such as commercial taxi and truckaccount for 4.4 percent andare also used primarily for nonwork purposes. Trips by publictransportation account for 3.0 percent, of which 1.9 percent of the 3.0 percent areusedfor nonwork purposes.
D. Relationship of Persorr/Household Characteristics and Trip Characteristics
1. Age and Trip Purpose
Regardless of age of tripmaker, almost one-fifth (19.5 percent) are made for workpurposes and the remaining four-fifths (80.5 percent) for nonwork purposes (Table 35).Persons in the 20-64 year-age group make agreater percent aftheir trips for work (25.7~while persons 65 and older make only 7.2 percent of their trips for work purposes.Understandably, persons under 16 years of age make the smallest percent of their trips forwork (5.2) and 94.8 percentof their trips for nonwork.
Beginning with age 16 and to age 64, the percent of trips made for work purposesincreases, and the percent made for nonwork purposes decreases. Beginning at age 65, thepercent of work trips decreases due to retirement, while nonwork trips increase to 92.8percent of all trips.
The percent of trips made for work and nonwork purposes by private and public modesfollows the same trend. The percent of trips made by other modes suchas walking andbicycling peak at ages 16-19 and then decreases asageof TrapMaker increases.
Males follow the same modal split by age of tripmaker. Females tend to make asomewhat greater percent of their trips by public transportation facilities and othermodes, especially for nonwork purposes. This is true for all age groups.
2. income and Trip Purpose
Regardless of income, the greatest percent of all trips are made by private vehicles. Inaddition, as income increases, the percent of trips made by private vehicles increases(Table 36). As previously indicated, the percent of trips made by public transportationdecreases, a[though some levelling off is seen by households with incomes from $15,000-$49,999. The percent of trips made by other modes (heavily predominated by walking)also decreases with the largest percent decrease occuring between households of incomesof less than $5,000 and those with incomes from $5,000-$9,999.
As previously indicated, the percentof trips made by private vehicle increasesas incomeincreases. It can be noted that within each income category, the percent of work tripsmade in aprivate vehicle showsno particular pattern. Households in the $15,00@$24,999bracket make the largest percent (19.6)of work trips in a private vehicle, comparedto
45

Hour of the day
TABLE 34. DISTRIBUTION OF WEEKDAY PERSON TRIPSFOR WORK/NON-WORK TRIP PURPOSESBY TIMEOF THE DAY AND
MEANSOF TRANSPORTATION
(By Time of the Day)
AM12:OOM-5:396:00~:599:00-11;59Subtotal
PM12:OON-3:594:00-6:597:00-11:59s u
AU
AM12:OOM-5:596:00-8:599:00-11:59
PM12:OON-3:594:00-6:597:00-11:59subtotal
AU Hours
AM12:OOM-5:596:00-8:599:00-11$59Subtotal
PM12:OON-3:594;00-6:597:00-11:59Subtotal
A13Hours
Other Vehicl~/
*0.1
*0.1
*0.1
*0.1
0.2
*10.22.0
1.90.20.12.2
4.2
*1.90.22.1
1.90.30.12.3
4.4
l/Auto, pickup~/Tti, truck (commercia~, =hwlbus3/B”~, train, streetcar, eland subway~/~plme,biqcIe,wa~, and other meansnot r=wrted*Le$s thanO.1 percent
46
Trip Purpose
Work
Publi<l
0.10.50.10.7
0.10.3
*0.4
1.1
Non-Work
0.:0.30.7
0.70.40.11.2
1.9
AUPurposes
0.10.90.41.4
0.80.70.11.6
3.0
Nm-Highway~l
●
0.30.10.4
0.30.40.10.8
1.2
0.11.41.73.2
4.01.71.16.8
10.0
0.11.71.83.6
4.32.11.27.6
11.2
Total
1.28.51.3
11.1
3.77.22.1
13.0
24.0
1.38.3
12.422.0
24.215.913.954.0
76.0
2.516.813.733,0
27.923.116.067.0
100.0

47

,
“
mm-.O“m”m
‘n*u0“0”<. .
48

1 6percent for households in the $50,000 and over bracket, 15.6 percent for householdsin the $5,000-$9,999 bracket and 9.6 percent for households with incomesof under $5,000.The relatively small percent of private vehicle trips for work purposes Imcsdeby households}rr the highest income categories {s probably due to the!r torge percent (74.1) of nonworktrips including discretionary travel. H a T 36 indicates, within eoch incomecategory, the percentof trips made in a private vehicle for nonwork purposes increases asincome increases. As previously indicated, as vehicle ownership and income increase, thepercent of travel for discretionary purposes increases. Work trips by public transportationand other modes shw no particular pattern, although households in the highest incomebracket make the smallest percent of these trips. The same pattern can be observed fornonwork purposes. The percent of trips made by private vehicies increases as incomeincreases, and trips by public transportation decreases.
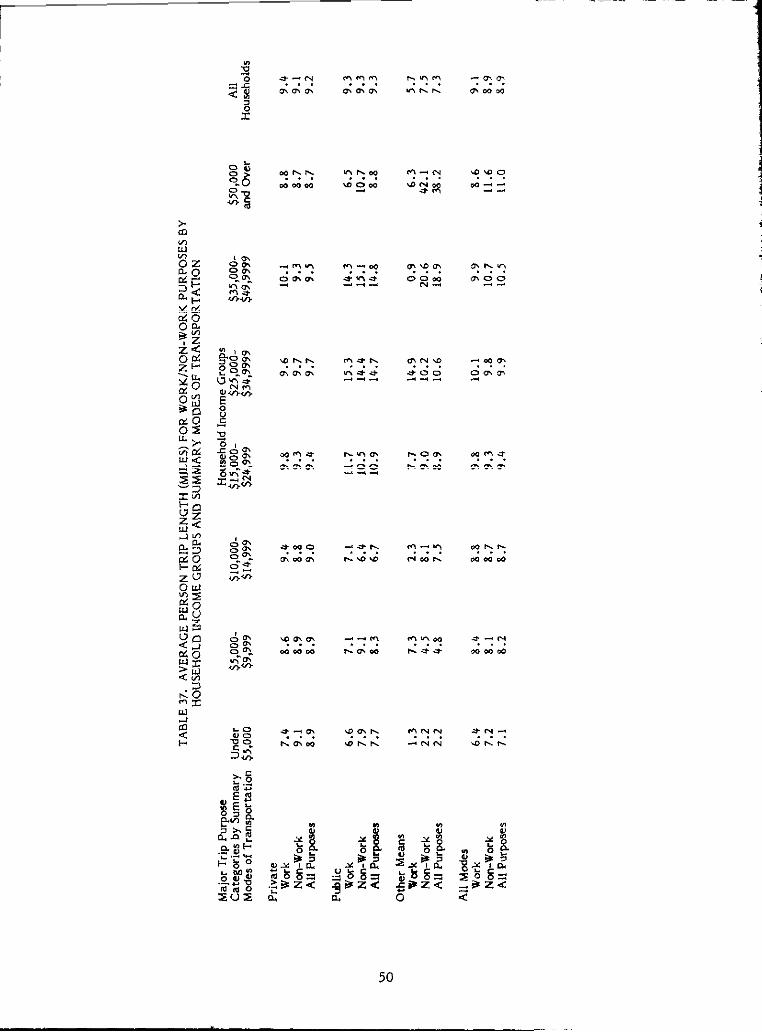
3. lncomeand Average Trip Length
The average person trip length for all purposes and by all modesof transportation is8.9miles (Table 37). It increases slightly by private and public modes to 9.2 and 9.3respectively, but is’morethan2 miles shorter (7.3 miles) by all other modes, which includewalking and bicycling. The average person trip Iengfh for wark is 9.1 miles. [t does notchange significantly by private modes (9,4 miles) or public modes (9.3 miles); the tripIengthby other modes is5.7. Trips for nonwork purposes, which average 8.9 miles followthe same patfern.
The average person trip Iengfh for work by private vehicle generally increases as incomeincreases from 7.4 miles (households under $5,000), to 10.1 miles (households earning from$35,000-$49,999) and then decreases to 8.8 miles for households with incomes of $50,000and over. Work trips by public transportation follow the same trend, from 6.6 miles forhouseholds with incomes under $5,000, to !5.3 miles for households with incomes of$25,f300-$34,999 and then decrease significantly fo 6.5 miles for the highest incomegroups. The average person work trip by other modes shows no significant pattern;however, households with incomes from $25,00&$34,999 have the highest average triplength to work--14.9 miles.
4. Vehicle Ownership and Trip Purpose
As vehicle ownership increases, the percent of trips made by all transportation modes forwork increases, the percent of trips made for nonwork purposes decreases (Table 38).Householdswithout avehicle make the smallest percentof trips for work purposes (16.0)and the largest percent (84.0) for nonwork purposes.
The private vehicle is the major mode for vehicle-awning households and the percent oftrips ma& by private vehicle for work ond nonwork purposes increoses as vehicleownership increases, with the greatest percent increase in trips taking place between one-and two-vehicle households. The percent of trips for three-or-more-vehicle householdsdoes not increase significantly and could even decrease if vehicle ownership was moreinfinitely delineated. Understandably, households without avehicle make less than one-third (32.6 percent) of their trips in aprivate vehicle compared to82.1 to89.7 percent forvehicle-owning households. As to be expected, trips by public transportation decreasesvehicle ownership increases. Households without a vehicle make almosf fwice as many
trips by public transportation for nonwork purposes (10.6 percent) compared to work
49
5

N
0
51

purposes (5.9 percent). Trips by other modes, including walking and bicycling show thesame trends; hawever, trips by these mades comprise 50.9 percent of all trips for non-vehicle-owning households, of which 46.1 percent is for nonwork purposes. For vehicle-owning households, trips by other means colnprise from 15.1 to 9.4 percent of 011 trips,decreasing as vehicle ownership increases.
5. Household Location inside/OutsideSMSA and Trip Length
The average persan trip length is8.9 miles, decreasing to7.8 miles inside the central cityaf an SMSA, and increasing outside the central city (9.6 miles) andautside an SMSA (9.3miles) (Table 39). ~Nith some minor exceptions, trip lengths are usually shortest inside thecentral city of an SMSA for all trip purposes and by all transportation mades.
Trip lengths for work and family business by private vehicles shaw the greatest amountofvariation by household Iocatian. Trip Iengths for all trip purpasesby public transportationare from 2-3 times longer autside an SMSA than inside the central city af an SMSA. Triplengths for all trip purposes by other modes are usually the shortest, regardless ofhousehold locatiw because of the preponderance of walk and bicycle trips.
6. Household Location Inside/Outside SMSA and Average Person Trip Time(Minutes)
The average persan trip time is 17.7 minutes by all rnades, and by private vehicle aswell(Table 40). It is almost 3 minutes shorter (!4.8 minutes) by other modes due to thepreponderance of wa[king and bicycle trips. The trip Iength by public transpartationis atIeasttwice as long (34.8 minutes). Again, trip times, Iike trip lengths, are usuo!ly shortestinside the central cityof an SMSA.
The average person work trip time is 20.4 minutes by all modes. It varies from 12.8minutes by other mades such as walking and bicycling ond increases to 39.9 minutes bypublic transportation. Here tea, trip times are usually shortest inside the central city ofan SMSA where pubiictransportatian facilities are geared to move riders quickly.
The average trip time for nonwork purposesis 17.3 minutes, more than 3 minutes shorterthan the trip time forthewark trip and follows the same pattern as for work trips.
7. HouseholdLaCation in SMSAPopulatian Size-Groups Inside/Outside Central Cityand Summary Modes of Transportation
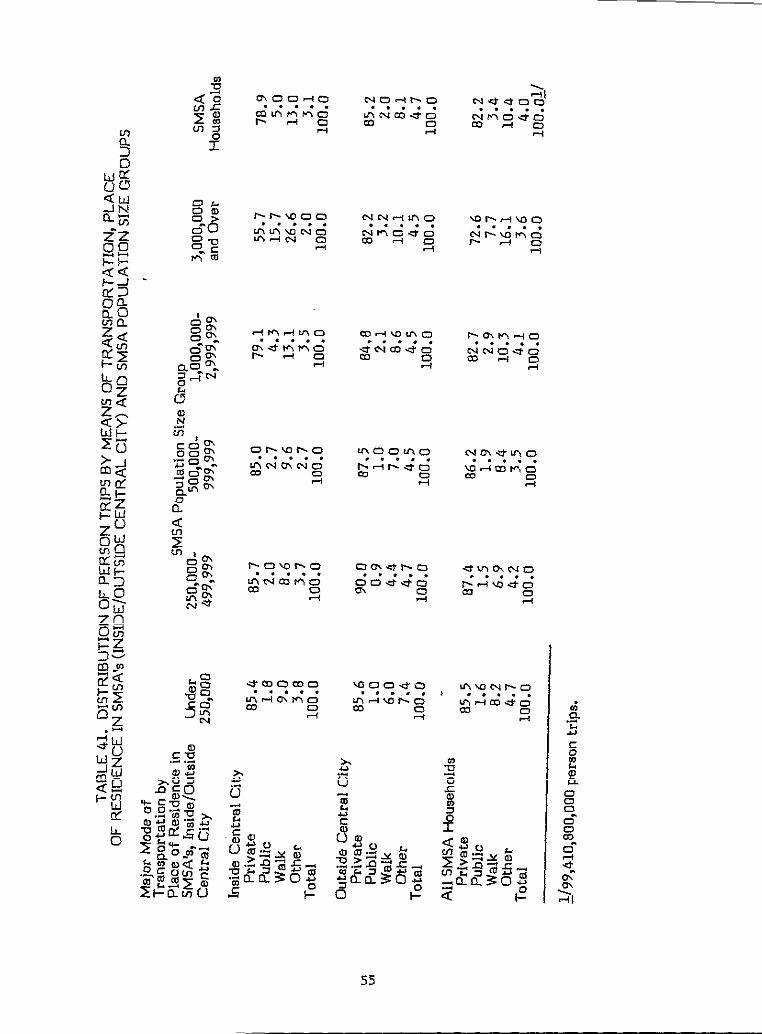
Approximately 82.2 percent of all person trips in SMSA’S are made in a private vehicle(Table 4t). This is slightly more than the 78.9 percent of persan trips made in a privatevehicle inside the central city and slightly less than the 85.2 percent of trips made in aprivate vehicle outside the central city, where public transportation facilities are natreadily available. lnSMSA’sof 3,000,000 and aver, households make the smailest percentof person trips by private vehicle, and the Iargest percent of trips by public transportationand walking.
52

—
e. .+mG. . .
53

TABLE 40. AVERAGE pERSON TRIP TIME (MINUTES) BY HOusEHOLD LOCATIONINSIDE/OUTSIDE SMSA, SUMMARY MODES OF TRANSPORTATION AND TRIP PURPOSE
L ooH oI no uSMSA bySummary Modes ofTransportation work
PrivateInside SMSA
In Central City 18.5Outside Central City 20.8
Outside SMSA 17.0Average 18.8
PublicInside SMSA
In C-9ntral City 38.5Outside Central City 42.6
Outside SMSA 46.8Average 39.9
OtherInside SMSA
In Central City 12.2~tside Central City 13.9
Outside SMSA 12.3Average 12.8
Al! ModesInside SMSA
In Central City 19.9@t9ide Central City 21.2
Outside SMSA 16.8Avera~ 20.4
Trip Purpoae
Family and C i5 oP e rE d uaB u sa R e lR eN W
13.6 13.1 20.3 17.014.3 13.7 21.2 17.615.2 12.7 20.3 li’.h14.4 13.1 20.6 17.4
29.823.928.728.4
9.69,49.89.6
13.513.914.814.1
27.626.429.327.7
14.618.020.117.6
14.916.016.115.7
35,640.140.837.6
13.914.315.714.5
19.920.820.020.2
31.633.032.532.1
13.415.216.915.0
16.917.517.517.3
AllPurposes
17.318.317.317.7
34.336.433.834.8
13.215.116.414.8
17.518.217.317.7
~ /all trip purposes e x“ w o
55

IV. TRENDS OVER TIME - }977 V 1
This section compares changes in persan trips and persan mi[es of travel that haveaccurred fram !969 to 1977. These changes are Iimited to comparable information fromthe 1969 and 1977 NPTS, a i p t a p miles of travel, personcharacteristics of the trip makers, including age, sex, race and mode of transportationused.
In c or f the 1977 NPTS with fhose of the !969NPTS, there aresevera[impartant differences between the two surveys that must be considered. Thesedifferences affect the \977esfimafesof person frips and person miles oftravel, as shownin this section of the report. First, in the 1969 NPTS, trips made by walking and bicycleon the travel day were not collected as ~rt of fhe survey. in the 1977 NPTS, the
transportation used on the travei day was expanded foinciude tripsby bicycle andwaiking. However, for purpases of comparing person trips and travel datafrom the twosurveys, i977data inthis sectian of thereportdaes not inciude persons tripsand trovei by bicycieor waiking.
Second, the i969NPTScoliected trips andtravei information only for persons 5years ofage andoider. in the 1977 NPTS, trips and travei information were coiiected far ailpersansregardiess ofage. Again, for purposesof comparing person frips and person traveidata from the fwosurveys, the i977data, as shown in this section of the report includesdata only for persons 5 yearsof ageandoider.
Therefore, the i977esf/mateaf persan trips and person mifes of travel as shown in thispart of the report differs from those shown eisehwere. Oniythe i977data as presented inthe Trends Over Time section can be compared directiy to the i969 estimateof trips andtravel,
A. Summary of Changes f3etween i977and [969
Tabie 42 pointsup same interesting demographic and travel changes in the United Statesfrom i969to 1977.
Population in the United States during this period increased by oniy 8.1 percent. At thesame time, however, the number of households increased by 20.7 percent due to theincrease in singie person households. The average size of a household decreased from 3.i6persons in i969 2.83 persons in i977. Household automobile ownership increased by35.2 percent.
Person trips and person miles of trovei showed significant increases: 24.9and 29.i percentrespectively. The increase in the percent of person trips mode by women specifically wasiargeiyresponsibie far the increase in person trips.
Person trips byautomobiie, which comprised 85.i percent of totai tripsin i969and 82.5percent in i977, increased 2i.O percent during this period. Person rniies of travei byautomobile increased by i8.7 percent.
The overage person madeaiotai of 736 tripsin 1969 comparedta 850tripsin i977,0ranincrease af 15.4 percent. Person trips by automobile increased from 626 in 1969 to 702tripsin i977. Person miies troveled increased from 5,780 mi\esto 6,347 miies per year.
57

TAME 42. SUMMARY Of CHA~S FOR SELECTED DEMOGRAPI-OC ANDTRAVEL INDICATORS IN 1969 and 1977**
%Iected D e m oa T I n
PersonsHouseholdsWeehold Autos***Pemn Trips
MalesFemales
Person Miles of TravelPe.rew Trips by AutoPereun Miles of Travel by Auto
Per ParsorIAnnual Person TripsAnnual Person Mibs of TravelAnnuaI Pereon Trips by AutoAnnual Person Miles by Auto
Per ~ugeholdWnual Person TripsAnnual Pereon Miles of TravelAnnuaI Person Trips by AutoAnnual Person Miles by Auto
1969 NPTS(000)
197,21362.50472;500
145,146,00077,109,00068,036,000
1,404; 137;OO0123,519,000
1,139,869,000
7367,120
6265,779
2,32222,464
1,97618,237
●Less t h0 p e r* *d e rfrom 1969 md 1977 MTS
***Auto defined as suto, vanbus/minibus end personal-uae taxi.
1977 NPTS(000)
213,14175,41298,000
181,330,00091,921,00089,409,000
1.797,300.000“149;560;000
1,352,900,000
8508,432
7026,347
2,40423,833
1,98317,940
Pereent
+8. 1+20.7+35.2+24. 9+19.2+31.4+29. 1+21.0+18. 7
+15.4+18.4+12.0
+9.8
+3. 5+6.1
*
-1.6

The average household made a total of 2,322 person trips in 1969 compared to 2,404 tripsin 1977, and traveled 22,465 person miles in 1969 compared to 23,833 person miles in1977. P t b a ushowed no measurable increase during this period forthe average household, while person miles of travel in on automobile decreased by 1.6percent, frolm 18,237 to 17,940 miles respectively.
B. Person Trips by Race of TripmakerandMadeof Transportation ’Used
Table 43 indicates that the percent of person trips by automobile from 1969 to 1977decreased from 85.1 percent in 1969 to 82.5 in 1977. However, while person trips byautomobile decreased, person trips by truck increased by more than 4 percent to 9.7percent in 1977. The percent of trips by school bus, bus/streetcar, and subway/cldecreased.
The modal distribution of trips for whites showed the same trends. However, fornonwhites, a major difference is noted. The percentof trips by automobile increased by11.8 percent during this period, probably due to increased ownership. Tables 44and 45give a breakdown of modal distribution byage and race of TrapMaker.
C. Person Trips by Sexof TrapMaker and Mode of Transportation Used
Asshown in Table 46, males were largely responsible far the decrease in person tripsbyauto--decreasing from 82.7 percent in 1969 to 77.4 percent in 1977. Offsetting thisdecrease was the increase in the percent of person trips by truck--increasing by 6.1percent to 14.7 percent ofal{ tripsin 1977. Trips by public transportation by males, on*he whole, showeda minor decrease. The percentof trips made by automobileby womenremained about the same during this periad; person trips by truck showed a 2.6 percentincrease. Trips by public transportation by women showed some decreases.
D. Person Trips by Specified Age Groups and Mode of Transportation Used
Table 47 indicates that there wasno substantial change in the percent distribution of tripsmade by each age group from 1969 to 1977 except for person in ages 40-49. This graupshowed the largest percent decrease of all trips made by automobile (3.5 percent), truck(8.4 p eb u( percent), and airplane (15.6 percenf).
As shown in table 48, the percent of trips made by automobile decreased for almost allage groups from 1969-1977, except for the 60-64 year olds. However, the percent of tripsmade by fruck increased for almost every age graup. In almost every age group, exceptfor persons from >15 years, the percentof trips made by public transportation facilitiesalso showeda decline during this periad.
59

TABLE 43. DISTRIBUTION OF TRIPS BY MEANS OF TRANSPORTATION AR O T RI 1 and 1969
S uY b R TM eo W hB & O R AllTransportation 1977 1969 1977 1969 1977 1969
Auto~l
T aM o t oT rS cBus, Streetcar
Subway, El
Train
AirpJane
Other
All
82.7
0.2
0.6
10.3
3.2
1.7
0.3
0.3
0.1
0.6
100.0
86.5
0.2
0.2
5.6
4.6
2.0
0.5
0.2
0.1
0.1
100.0
80.4
0.6
0.5
4.6
4.8
7.4
1.0
0.3*
0.4
100.0
68.6
0.8
0.0
5.2
9.2
12.8
2.6
0.0
0.1
0.7
100.0
82.5 85.1
0.2 0.3
0.6 0.2
9.7 5.6
3.3 4.9
2.3 2.7
0.4 0.7
0.3 0.2
0.1 0.1
0.6 0.2
100.011 100.02/
4/181,330,000,000 person trips in 1977. (211,768,900,000 person trips less 9,303,000.000trips by persons under 5 years of age, 19,762,100,000 walking trips, and 1,373,800,000 biketrips.)
60

6

62

TABLE 46. DISTRIBUTICSN O P ET B MO T R A N SS O T RI 1 a 1
Means ofTransportation
Auto~/
Taxi
Motorcycle
Truck
School BUS
B uS t rS u bET rA i rO tA
S o T rM aF
1 1 1 1
70.2
1.0
14.7
3.3
2.0
0.4
0.3
*
0.7
100.011
80.2
0.3
8.6
4.7
2.2
0.7
0.2
0.1
0.3
100.021
80.2
0.2
4.7
3.4
2.6
0.4
0.2
0.1
0.4
100.O3I
88.0
0.4
O.Q
2.1
5.2
3.4
0.7
0.1
*
0.1
100.O!I
~ / 9 1 , 9p t
~ / 7p t
~ /p t
2 / 6p t
~ / lv a ra p et
6

6


V.
The overage person makes 992 persen trips annuo~~y or 2.7 person tr;ps daily.Approximately 83.7 percent aremade by private vehicle, 2.6 percent aremude bysornefarm of public transportation and 13.7 percentage made by other means of transportationsuch as walking, bicycling, airplane, etc.
The percentof trips !n aprivate vehicle hovers between 80-90percent for allages, exceptschool children, 5-15 years and teenagers, 16-19 years of age. Percent of trips by pub{ictransportation decreases unt;l ages 40-49 years and then increases. School children from>15years of age make one-thirdof all their persm trips by walkkrg (15.9 percent) andschool bus (15.6 percent); wcdkingis alsoan important mode far 16to 19year oids(15.Opercent) andperson 65 years and older (14.2 percent).
Women make a slightly greater percent of persan trips by ~blic transportation: 2.8percent for women vs. 2.3 percent for men. In addition, women crge 60 and older makemore walking trips than men in the same age group. More than two-thirds (66.9 percent)of all person trips made by pub!ic transportation are made by persons from S-39 years ofage ond an additional 8.Opercentrnode by persons 65 years ondolder.
As household income increoses, the percent of person trips made by private vehiciesincreases from 69.9 percent (households with incomes under $5,000) to 90.7 percent(households with incumes of$50,000 and over). Percent of trips by public transportationshows the reverse trends, decreasing from 4.6 percent to 1.} percent respectively.
Twa-vehicle households make about oneandane-half as many trips (42.5 percent)as one-vehicle (26.8 percent) and three-or-more-vehicle households (24.7 percent). For tripsmade in aprivate vehicle, two-vehicle households make 6.4percentoge points higher (88.5percent) than one-vehicle households, leveling off for households with three-or-morevehicles to 89.6 percent. For trips by public transportation, one-vehicle households maketwice us many trips as two-vehicle households, three times as many as three-or-more-vehicte households. In addition, one-vehicle households make about one and one-halftimes more walking trips than two- and three-or-more-vehicle households. Householdswithout a vehicle make almost half of all their trips (44.8 percent) by walking.
Residents of households in SMSA’S of 3,000,000 and over make the smallest percent afperson trips by private vehicle (72.6) and tb greatest percent of trips by publictransportation (7.7) and other modes such as walking (16.1 percent), compared to residentsof households in other SMSA population size groups. Residents of households outside anSMSAmaket’he Iargest percentof trips by private vehicle (87.0)and the smallest percentof trips by public transportation (0.8) due to the lack of facilities. As expected, residentsof households located inside the central city of an SMSA make a smaller percent ofprivate vehic}e trips anda Iarger percent of public transportation tripsthan residentsof households located outside the central city.
Residents ofhouseho}ds in the Northeastern U.S. make at least twiceas many trips bypublic transportation as residentsof households in any other regien.
Of all trips and trove} made by public transportation, approximately one-third are forwork p ua a pt a f n p
67

The overage trip time for all person trips, regardless of trip purpose and made is [7.7minutes. This does not vary for trips made in a private vehicle. Trip times, however, arealmast twice as long by public transportation (34.8 minutes).
The average trip length for all trips, regardless of mode is 8.9 miles. The shortest triplength is for civic, education and religious (4.5 miles) and the longest trip lengths,excluding vacation travel, is for work related trips ( 17.5 miles). Work and nrrnwork tripseach average 8.9 miles. The overage trip length by private vehicle and publictransportation shows little difference (9.2 and 9.3 miles respectively).
The private vehicle is the major mode used for work and nonwork purposes and accountsfor 8[.4 percent of all trips. Non-highway modes, such as walking and bicycling accountfor 1[.2 percent and are used predominantly for nonwark trips. Other vehicles such ascommercial taxi and truck account for 4.4 percent and are also used primarily fornonwork purposes. Trips by ~blic transportation account for 3.Opercent, of which 1.9percent are used for nonwork purposes.
Work trips are very concentrated and occur largely during certain specified hours, whilenonwork trips, except for the hours from 12:OOM-5:59 a.m., occur pretty much all day.
Approximately 64.4 percent of all trips are 5 miles and less and these trips constitute 13.9percent of all person miles traveled. On the other hand, trips of over 100 miles constituteless than I percent (0.7) of all trips, and 22.3 percent of all miles traveled.
Within each income category, the percent of trips made in a private vehicle for workpurposes shows no particular pattern, highest in the $15,000-24,999 income group (19.6percent), and lowest in the under $5,000 (9.6 percent) and $25,0W34,999 (10.2 percent)income groups. However, the percent of trips made in a private vehicle for nonworkpurposes increases as income increases.
The average person trip length for work ~rpasesby private vehicle generally imreasesasincome increases from 7.4 miles (hou*holds under $5,000) to 10.! miles (householdsearning from $35,000-49,999) and then decremes to 8.8 miles for hwseholds with incomesof $50,000 anover. Work trips by public transportation show the same trend.
As vehicle ownership increases, the percent oftrips madeby all modes for work increases;the percent aftrips made for nonwork purposes decreases.
~
A - Survey Proceduresand Data Processing . . . . . . . . . . . . 70
B - Glossary ofTerrnsUsed inNpTS . . . . . . . . . . . . . . . . 72
Appendix C - NpTsPublic use Tape Request - . . . . . . . . . . . . . . . . ‘0
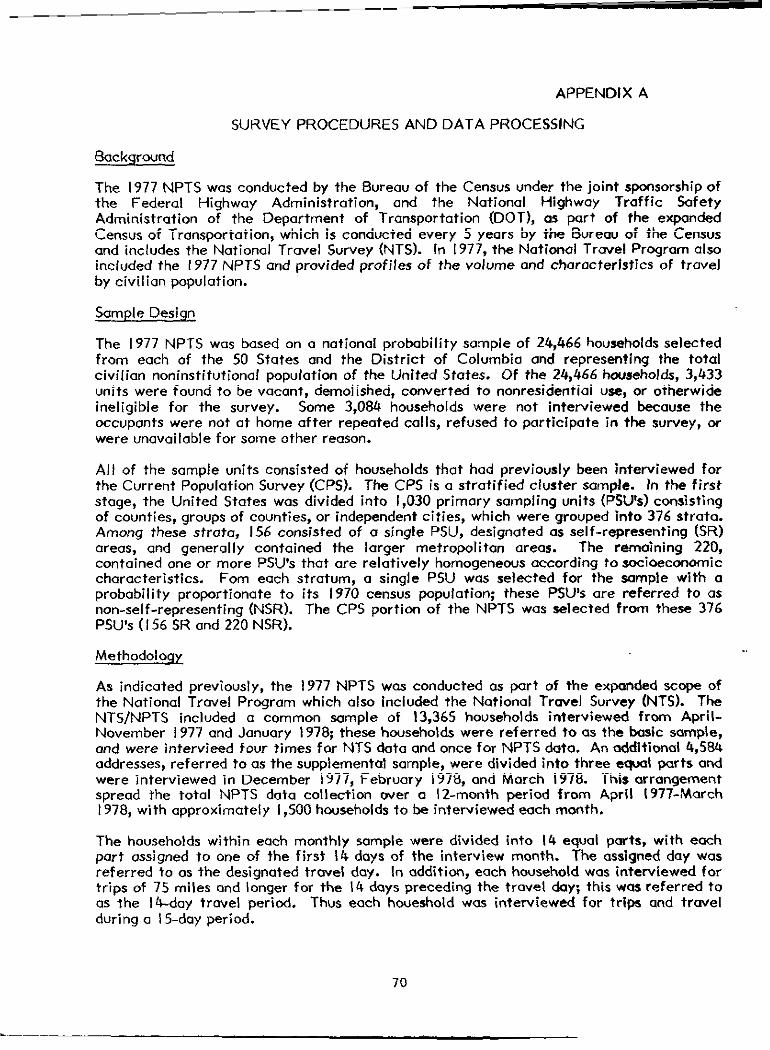
APPENDIX A
SURVEY PROCEDURES AND DATA PROCESSING
Background
The 1977 NPTS was conducted bythe Bureauof the Census under the joint sponsorship ofthe Federal Highway Administration, and the Natianal Highway Traffic SafetyAdministration of the Department af Transportation (DOTL as part of the expandedCensusaf Transportation, which is conducted every 5 years by the Bureau of the Censusand includes the Natianal Travel Survey (NTS). In 1977, the Nationol Travel Pragram alsoincluded the 1977 NPTS and provided profiles of the volume and character;stlcs of travelby civilian population.
Sample Desiqn
The 1977 NPTS was based on a national probability sample of 24,466 households selectedfrom each af the 50 States and the District of Columbia and representing the tatalcivilian noninstitutional papulatim af the United Stotes. Of the 24,466 households, 3,433units were found to be vocant, demolished, converted to nonresidential use, or otherwideineligible far the survey. Some 3,084 households were not interviewed because theaccupants were not at home after repeated calls, refused to participate in the survey, orwere u nf s o r
All of the s u c a h t h p b I forthe Current Population Survey (CPS). The CPS is a stratified cluster sample. In the firststage, the United States was divided into 1,030 primary sampling units (PSUts) consistingaf counties, groups ofcaunties, or independent cities, which were grouped into 376 strata.Among these strata, 156 consjsted of asingle PSU, designated as self-representing (SR)areas, and generally cantained the larger metropolitan areas. The remaining 220,contained one or more PSU’S that are relatively hamogeneaus according to sacioecorromiccharacteristics. Fom each stratum, a single PSU was selected for the sample with aprobability praportianate to its 1970 census papulatian; these PSUIS are referred to asnon-self-representing (NSR). The CPS portion of the NPTS was selected from these 376PSU’s(156SR and 220 NSR).
Methodology
As indicated previously, the 1977 NPTS was conducted as part of the expondedscape ofthe Notional Travel Program which alsa included the National Travel Survey (NTS). TheNTS/NPTS included a common sample of 13,365 households interviewed from April-November 1977 and January 1978; these hausehalds were referred toasthehsic sample,and were interviewed four times for NTSdotaandorrce for NPTSdato. An additional 4,584addresses, referred to as the supplemental sample, were divided into three equal parts andwere interviewed in December 1977, February 1978, and March 1978. This arrangementspread the total NPTS data collection wer a 12-month periad from April 1977-,March1978, with approximately l,500hauseholdsto be interviewed eoch month.
The households within each monthly sample were divided into 14equal parts, with eachpart assigned to one of the first 14days of the interview manth. The assigned day wasreferred to as the designated travel day. In addition, each household wasintemiewed fortrips of 7S miles and longer for the 14 days preceding the travel *Y; this wos referred toas the 14-day travel period. Thus each houeshold was interviewed far trips and travelduringa 15-day period.
70
..—.—-

Subiect Areas Planned for 1977 NPTS R
The following is a list of subject areas for which 1977 NPTS reports have beenpublished/being prepared, This will give transportation researchers and p[anners a generalindication of the variety and scope which the 1977 NPTS data encompasses. Repartnumber I i should be available in a few months.
CHARACTERISTICS OF 1977 LICENSED DRIVERS AND THEIR TRAVEL(Report 1, October 1980)
HOUSEHOLD VEHICLE OWNERSHIP(Report 2, December 1980)
PURPOSES OF VEHICLE TRIPS AND TRAVEL(Report 3, December 1980)
HOME-TO-WORK TRIPS AND TRAVEL(Report 4, December 1980)
HOUSEHOLD VEHICLE UTILIZATION(Report 5, April 1981)
VEHICLE OCCUPANCY(Report 6, April 1981)
A LIFE CYCLE OF TRAVEL BY THE AMERICAN FAMILY(Report 7, July 1981)
URBAN/RURAL SPLIT OF TRAVEL(Report 8, June 1982)
HOUSEHOLD TRAVEL(Report 9, July 1982)
ESTIMATES OF VARIANCES(Report 10, December 1982)
PERSON TRIP CHARACTERISTICS(Report 11, December 1983)
Special Tabulations
There are some applications that require the use of data items on the Census file, such asthose related to place af residence of individual respondents, that cannot be included onthe public use tape without possible disclosure of the individual respondents. If disclosurecan be avoided, the Bureau of the Census will undertake special tabulations in accordancewith its policy that ‘*Special tabulation ar transcriptions of data in the files of the Bureauof the Census will be undertaken on a cost basis, insofar as Bureau facilities are available.Those requesting special tabulations should understand that the data are based on surveyspaid for bypublic funds and, therefore, are public property. The purpose for which suchtabulations are obtained must not be contrary to the public interest, or be used to giveunfair commercial or other advantage to any person or group:’
Requests for special tabulations shauld be addressed to: Chief, Demographic SurveysDivision, Bureau of the Census, Washington, D.C. 20233.
Copies of the NPTS Survey Questionnaire are available upon written request from theOffice of Highway Planning (HHP-44), Federal Highway Administration, Washingtan, D.C.20590.
71

APPENDIX B
GLOSSARY OF TERMS USED IN NPTS
This glossary is provided to assist the user in the interpretation of the data.
Airport: A commercial facility that services regularly scheduled airlines.
Carpool: A regularly scheduled traveling arrangement whereby two or more personsride together in the same vehicle, sharing the driving and/or the cast of the trip, orsimply riding together regularly with one or more persons doing the driving. If twoor more hausehald members regularly ride to work in the some vehicle, it is alsoconsidered a carpool.
Central City: A city of 50,000 inhabitants or more in the 1970 Census or t citiesi.e., cities with contiguous boundaries and constituting, far general social andeconomic purpases, a single community with a combined populatim of at least50,000, and with the smaller of the twin cities having a population of at least 15,000.
Destination: For travel period trips, the destination is the farthest point of travelfram the paint of origin of a one-way trip of 75 miles or mare.
[n travel day trips, the destination is the p a w t is a break in trovel.
Driver: A person wha operates o motorized vehicle. If more ?hon one person drives=ingle trip, the person who drives the most miles is classified m the principaldriver. If one or more household members share the driving, the percent of drivingdone by each household member is recarded separately. If nanhausehold membersshare the driving, the total percent af driving done by all nonhousehold members isrecarded.
Education Level: The number of years of regular schaaling campleted in gradedpublic, private, or parochial schoo!s, ar in colleges, universities, or professional~haals, w day schaal ar night schaol. Regular schooling is that whichadvances a person toward an elementary or high schaol diploma, ar a college,university or professional schaal degree.
Employed: A person is considered employed if there is a definite arrangement farregular full-time ar part-time work for pay every week or every month. A formal,definite arrangement with one or more employers to wark a specified number ofhours a week, ar days a month, but on an irregular schedule during the work month isalso considered employment. A person who is on call to work whenever there is aneed for his (her) services, is not considered emplayed.
Famiiy Income: The maney incame of all persons in a household, imluding thosetemporarily absent. Includes wages and salary (befare deductions), commissions,tips, cash banuses; net incame from a person’s awn (unincorporated) business,professional practice, or farm (gross receipts minus business ex~:~~sk pensi~s,dividends, interest, unemployment or workmen’s compensation, “ security,veterans’ poyments, rent received from awned property (minus the operating c~ts))
72

p a sp r g of money from friends or relatives notliving in the household, alimony, child support, and other kinds of periodic moneyincome other than earnings. Excludes income in kind, such as room and board,insurance payments, lump-sum inheritances, occasional gifts of money from personsnot living in the same household, money received from selling one!s house, car, orother personal property, withdrawal of savings from banks, and tax refunds.
Federal-aid rural area: Any area outsideof f.ederal-aid urban arecs.
Federal-aid urban area: An urban place of 5,000 ar more population as determinedby the Bureau of the Census.
Freeway, tollway, or expressway: A divided arterial highway for through trafficwith full or partial control of access and grade separations at mojor intersections.
Head of household: The one person whais regardedas the head by the members ofthe household. In most cases the husband is the head, if livingin thehausehold. Insome cases, the head may be a parent of the chief wage earner or the anly adultmember of the household. An Armed Forces member is considered as the head onlyif he lives at home and is a household member. Only one head is designated for eachhousehold.
—
Househald: A groupof persons whose usual place ofresidence isa specific housingunit; these persons mayor may not be related to each other. The total of all U.S.households represents the total civilian noninstitutianalized population.
Household trip: One or mare household members traveling together.
Household vehicle: A motorized vehicle that is owned, leased, rented ar companyowned ond left at home ta be regularly used by household members during thereference period. Includes vehicles used solely for business purposes if kept athome, e.g., taxicabs, police cars, etc., which may be owned by, or assigned to,household members for their regular use. Includes vehicles brought home by a carsales personor auto mechonic, only if the vehicle was available far use by him (her)during the entire reference period. Includes all vehicles that were owned oravailable for use by members of the household during the reference period eventhough a vehicle may have been sold before the interview. Excludes vehicles thatwere not working and not expected to be working within 60 days, and vehicles thatwere purchased ar received after the designated travel day.
Licensed driver: Any persan who holds avaliddrive~s iicense from any State.
Means of transportation: A personal made used far going fromane place (origin)toanather (destination). Includes private and public motorized modes, as well aswalking. For all travel day trips, each changeof mode constitutes aseparate trip.The following personal transportation modes are included:
-- Automobile: A privately owned and/or operated licensed motorized vehicleincluding cars, jeeps, dune buggies, and stationwagans. Also includes leased andrented cars if they are privately operated and not picking up passengers in returnfor fare.
73

&passen,ers.Vanbus Minibus: Privately owned and/or operated vans and buses designed to
-. Pickup truck/other van: A small open-body motorized vehicle, privately ownedand/or operated, with four to sixtires, built on a chassis comparable to that of apassenger car. Accommodates fewer than five passengers. Includes traveltrucks (service trucks) when they are not being used for commercial purposes.
-- Other truck (personal use~ The private use, either as a passenger or driver, ofall other types of trucks, i.e., dump trucks, trailer trucks, etc., when they arenot being used for commercial purpases.
-- -Motorcycle: Includes large, medium and small motorcycles. Does not includeminibikes, etc., which can nat be licensed for highway use.
-. Self-contained recreational vehicle:.includes recreational vehicles that areoperated as aself-contairred unit wlthaut being hitched to another vehicle: forexample, a motor home.
-- Taxi (persana(useh The use of a passenger vehicle either by a driver or a~ienger, which does not involve the duties af a professional driver for thepoymentof afare bya~senger.
-- ~: Includes intercity buses, etc.j mass transit systems and shutt[ebses thatare available to the general public. Also includes senior citizen buses or similarbus services that are available to the public. Does not include shuttle busesoperated by a government agency ar private industry~or the convenience afemployees, contracted or chartered buses or scti! buses. These latter types areinciuded in “other.”
-- Train: Includes commuter trains andpossenger trains other than elevated trains~ubways.
-- Streetcar: Includes trolleys, streetcars, and cable cars.
-- Elevated rail or subway: Includes elevated troin and subway trains.
-- Airplane: Includes commercial airplanes and smaller planes that are availablefor use by the general public in exchange for a fare. Private planes andhelicopters are included under -other.”
-- Taxi(commercial use)r The use af a taxicab by a driver far hire or by aposserrger far fare. Also includes airport limousines. Daes Q include rental carsif they are privately aperated and nat picking uppossengers In return for fare.
-- Truck(commercial use): Includes the commercial use, either as a driver or apassenger, af pickups, dump trucks and trailer trucks being aperated forbusiness-related purpases.
-. Bicycles: Includes bicycles ofall speeds and sizes and minibikes.
74
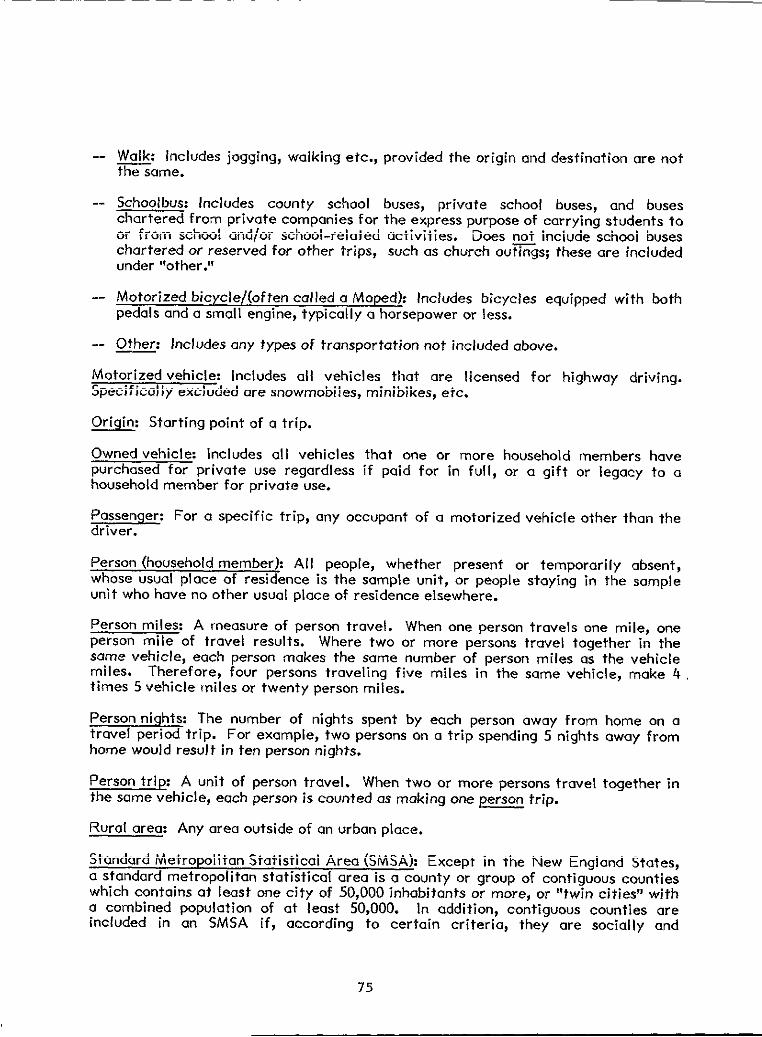
.-
-.
-.
--
W I j w e p t o a d a nt s
S cI county school buses, private school buses, and buseschartered from private campanies for the express purposeaf carrying students toor from school and/or schoal-related activities. Does not include school buseschartered or reserved for other trips, such as church ou~gs; these are includedunder “ather.”
Motorized bicycle/(often called aMoped~ Includes bicycles equipped with bothpedals anda small engine, typically a horsepower or less.
Other: Includes any typesof transportationnof included above.
Motorized vehicle: Includes all vehicles that are licensed for highway driving.Specifical~y excluded are snowmobiles, minibikes, etc.
=: Sfartin9pointofo trip.
Owned vehicle: Includes all vehicles that one or more household members havepurchased for private use regardless if paid for in full, or a gift or legacy to ahousehold member for private use.
Passenger: For a specific trip, any accupant of a motorized vehicle other than thedriver.
Person (household member~ All people, whether present or temporarily absent,whose usual place of residence is the sample unit, or people staying in the sampleunit who have no other usual place of residence elsewhere.
Person miles: A measure of person travel. When one person travels one mile, oneperson mile o t r W t o m p t t i tsame vehicle, each person makes the same number of person miles as the vehiclemiles. Therefare, four persons traveling five miles in the same vehicle, make 4,times 5vehiclerniIesor twenty person miles.
Person nights: The number of nights spent by each person away from home on atravel period trip. Far example, two personson a trip spending 5 nights away fromhome would result in ten person nights.
Person trip: A unit of person travel. When two or more persons travel tagetherinthe same vehicle, each person is counted as making one- trip.
Rural area: Any area outsideaf an urban place.
Standard Metropolitan Statistical Area (SMSA): Except in the New England States,a standard metropolitan statistical area is a county or group of contiguous countieswhich contains at least one city of 50,000 inhabitants or more, or ‘twin cities” witha combined population of at least S0,000. in addition, contiguous counties areinc{uded in an SMSA if, according to certain criteria, they are socially and
75

I
e ci nw t c cc o t a c i o c
In the New England States, SMSAIS
Station wagon: A passenger v having an enclosed bady of paneled design withtwo or ,nore seats, where the rear seats can be remaved ar folded down ta cl l o f c o
~: For travel periad trips, a break in travel other than for gasoline, rest, andfoad. For travel day trips, each stop is treated as a separate trip.
Train station: A depat where regularly scheduled trains may be boarded far travelto citiesat least 30 miles away.
Travel day: A24-haur Wricd fro!m4:OOa.m. tO 3:59 a.m. designated bythe Mreauof the Census as the reference periad for studying trips and trwel of a particularhousehold.
Travel period: The 14 days immediately preceding the travel day ofahwsehold.
Traveler: Aperson reportinga trovelday and/or trwel period trip(s).
Traveling houshold: A household reporting at least one travel day and/or trove)period trip.
Trip(travel day): A travel day trip is defined as any one-way trwel from oneaddress (place) to another by private motar vehicle, public transportation, bicycle,or walking. Jogging and walking for exercise are excluded. When travel is to morethan one destination, a separate trip exists each time one or troth of the followingcriteria is satisfied:
a. The traveltime between two destinations exceeds 5 minutes.
b. The purpose for trwel ta one destination is different from the purpose fortravel to another.
The one exception is travel within a shopping center or mall. It is to beconsidered travel to one &stination, regardlessaf the numberof stores visited.
Trip(travel periadk A travel period trip is one-way to a destination which is 75miles or Imore from place of origin.
Trip duration: For travel period trips, the number of nights spent awoy from homeon a single trip, including time (nigtrts) spent enroute and at the destination. Fortravel day trips, usually measured in minutes.
Tripp urpose: The main reason that motivated the trip. For purposesof this survey,there are 21 trip reasons. If there are more reasons than one, and the reasons do notinvolve different destinations, then only the main reason is chosen. If there are twoar !more reasans, and they each involve different destinations, then each reasm isclassified asa separate trip. The 21 trip reasons are defined 0s follows:
76

-- To place of work: Includes travel toa place where one reports for work. It doesnot include any other work-related travel.
- W ob T r t b a e t t p owork; for example, a plumber drives to a wholesale dealer to purchase suppliesfor his business.
- C oT m t a business, professional, special interest, andother types of conventions.
— Civic/Education/Religious: Trips to political rallies, legislative hearings, votingplaces, etc.; to school, college, or university far class(es), PTA meetings,seminars, etc.; to church services or to participate in other religious activities.Social activities that take place at a church ,or school are not classified asreligious or educational,
- E m T t t e a m i nT t th f d a c l~ f r
- D o d T m for medical, dental or psychiatric treatment, orother related professional services.
-- Shopping: Includes ‘window shopping” and purchases of commodities such asgroceries, furniture, textiles, etc., for use or consumption elsewhere.
— Family orpe rsonal business: Trips taken to attend organized functions of thefamily or friends, such as weddings, graduations, reunions, etc. Includespurchase af services such as cleaning garments, beauty parlor treatments,servicing of an auto, etc.
-- Visit friends or relatives: Trips made to visit f o r b nprompted by organized family affairsor an emergency.
—
-- Pleasure driving: Includes driving trips made with no other purpose listed herebut to wgoforadrive~ with nodestinatian in mind: for example, oSunday drivein the country.
-- Si htseein : Trips taken to sightsee or t w a p p p tH d is i, ,
-- Entertainment: Trips taken to go to a m t t o cd ic s s s a a b g r t m oa a mp
-- Recreation (participant): Trips taken to participate i s o oa cs a f h g s p s sb ob ae
-- Vacation: Trips reported by the respondent as “vacation.’!

.- Change of vehicle: Trips made specifically to change from one vehicle toanother within the same “means of transpartotion” category. (For example,transferring from one bus to another, one plane to another, or from onepassenger carto another.)
-- Pick upor[eave off passenqer: Trips that are made to serve a ~senger. Forexample, otrip byMrs. Columk to pick up her mother and drive her to the storeon travel day would be reparted as two trips: the trip to her mother’s home forthe purpose of picking up a passenger and the trip to the store for thepurpaseofshopping. If Mr. Hersholt drives from Washingtonto Chicago during the Ir+-daytravel period and stops in Baltimore to pick up his son, the pur~ of his firststopon histrip to Chicago will be reported in Part f30f Section VI asnpickingupa Passenger.n
-- Return home: The trip made to the residence of the respandentat the timeofthe trip. Inthecase ofa college student who lives onccrmpus and is interviewedat school, trips to the dormitory or other living quarters an campus areconsidered ‘~return homeJ~
-- Ladging: Trips made for the purpose of taking overnight accommodations. Thiscategory is also used in lieu of ,,return home,, when return trips are tO this
lodging.
-- -; Trips taken to enjoy some farm of smial activity involving friends oracquaintances, such as a party, piaying cards, dancing, etc.
-- ~: Any purpose for a trip that daes nat fit into ane of the abave categories.
Type Z naninterview: A person in an interviewed household far which tripinformation is incomplete but certain demographic information is available.
Urban place: Defined by the Bureau of the Census as follows: .
a. A place of 2,500 inhabitants or more incor~rated as a city, barough, viliage,or town, (except tawns in New England, New York, and Wisconsin);
b. The densely settled fringe, whether incorporated or not, of urbanized areas;
c. Towns in New Engiand and townships in New Jersey and Pennsylvania thatcontain no incorporated mun!cipalit!es as subdivisions and heve either 25,000inhabitants or more, or a population of 2,500 to 25,000 and a density of i ,500persons or more per square miie;
d. Counties in States other than the New Engiand States, New Jersey, andPennsylvania that have no incorporated municipalities within th8ir boundariesand have a density of 1,500 persons or more per square mile; or
e. Unincorporated piaces of 2,500 inhabitants or more.
78

UrbanizerJ area: Defined by the Bureau of the Census as:
1. Any area made up of:
a. A central city of 50,000 i o more in 1960, or in a special censusconducted by the Census Bureau since 1960, or in the 1970 census; or
b. Twin cities, i.e. cities with contiguous boundaries and consistuting for genera)social, and economic purposes, a single community with a combined population ofat least 50,000 and with the smaiter of the twin cities having o population of atleast \ S,000.
2. Surrounding closely setfled territory, including the following (but excludingthe rural portions of extended cities):
a. Incorporated places of 2,500 inhabitants or more.
b. incorporated places with fewer than 2,500 inhabitants provided that each hasa clasely settled area of 100 housing units or more.
c. Small parcels of land, normally less than one square mile in area, having apopulation density of [ ,000 inhabitants or mare per square m!le. The areas oflarge nonresidential tracts devoted to such urban land uses as railroad yards,airports, factories, parks, golf caurses, and cemeteries are excluded incomputing *he population density.
d, Other similar small areas in unincorporated territory with lower populationdensity provided that they serve
- to eliminate enclaves, or
- to close indentations inthe urbanized areas of one mile or Iess across theopen end, or
- tolinkoutlying enumeration districtsof qualifying density that are not morethan I ~ miles from the main body of the urbanized area.
V m A u t m v t m b a hv ea uv ap t v o t {u m os er evehicle, and taxi (personal use).
V occupancy: The number of persws, including driver and passenger(s) in avehicle; also includes persons who did nat complete a whole trip.
Vehicle trip: For purposes of this study, a vehicle trip is a trip made in o privatevehicle regardless of the number of persons in the vehicle.
Vehicle type: For purposes of the study, one of the 12 vehicle types used for cadingpurposes in the household motorized vehicle recard of the NTS-2 Questionnaire.
79
APPENDIX C
NPTS PUBLIC USE TAPE REQUEST
Single copies of the tapes are available through the Federal Highway Administration(FHWA).
For governmental agencies andeducatianal institutions, there no charge for tape copying.If no tapes are furnished with the request, there is a$25 charge for each t~ provided byFHWA.
For private individuals and all nongavernment or naneducatian organizations, there isa$36 charge per tape copied. [n addition, if no tapes are forwarded with the request, thereis an added charge af $25 for each tape provided byFHWA.
All tapes provided taFHWAshauld be 9-track.
Appropriate user documentation will be provided with each request.
All orders should be documentedon theattackd~ and should clearly indicate;
[. Which (orall)of the four (4) quarters afdatathat are desired.2. Name and/ar title affheindividual ororganizatiw making the request.3. Number of tapes, if any, included with the re~st (or being shipped
separately).4. Amount of payment enclosed inapplicable.
All checks or maney orders should be made payable ta Federal Highway Administration.Request and payment should be forwarded to:
Federal Highway AdministrationHighway Statistics DivisionHHP-44(NPTS)400 SeventhStreet,SWWashington, D.C. 20590
80
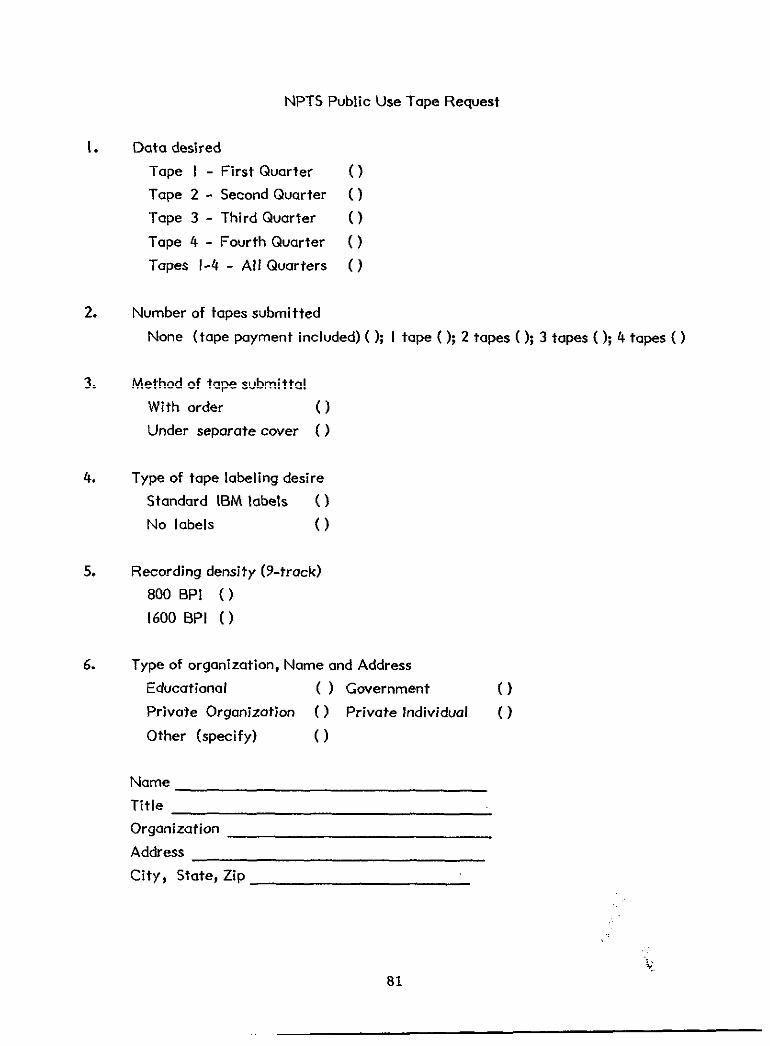
NPTS Public Use Tape Request
1. Data desired
Tape I - First Quarter ( )
Tape 2 - Second Quarter ()
Tape 3 - Third Quarter ()
Tape 4 - Fourth Q ( )
T I-4 - Q
2. Number of tapes submitted
None (tape payment included) (); I tape (); 2 tapes (); 3 tapes (); 4 tapes ( )
3. Method of tape submittal
With order ()
Under separate cover ()
4. Type of tape labeling desire
Standard lBM labels ()
No labels ()
5. Recording density [9-track)
800 BPI ( )
!600 BPI ( )
6. Type of organization, Name and Address
Educational ( ) Government ()
Private Organization () PrIvatelndividual ()
Other (specify) ()
Name
Title
Organization
Address
City, State, Zip
81
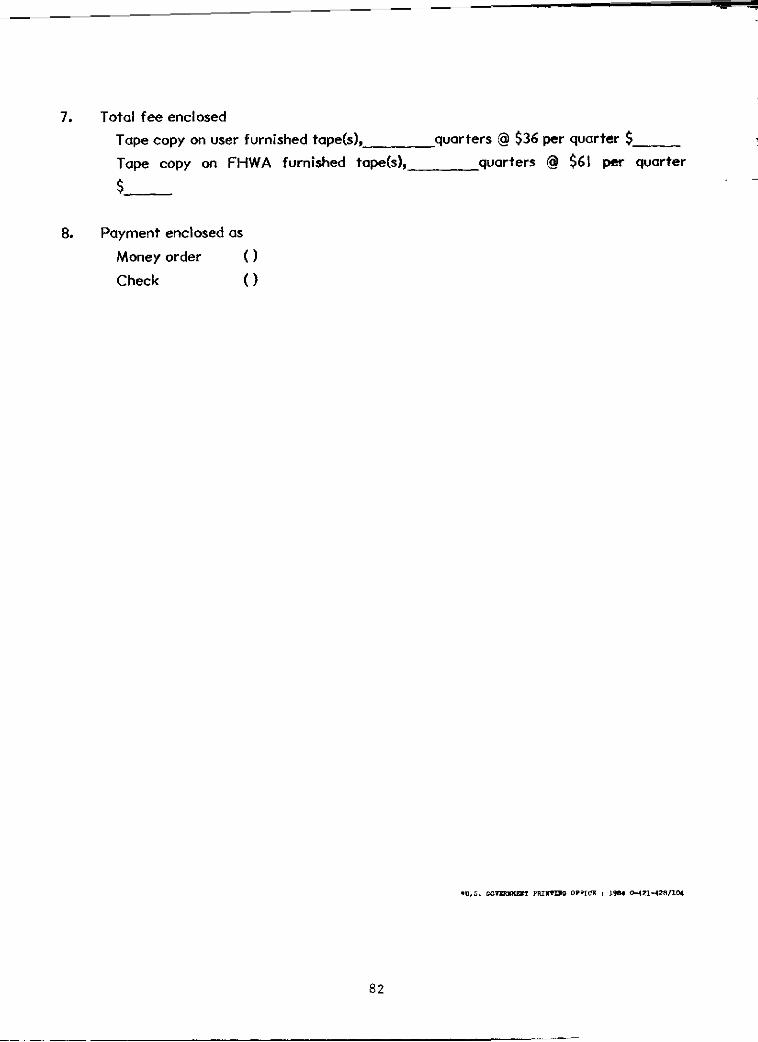
7, Total fee enclosed
Tape copy on user furnished tape(s), quarters @ $36 per quarter $
Tape copy on FHWA furnished tape(s), quarters @ $61 w quarter
$
8. Payment enclosed as
Money order ()
Check ()
8
.

~~~~o T r
F HighwayA d
4 S S SW &D 2059C
,,,,
:...
,
RETURN POSTAGE GUARANTEED
..
( .
,,,
.,
-:,.
,
....,:,:,
,
.
,
,
,, :
,,,,‘. .
,.
‘
,
,
,
,,,
!,.,:.,
.’, ,,
Pnstige a.# Fees Paid*F* HRhway
D *=
.
FOVFITHCLASS 600K’ RATE
,.
,,.
, ,.,.


