76
N5 Biology SQA Past Paper booklet 1 2019 and 2018
N5BiologySQAPastPaperbooklet1
2019and2018
*X8077502*
N5
©
NationalQualications2019
Instructions for the completion of Section 1 are given on page 02 of your question and answer booklet X807/75/01.
Record your answers on the answer grid on page 03 of your question and answer booklet.
Before leaving the examination room you must give your question and answer booklet to the Invigilator; if you do not, you may lose all the marks for this paper.
X807/75/02 BiologySection 1 — Questions
TUESDAY, 30 APRIL
1:00 PM – 3:30 PM
A/PB
page 02
SECTION 1 — 25 marks
Attempt ALL questions
1. Animal cells left in a solution with a lower water concentration than their contents
A shrink
B burst
C become turgid
D become plasmolysed.
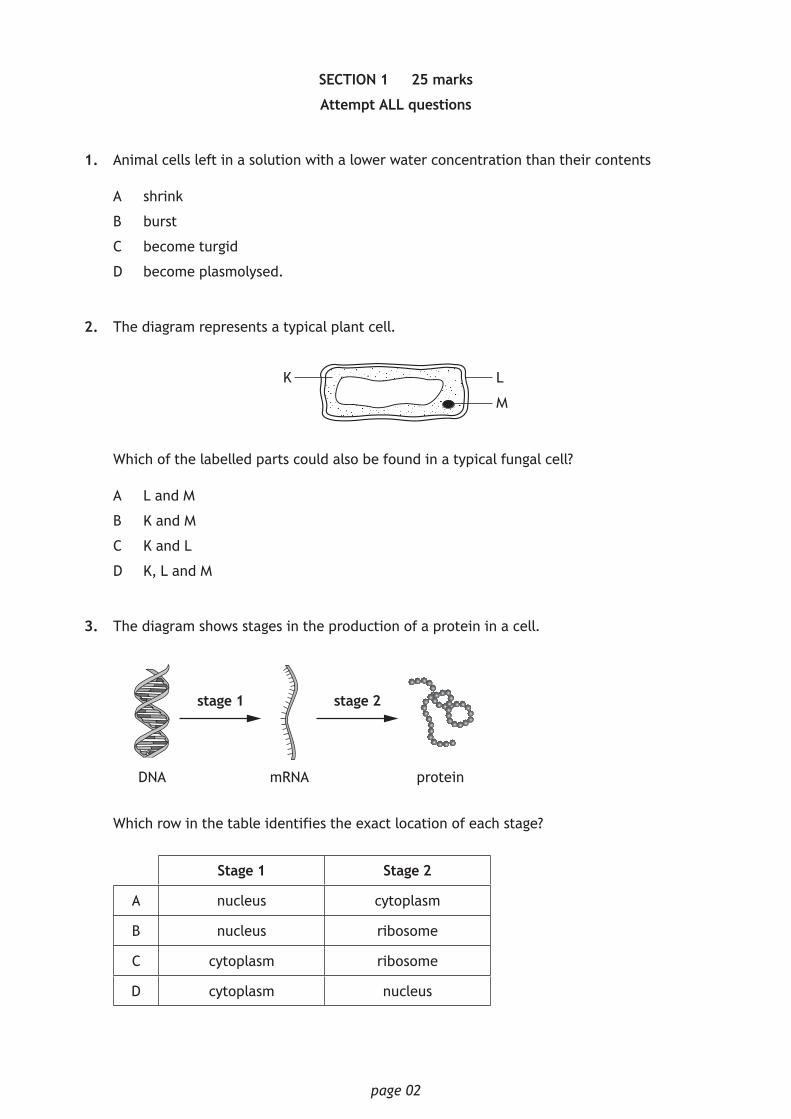
2. The diagram represents a typical plant cell.
M
K L
Which of the labelled parts could also be found in a typical fungal cell?
A L and M
B K and M
C K and L
D K, L and M
3. The diagram shows stages in the production of a protein in a cell.
proteinmRNADNA
stage 2stage 1
Which row in the table identifies the exact location of each stage?
Stage 1 Stage 2
A nucleus cytoplasm
B nucleus ribosome
C cytoplasm ribosome
D cytoplasm nucleus
page 03
4. A single strand of DNA contains 830 adenine, 929 cytosine, 774 guanine and 615 thymine bases.
How many guanine bases would be in the complementary strand?
A 615
B 774
C 830
D 929
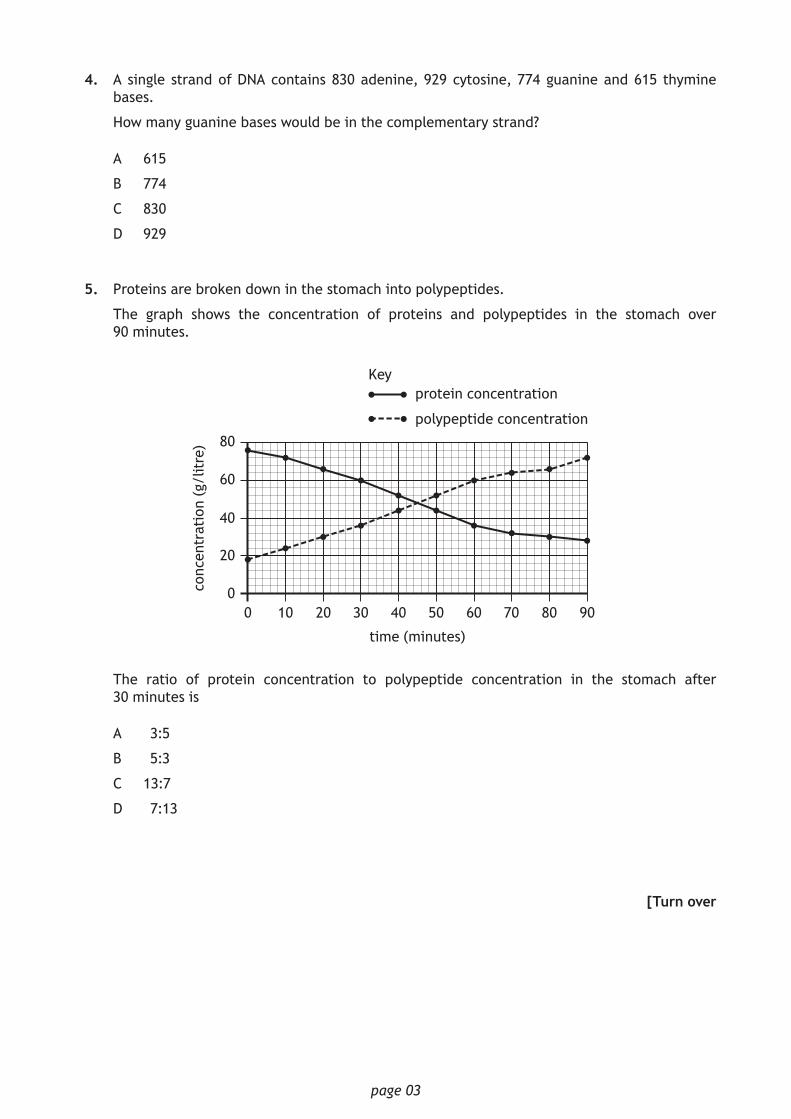
5. Proteins are broken down in the stomach into polypeptides.
The graph shows the concentration of proteins and polypeptides in the stomach over 90 minutes.
time (minutes)
90
80
70
60
50403020100
8060
40
20
0
Keyprotein concentration
polypeptide concentration
conc
entr
atio
n (g
/lit
re)
The ratio of protein concentration to polypeptide concentration in the stomach after 30 minutes is
A 3:5
B 5:3
C 13:7
D 7:13
[Turn over
page 04
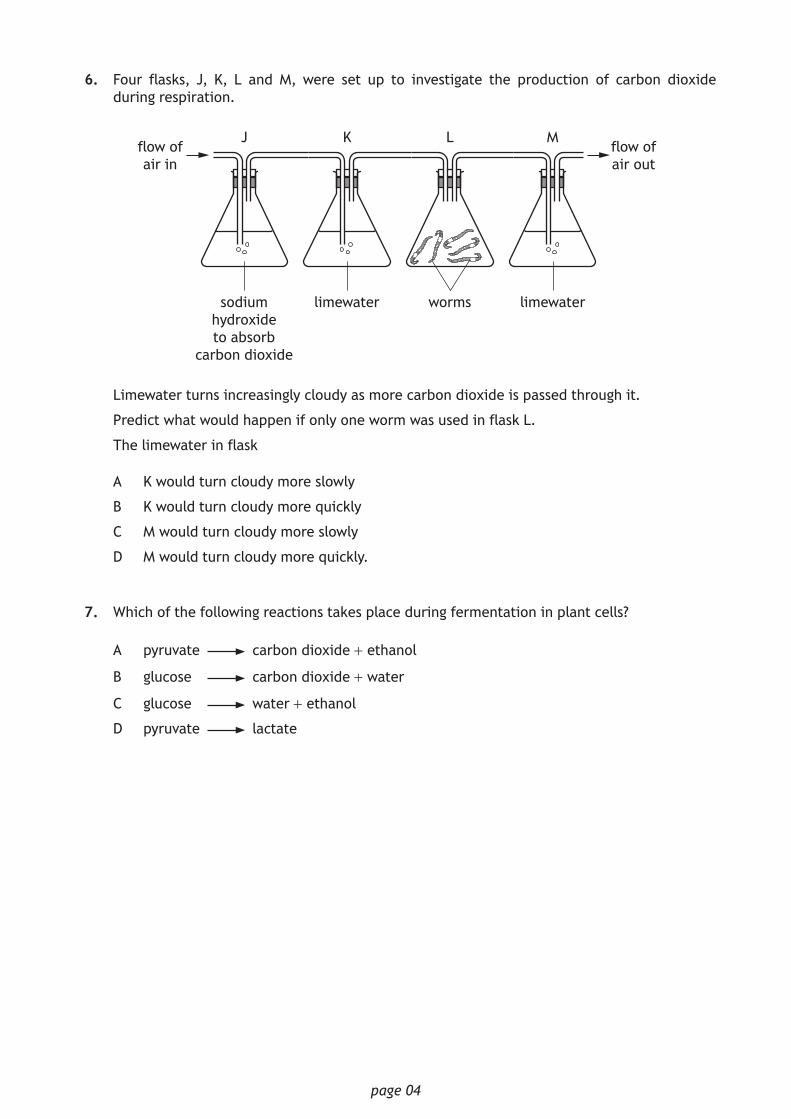
6. Four flasks, J, K, L and M, were set up to investigate the production of carbon dioxide during respiration.
MLKJ
wormssodium hydroxide to absorb
carbon dioxide
limewater limewater
flow of air out
flow of air in
Limewater turns increasingly cloudy as more carbon dioxide is passed through it.
Predict what would happen if only one worm was used in flask L.
The limewater in flask
A K would turn cloudy more slowly
B K would turn cloudy more quickly
C M would turn cloudy more slowly
D M would turn cloudy more quickly.
7. Which of the following reactions takes place during fermentation in plant cells?
A pyruvate carbon dioxide + ethanol
B glucose carbon dioxide + water
C glucose water + ethanol
D pyruvate lactate
page 05
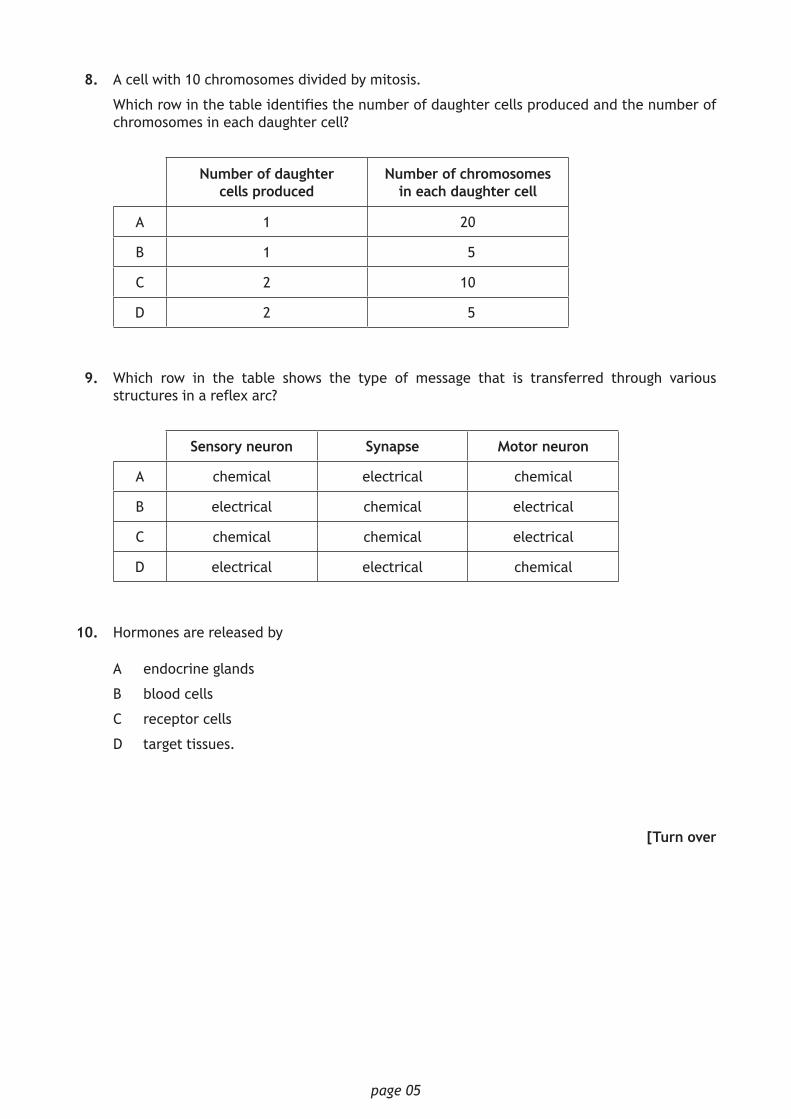
8. A cell with 10 chromosomes divided by mitosis.
Which row in the table identifies the number of daughter cells produced and the number of chromosomes in each daughter cell?
Number of daughter cells produced
Number of chromosomes in each daughter cell
A 1 20
B 1 5
C 2 10
D 2 5
9. Which row in the table shows the type of message that is transferred through various structures in a reflex arc?
Sensory neuron Synapse Motor neuron
A chemical electrical chemical
B electrical chemical electrical
C chemical chemical electrical
D electrical electrical chemical
10. Hormones are released by
A endocrine glands
B blood cells
C receptor cells
D target tissues.
[Turn over
page 06
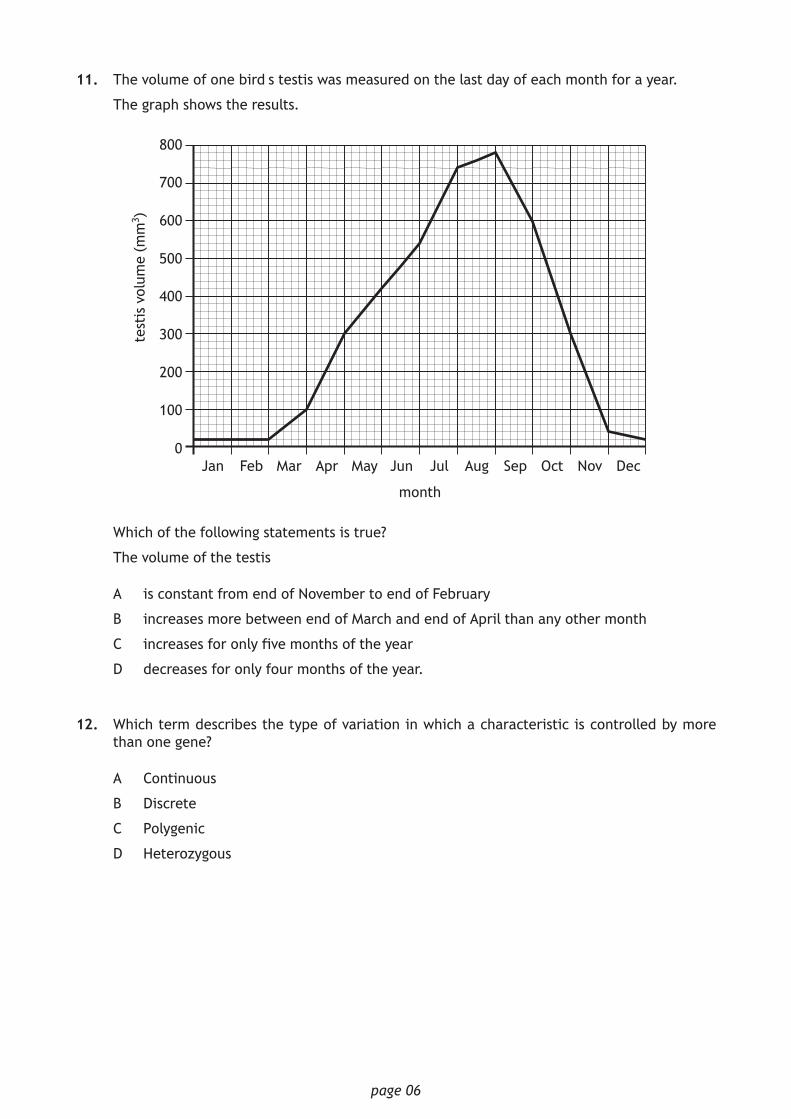
11. The volume of one bird’s testis was measured on the last day of each month for a year.
The graph shows the results.
month
test
is v
olum
e (m
m3 )
Apr May SepAugJulJunMarFebJan Nov
800
700
600
500
400
300
200
100
0Oct Dec
Which of the following statements is true?
The volume of the testis
A is constant from end of November to end of February
B increases more between end of March and end of April than any other month
C increases for only five months of the year
D decreases for only four months of the year.
12. Which term describes the type of variation in which a characteristic is controlled by more than one gene?
A Continuous
B Discrete
C Polygenic
D Heterozygous
page 07
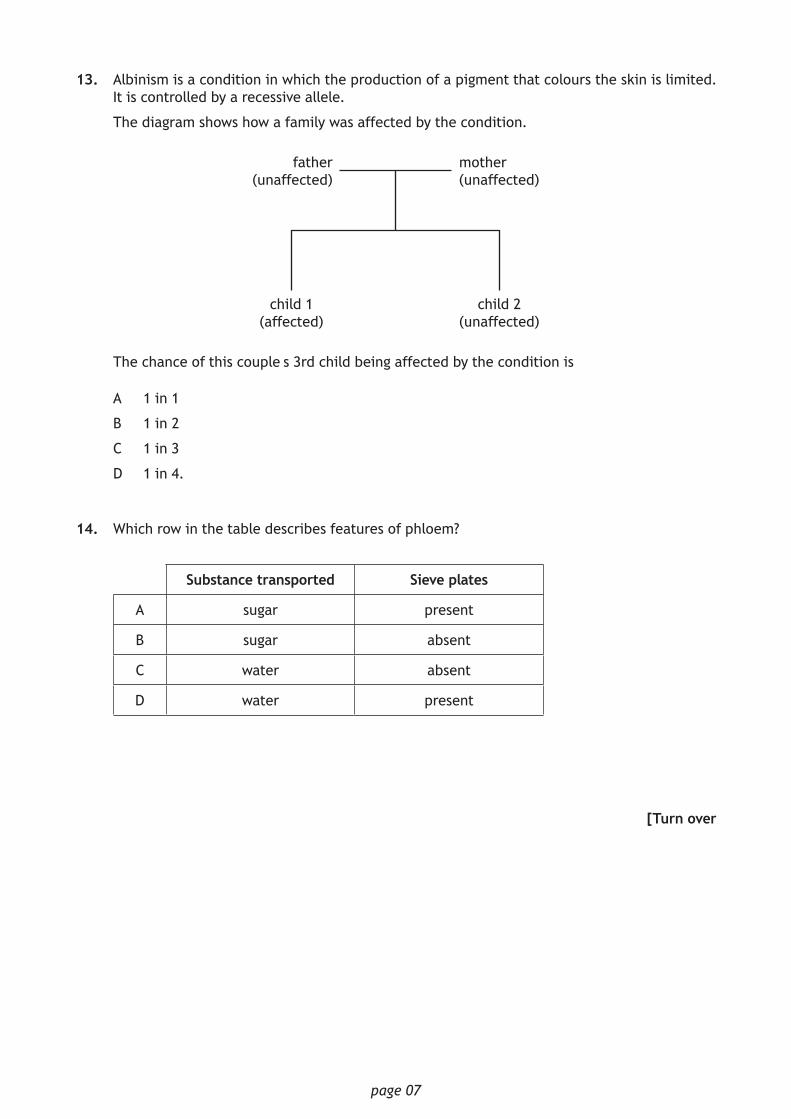
13. Albinism is a condition in which the production of a pigment that colours the skin is limited. It is controlled by a recessive allele.
The diagram shows how a family was affected by the condition.
child 2 (unaffected)
child 1 (affected)
mother (unaffected)
father (unaffected)
The chance of this couple’s 3rd child being affected by the condition is
A 1 in 1
B 1 in 2
C 1 in 3
D 1 in 4.
14. Which row in the table describes features of phloem?
Substance transported Sieve plates
A sugar present
B sugar absent
C water absent
D water present
[Turn over
page 08
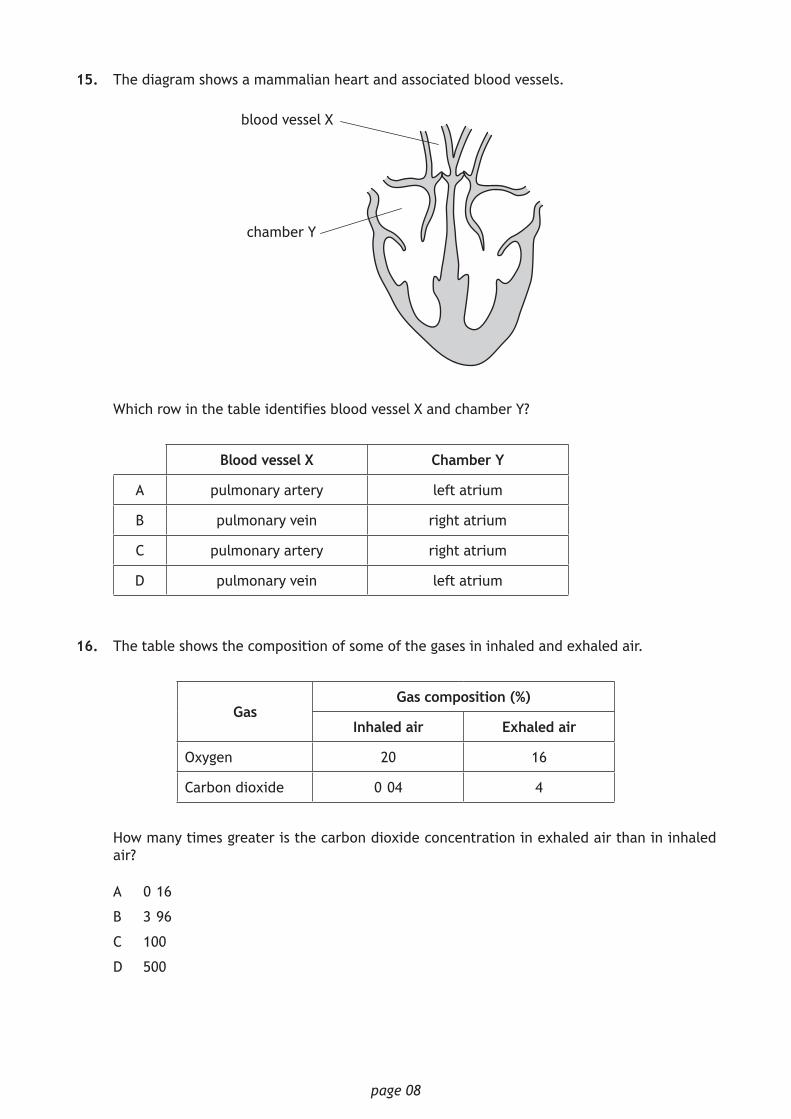
15. The diagram shows a mammalian heart and associated blood vessels.
chamber Y
blood vessel X
Which row in the table identifies blood vessel X and chamber Y?
Blood vessel X Chamber Y
A pulmonary artery left atrium
B pulmonary vein right atrium
C pulmonary artery right atrium
D pulmonary vein left atrium
16. The table shows the composition of some of the gases in inhaled and exhaled air.
GasGas composition (%)
Inhaled air Exhaled air
Oxygen 20 16
Carbon dioxide 0·04 4
How many times greater is the carbon dioxide concentration in exhaled air than in inhaled air?
A 0·16
B 3·96
C 100
D 500
page 09
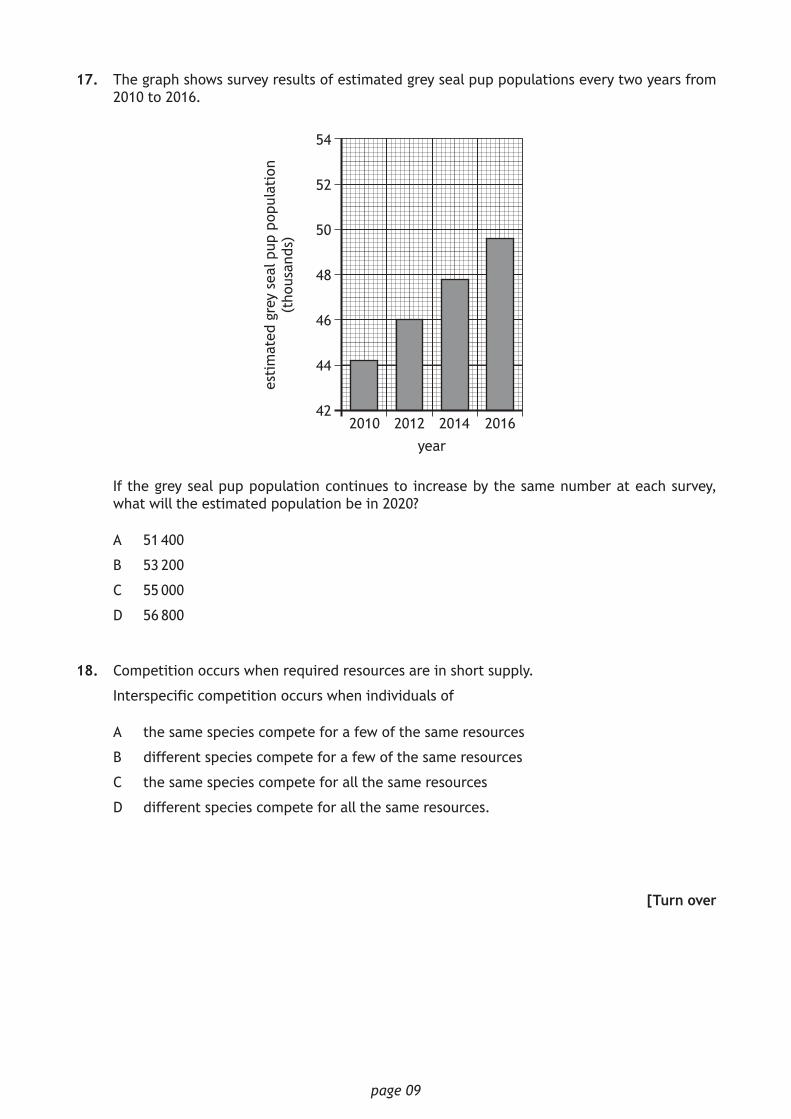
17. The graph shows survey results of estimated grey seal pup populations every two years from 2010 to 2016.
year2016201420122010
54
52
50
48
46
44
42
esti
mat
ed g
rey
seal
pup
pop
ulat
ion
(tho
usan
ds)
If the grey seal pup population continues to increase by the same number at each survey, what will the estimated population be in 2020?
A 51 400
B 53 200
C 55 000
D 56 800
18. Competition occurs when required resources are in short supply.
Interspecific competition occurs when individuals of
A the same species compete for a few of the same resources
B different species compete for a few of the same resources
C the same species compete for all the same resources
D different species compete for all the same resources.
[Turn over
page 10
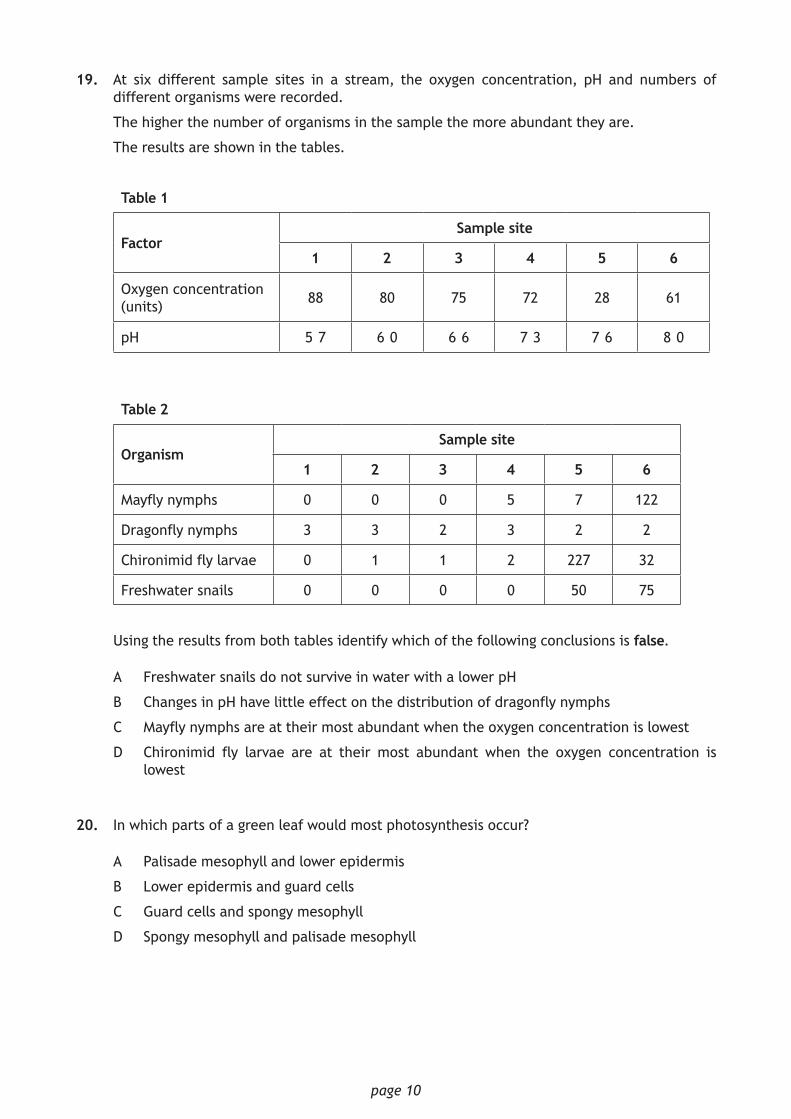
19. At six different sample sites in a stream, the oxygen concentration, pH and numbers of different organisms were recorded.
The higher the number of organisms in the sample the more abundant they are.
The results are shown in the tables.
Table 1
FactorSample site
1 2 3 4 5 6
Oxygen concentration (units) 88 80 75 72 28 61
pH 5·7 6·0 6·6 7·3 7·6 8·0
Table 2
OrganismSample site
1 2 3 4 5 6
Mayfly nymphs 0 0 0 5 7 122
Dragonfly nymphs 3 3 2 3 2 2
Chironimid fly larvae 0 1 1 2 227 32
Freshwater snails 0 0 0 0 50 75
Using the results from both tables identify which of the following conclusions is false.
A Freshwater snails do not survive in water with a lower pH
B Changes in pH have little effect on the distribution of dragonfly nymphs
C Mayfly nymphs are at their most abundant when the oxygen concentration is lowest
D Chironimid fly larvae are at their most abundant when the oxygen concentration is lowest
20. In which parts of a green leaf would most photosynthesis occur?
A Palisade mesophyll and lower epidermis
B Lower epidermis and guard cells
C Guard cells and spongy mesophyll
D Spongy mesophyll and palisade mesophyll
page 11
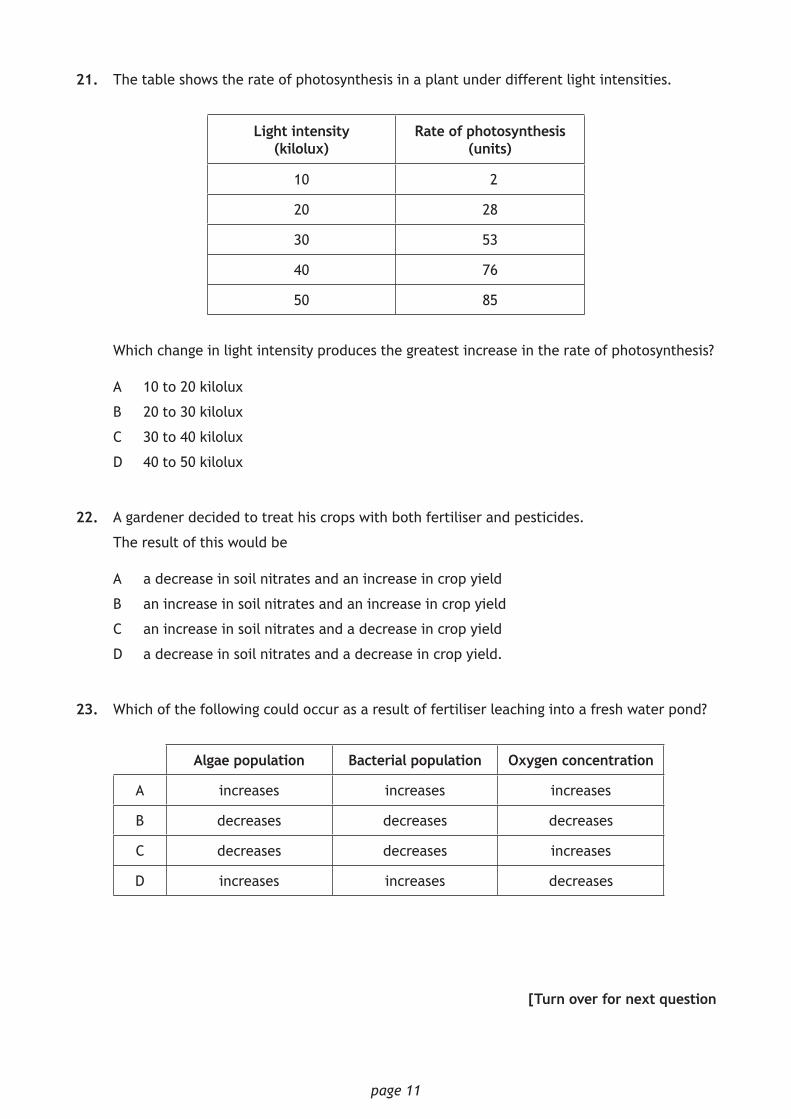
21. The table shows the rate of photosynthesis in a plant under different light intensities.
Light intensity (kilolux)
Rate of photosynthesis (units)
10 2
20 28
30 53
40 76
50 85
Which change in light intensity produces the greatest increase in the rate of photosynthesis?
A 10 to 20 kilolux
B 20 to 30 kilolux
C 30 to 40 kilolux
D 40 to 50 kilolux
22. A gardener decided to treat his crops with both fertiliser and pesticides.
The result of this would be
A a decrease in soil nitrates and an increase in crop yield
B an increase in soil nitrates and an increase in crop yield
C an increase in soil nitrates and a decrease in crop yield
D a decrease in soil nitrates and a decrease in crop yield.
23. Which of the following could occur as a result of fertiliser leaching into a fresh water pond?
Algae population Bacterial population Oxygen concentration
A increases increases increases
B decreases decreases decreases
C decreases decreases increases
D increases increases decreases
[Turn over for next question
page 12
24. For the successful biological control of whitefly in a greenhouse, it was recommended to use 50 individuals of a predator species to kill a population of 1500 whitefly.
The number of predators that would be required to kill 21 000 whitefly is
A 420
B 700
C 19 500
D 75 000.
25. Which of the following statements describe the possible effects of a mutation on the survival of an organism?
1. It has no effect
2. It gives the organism an advantage
3. It disadvantages the organism
A 1 and 2 only
B 1 and 3 only
C 2 and 3 only
D 1, 2 and 3
[END OF SECTION 1. NOW ATTEMPT THE QUESTIONS IN SECTION 2 OF YOUR QUESTION AND ANSWER BOOKLET.]
*X807750105*page 05
MARKS DO NOT WRITE IN
THIS MARGIN
SECTION 2 — 75 marks
Attempt ALL questions
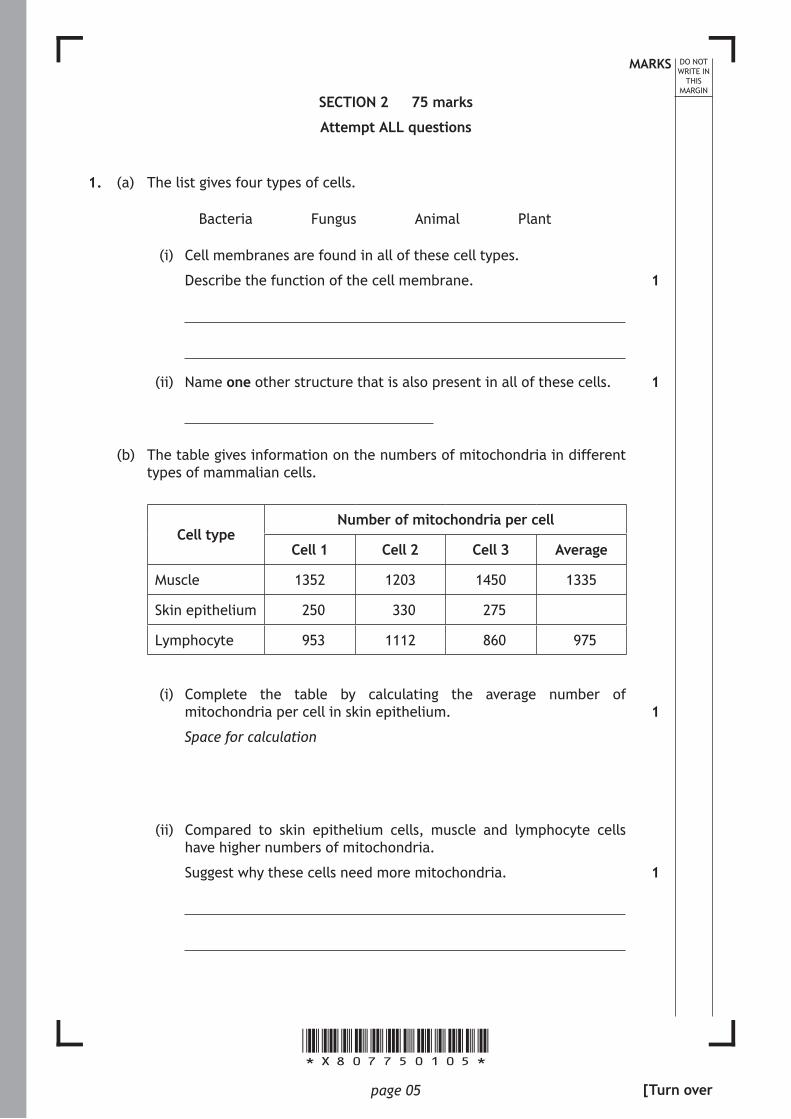
1. (a) The list gives four types of cells.
Bacteria Fungus Animal Plant
(i) Cell membranes are found in all of these cell types.
Describe the function of the cell membrane.
(ii) Name one other structure that is also present in all of these cells.
(b) The table gives information on the numbers of mitochondria in different types of mammalian cells.
Cell typeNumber of mitochondria per cell
Cell 1 Cell 2 Cell 3 Average
Muscle 1352 1203 1450 1335
Skin epithelium 250 330 275
Lymphocyte 953 1112 860 975
(i) Complete the table by calculating the average number of mitochondria per cell in skin epithelium.
Space for calculation
(ii) Compared to skin epithelium cells, muscle and lymphocyte cells have higher numbers of mitochondria.
Suggest why these cells need more mitochondria.
1
1
1
1
[Turn over
*X807750106*page 06
MARKS DO NOT WRITE IN
THIS MARGIN
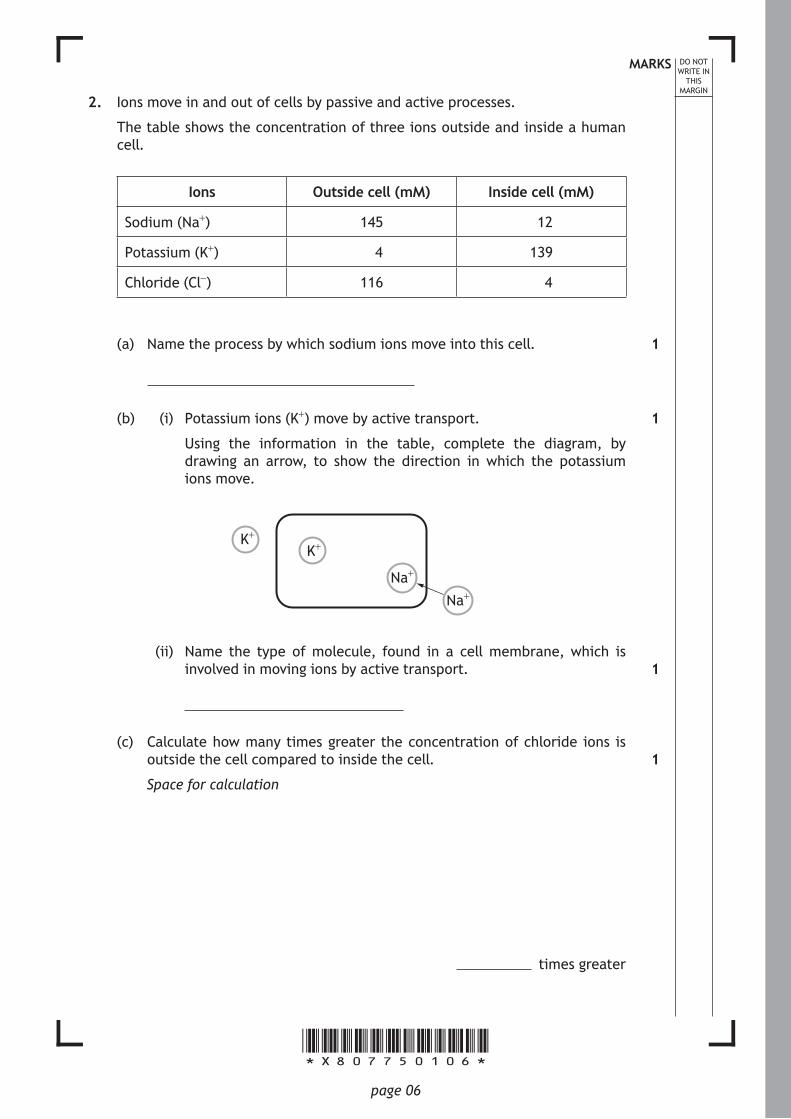
2. Ions move in and out of cells by passive and active processes.
The table shows the concentration of three ions outside and inside a human cell.
Ions Outside cell (mM) Inside cell (mM)
Sodium (Na+) 145 12
Potassium (K+) 4 139
Chloride (Cl-) 116 4
(a) Name the process by which sodium ions move into this cell.
(b) (i) Potassium ions (K+) move by active transport.
Using the information in the table, complete the diagram, by drawing an arrow, to show the direction in which the potassium ions move.
Na+Na+
K+K+
(ii) Name the type of molecule, found in a cell membrane, which is involved in moving ions by active transport.
(c) Calculate how many times greater the concentration of chloride ions is outside the cell compared to inside the cell.
Space for calculation
times greater
1
1
1
1
*X807750107*page 07
MARKS DO NOT WRITE IN
THIS MARGIN
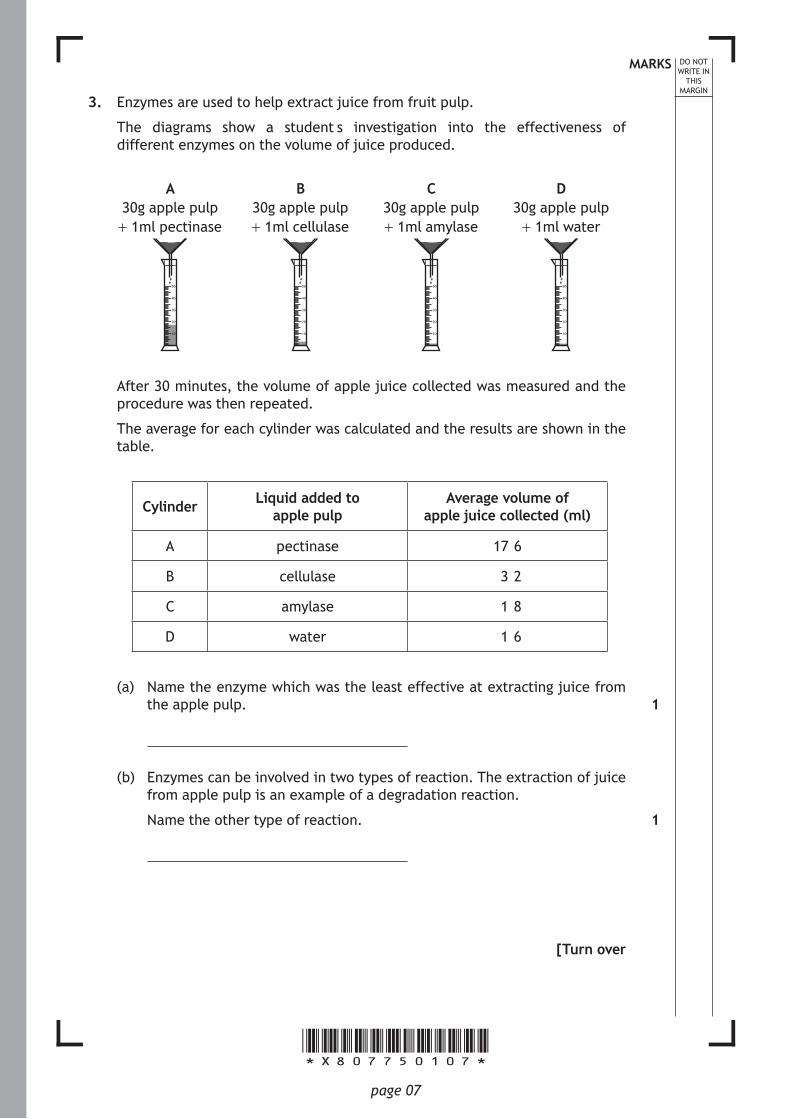
3. Enzymes are used to help extract juice from fruit pulp.
The diagrams show a student’s investigation into the effectiveness of different enzymes on the volume of juice produced.
50
40
30
20
10
50
40
30
20
10
50
40
30
20
10
50
40
30
20
10
30g apple pulp + 1ml water
30g apple pulp + 1ml amylase
30g apple pulp + 1ml cellulase
30g apple pulp + 1ml pectinase
DCBA
After 30 minutes, the volume of apple juice collected was measured and the procedure was then repeated.
The average for each cylinder was calculated and the results are shown in the table.
Cylinder Liquid added to apple pulp
Average volume of apple juice collected (ml)
A pectinase 17·6
B cellulase 3·2
C amylase 1·8
D water 1·6
(a) Name the enzyme which was the least effective at extracting juice from the apple pulp.
(b) Enzymes can be involved in two types of reaction. The extraction of juice from apple pulp is an example of a degradation reaction.
Name the other type of reaction.
[Turn over
1
1
*X807750108*page 08
MARKS DO NOT WRITE IN
THIS MARGIN
3. (continued)
(c) Cellulase is an enzyme that speeds up the breakdown of a component of the plant cell wall.
Name this component.
(d) All of the enzymes broke down at least some part of the apple pulp to produce apple juice.
What name is given to the substance that an enzyme breaks down?
1
1
*X807750109*page 09
MARKS DO NOT WRITE IN
THIS MARGIN
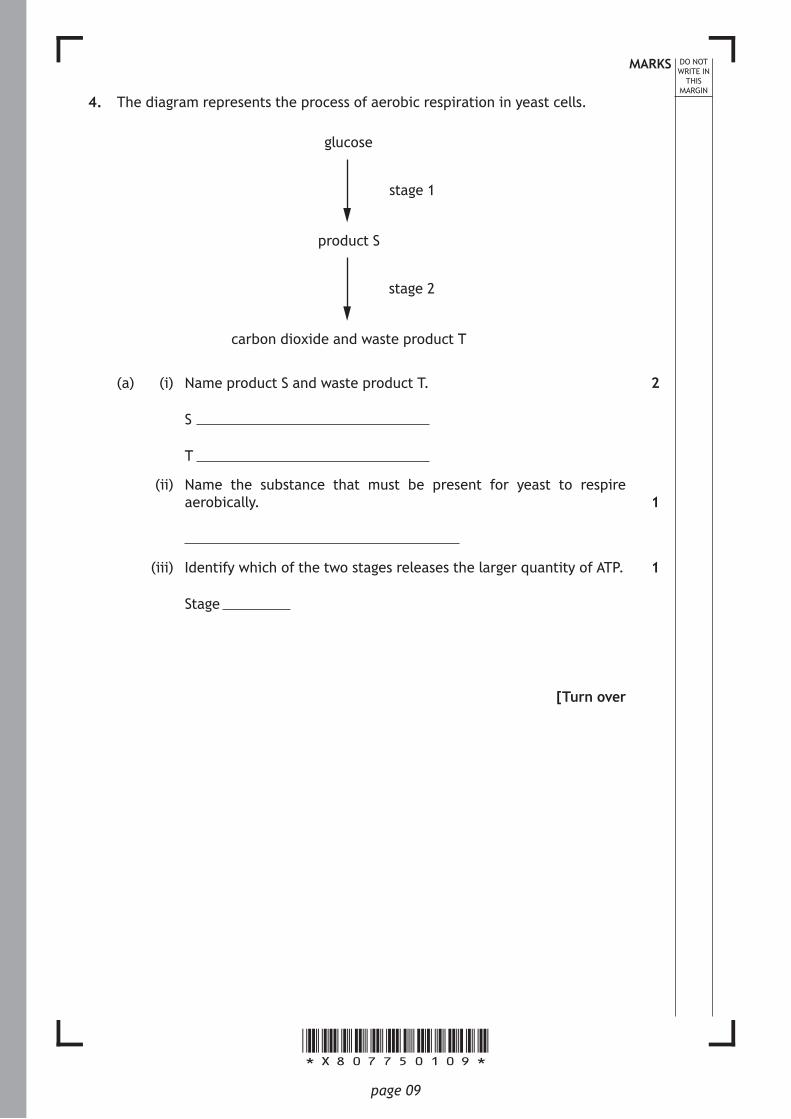
4. The diagram represents the process of aerobic respiration in yeast cells.
stage 2
stage 1
carbon dioxide and waste product T
product S
glucose
(a) (i) Name product S and waste product T.
S
T
(ii) Name the substance that must be present for yeast to respire aerobically.
(iii) Identify which of the two stages releases the larger quantity of ATP.
Stage
[Turn over
2
1
1
*X807750110*page 10
MARKS DO NOT WRITE IN
THIS MARGIN
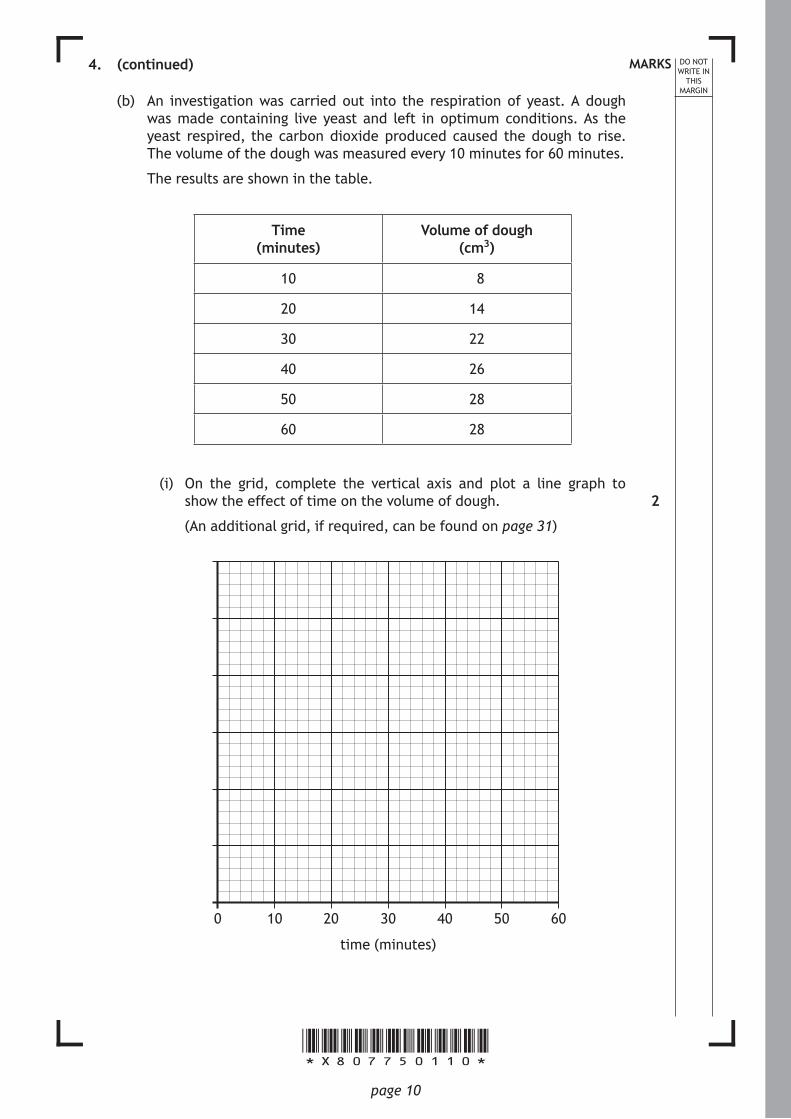
4. (continued)
(b) An investigation was carried out into the respiration of yeast. A dough was made containing live yeast and left in optimum conditions. As the yeast respired, the carbon dioxide produced caused the dough to rise. The volume of the dough was measured every 10 minutes for 60 minutes.
The results are shown in the table.
Time (minutes)
Volume of dough (cm3)
10 8
20 14
30 22
40 26
50 28
60 28
(i) On the grid, complete the vertical axis and plot a line graph to show the effect of time on the volume of dough.
(An additional grid, if required, can be found on page 31)
6050403020100
time (minutes)
2

*X807750111*page 11
MARKS DO NOT WRITE IN
THIS MARGIN
4. (b) (continued)
(ii) Predict the volume of dough at 50 minutes if the experiment was carried out at a lower temperature.
Give a reason for your answer.
Prediction cm3
Reason
[Turn over
1
1
*X807750112*page 12
MARKS DO NOT WRITE IN
THIS MARGIN
5. New cells are produced by mitosis throughout life.
(a) Name the cells, found in the early stages of an embryo’s development, which have the potential to develop into specialised cells.
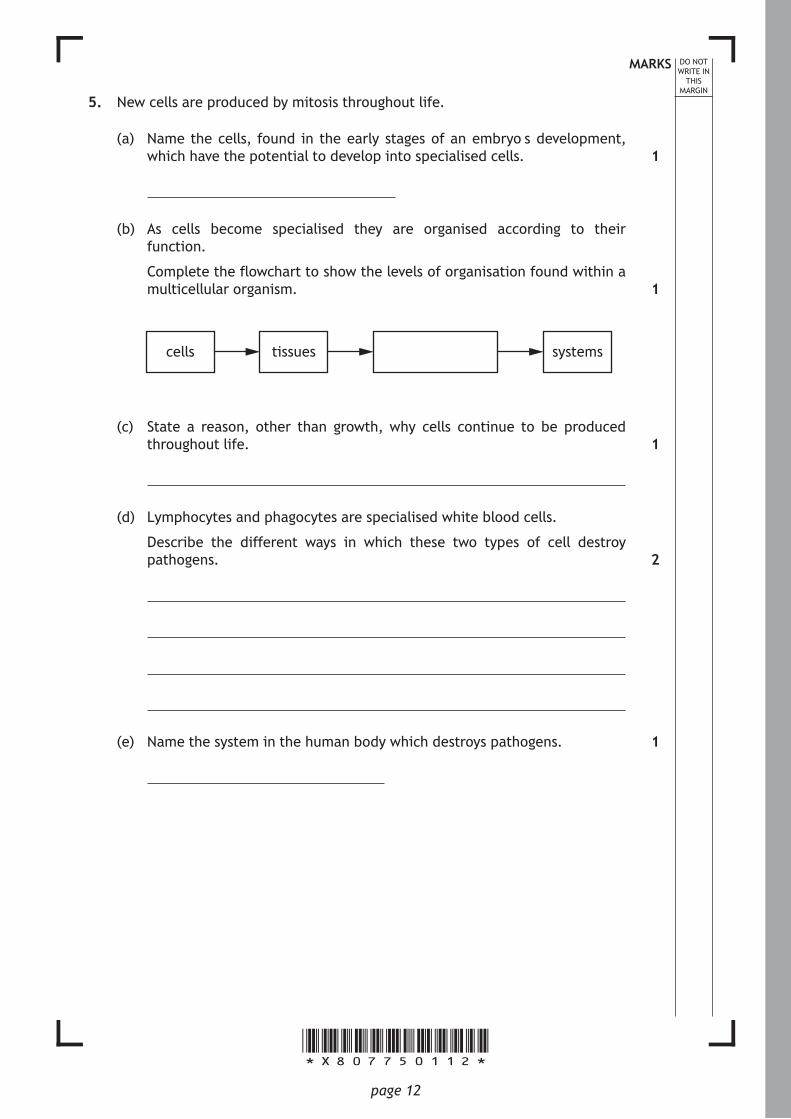
(b) As cells become specialised they are organised according to their function.
Complete the flowchart to show the levels of organisation found within a multicellular organism.
systemstissuescells
(c) State a reason, other than growth, why cells continue to be produced throughout life.
(d) Lymphocytes and phagocytes are specialised white blood cells.
Describe the different ways in which these two types of cell destroy pathogens.
(e) Name the system in the human body which destroys pathogens.
1
1
1
2
1
*X807750113*page 13
MARKS DO NOT WRITE IN
THIS MARGIN
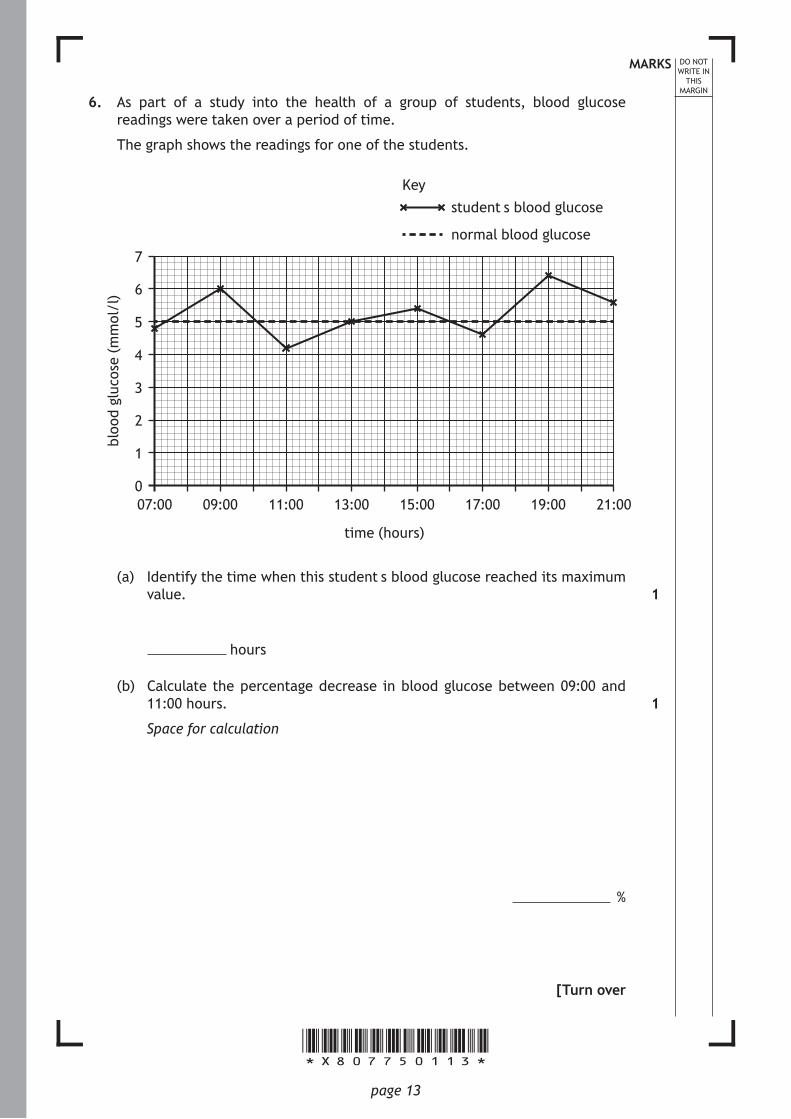
6. As part of a study into the health of a group of students, blood glucose readings were taken over a period of time.
The graph shows the readings for one of the students.
time (hours)
student’s blood glucoseKey
normal blood glucose7
4
3
2
1
5
6
bloo
d gl
ucos
e (m
mol
/l)
021:0019:0017:0015:0013:0011:0009:0007:00
(a) Identify the time when this student’s blood glucose reached its maximum value.
hours
(b) Calculate the percentage decrease in blood glucose between 09:00 and 11:00 hours.
Space for calculation
%
[Turn over
1
1
*X807750114*page 14
MARKS DO NOT WRITE IN
THIS MARGIN
6. (continued)
(c) By 13:00 hours the blood glucose level had returned to normal from its lowest point.
Describe how blood glucose is returned from low to normal levels in the human body. 4
*X807750115*page 15
MARKS DO NOT WRITE IN
THIS MARGIN
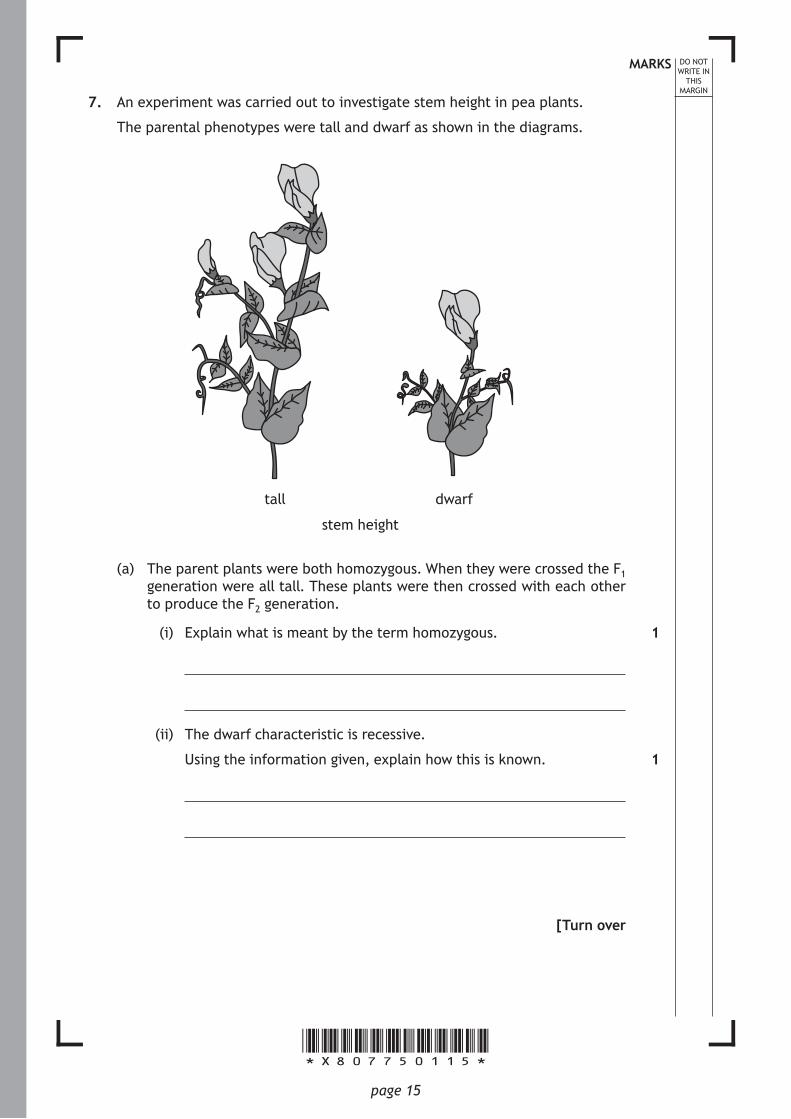
7. An experiment was carried out to investigate stem height in pea plants.
The parental phenotypes were tall and dwarf as shown in the diagrams.
stem height
dwarftall
(a) The parent plants were both homozygous. When they were crossed the F1 generation were all tall. These plants were then crossed with each other to produce the F2 generation.
(i) Explain what is meant by the term homozygous.
(ii) The dwarf characteristic is recessive.
Using the information given, explain how this is known.
[Turn over
1
1
*X807750116*page 16
MARKS DO NOT WRITE IN
THIS MARGIN
7. (continued)
(b) (i) The expected ratio in the F2 generation was 3 tall to 1 dwarf.
Calculate the expected number of tall plants if there were 144 plants produced in this generation.
Space for calculation
tall plants
(ii) The results obtained in the F2 generation differed from the expected results.
The actual results were 90 tall and 36 dwarf plants.
Calculate the simplest whole number ratio for these results.
Space for calculation
: tall dwarf
1
1
*X807750117*page 17
MARKS DO NOT WRITE IN
THIS MARGIN
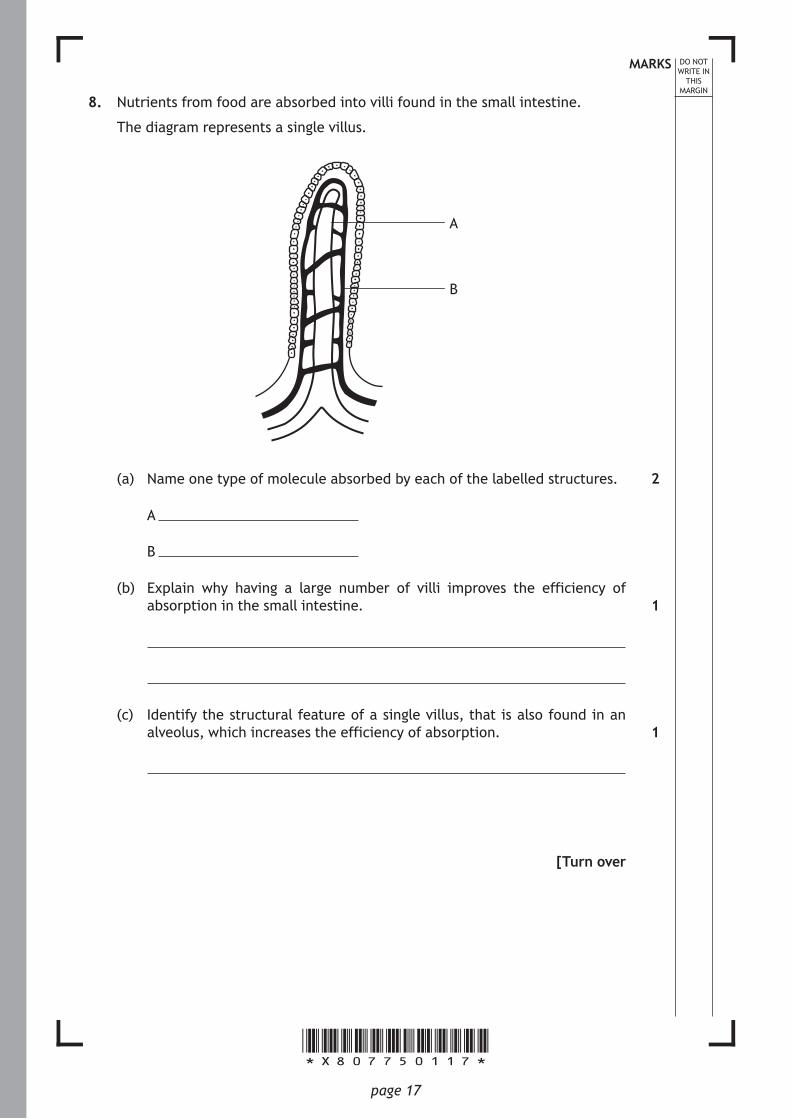
8. Nutrients from food are absorbed into villi found in the small intestine.
The diagram represents a single villus.
A
B
(a) Name one type of molecule absorbed by each of the labelled structures.
A
B
(b) Explain why having a large number of villi improves the efficiency of absorption in the small intestine.
(c) Identify the structural feature of a single villus, that is also found in an alveolus, which increases the efficiency of absorption.
[Turn over
2
1
1
*X807750118*page 18
MARKS DO NOT WRITE IN
THIS MARGIN
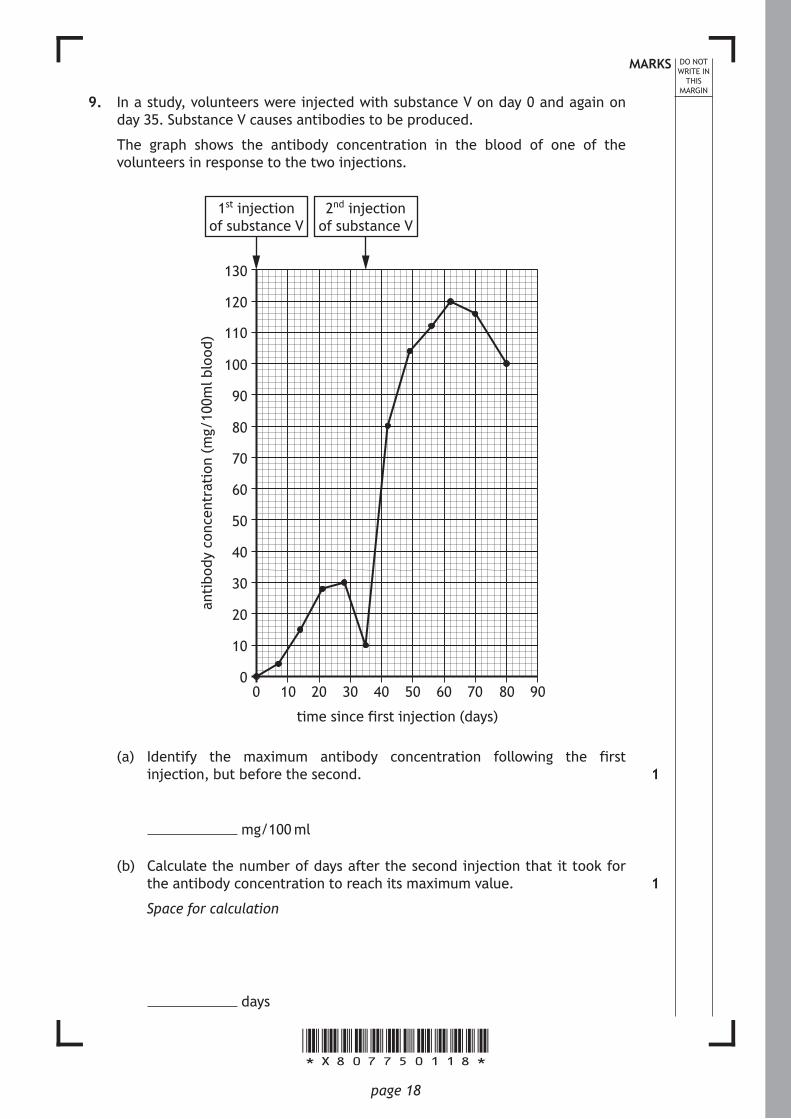
9. In a study, volunteers were injected with substance V on day 0 and again on day 35. Substance V causes antibodies to be produced.
The graph shows the antibody concentration in the blood of one of the volunteers in response to the two injections.
2nd injection of substance V
1st injection of substance V
anti
body
con
cent
rati
on (m
g/10
0ml b
lood
)
time since first injection (days)
9080706050403020100
130
120
110
100
90
80
70
60
50
40
30
20
10
0
(a) Identify the maximum antibody concentration following the first injection, but before the second.
mg/100 ml
(b) Calculate the number of days after the second injection that it took for the antibody concentration to reach its maximum value.
Space for calculation
days
1
1
*X807750119*page 19
MARKS DO NOT WRITE IN
THIS MARGIN
9. (continued)
(c) The second injection caused a higher concentration of antibody to be produced than the first.
Give two other differences in the antibody production in response to the two injections.
1
2
(d) If the trend continues as shown in the graph, predict the antibody concentration on day 90.
Space for calculation
mg/100 ml
[Turn over
2
1
*X807750120*page 20
MARKS DO NOT WRITE IN
THIS MARGIN
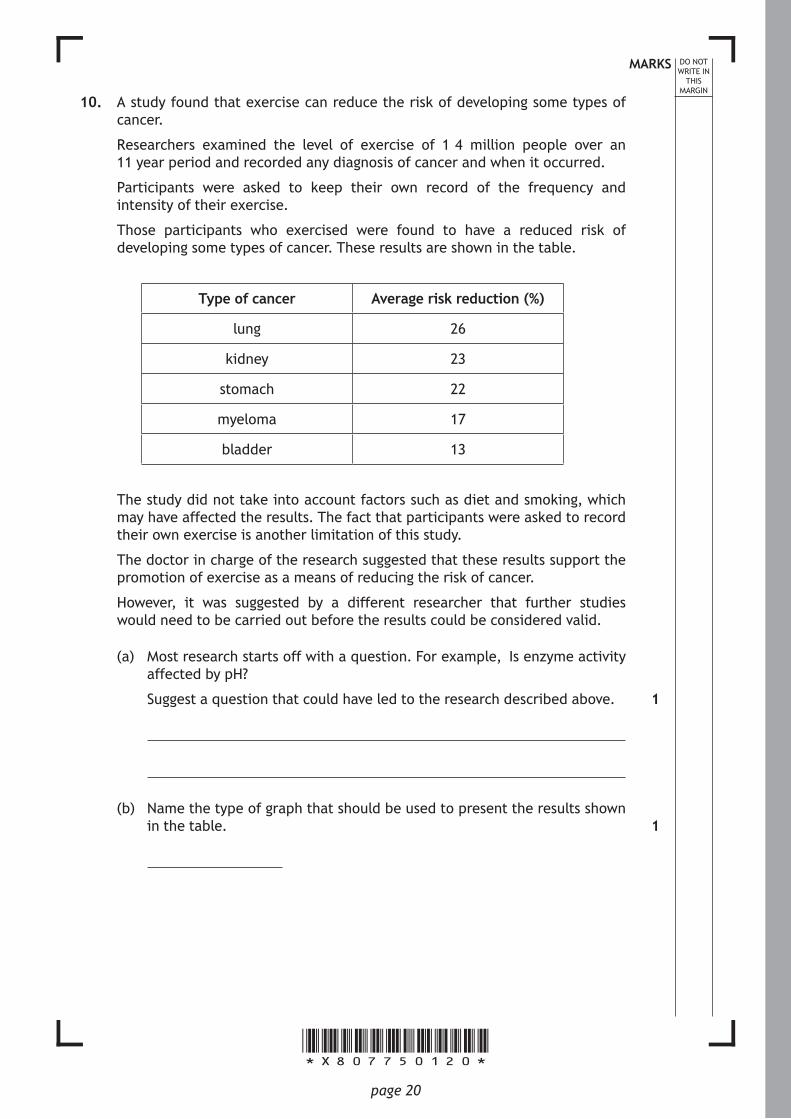
10. A study found that exercise can reduce the risk of developing some types of cancer.
Researchers examined the level of exercise of 1·4 million people over an 11 year period and recorded any diagnosis of cancer and when it occurred.
Participants were asked to keep their own record of the frequency and intensity of their exercise.
Those participants who exercised were found to have a reduced risk of developing some types of cancer. These results are shown in the table.
Type of cancer Average risk reduction (%)
lung 26
kidney 23
stomach 22
myeloma 17
bladder 13
The study did not take into account factors such as diet and smoking, which may have affected the results. The fact that participants were asked to record their own exercise is another limitation of this study.
The doctor in charge of the research suggested that these results support the promotion of exercise as a means of reducing the risk of cancer.
However, it was suggested by a different researcher that further studies would need to be carried out before the results could be considered valid.
(a) Most research starts off with a question. For example, ‘Is enzyme activity affected by pH?’
Suggest a question that could have led to the research described above.
(b) Name the type of graph that should be used to present the results shown in the table.
1
1
*X807750121*page 21
MARKS DO NOT WRITE IN
THIS MARGIN
10. (continued)
(c) Suggest one reason why the participants recording their own exercise is described as a limitation.
(d) Three factors that could affect the results are age, duration of exercise and type of exercise.
Choose one of these factors.
Describe how the study would be carried out to take the chosen factor into account and improve the validity of the results.
Factor
Description
[Turn over
1
1
*X807750122*page 22
MARKS DO NOT WRITE IN
THIS MARGIN
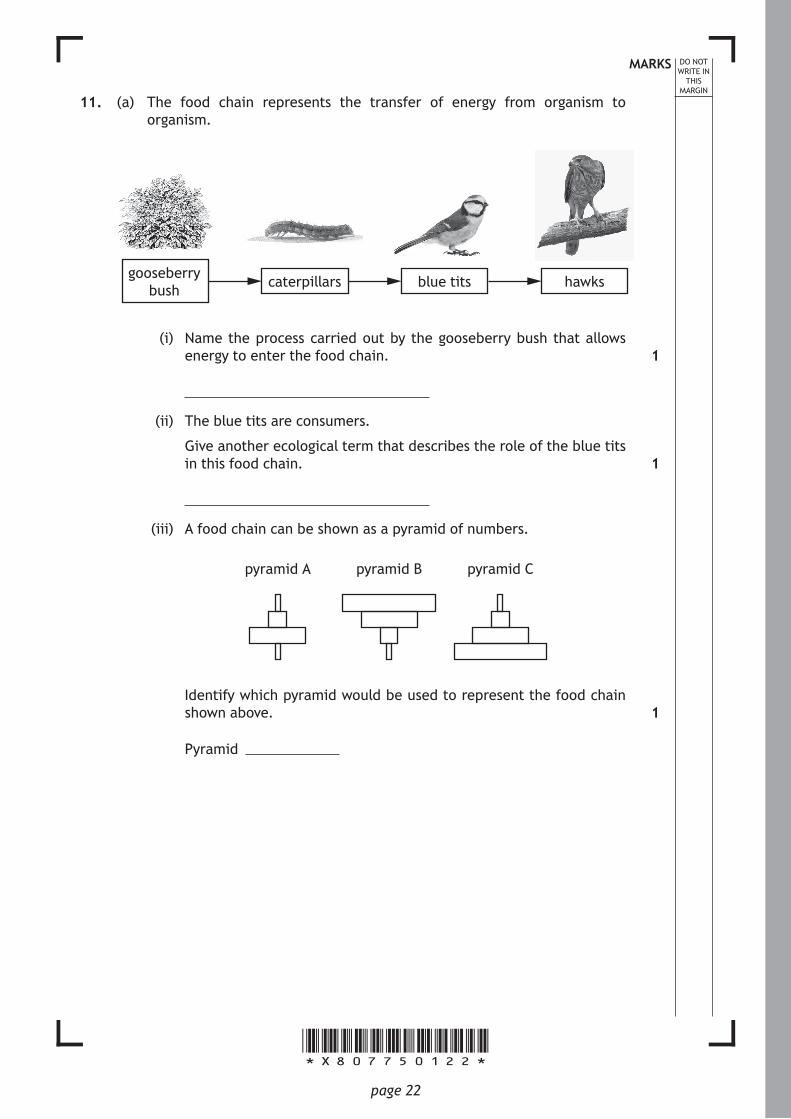
11. (a) The food chain represents the transfer of energy from organism to organism.
hawksgooseberry bush caterpillars blue tits
(i) Name the process carried out by the gooseberry bush that allows energy to enter the food chain.
(ii) The blue tits are consumers.
Give another ecological term that describes the role of the blue tits in this food chain.
(iii) A food chain can be shown as a pyramid of numbers.
pyramid Cpyramid Bpyramid A
Identify which pyramid would be used to represent the food chain shown above.
Pyramid
1
1
1
*X807750123*page 23
MARKS DO NOT WRITE IN
THIS MARGIN
11. (continued)
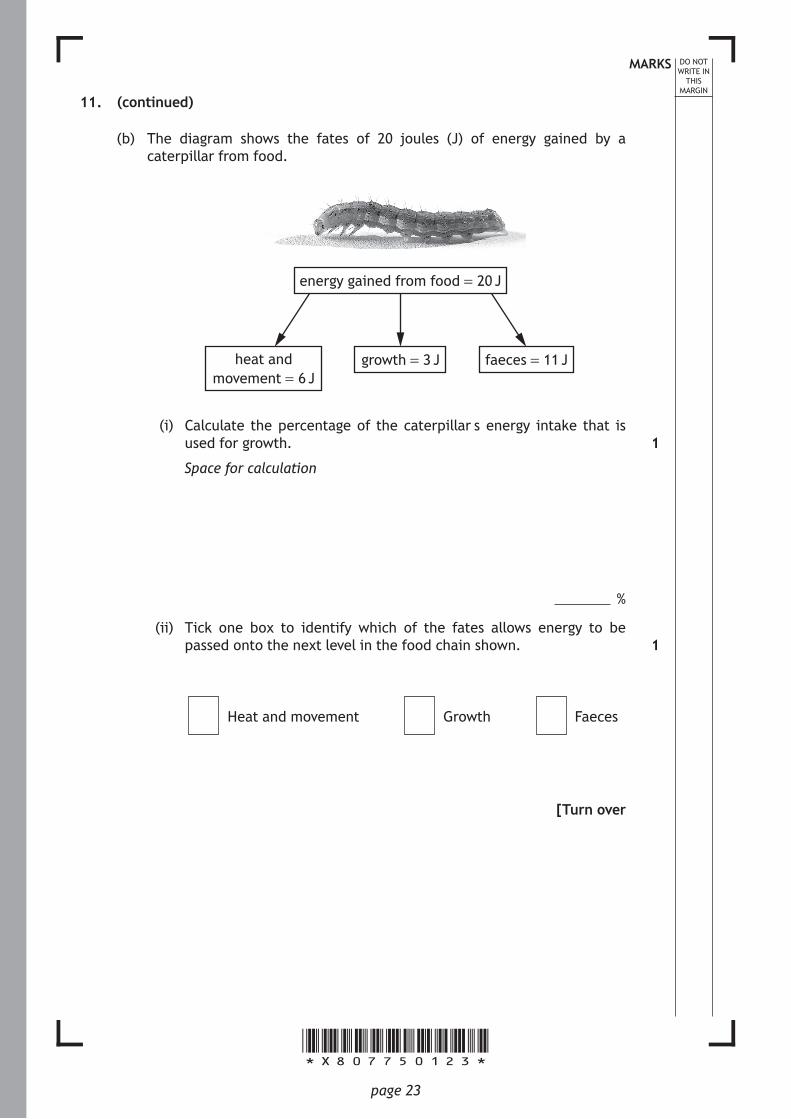
(b) The diagram shows the fates of 20 joules (J) of energy gained by a caterpillar from food.
faeces = 11 Jheat and movement = 6 J
growth = 3 J
energy gained from food = 20 J
(i) Calculate the percentage of the caterpillar’s energy intake that is used for growth.
Space for calculation
%
(ii) Tick one box to identify which of the fates allows energy to be passed onto the next level in the food chain shown.
Heat and movement
Growth
Faeces
[Turn over
1
1
*X807750124*page 24
MARKS DO NOT WRITE IN
THIS MARGIN
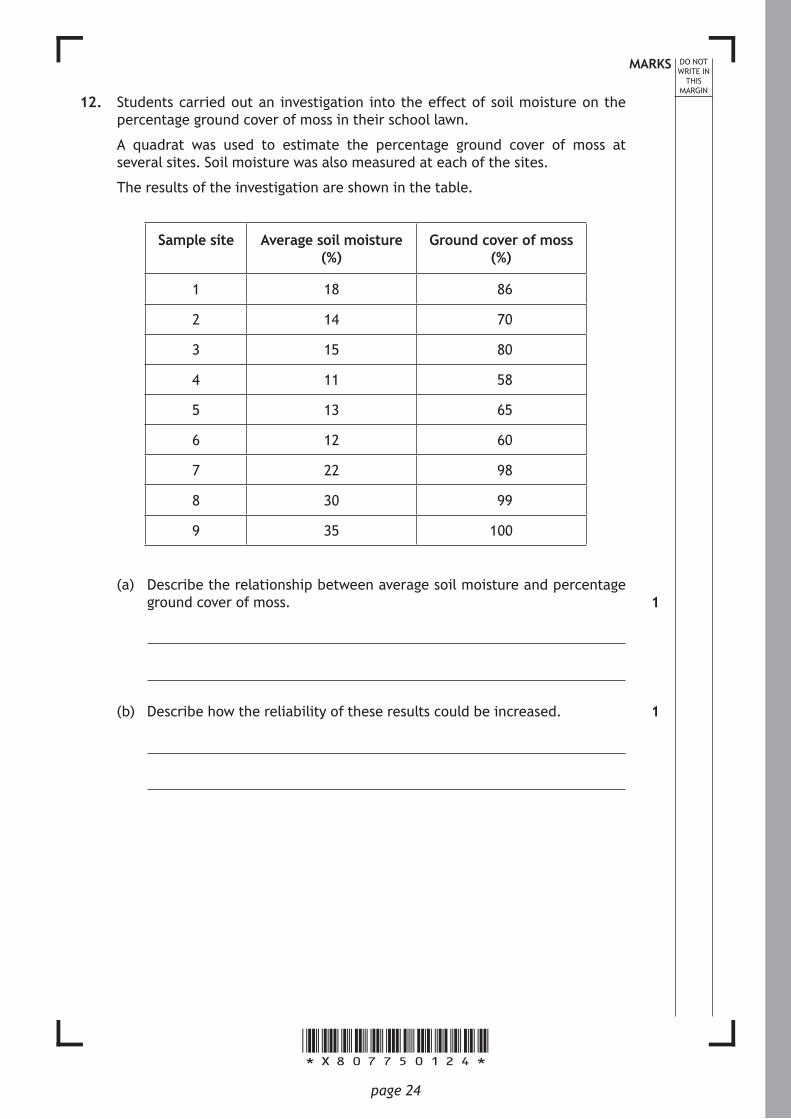
12. Students carried out an investigation into the effect of soil moisture on the percentage ground cover of moss in their school lawn.
A quadrat was used to estimate the percentage ground cover of moss at several sites. Soil moisture was also measured at each of the sites.
The results of the investigation are shown in the table.
Sample site Average soil moisture (%)
Ground cover of moss (%)
1 18 86
2 14 70
3 15 80
4 11 58
5 13 65
6 12 60
7 22 98
8 30 99
9 35 100
(a) Describe the relationship between average soil moisture and percentage ground cover of moss.
(b) Describe how the reliability of these results could be increased.
1
1
*X807750125*page 25
MARKS DO NOT WRITE IN
THIS MARGIN
12. (continued)
(c) The students also used a soil thermometer to gather data on soil temperature at each of the sample sites.
(i) Describe what the students should have done each time they used the soil thermometer, to ensure valid results.
(ii) Soil moisture and temperature are examples of abiotic factors.
Name one other abiotic factor that can affect plant growth.
(d) (i) The students observed a species of lichen growing on some of the damper parts of the lawn.
Lichens are indicator species.
State what is meant by the term ‘indicator species’.
(ii) Identify the sample site that would be least likely to contain this lichen.
Sample site number
[Turn over
1
1
1
1
*X807750126*page 26
MARKS DO NOT WRITE IN
THIS MARGIN
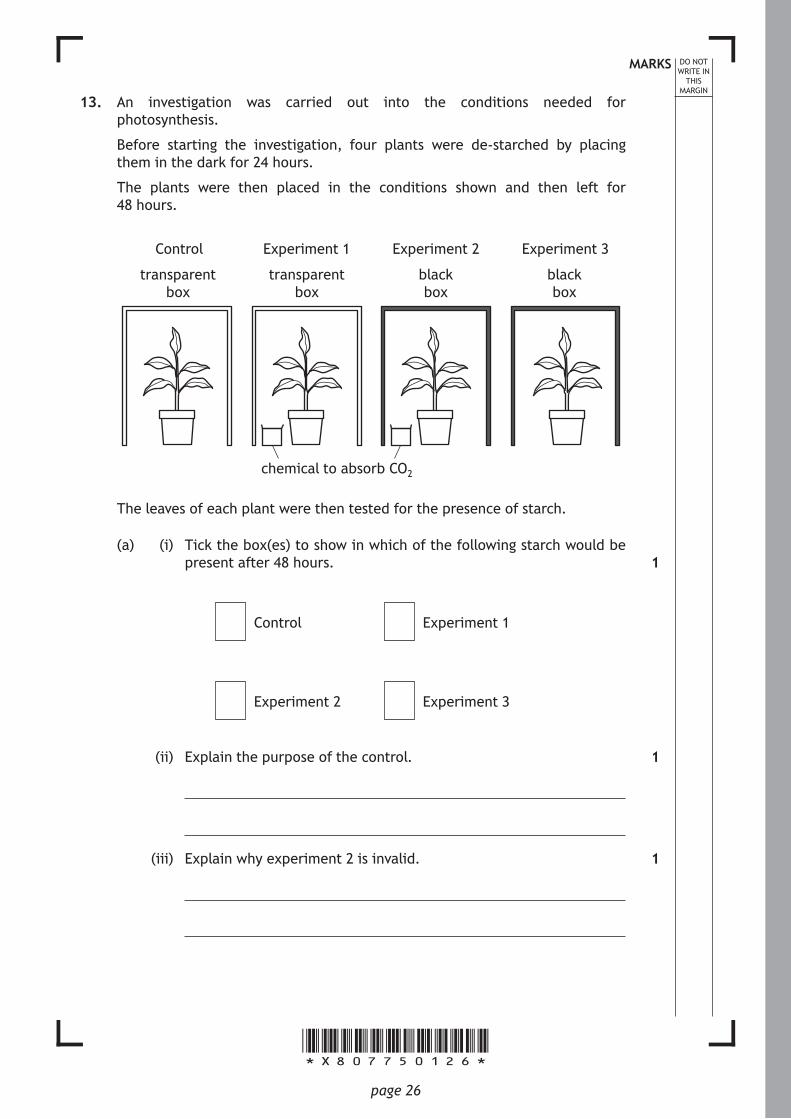
13. An investigation was carried out into the conditions needed for photosynthesis.
Before starting the investigation, four plants were de-starched by placing them in the dark for 24 hours.
The plants were then placed in the conditions shown and then left for 48 hours.
chemical to absorb CO2
black box
black box
transparent box
Experiment 3Experiment 2Experiment 1Control
transparent box
The leaves of each plant were then tested for the presence of starch.
(a) (i) Tick the box(es) to show in which of the following starch would be present after 48 hours.
Control Experiment 1
Experiment 2 Experiment 3
(ii) Explain the purpose of the control.
(iii) Explain why experiment 2 is invalid.
1
1
1
*X807750127*page 27
MARKS DO NOT WRITE IN
THIS MARGIN
13. (a) (continued)
(iv) State the factor that is being investigated in experiment 3.
(b) Name the product of carbon fixation that is converted to starch.
[Turn over
1
1
*X807750128*page 28
MARKS DO NOT WRITE IN
THIS MARGIN
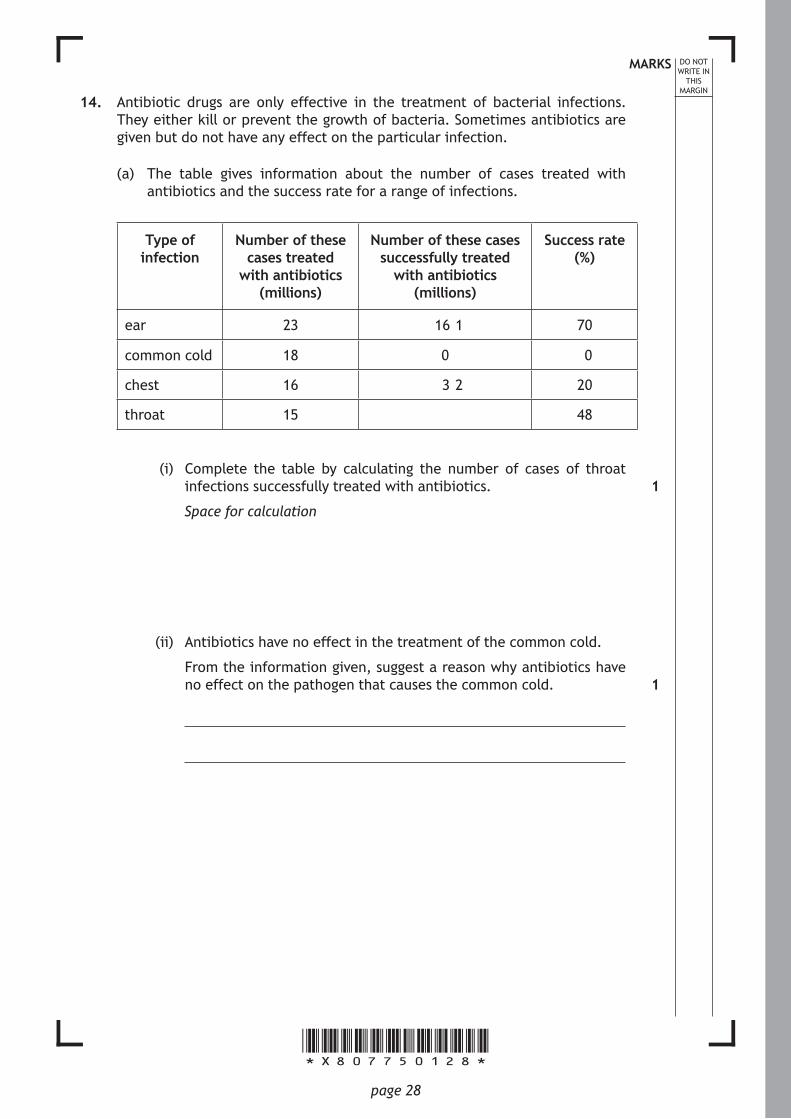
14. Antibiotic drugs are only effective in the treatment of bacterial infections. They either kill or prevent the growth of bacteria. Sometimes antibiotics are given but do not have any effect on the particular infection.
(a) The table gives information about the number of cases treated with antibiotics and the success rate for a range of infections.
Type of infection
Number of these cases treated
with antibiotics (millions)
Number of these cases successfully treated
with antibiotics (millions)
Success rate (%)
ear 23 16·1 70
common cold 18 0 0
chest 16 3·2 20
throat 15 48
(i) Complete the table by calculating the number of cases of throat infections successfully treated with antibiotics.
Space for calculation
(ii) Antibiotics have no effect in the treatment of the common cold.
From the information given, suggest a reason why antibiotics have no effect on the pathogen that causes the common cold.
1
1
*X807750129*page 29
MARKS DO NOT WRITE IN
THIS MARGIN
14. (continued)
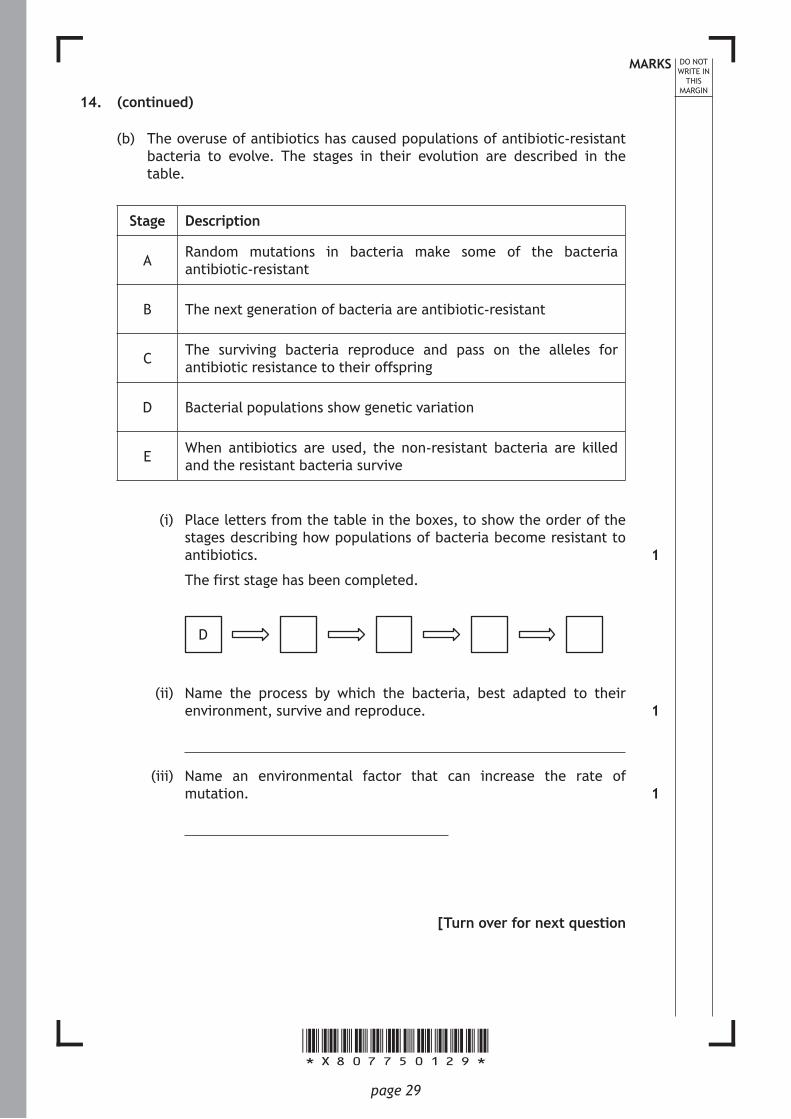
(b) The overuse of antibiotics has caused populations of antibiotic-resistant bacteria to evolve. The stages in their evolution are described in the table.
Stage Description
A Random mutations in bacteria make some of the bacteria antibiotic-resistant
B The next generation of bacteria are antibiotic-resistant
C The surviving bacteria reproduce and pass on the alleles for antibiotic resistance to their offspring
D Bacterial populations show genetic variation
E When antibiotics are used, the non-resistant bacteria are killed and the resistant bacteria survive
(i) Place letters from the table in the boxes, to show the order of the stages describing how populations of bacteria become resistant to antibiotics.
The first stage has been completed.
D
(ii) Name the process by which the bacteria, best adapted to their environment, survive and reproduce.
(iii) Name an environmental factor that can increase the rate of mutation.
[Turn over for next question
1
1
1
*X807750130*page 30
MARKS DO NOT WRITE IN
THIS MARGIN
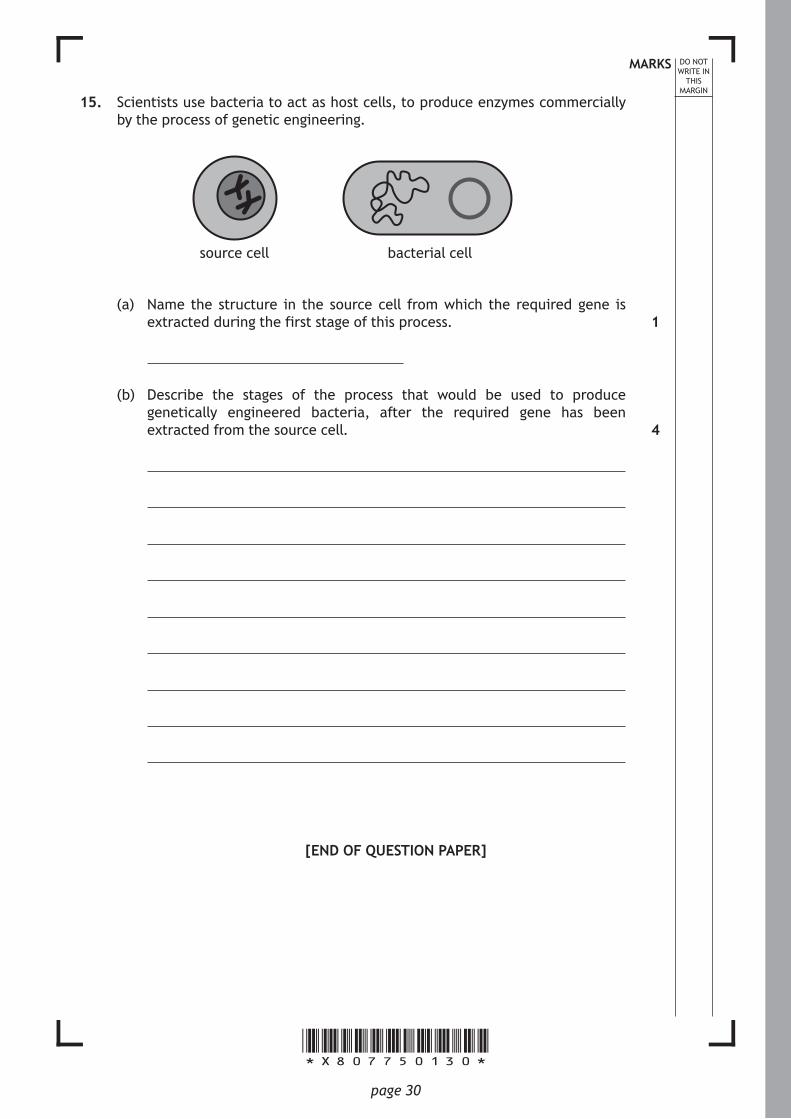
15. Scientists use bacteria to act as host cells, to produce enzymes commercially by the process of genetic engineering.
source cell bacterial cell
(a) Name the structure in the source cell from which the required gene is extracted during the first stage of this process.
(b) Describe the stages of the process that would be used to produce genetically engineered bacteria, after the required gene has been extracted from the source cell.
[END OF QUESTION PAPER]
1
4
*X807750131*page 31
MARKS DO NOT WRITE IN
THIS MARGIN
ADDITIONAL SPACE FOR ANSWERS AND ROUGH WORK
Additional grid for question 4 (b) (i)
6050403020100
time (minutes)

*X8077502*
N5
©
NationalQuali cations2018
Instructions for the completion of Section 1 are given on page 02 of your question and answer booklet X807/75/01.
Record your answers on the answer grid on page 03 of your question and answer booklet.
Before leaving the examination room you must give your question and answer booklet to the Invigilator; if you do not, you may lose all the marks for this paper.
X807/75/02 BiologySection 1 — Questions
TUESDAY, 15 MAY
1:00 PM – 3:30 PM
A/HTP
page 02
SECTION 1
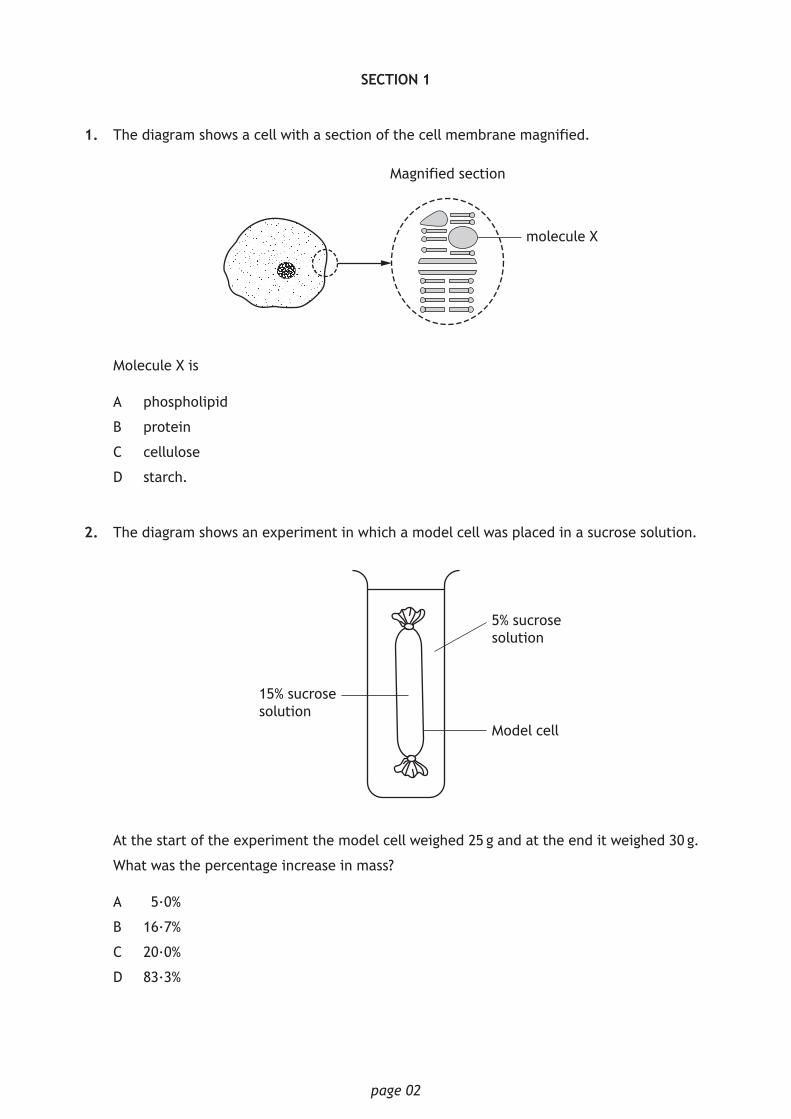
1. The diagram shows a cell with a section of the cell membrane magnified.
Magnified section
molecule X
Molecule X is
A phospholipid
B protein
C cellulose
D starch.
2. The diagram shows an experiment in which a model cell was placed in a sucrose solution.
5% sucrose solution
Model cell
15% sucrose solution
At the start of the experiment the model cell weighed 25 g and at the end it weighed 30 g.
What was the percentage increase in mass?
A 5·0%
B 16·7%
C 20·0%
D 83·3%
page 03
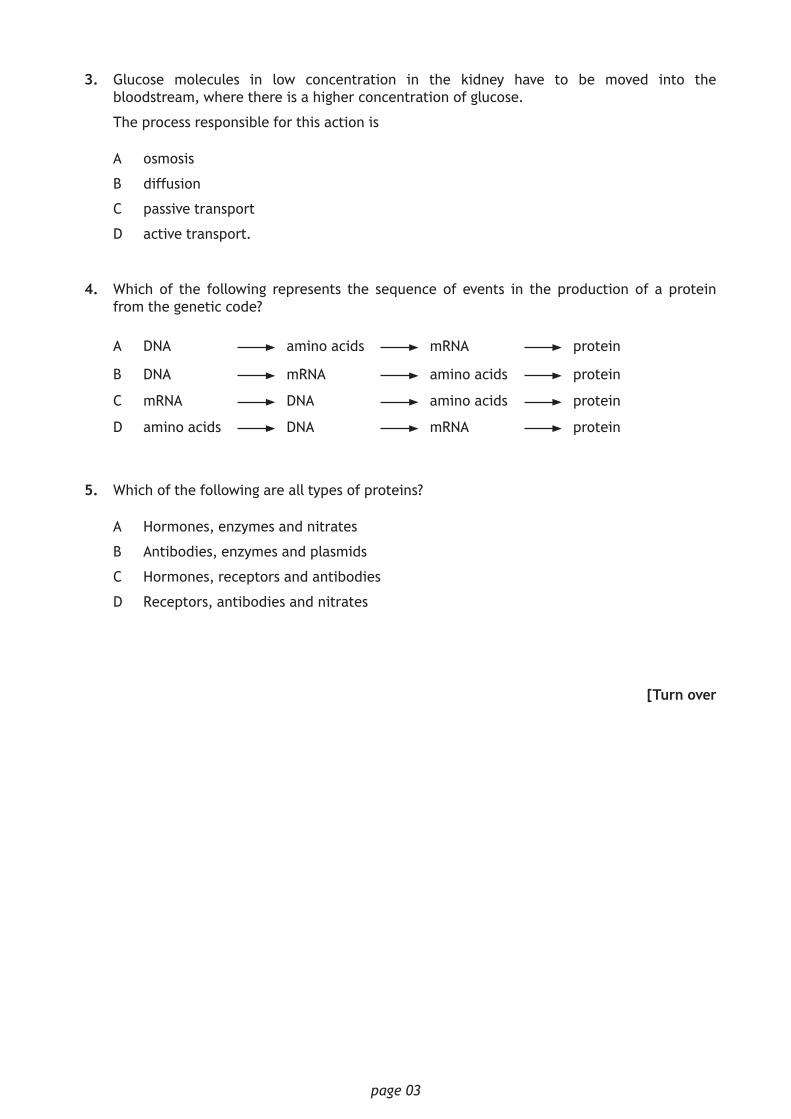
3. Glucose molecules in low concentration in the kidney have to be moved into the bloodstream, where there is a higher concentration of glucose.
The process responsible for this action is
A osmosis
B diffusion
C passive transport
D active transport.
4. Which of the following represents the sequence of events in the production of a protein from the genetic code?
A DNA amino acids mRNA protein
B DNA mRNA amino acids protein
C mRNA DNA amino acids protein
D amino acids DNA mRNA protein
5. Which of the following are all types of proteins?
A Hormones, enzymes and nitrates
B Antibodies, enzymes and plasmids
C Hormones, receptors and antibodies
D Receptors, antibodies and nitrates
[Turn over
page 04
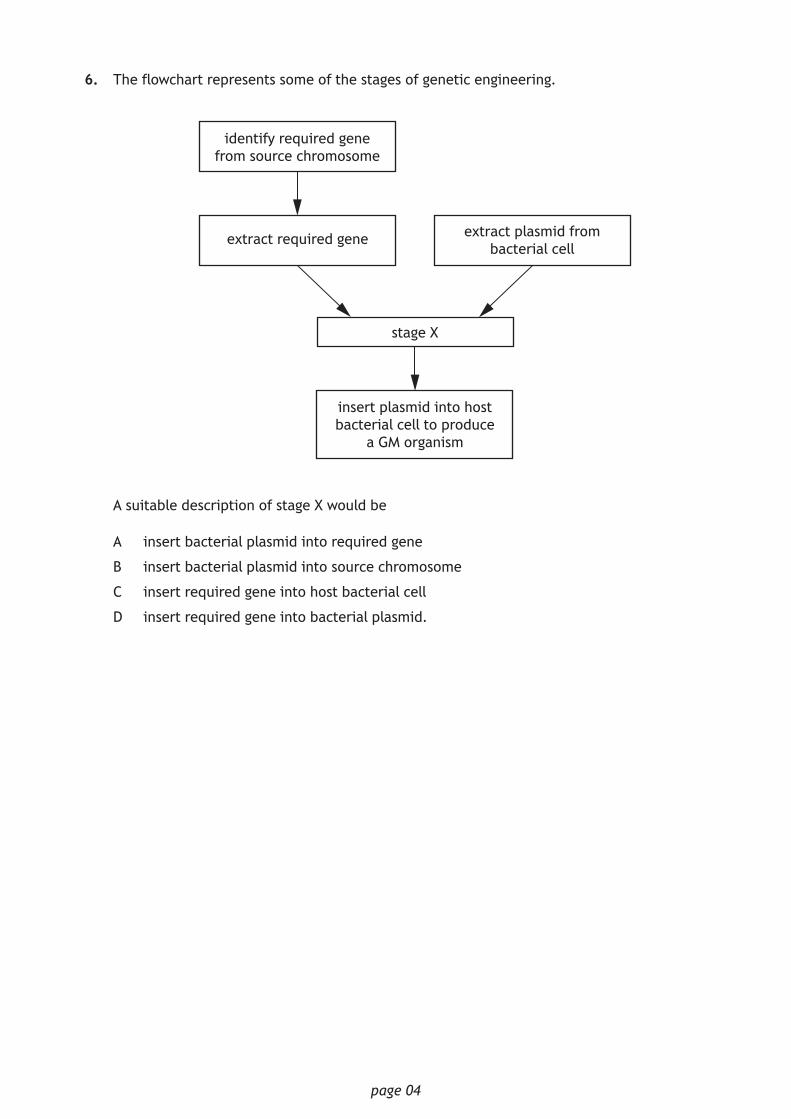
6. The flowchart represents some of the stages of genetic engineering.
stage X
extract required gene
identify required gene from source chromosome
extract plasmid from bacterial cell
insert plasmid into host bacterial cell to produce
a GM organism
A suitable description of stage X would be
A insert bacterial plasmid into required gene
B insert bacterial plasmid into source chromosome
C insert required gene into host bacterial cell
D insert required gene into bacterial plasmid.
page 05
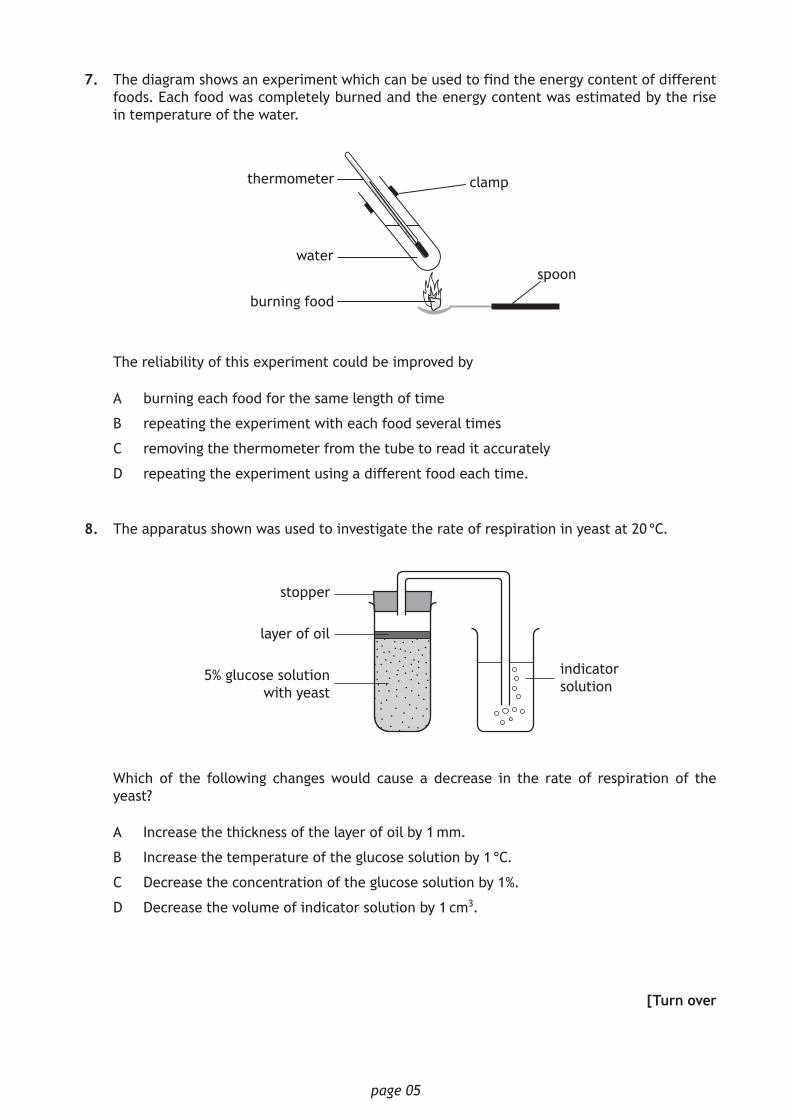
7. The diagram shows an experiment which can be used to find the energy content of different foods. Each food was completely burned and the energy content was estimated by the rise in temperature of the water.
thermometer
water
burning food
clamp
spoon
The reliability of this experiment could be improved by
A burning each food for the same length of time
B repeating the experiment with each food several times
C removing the thermometer from the tube to read it accurately
D repeating the experiment using a different food each time.
8. The apparatus shown was used to investigate the rate of respiration in yeast at 20 °C.
stopper
indicator solution
layer of oil
5% glucose solution with yeast
Which of the following changes would cause a decrease in the rate of respiration of the yeast?
A Increase the thickness of the layer of oil by 1 mm.
B Increase the temperature of the glucose solution by 1 °C.
C Decrease the concentration of the glucose solution by 1%.
D Decrease the volume of indicator solution by 1 cm3.
[Turn over
page 06
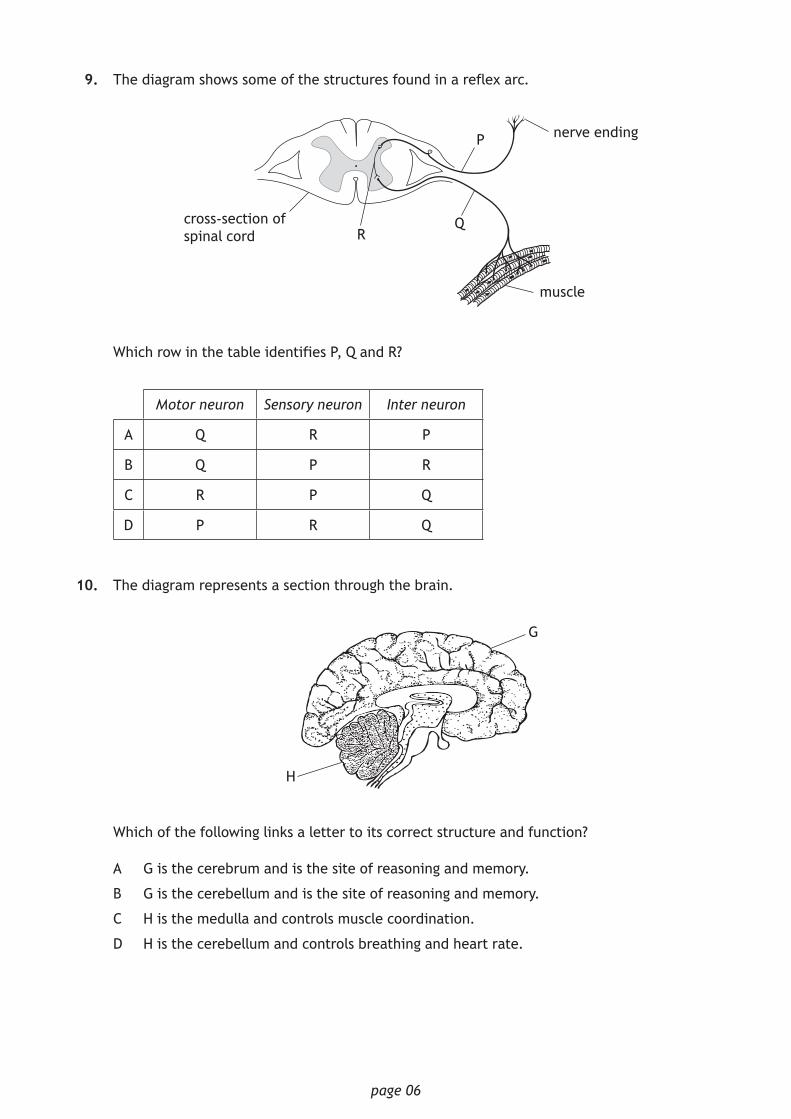
9. The diagram shows some of the structures found in a reflex arc.
Rcross-section of spinal cord
nerve ending
muscle
Q
P
Which row in the table identifies P, Q and R?
Motor neuron Sensory neuron Inter neuron
A Q R P
B Q P R
C R P Q
D P R Q
10. The diagram represents a section through the brain.
H
G
Which of the following links a letter to its correct structure and function?
A G is the cerebrum and is the site of reasoning and memory.
B G is the cerebellum and is the site of reasoning and memory.
C H is the medulla and controls muscle coordination.
D H is the cerebellum and controls breathing and heart rate.
page 07
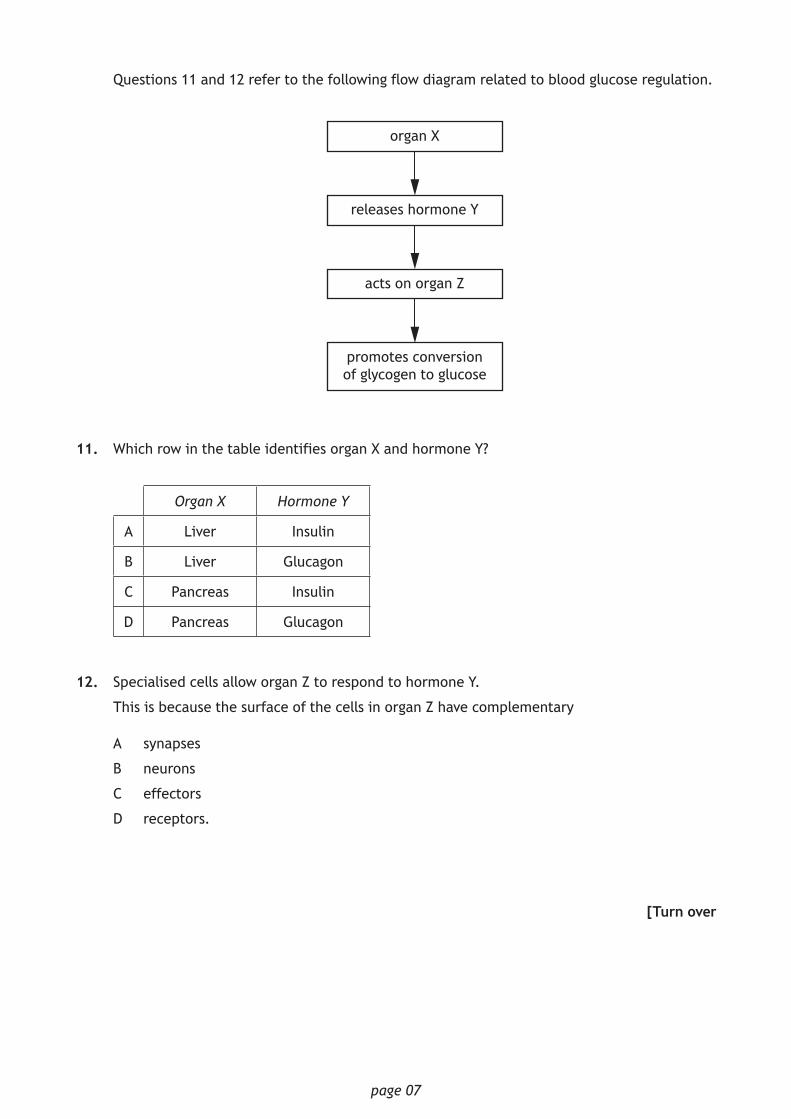
Questions 11 and 12 refer to the following flow diagram related to blood glucose regulation.
organ X
releases hormone Y
acts on organ Z
promotes conversion of glycogen to glucose
11. Which row in the table identifies organ X and hormone Y?
Organ X Hormone Y
A Liver Insulin
B Liver Glucagon
C Pancreas Insulin
D Pancreas Glucagon
12. Specialised cells allow organ Z to respond to hormone Y.
This is because the surface of the cells in organ Z have complementary
A synapses
B neurons
C effectors
D receptors.
[Turn over
page 08
13. An increase in which of the following factors would decrease the rate of transpiration in plants?
A Wind speed
B Humidity
C Surface area
D Temperature
14. Which of the following statements about blood cells is false?
A White blood cells are part of the immune system.
B Phagocytes are a type of white blood cell.
C Red blood cells contain haemoglobin.
D Phagocytes transport nutrients around the body.
15. Which row in the table identifies how lymphocytes destroy pathogens?
Antibody production Phagocytosis
A Yes No
B No No
C No Yes
D Yes Yes
page 09
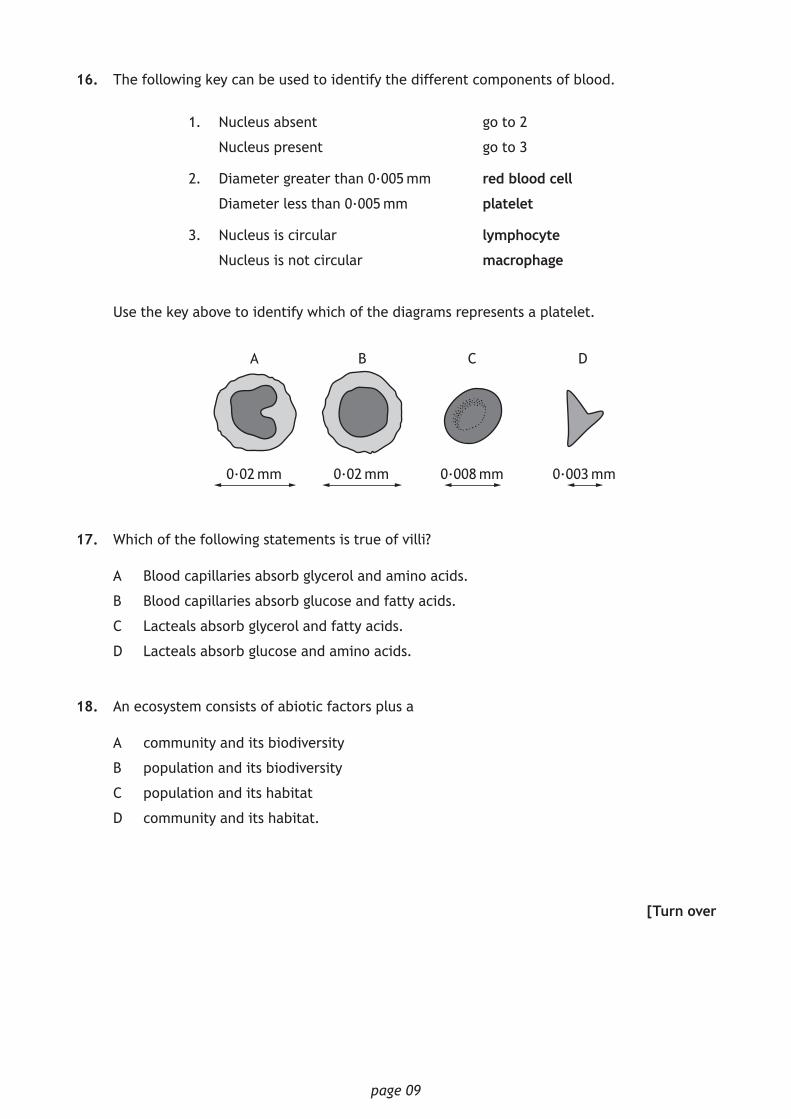
16. The following key can be used to identify the different components of blood.
1. Nucleus absent
Nucleus present
go to 2
go to 3
2. Diameter greater than 0·005 mm
Diameter less than 0·005 mm
red blood cell
platelet
3. Nucleus is circular
Nucleus is not circular
lymphocyte
macrophage
Use the key above to identify which of the diagrams represents a platelet.
0∙02 mm 0∙02 mm 0∙008 mm 0∙003 mm
A B C D
17. Which of the following statements is true of villi?
A Blood capillaries absorb glycerol and amino acids.
B Blood capillaries absorb glucose and fatty acids.
C Lacteals absorb glycerol and fatty acids.
D Lacteals absorb glucose and amino acids.
18. An ecosystem consists of abiotic factors plus a
A community and its biodiversity
B population and its biodiversity
C population and its habitat
D community and its habitat.
[Turn over
page 10
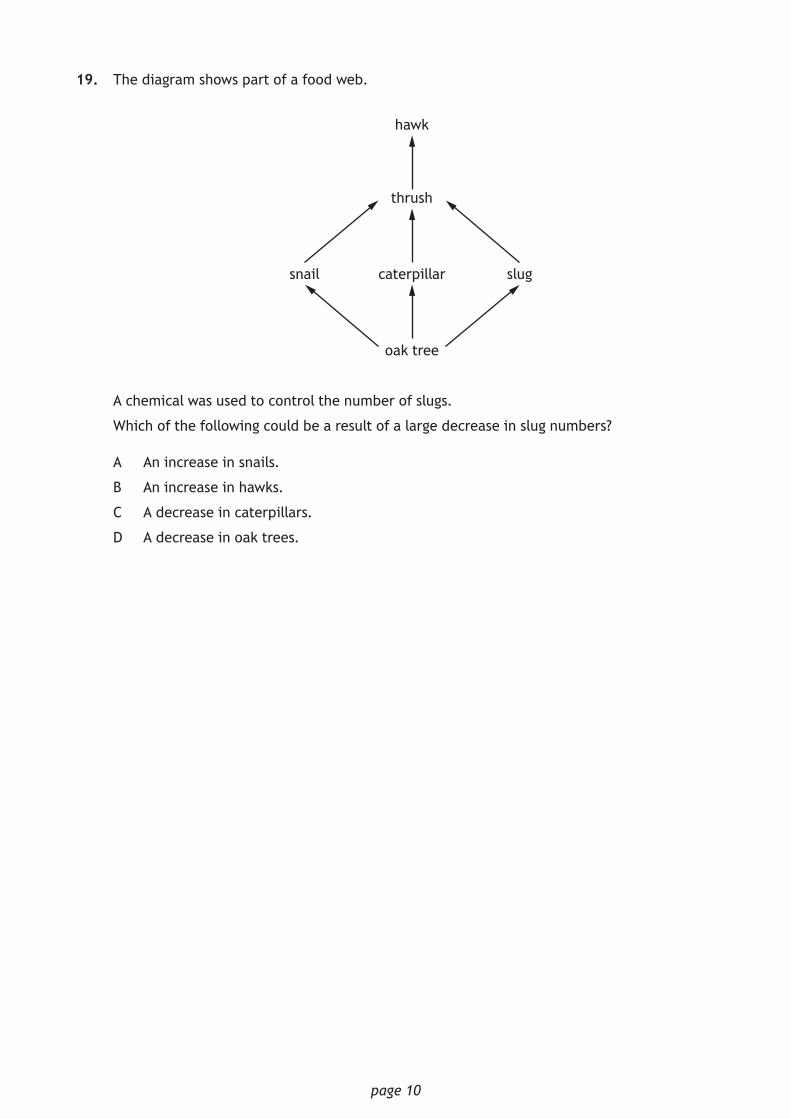
19. The diagram shows part of a food web.
thrush
snail slugcaterpillar
hawk
oak tree
A chemical was used to control the number of slugs.
Which of the following could be a result of a large decrease in slug numbers?
A An increase in snails.
B An increase in hawks.
C A decrease in caterpillars.
D A decrease in oak trees.
page 11
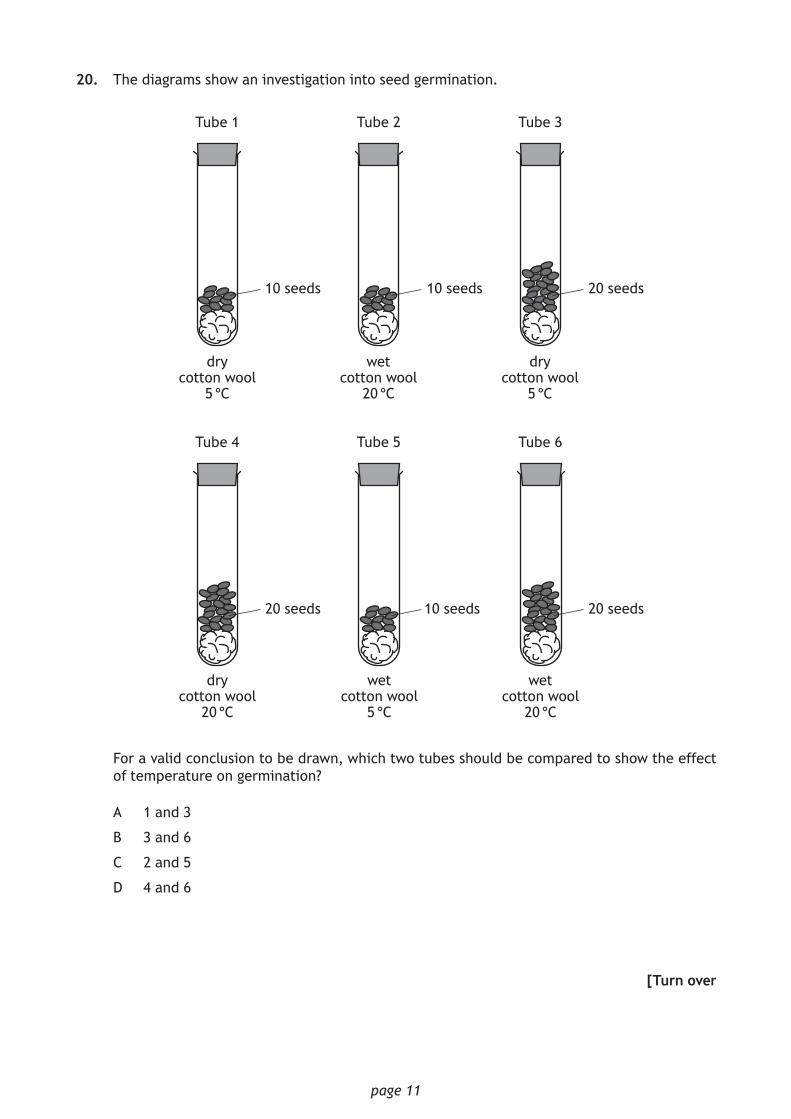
20. The diagrams show an investigation into seed germination.
10 seeds
Tube 3Tube 2Tube 1
Tube 6
wet cotton wool
20 °C
Tube 5
wet cotton wool
5 °C
Tube 4
dry cotton wool
20 °C
20 seeds
dry cotton wool
5 °C
10 seeds
wet cotton wool
20 °C
10 seeds
dry cotton wool
5 °C
20 seeds
20 seeds
For a valid conclusion to be drawn, which two tubes should be compared to show the effect of temperature on germination?
A 1 and 3
B 3 and 6
C 2 and 5
D 4 and 6
[Turn over
page 12
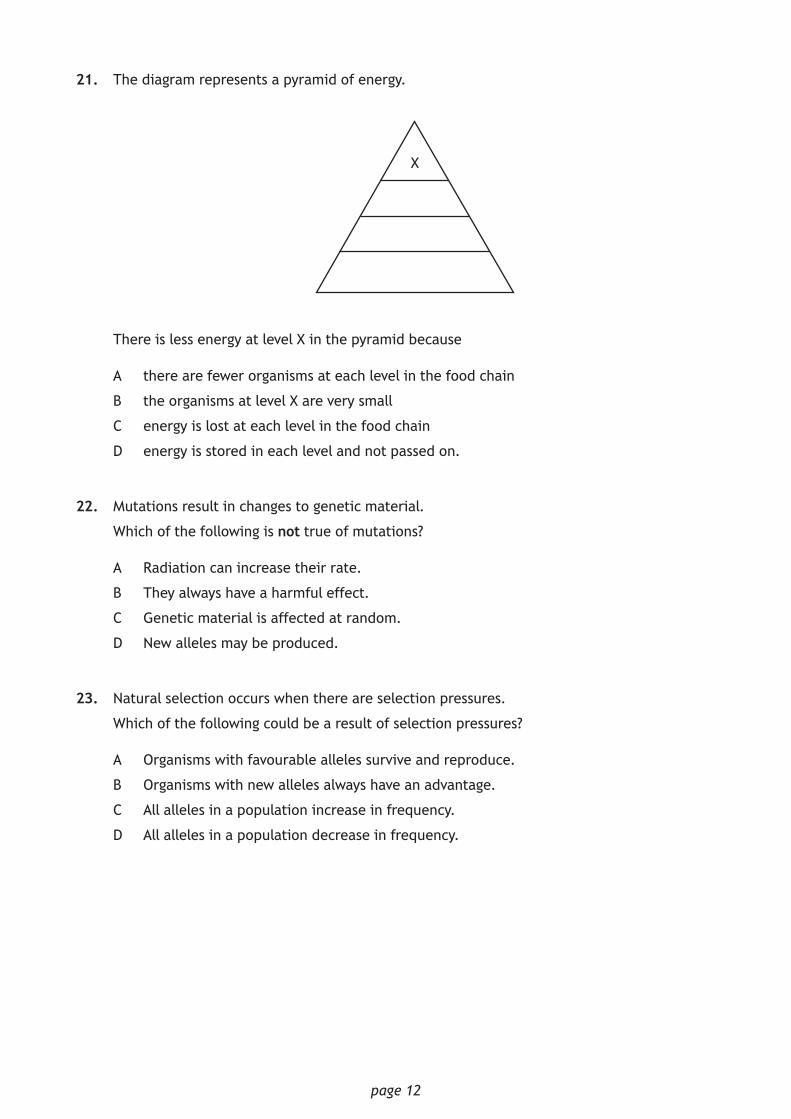
21. The diagram represents a pyramid of energy.
X
There is less energy at level X in the pyramid because
A there are fewer organisms at each level in the food chain
B the organisms at level X are very small
C energy is lost at each level in the food chain
D energy is stored in each level and not passed on.
22. Mutations result in changes to genetic material.
Which of the following is not true of mutations?
A Radiation can increase their rate.
B They always have a harmful effect.
C Genetic material is affected at random.
D New alleles may be produced.
23. Natural selection occurs when there are selection pressures.
Which of the following could be a result of selection pressures?
A Organisms with favourable alleles survive and reproduce.
B Organisms with new alleles always have an advantage.
C All alleles in a population increase in frequency.
D All alleles in a population decrease in frequency.
page 13
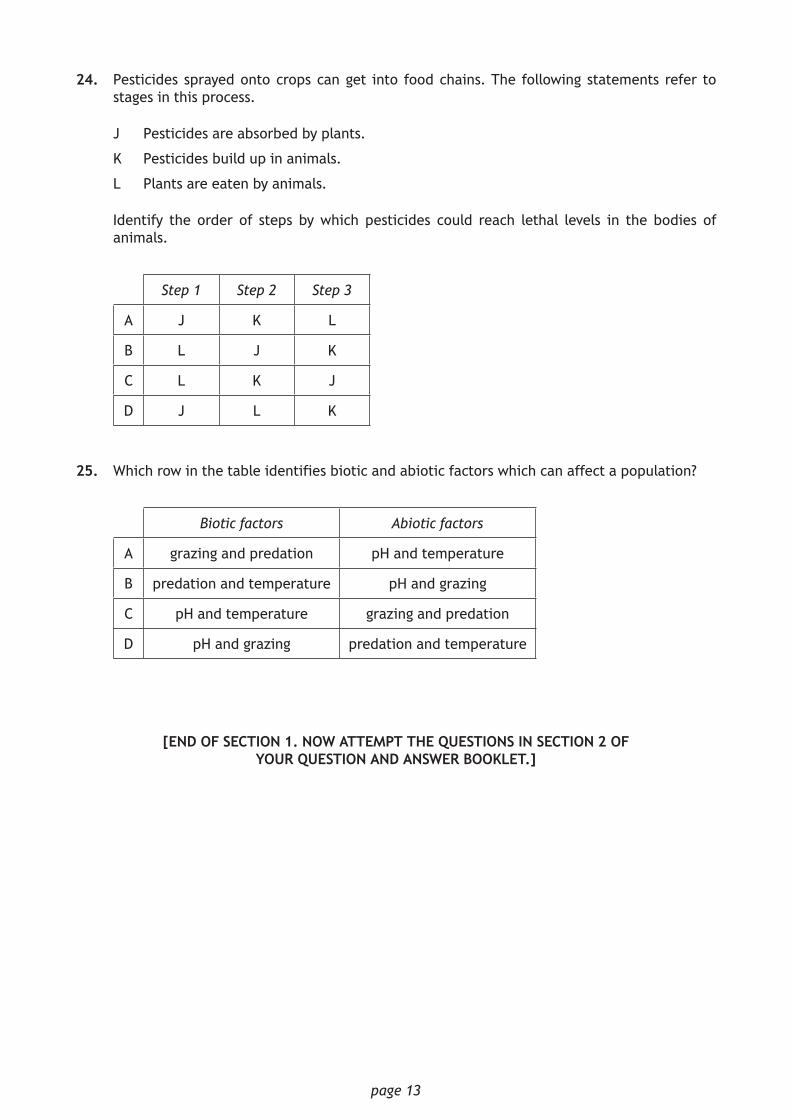
24. Pesticides sprayed onto crops can get into food chains. The following statements refer to stages in this process.
J Pesticides are absorbed by plants.
K Pesticides build up in animals.
L Plants are eaten by animals.
Identify the order of steps by which pesticides could reach lethal levels in the bodies of animals.
Step 1 Step 2 Step 3
A J K L
B L J K
C L K J
D J L K
25. Which row in the table identifies biotic and abiotic factors which can affect a population?
Biotic factors Abiotic factors
A grazing and predation pH and temperature
B predation and temperature pH and grazing
C pH and temperature grazing and predation
D pH and grazing predation and temperature
[END OF SECTION 1. NOW ATTEMPT THE QUESTIONS IN SECTION 2 OF YOUR QUESTION AND ANSWER BOOKLET.]
*X807750105*page 05
MARKS DO NOT WRITE IN
THIS MARGIN
SECTION 2 — 75 marks
Attempt ALL questions
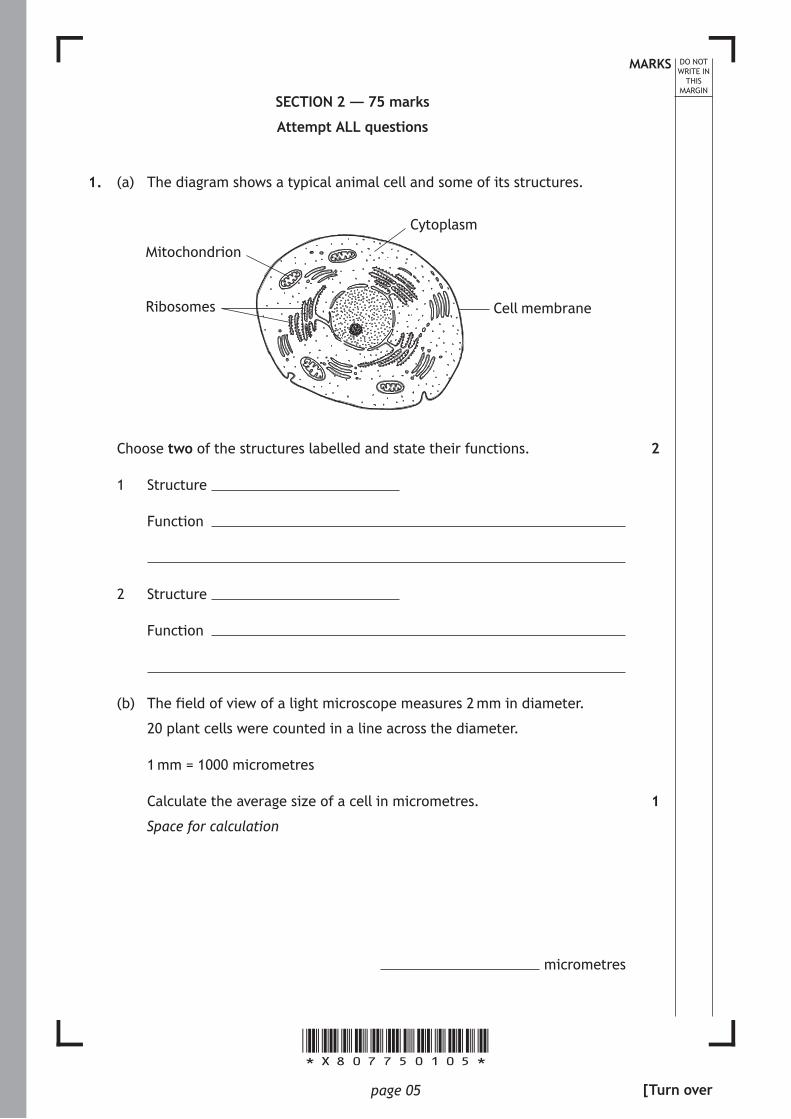
1. (a) The diagram shows a typical animal cell and some of its structures.
Ribosomes Cell membrane
Cytoplasm
Mitochondrion
Choose two of the structures labelled and state their functions.
1 Structure
Function
2 Structure
Function
(b) The field of view of a light microscope measures 2 mm in diameter.
20 plant cells were counted in a line across the diameter.
1 mm = 1000 micrometres
Calculate the average size of a cell in micrometres.
Space for calculation
micrometres
2
1
[Turn over
*X807750106*page 06
MARKS DO NOT WRITE IN
THIS MARGIN
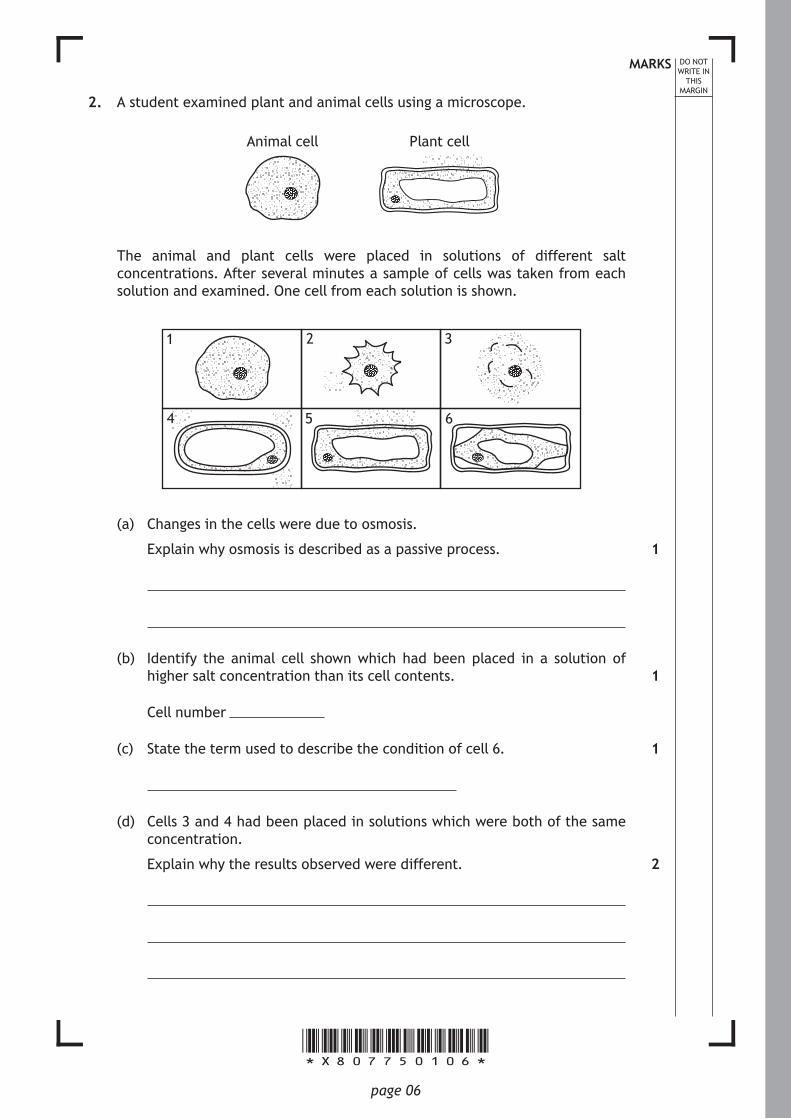
2. A student examined plant and animal cells using a microscope.
Animal cell Plant cell
The animal and plant cells were placed in solutions of different salt concentrations. After several minutes a sample of cells was taken from each solution and examined. One cell from each solution is shown.
5 64
2 31
(a) Changes in the cells were due to osmosis.
Explain why osmosis is described as a passive process.
(b) Identify the animal cell shown which had been placed in a solution of higher salt concentration than its cell contents.
Cell number
(c) State the term used to describe the condition of cell 6.
(d) Cells 3 and 4 had been placed in solutions which were both of the same concentration.
Explain why the results observed were different.
1
1
1
2
*X807750107*page 07
MARKS DO NOT WRITE IN
THIS MARGIN
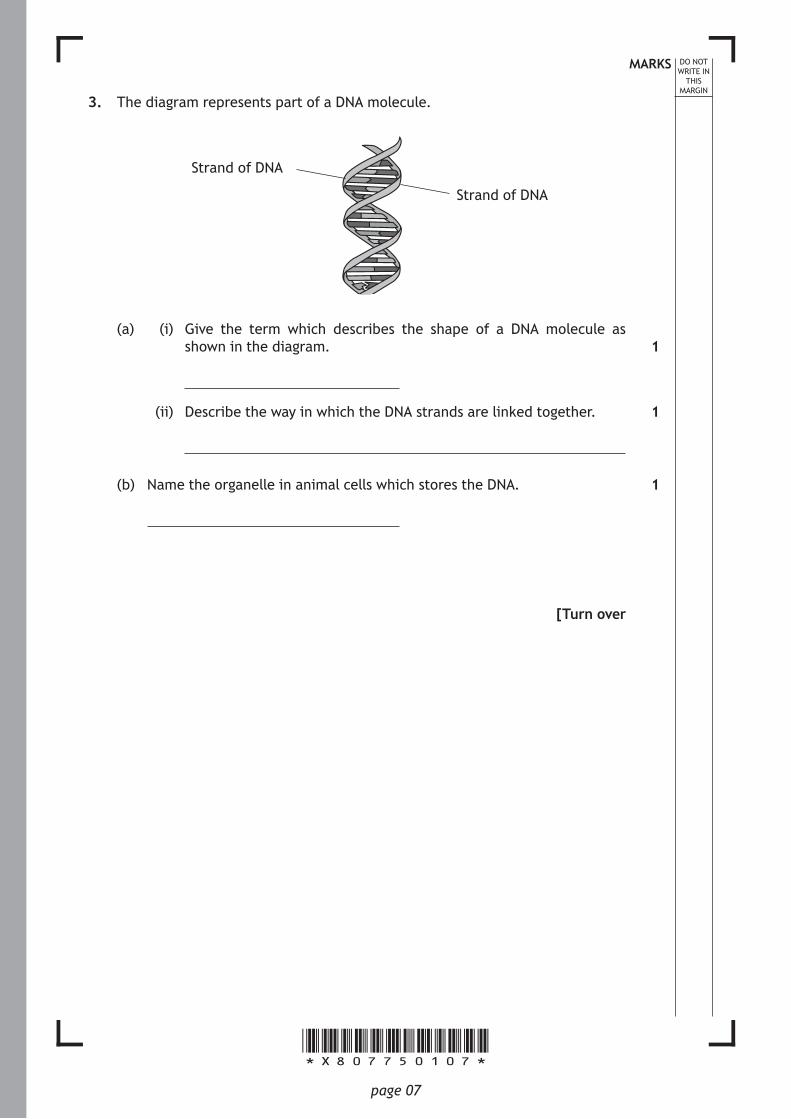
3. The diagram represents part of a DNA molecule.
Strand of DNA
Strand of DNA
(a) (i) Give the term which describes the shape of a DNA molecule as shown in the diagram.
(ii) Describe the way in which the DNA strands are linked together.
(b) Name the organelle in animal cells which stores the DNA.
[Turn over
1
1
1
*X807750108*page 08
MARKS DO NOT WRITE IN
THIS MARGIN
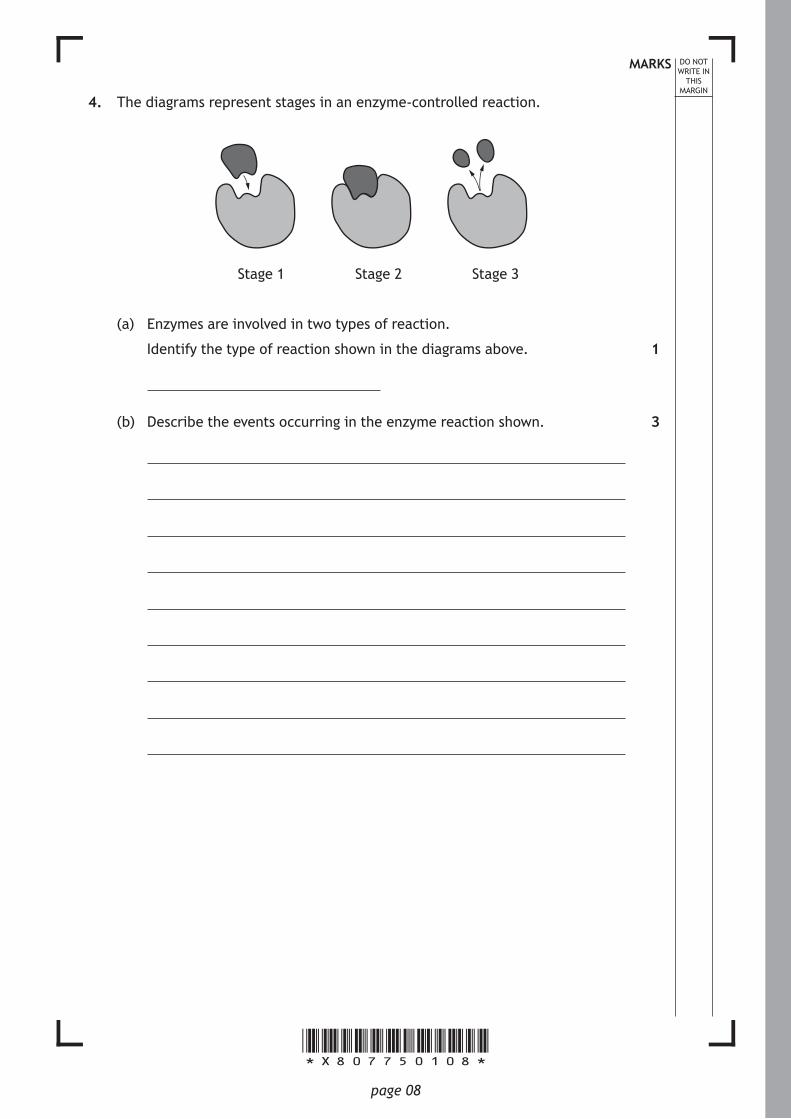
4. The diagrams represent stages in an enzyme-controlled reaction.
Stage 2 Stage 3Stage 1
(a) Enzymes are involved in two types of reaction.
Identify the type of reaction shown in the diagrams above.
(b) Describe the events occurring in the enzyme reaction shown.
1
3
*X807750109*page 09
MARKS DO NOT WRITE IN
THIS MARGIN
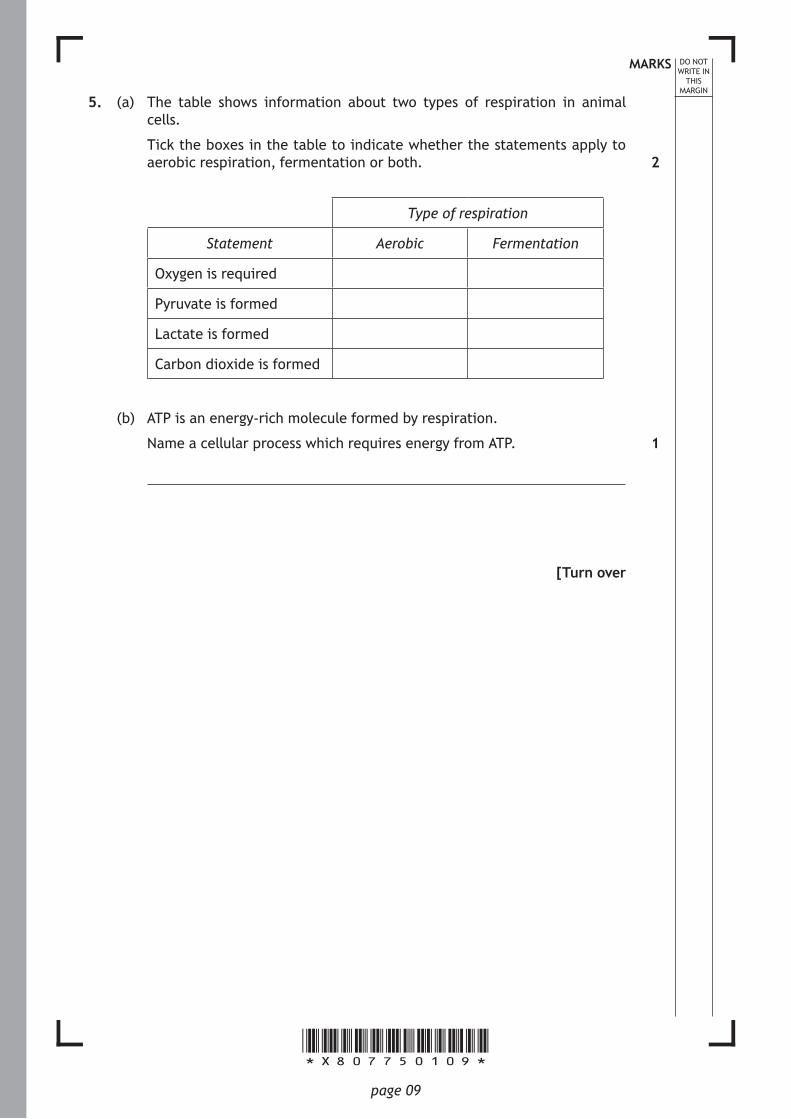
5. (a) The table shows information about two types of respiration in animal cells.
Tick the boxes in the table to indicate whether the statements apply to aerobic respiration, fermentation or both.
Type of respiration
Statement Aerobic Fermentation
Oxygen is required
Pyruvate is formed
Lactate is formed
Carbon dioxide is formed
(b) ATP is an energy-rich molecule formed by respiration.
Name a cellular process which requires energy from ATP.
[Turn over
2
1
*X807750110*page 10
DO NOT WRITE IN
THIS MARGIN
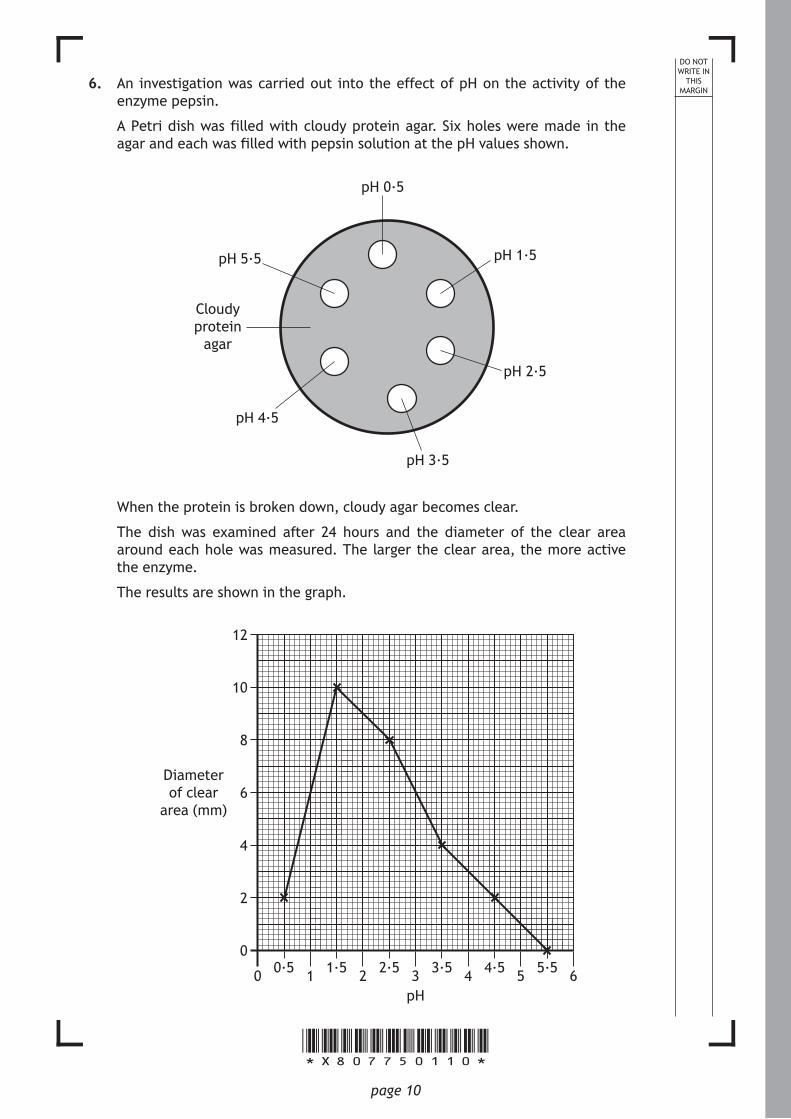
6. An investigation was carried out into the effect of pH on the activity of the enzyme pepsin.
A Petri dish was filled with cloudy protein agar. Six holes were made in the agar and each was filled with pepsin solution at the pH values shown.
pH 0·5
pH 1·5
pH 2·5
pH 3·5
pH 4·5
pH 5·5
Cloudy protein
agar
When the protein is broken down, cloudy agar becomes clear.
The dish was examined after 24 hours and the diameter of the clear area around each hole was measured. The larger the clear area, the more active the enzyme.
The results are shown in the graph.
0 1 2 3 4 5 6
0
2
4
6
8
10
12
Diameter of clear
area (mm)
pH
0∙5 1∙5 2∙5 3∙5 4∙5 5∙5
*X807750111*page 11
MARKS DO NOT WRITE IN
THIS MARGIN
6. (continued)
(a) (i) Identify the optimum pH for pepsin in this experiment.
pH
(ii) Calculate how many times more active the enzyme is at pH 2·5 than at pH 4·5.
Space for calculation
times
(b) State two variables which should be controlled to make this experiment valid.
1
2
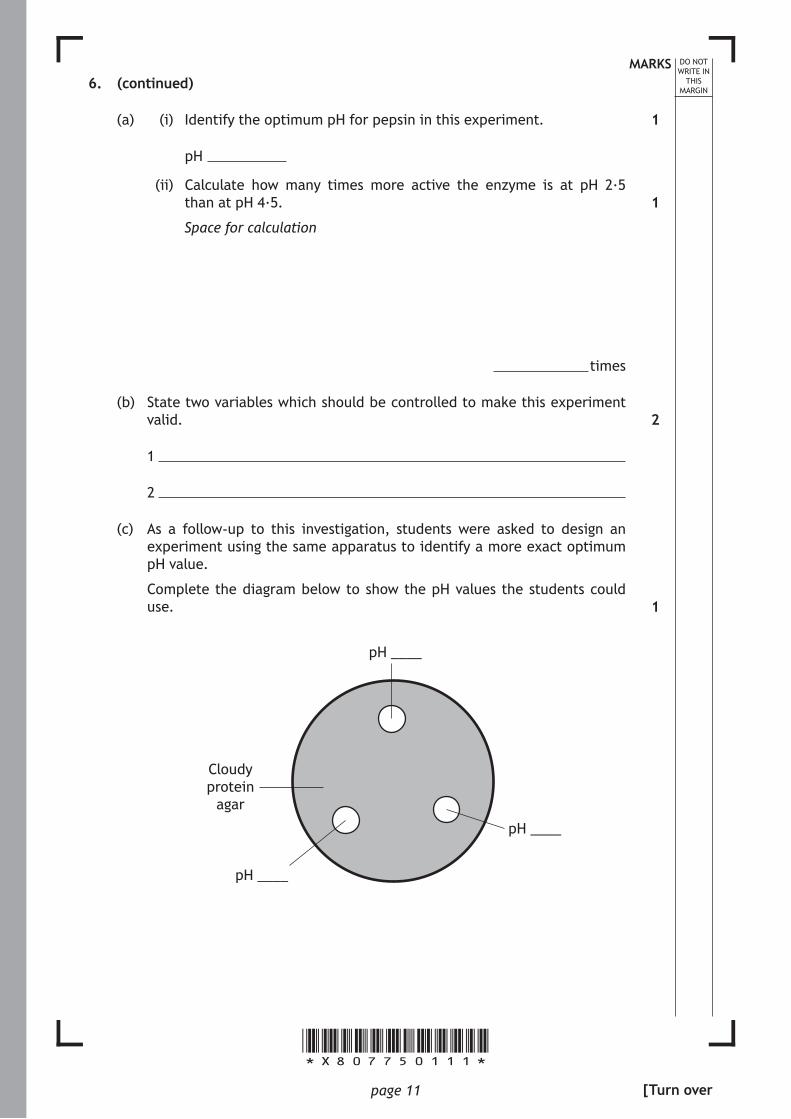
(c) As a follow-up to this investigation, students were asked to design an experiment using the same apparatus to identify a more exact optimum pH value.
Complete the diagram below to show the pH values the students could use.
Cloudy protein
agar
pH ____
pH ____
pH ____
1
1
2
1
[Turn over
*X807750112*page 12
MARKS DO NOT WRITE IN
THIS MARGIN
7. The process of mitosis begins with the chromosomes becoming visible.
Describe the sequence of events which follows on from this resulting in the production of two daughter cells. 4
*X807750113*page 13
MARKS DO NOT WRITE IN
THIS MARGIN
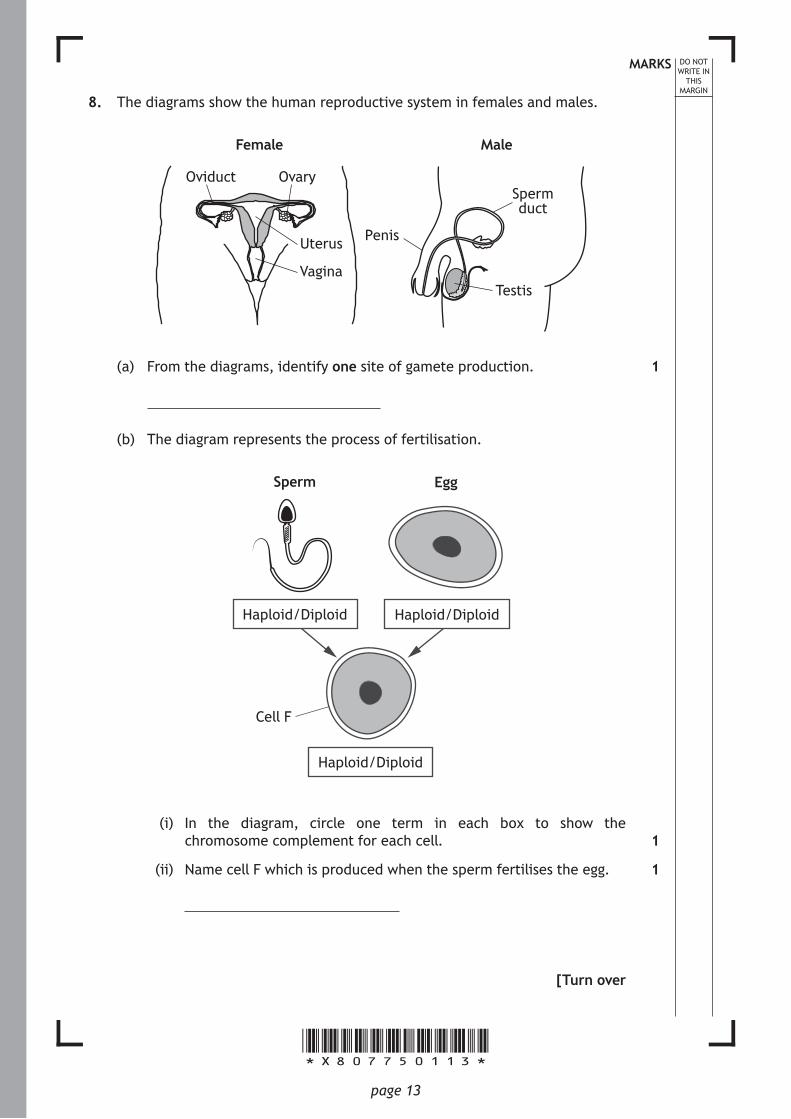
8. The diagrams show the human reproductive system in females and males.
Vagina
Uterus
Sperm duct
Ovary
Female Male
Oviduct
Testis
Penis
(a) From the diagrams, identify one site of gamete production.
(b) The diagram represents the process of fertilisation.
Haploid/Diploid
Haploid/DiploidHaploid/Diploid
Sperm
Cell F
Egg
(i) In the diagram, circle one term in each box to show the chromosome complement for each cell.
(ii) Name cell F which is produced when the sperm fertilises the egg.
[Turn over
1
1
1
*X807750114*page 14
MARKS DO NOT WRITE IN
THIS MARGIN
9.
Adapted from the Herald, Friday 4 March 2016
Coffee and Multiple Sclerosis
Multiple sclerosis (MS) is a condition which affects the central nervous system and can cause problems with vision and balance as well as numbness in the skin. Scotland has one of the highest incidences of MS in the world, with a mixture of genetic and environmental factors thought to be the cause.
Research suggests that drinking a lot of coffee every day could potentially cut the risk of developing MS.
Experts found that consuming more than 900 ml daily may offer up to 30% reduced risk.
Researchers compared the results of studies from two different countries.
One study in Sweden involved 1,620 adults with MS and a comparison group of 2,788 people without MS. A second study in the USA involved 1,159 people with MS and 1,172 people without MS.
The results showed the risk of MS was consistently higher among people who drank fewer cups of coffee every day in both studies, even after taking into account other factors of influence.
(a) Identify the factors thought to be the cause of the high incidence of MS in Scotland.
(b) In the table below, present the information from the passage, to give details of the two studies and the people involved.
(An additional table, if required, can be found on page 28.)
Country
1
2
*X807750115*page 15
MARKS DO NOT WRITE IN
THIS MARGIN
9. (continued)
(c) As part of the research described in the passage, groups of people with MS were compared to those without MS.
Give the term used to describe a comparison group in scientific research.
(d) Decide whether this research would be described as reliable or not and tick the appropriate box.
Give a reason for your choice.
Reliable Not reliable
Reason
(e) The researcher took ‘other factors of influence’ into consideration.
Suggest one of these factors.
[Turn over
1
1
1
*X807750116*page 16
MARKS DO NOT WRITE IN
THIS MARGIN
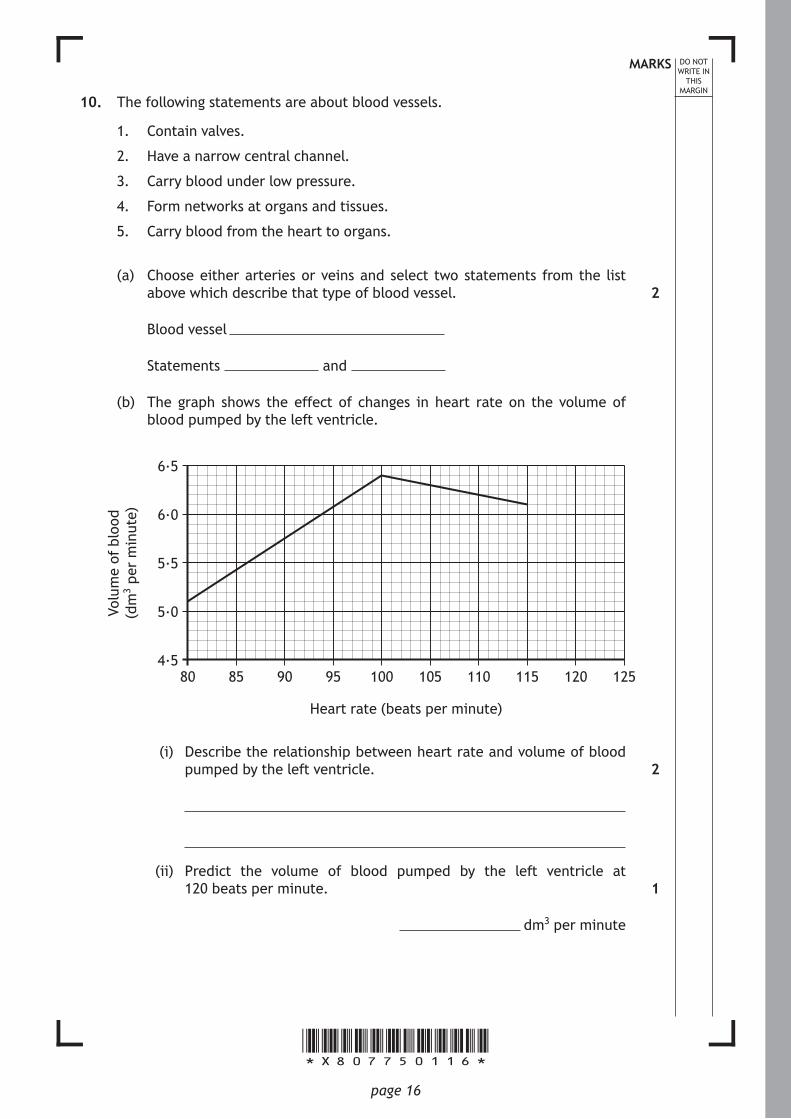
10. The following statements are about blood vessels.
1. Contain valves.
2. Have a narrow central channel.
3. Carry blood under low pressure.
4. Form networks at organs and tissues.
5. Carry blood from the heart to organs.
(a) Choose either arteries or veins and select two statements from the list above which describe that type of blood vessel.
Blood vessel
Statements and
(b) The graph shows the effect of changes in heart rate on the volume of blood pumped by the left ventricle.
4∙5
5∙0
5∙5
6∙0
6∙5
80 85 90 95 100 105 110 115 120 125
Heart rate (beats per minute)
Volu
me
of b
lood
(d
m3 p
er m
inut
e)
(i) Describe the relationship between heart rate and volume of blood pumped by the left ventricle.
(ii) Predict the volume of blood pumped by the left ventricle at 120 beats per minute.
dm3 per minute
2
2
1
*X807750117*page 17
MARKS DO NOT WRITE IN
THIS MARGIN
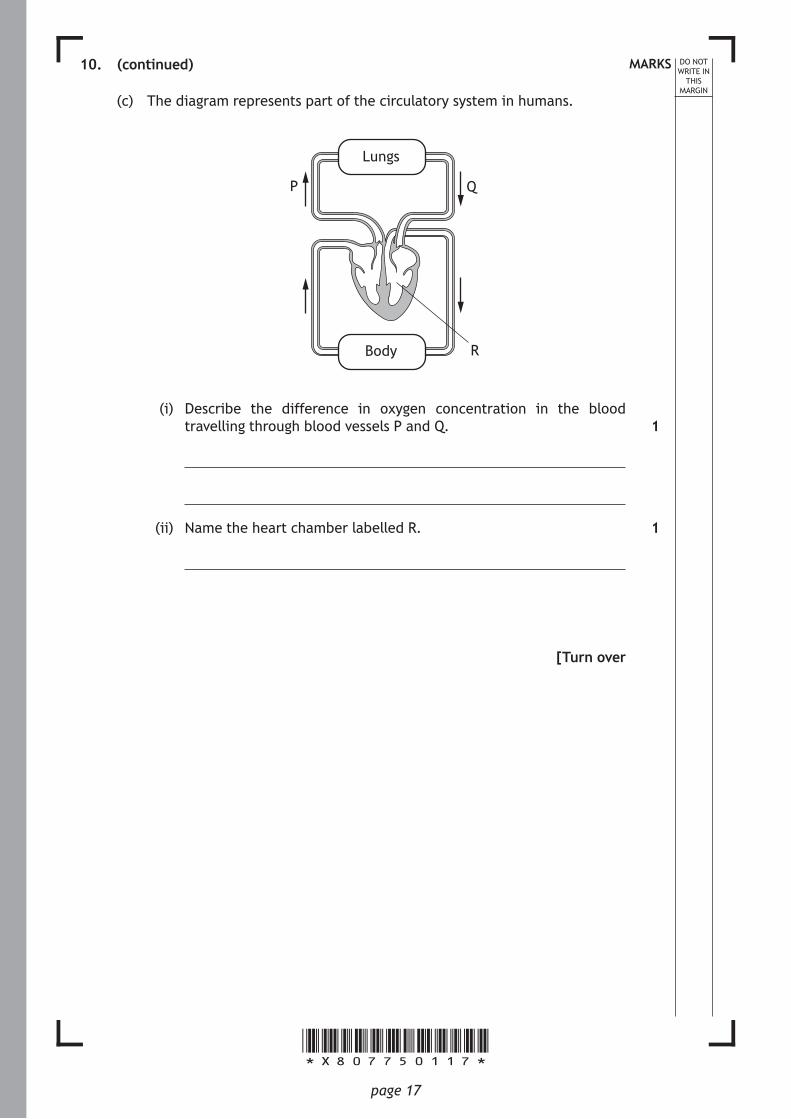
10. (continued)
(c) The diagram represents part of the circulatory system in humans.
Lungs
P Q
RBody
(i) Describe the difference in oxygen concentration in the blood travelling through blood vessels P and Q.
(ii) Name the heart chamber labelled R.
[Turn over
1
1
*X807750118*page 18
MARKS DO NOT WRITE IN
THIS MARGIN
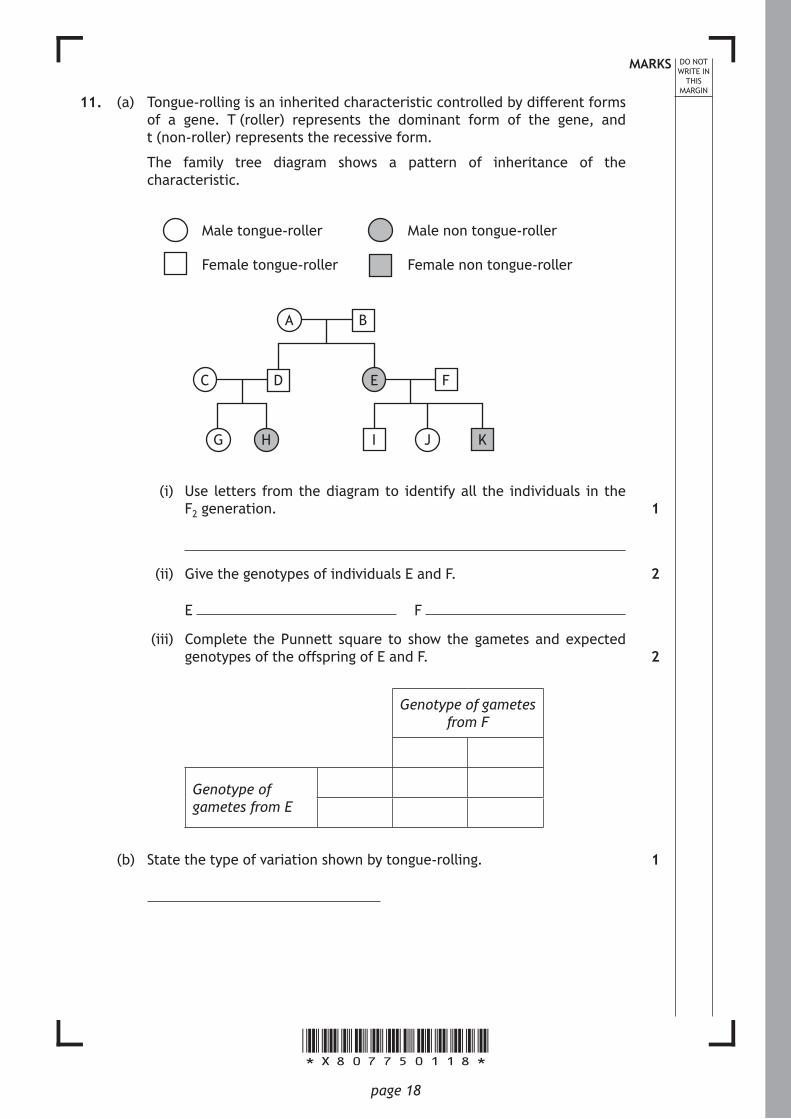
11. (a) Tongue-rolling is an inherited characteristic controlled by different forms of a gene. T (roller) represents the dominant form of the gene, and t (non-roller) represents the recessive form.
The family tree diagram shows a pattern of inheritance of the characteristic.
Female non tongue-roller
Male non tongue-roller
Female tongue-roller
Male tongue-roller
A
EC
JHG KI
B
FD
(i) Use letters from the diagram to identify all the individuals in the F2 generation.
(ii) Give the genotypes of individuals E and F.
E F
(iii) Complete the Punnett square to show the gametes and expected genotypes of the offspring of E and F.
Genotype of gametes from F
Genotype of gametes from E
(b) State the type of variation shown by tongue-rolling.
1
2
2
1
*X807750119*page 19
MARKS DO NOT WRITE IN
THIS MARGIN
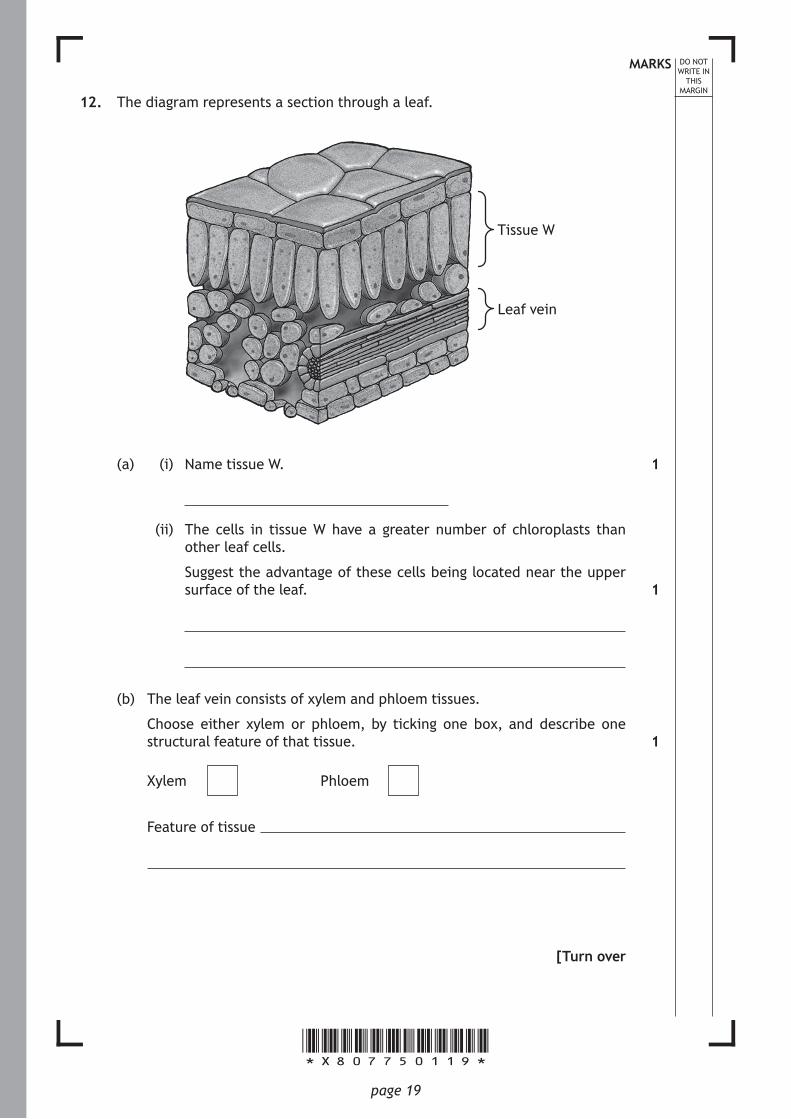
12. The diagram represents a section through a leaf.
Leaf vein
Tissue W
(a) (i) Name tissue W.
(ii) The cells in tissue W have a greater number of chloroplasts than other leaf cells.
Suggest the advantage of these cells being located near the upper surface of the leaf.
(b) The leaf vein consists of xylem and phloem tissues.
Choose either xylem or phloem, by ticking one box, and describe one structural feature of that tissue.
Xylem Phloem
Feature of tissue
[Turn over
1
1
1
*X807750120*page 20
MARKS DO NOT WRITE IN
THIS MARGIN
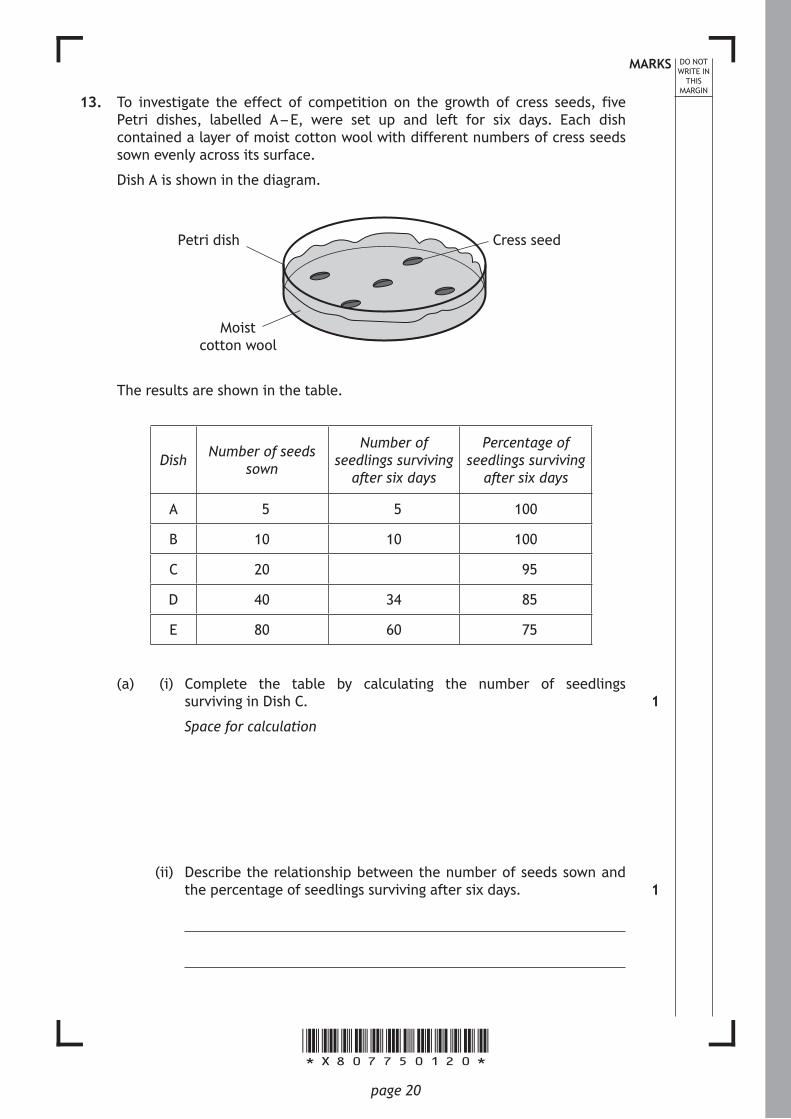
13. To investigate the effect of competition on the growth of cress seeds, five Petri dishes, labelled A – E, were set up and left for six days. Each dish contained a layer of moist cotton wool with different numbers of cress seeds sown evenly across its surface.
Dish A is shown in the diagram.
Petri dish Cress seed
Moist cotton wool
The results are shown in the table.
Dish Number of seeds sown
Number of seedlings surviving
after six days
Percentage of seedlings surviving
after six days
A 5 5 100
B 10 10 100
C 20 95
D 40 34 85
E 80 60 75
(a) (i) Complete the table by calculating the number of seedlings surviving in Dish C.
Space for calculation
(ii) Describe the relationship between the number of seeds sown and the percentage of seedlings surviving after six days.
1
1
*X807750121*page 21
MARKS DO NOT WRITE IN
THIS MARGIN
13. (a) (continued)
(iii) Explain why the type of competition shown in this investigation is described as being intraspecific.
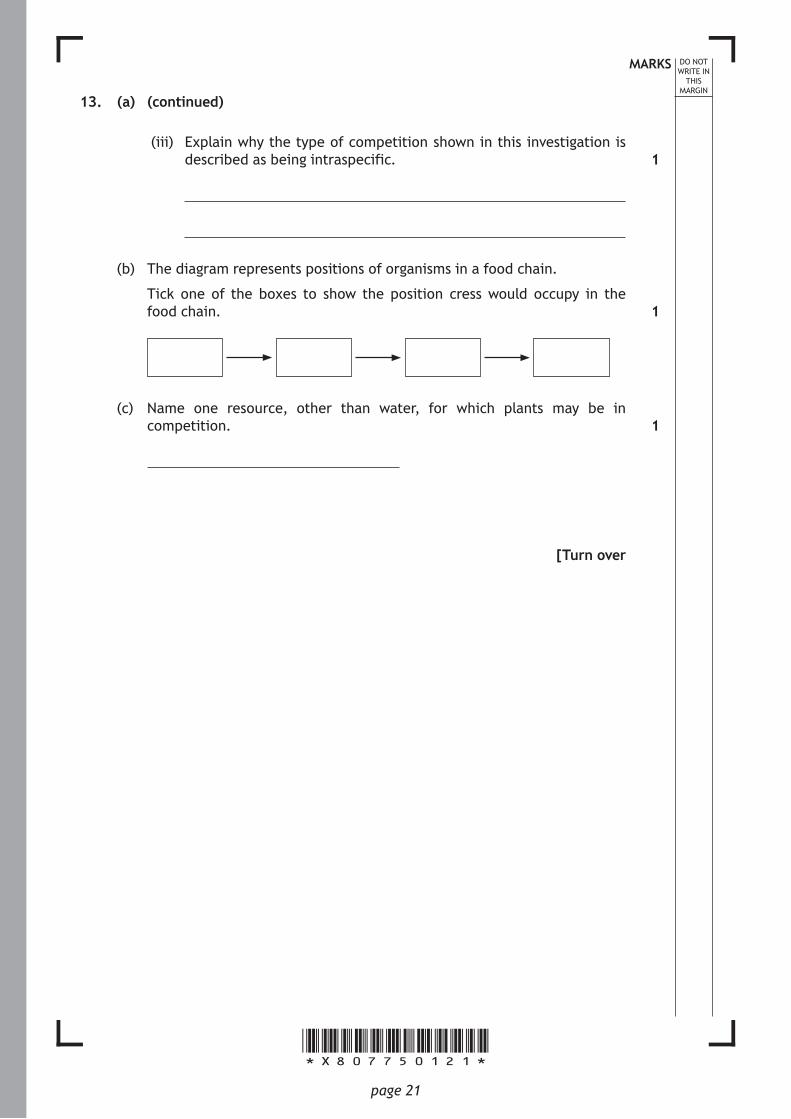
(b) The diagram represents positions of organisms in a food chain.
Tick one of the boxes to show the position cress would occupy in the food chain.
(c) Name one resource, other than water, for which plants may be in competition.
[Turn over
1
1
1
*X807750122*page 22
MARKS DO NOT WRITE IN
THIS MARGIN
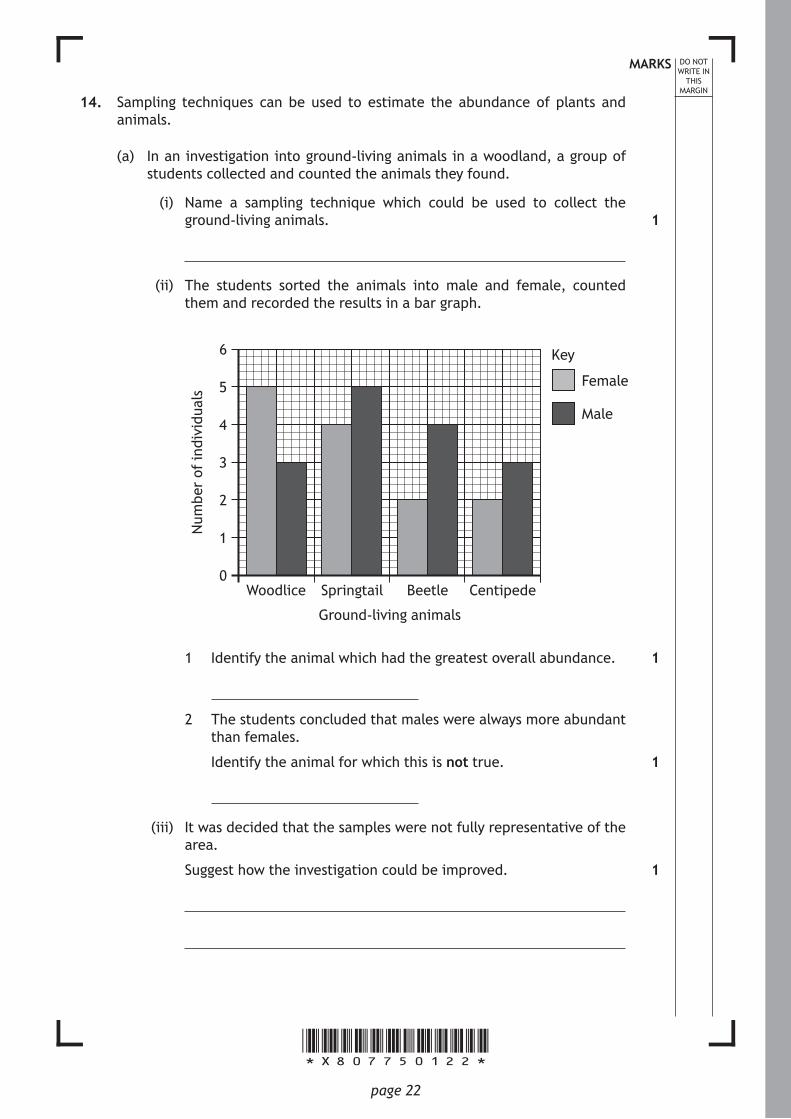
14. Sampling techniques can be used to estimate the abundance of plants and animals.
(a) In an investigation into ground-living animals in a woodland, a group of students collected and counted the animals they found.
(i) Name a sampling technique which could be used to collect the ground-living animals.
(ii) The students sorted the animals into male and female, counted them and recorded the results in a bar graph.
Num
ber
of in
divi
dual
s
Ground-living animals
Woodlice Springtail Beetle Centipede
Male
Female
Key
0
1
2
3
4
5
6
1 Identify the animal which had the greatest overall abundance.
2 The students concluded that males were always more abundant than females.
Identify the animal for which this is not true.
(iii) It was decided that the samples were not fully representative of the area.
Suggest how the investigation could be improved.
1
1
1
1
*X807750123*page 23
MARKS DO NOT WRITE IN
THIS MARGIN
14. (continued)
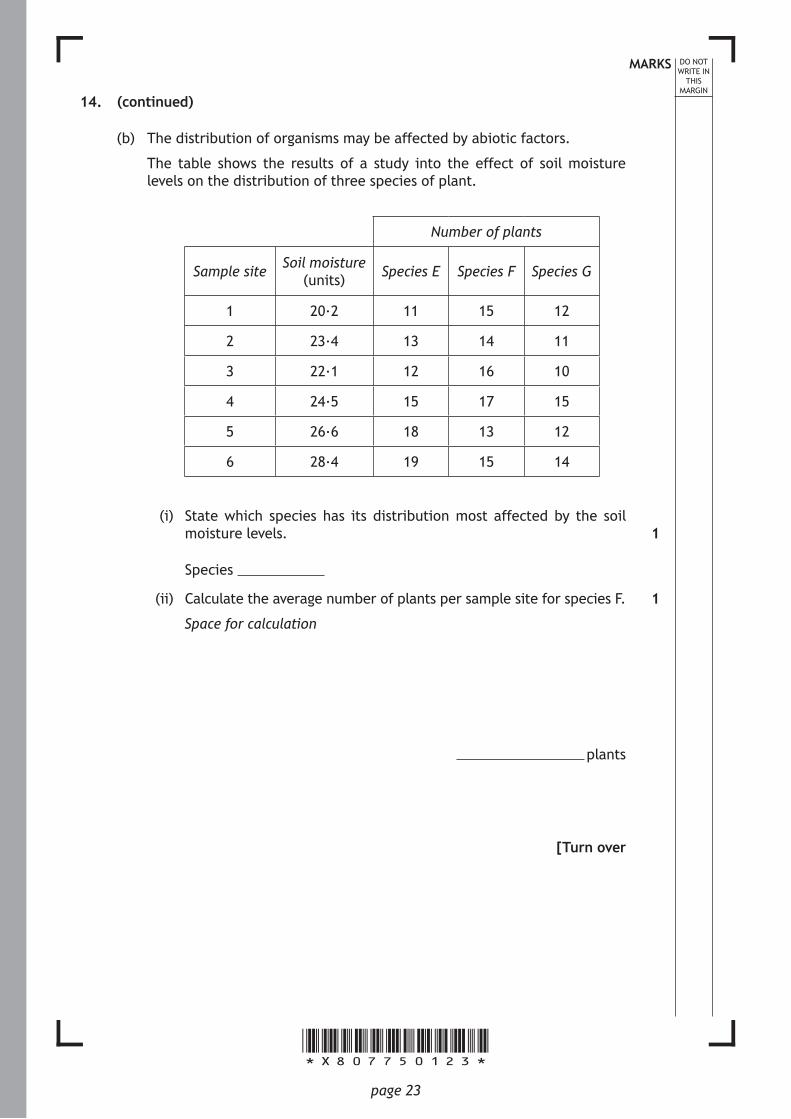
(b) The distribution of organisms may be affected by abiotic factors.
The table shows the results of a study into the effect of soil moisture levels on the distribution of three species of plant.
Number of plants
Sample site Soil moisture (units) Species E Species F Species G
1 20·2 11 15 12
2 23·4 13 14 11
3 22·1 12 16 10
4 24·5 15 17 15
5 26·6 18 13 12
6 28·4 19 15 14
(i) State which species has its distribution most affected by the soil moisture levels.
Species
(ii) Calculate the average number of plants per sample site for species F.
Space for calculation
plants
[Turn over
1
1
*X807750124*page 24
MARKS DO NOT WRITE IN
THIS MARGIN
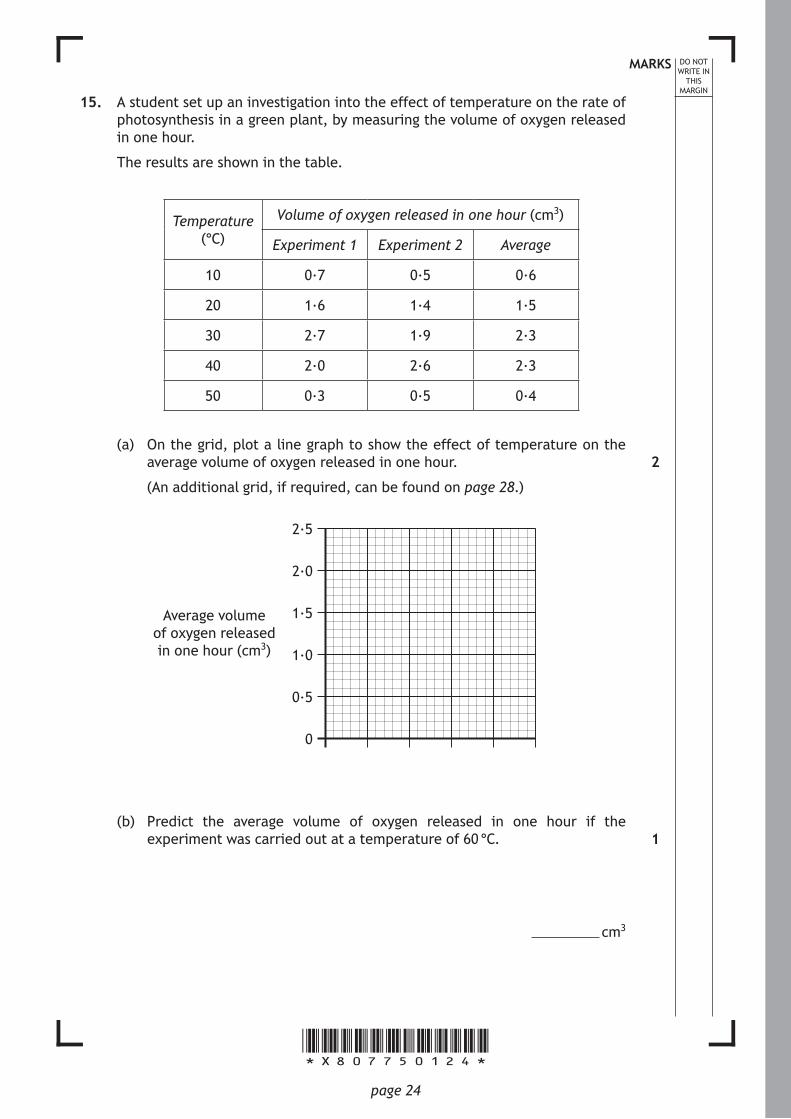
15. A student set up an investigation into the effect of temperature on the rate of photosynthesis in a green plant, by measuring the volume of oxygen released in one hour.
The results are shown in the table.
Temperature (°C)
Volume of oxygen released in one hour (cm3)
Experiment 1 Experiment 2 Average
10 0·7 0·5 0·6
20 1·6 1·4 1·5
30 2·7 1·9 2·3
40 2·0 2·6 2·3
50 0·3 0·5 0·4
(a) On the grid, plot a line graph to show the effect of temperature on the average volume of oxygen released in one hour.
(An additional grid, if required, can be found on page 28.)
0
0∙5
1∙0
1∙5
2∙0
2∙5
Average volume of oxygen released in one hour (cm3)
(b) Predict the average volume of oxygen released in one hour if the experiment was carried out at a temperature of 60 °C.
cm3
2
1
*X807750125*page 25
MARKS DO NOT WRITE IN
THIS MARGIN
15. (continued)
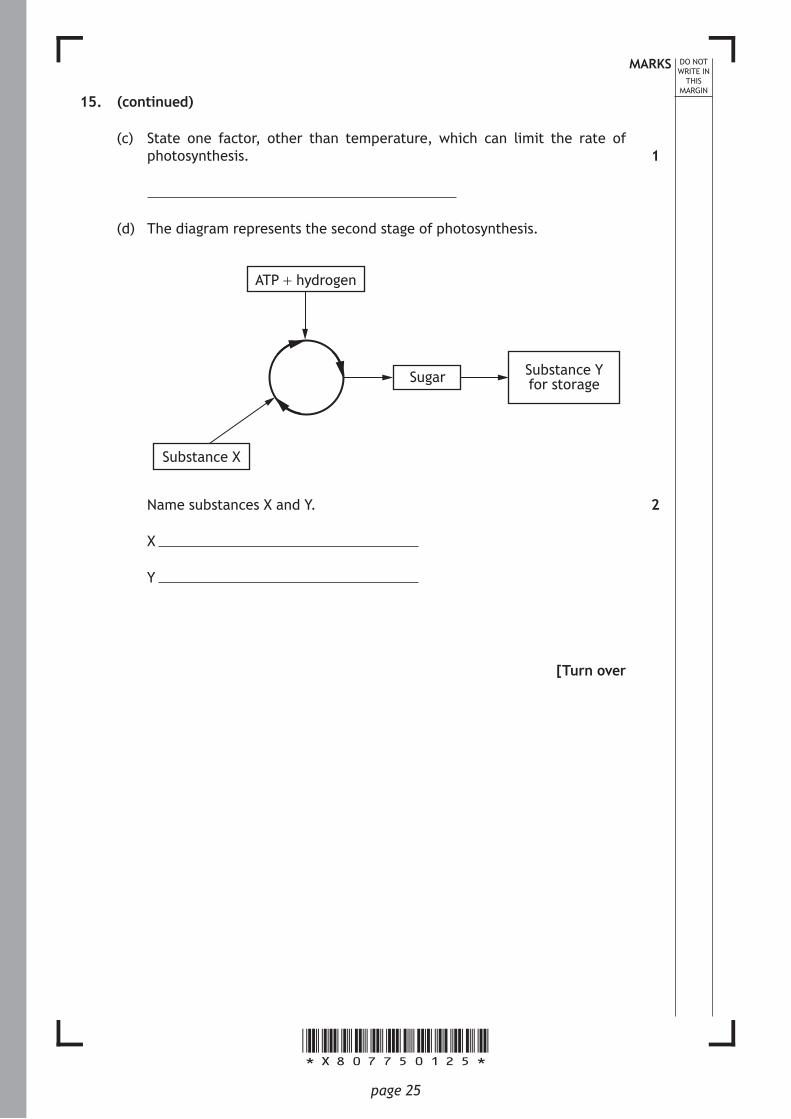
(c) State one factor, other than temperature, which can limit the rate of photosynthesis.
(d) The diagram represents the second stage of photosynthesis.
Substance Y for storageSugar
ATP + hydrogen
Substance X
Name substances X and Y.
X
Y
[Turn over
1
2
*X807750126*page 26
MARKS DO NOT WRITE IN
THIS MARGIN
16. A gardener treated the soil in the area where he planted vegetables with a chemical to increase the yield.
(a) (i) The chemical added to the soil by the gardener contained nitrates.
Give the general name for this type of chemical.
(ii) Describe the use that plants make of nitrates.
(iii) When the vegetables were picked and weighed, the total yield was 42 kilograms. The previous year the total yield was 35 kilograms.
Calculate the percentage increase in yield.
Space for calculation
%
1
1
1
*X807750127*page 27
MARKS DO NOT WRITE IN
THIS MARGIN
16. (continued)
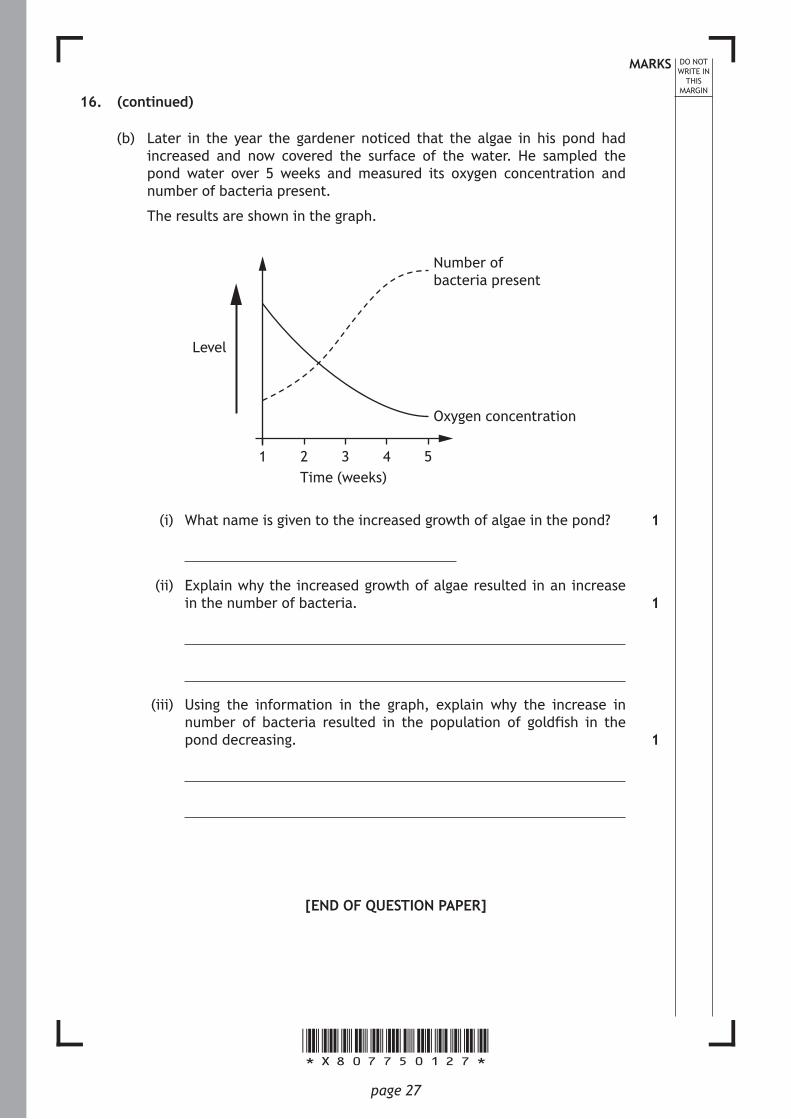
(b) Later in the year the gardener noticed that the algae in his pond had increased and now covered the surface of the water. He sampled the pond water over 5 weeks and measured its oxygen concentration and number of bacteria present.
The results are shown in the graph.
Time (weeks)
Level
Number of bacteria present
1 2 3 4 5
Oxygen concentration
(i) What name is given to the increased growth of algae in the pond?
(ii) Explain why the increased growth of algae resulted in an increase in the number of bacteria.
(iii) Using the information in the graph, explain why the increase in number of bacteria resulted in the population of goldfish in the pond decreasing.
[END OF QUESTION PAPER]
1
1
1


