N88-23740 COMPUTATIONAL WING DESIGN STUDIES RELATING TO NATURAL LAMINAR FLOW Edgar G. Waggoner NASA Langley Research Center Hampton, Virginia 23665 SUMMARY Two research studies are described which directly relate to the application of natural laminar flow (NLF) technology to transonic transport-type wing planforms. Each involved using state-of-the-art compu- tational methods to design three-dimensional wing contours which generate significant runs of favorable pressure gradients. The first study supported the Variable Sweep Transition Flight Experiment and involves design of a full-span glove which extends from the leading edge to the spoiler hinge line on the upper surface of an F-14 outer wing panel. 1_oundary-layer and static- pressure data will be measured on this design during the supporting wind-tunnel and flight tests. These data will then be analyzed and used to infer the relationship between cross- flow and Tollmien-Schlichting disturhances on lahqinar boundary-layer transition. A wing was designed computationally for a corporate transport aircraft in the second study. The resulting wing design generated favorable pressure gradients from the leading edge aft to the mid-chord on both upper and lower surfaces at the cruise design point. Detailed descriptions of the computational design approach are presented along with the vari- ous constraints imposed on each of the designs. Wing surface pressure distributions, which slipport the design ohiectives and were derived from transonic three-dimensional analysis codes, are also presented. Current status of each of the research studies is included in the summary. INTRODUCTION Computational fluid dynamics (CFIg) is playing an increasingly important role in the aircraft design process. All major airframers are using CFD as a complement to wind- tunnel and flight testing. This can increase the efficiency of test facility utilization as well as significantly reduce the risks associ- ated with a development program. Increases in computer speed and storage capabilities, in conjunction with developments in code solution algorithms and grid generation, have fostered development of powerful computer codes. Codes have been developed which can solve the complex transonic flow field around a multi-component aircraft configuration (refs. 1 and 2). In addition, these codes have proven to be robust and reliable, and they can be routinely relied upon in a preliminary design environment. Two studies are described in this paper. The first is concerned with understanding the interaction of crossflow and Tollmien- Schlichting (TS) instabilities on laminar boundary-layer transition. The second study is an actual design of a natural laminar flow wing. Although each of these studies is concerned with various aspects of laminar flow, the theme of this discussion is the application of computational techniques in support of each of these programs. Each study involved designing a wing or portion of a wing to generate a pressure distribution with certain characteristics, State-of-the-art computational techniques were used to accomplish the design tasks associated with each study. The designs will be experimentally verified through wind- tunnel testing at the NASA Langley Research Center. A brief description of the various two- and three-dimensional computer codes is included in the following section. Subsequent sections describe each of the studies in some detail. Included are descriptions of study objectives and constraints which impacted the design. A rather detailed description of the design process is included, along with appropriate examples of results at key stages during the design. Current status of the i_REClEDING PAGE _,LANK _ _ 67 https://ntrs.nasa.gov/search.jsp?R=19880014356 2018-05-01T16:10:42+00:00Z
Transcript
N88-23740
COMPUTATIONAL WING DESIGN STUDIES RELATING TO
NATURAL LAMINAR FLOW
Edgar G. WaggonerNASA Langley Research Center
Hampton, Virginia 23665
SUMMARY
Two research studies are described
which directly relate to the application of
natural laminar flow (NLF) technology to
transonic transport-type wing planforms.
Each involved using state-of-the-art compu-
tational methods to design three-dimensionalwing contours which generate significant
runs of favorable pressure gradients. The
first study supported the Variable Sweep
Transition Flight Experiment and involves
design of a full-span glove which extendsfrom the leading edge to the spoiler hinge
line on the upper surface of an F-14 outer
wing panel. 1_oundary-layer and static-
pressure data will be measured on this design
during the supporting wind-tunnel and flight
tests. These data will then be analyzed and
used to infer the relationship between cross-
flow and Tollmien-Schlichting disturhanceson lahqinar boundary-layer transition. A wing
was designed computationally for a corporate
transport aircraft in the second study. Theresulting wing design generated favorable
pressure gradients from the leading edge aft
to the mid-chord on both upper and lower
surfaces at the cruise design point. Detailed
descriptions of the computational design
approach are presented along with the vari-ous constraints imposed on each of the
designs. Wing surface pressure distributions,
which slipport the design ohiectives and werederived from transonic three-dimensional
analysis codes, are also presented. Currentstatus of each of the research studies is
included in the summary.
INTRODUCTION
Computational fluid dynamics (CFIg) is
playing an increasingly important role in the
aircraft design process. All major airframers
are using CFD as a complement to wind-
tunnel and flight testing. This can increase
the efficiency of test facility utilization as
well as significantly reduce the risks associ-
ated with a development program. Increases
in computer speed and storage capabilities,
in conjunction with developments in code
solution algorithms and grid generation, have
fostered development of powerful computercodes. Codes have been developed which can
solve the complex transonic flow field around
a multi-component aircraft configuration
(refs. 1 and 2). In addition, these codes have
proven to be robust and reliable, and theycan be routinely relied upon in a preliminary
design environment.
Two studies are described in this paper.
The first is concerned with understanding theinteraction of crossflow and Tollmien-
Schlichting (TS) instabilities on laminar
boundary-layer transition. The second studyis an actual design of a natural laminar flow
wing. Although each of these studies is
concerned with various aspects of laminar
flow, the theme of this discussion is the
application of computational techniques in
support of each of these programs.
Each study involved designing a wing or
portion of a wing to generate a pressuredistribution with certain characteristics,
State-of-the-art computational techniques
were used to accomplish the design tasks
associated with each study. The designs will
be experimentally verified through wind-
tunnel testing at the NASA Langley ResearchCenter.
A brief description of the various two-
and three-dimensional computer codes isincluded in the following section. Subsequentsections describe each of the studies in some
salient observations made during the twostudies is included in the conclusion.
COMPUTATIONAL METHODS USED
IN THE STUDIES
Several computer codes have been used
to analyze the various configuration models
and designs which have been evaluated during
the present studies. Three-dimensionalanalyses have utilized both a full potential
code, which is coupled with a three-dimensional integral boundary-layer code
(TAWFIVE) (ref. 1) and an extended small-
disturbance analysis code (Wt_PPW) (ref. 2)
which has been verified extensively at NASALangley Research Center (refs. 3 and 4)°
Three-dimensional automated design capabi-lity was realized using a Lockheed Georgia
modified version of the FLO-221'_Ih4 code (ref.
5). The code has _,lcFadden's design algo-
rithm (ref. 6) and a quasi-Newton's method
optimization procedure as an integral part ofthe code, The NYU airfoil code (ref. 7) and
the two-dimensional option in the WBPPW
code were used to provide the two-
dimensional analyses. High-lift characteris-
tics of airfoil designs were predicted with a
subsonic panel code which includes an inte-
gral boundary-layer calculation (ref. 8).
WBPPW Analysis Code
The Wing-Body-Pod-Pylon-Winglet code,
developed by Charles Boppe of Grumman
Aerospace Corporation, is characterized by a
unique grid-embedding technique which
provides excellent flow-field resolution about
various configuration components. The code
solves for the flow field about a wing-fuselage configuration which can include
engine pods or stores, wing pylons, and
wingtip-mounted winglets at transonic
speeds. Using finite-difference approxima-
tions, a modified small-disturbance poten-
tial-flow equation is iteratively solved in a
system of multiple embedded grids. Themodifications to the classical small-distur-
bance equation are in the form of extra
terms, which, when added to the equation,provide more accurate resolution of shock
waves with large sweep angles and a better
approximation of the critical velocity wherethe full potential equation changes fro:n
elliptic to hyperbolic in type.
The computational space used in the
method is filled with a relatively crude
global grid system. This grid is stretcl_ed to
planes corresponding to infinity in all direc-
tions. The global grid basically serves two
purposes. It provides the proper representa-
tion of the effects of the configuration on
the far-field and, conversely, the effects ofthe far-field conditions on the flow field near
the configuration. In addition, the crude grid
provides the channels of communication
between the various embedded fine grids.
Fine grid regions around components of
interest are embedded into the global contin-
uous grid. The fine grids are distributed
along the wing span and, if desired, may also
encompass the fuselage, engine pods or
stores, pylons, and/or a winglet. Within thefine grids, the resolution is much enhanced
relative to the global grids. This allows fargreater resolution in areas where flow-field
gradients are large.
Viscous effects are approximated in the
code by coupling a _nodified gradshaw bound-
ary-layer computation to the finite-differ-
ence potential-flow solution. The modified
method provides a technique to extend a
two-dimensional boundary-layer calculation
to account for first-order sweep effects (refo
9). The viscous effects are incorporated in
the solution by adding the boundary-layer
displacement slopes to the wing surface
slopes. This modifies the wing surface to an
equivalent "fluid' wing shape which is then
analyzed by the potential flow code.
TAWFIVE Analysis Code
A computer code for the Transonic
Analysis of a Wing and Fuselage with Inter-
acted Viscous Effects (TAWFIVE)was also
used in the study. The code utilizes theinteraction of an inviscid and a viscous flow
solver to obtain transonic flow-field solutions
about wing-fuselage combinations. The outerinviscid flow field is solved using a conserva-
tive, finite-volume, full-potential method
68
basedon FLO-30 by Caughey and Jameson.No modifications were made to the internalgrid-generation algorithm in FLO-30, whichis a body-fitted, sheared, parabolic coordi-nate system.
Viscous effects are computed using a
compressible integral :nethod which calcu-
lates three-dimensional boundary layers for
wings. The code has the capability of
computing laminar or turbulent boundary
layers with the methods of Stock (ref. 10)
and Smith (ref. 11), respectively. An impor-tant addition to the code is Streett's treat-
ment of the wake (ref. 12). The wake model
used in FLO-30 was replaced with a model
which satisfies flow tangency on the wake
displacement body and the pressure jump
condition resulting from wake curvature.
These changes in the code can make signifi-cant differences in results obtained on vari-
ous configurations (ref. 12).
FLO-22NM Design and Analysis Code
The FLO-22N,_..l (ref. 6) code is a wing
alone transonic code which has the applica-tion of design and optimization algorithms
included as solution options. The FL()-22
(refo 13) solver has provided reliable noncon-servative solutions to the full potential
equation for a nun_ber of years. A design
algorithm is included in the code based on
the work of Bauer, Garabedian, and
_slcFadden (ref. 6). By relating wing section
contour changes to incremental changes in
surface pressure distributions, a systematic
procedure is established to modify a wing
contour to achieve a desired target pressuredistribution. Modifications to the original
algorithm were made at Lockheed Georgia
Company to extend the regions of the wing
where the algorithm is applied. An option to
employ a quasi-Newton's method optimiza-
tion procedure (ref. 14) is available in the
code. However, this option was not
exercised during this study.
NYU Airfoil Code
The New York University airfoil analysis
code written by Bauer, Garabedian, Korn,and Jameson (ref. 7) is used extensively by
many researchers to provide two-dimensional
viscous analyses of airfoils. The inviscid
solution solves for the steady, isentropic,irrotational flow about an airfoil contour.
Viscous corrections are provided by adding
the turbulent displacement thickness to theairfoil surface. There is no laminar boundary
layer calculated by the code. The momen-tum thickness is initialized at the transition
point, which can be set arbitrarily. Using the
turbulent boundary-layer method of Nash and_Aacdonald (ref. 15), the boundary-layer
characteristics are computed using the
results from the potential flow analysis and
the airfoil geometric characteristics.
High-Lift Code
The high-lift code (ref. 8) developed at
Lockheed Georgia Company and modified at
NASA-Langley defines the subsonic viscidattached flow about two-dimensional multi-
component airfoils. The viscous solution is
obtained by interacting potential flow and a
boundary-layer solution for the flow field,Potential flow approximations are _.qade
using a distributed vortex concept with thevortex singularity comprising the fundamen-
tal solution to the Laplace equation.
Boundary-layer solutions employ representa-tions of the laminar and turbulent boundary
layer along with atransition model. Laminar
boundary-layer separation criteria have alsobeen included in the code and are used in the
present study as an indication of low-speedmaximum lift coefficients.
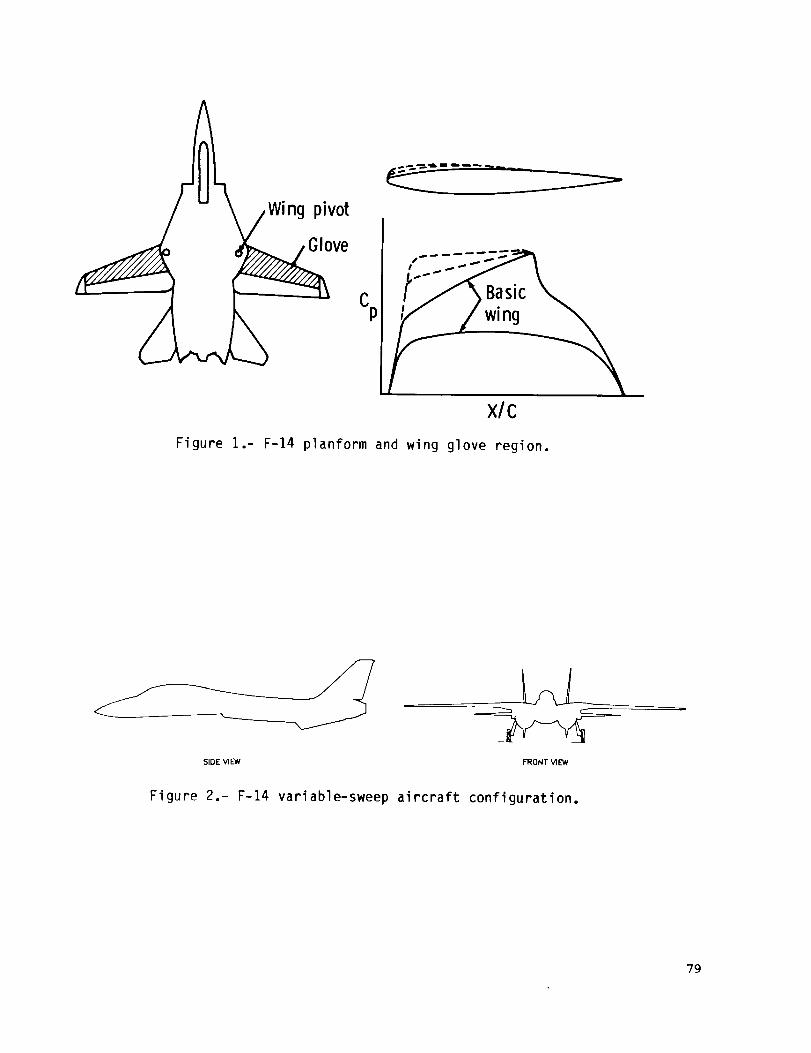
F-14 VARIABLE SWEEP TRANSITION
FLIGHT EXPERIMENT
During the mid 1970's, NASA began the
Aircraft Energy Efficiency (ACEE) program
to develop fuel conservation technology for
commercial transports (ref. 16). One aspect
of the ACEE program that has receivedconsiderable research attention is the deve-
lopment of technology for viscous-drag
reduction through natural laminar flow (NLF)and laminar flow control (LFC). Recent
research at NASA has been encouraging
relative to obtaining significant extents oflaminar flow with either method or a combi-
nation of both.
69
An important question which must be
answered in order to design wings which
effectively utilize natural la,_inar flow
relates to boundary-layer transition. It is
known that for boundary layers in a three-dimensional flow environr_ent there is an
interaction between crossflow (CF) and TS
instabilities that can cause transition to
occur in an otherwise favorable environ_ent
(i.e., favorable pressure gradient, smooth
surface, etc.) (ref. 17). In order to assist in
identifying and quantifying the influence ofthe CF-TS interaction on wing boundary-
layer transition, data are needed for variouscombinations of favorable pressure gradients,
Reynolds nu_nbers, and wing sweep angles.
To establish a data base for the transi-
tion data, NASA Langley and NASA Ames-Dryden have defined a variable sweep transi-tion flight experiment (VSTFE) utilizing the
F-14 aircraft. The objectives of this flight
test are to obtain in-flight wing pressure and
boundary-layer data which will be used to
develop a reliable laminar boundary-layertransition prediction method. The approach
to obtaining the flight data is to modify the
F-14 wing outer panel by 'gloving" on a foam
and fiberglass panel contoured such that it
generates favorable pressure gradients on theupper surface over a wide range of flight
conditions (fig. 1). By using data obtained
from analyses of the wing pressure distribu-
tions with a boundary-layer stability code
and from flight-measured transition data,inferences will be made relative to the
interaction of C F and TS instabilities on
boundary-layer transition.
Extensive computations have been
performed in support of the proposed flight-
test program. These range from verificationof the potential flow methods to the actual
design of the contour for the outer panel
glove, l,_any of the preliminary computations
are reported in reference 18. One of the
intents of this paper is to demonstrate how
the computations have been utilized and
relied upon during the glove design phase ofthe VSTFEo Initially pertinent questions
were answered regarding the use of small-
disturbance and full-potential transonic
analysis codes. Questions were addressed
relative to geometric considerations result-
ing from the co_nplexity of the F-14 aircraft
(figs. 1 and 2), the applicability of two-dimensional codes to the design problem, and
the ability of the three-dimensional codes to
accurately predict the flow field on theconfiguration. Although these questions are
discussed in reference 18, in the interest of
completeness of the present discussion it
seems appropriate to include a brief discus-sion of the code validation efforts which
involved comparison of code prediction with
flight test data.
Comparison of Computations and
Flight-Test Data
Some wind-tunnel pressure data existed
for the F-14; however, the data were sparse
for the primary wing sweep angle (ALE =20°), the Mach number, and the lift range of
interest in this study. In January 1984, a
flight test was conducted on NASA's F-14A
aircraft 1-X at the Dryden Flight Research
Facility (ref. 19). The objective of the flight
test was to explore the proposed flight
envelope for the VSTFE and to obtain wing
pressure data on the baseline aircraft.
"Strip-A-Tubes" were bonded to the wing
surface at four locations along the wing
span. The pressure tubes were aligned withthe free-stream flow when the wing leading
edge was swept 19 ° . For this sweep angle,
the tube spanwise positions corresponded to
40, 56, 73, and 87 percent of the semispan.
Wing pressure data were obtained over awide range of _,tach numbers, lift coeffi-
cients, altitudes, and wing sweeps. The
ranges of the various parameters are sum-marized in the table below.
Table 1.- Flight-Test Conditions
Leading-edge sweep_4ach number
Altitude, ftLift coefficient
200-30 °
0.6-0.8525K-35K
1-2g flight
From these data, four flight points were
designated to be of primary interest. Three
of these points correspond to corners of the
70
flight envelope for the VSTFE, and the
remaining point was an intermediate flight
condition. The four points are listed asfollows:
Point M Altitude, ft C L
1 0.70 25,000 0.35
2 0.70 35,000 0.52
3 0.75 25,000 0.33
4 0.80 35,000 0.39
Points 1 and 2 correspond to tile mini-mum and maximum altitudes where data will
be obtained for level flight at M = 0.7, whilepoint 4 corresponds to the maximum altitudelevel flight at _A = 0.80. All of these data
are for a wing sweep angle of 19 °. Although
data were obtained at sweep angles to 35 ° ,
the "Strip-A-Tubes" were not aligned withthe free-stream flow at the higher sweep
angles. This misalignment could easily have
compromised the corresponding data, since
the tubes are raised off the wing surface.
These data were used to comparepredictions from the TAWFIVE and WBPPW
codes. The computational models for each of
these codes included a wing and fuselage;
however, the models did not include either
horizontal or vertical tails. Therefore, in
order to circumvent the problem of matching
the total lift coefficient, all analyses were
performed at the flight _A.ach number andmeasured angle of attack. The WBPPW code
was run for 100 crude and 200 crude/fine
iterations. Transition was specified at 5-
percent of the chord on the upper and lower
surfaces. The 2-D strip boundary-layersolution was interacted with the inviscid
solution every 20 iterations. The TAWFIVE
code was run for 100 crude, 100 medium, and200 fine-mesh iterations. Transition was
specified at the leading edge on both
surfaces. Viscous effects were incorporated
into the solution by calculating the full 3-D
boundary layer three times (at iterations 100,150, and 200) on the finest mesh. Solutionresiduals obtained were of the order of 10 -4 .
The comparisons between the computa-tions and the flight-test data are presented
to discern the types of correlation possible
between the experimental and computational
data obtained in an engineering environmentrather than to judge which code is 'best" or
'worst.' Two important points need to be
reiterated in this regard:
1. Ihe codes ,were not run to
ultimate convergence, rather,
they were converged to engi-
neering accuracy.
, No attempt was made to match
lift coefficient, leading-edge
pressure expansion, etc. Solu-tions were obtained at the
flight k_ach number, angle ofattack, and altitude,
Overall, the comparisons presented in
figures 3 to 6 are quite good. Before addres-
sing specific points observed in the compari-
sons, several broad observations are appro-priate. There are indications that the
leading-edge slat is deflecting under flight
load conditions. Evidence of this is apparent
to some degree in each of the figures.
Notice the pressure distributions over the
forward 10 percent of the chord on the uppersurface. The characteristic of the flow
expansion at the leading edge followed by a
compression is suspicious, particularly, since
neither code predicts this type of characte-
ristic. Evidence to support this hypothesiswas obtained when static Ioadings correspon-
ding to the flight loads were applied to the
wing. 13y measuring surface deflections, itwas obvious the slat was deflecting relative
to the main wing structure.
The other observation concerns differ-
ences in the code predictions. Where differ-
ences in leading-edge expansion are observed
(i.e., fig. 4), the full-potential code predicts
more expansion at the leading edge than thesmall-disturbance code. This is consistent
with the code formulation. Two pointsshould be mentioned concerning shock waves
(figs. 5 and 6). The grid in the WBPPW code
has approximately three times higher resolu-tion near the shock location than the
TAWFIVE code (0.01x/c vs. 0.03x/c). This
accounts for the "sharper' shock resolution
observed in the WBPPW results. In addition,
71
the shock is located forward in the WBPPW
code relative to the TAW FIVE code. This
difference can be traced to tile basic differ-
encing scheme formulations employed in thecode. The WBPPW code uses nonconserva-
tive differencing, while the TAW FIVE code
uses a conservative differencing scheme.The most obvious effect of this difference is
the location of shock waves. Nonconserva-
tive differencing tends to affect the solutionin the same manner as viscous effects so that
shock waves tend to be predicted furtherforward.
The data for level flight at _,3,= 0.7 and
25,000 feet are presented in figure 3. The
comparisons between these data and experi-
ment are excellent at both span locations
presented. The loading at the outboard span
location is slightly overpredicted by each of
the analysis codes.
The high altitude (35,000 feet) , _,_= 0.70
data are presented in figure 4. This case
shows the maximum effect of leading-edge
slat deflection on the pressure distributions.Note also that the maximum difference in
the computational predictions at the leading
edge is observed here. Aft of 20-percent
chord, the comparisons are excellent on the
upper surface. However, the predictions of
lower surface pressure distributions are
significantly different from the experimentat the inboard station. The mechanism
driving these differences is not fully under-stood at this time.
Quite good comparisons of computations
and experiment are obtained for the inter-
mediate (_ = 0.75) case presented in figure5. Evidence of tile differences in shock
prediction is observed at the inboard span
location. However, the data for the high
altitude (35,000 feet), high _tach (M = 0.80)
case present a more graphic example of the
code differences in figure 6. Note the
agreement between the codes and the data
over the forward part of the upper surface
ahead of the shock. Tile shock predicted
from the TAWFIVE code is approximately 5-
percent chord aft and smeared relative to
the shock predicted by the WBPPW code.
This is consistent with the previous discus-s ion.
Overall, the agreement between the
flight-test data and the computationalpredictions from each code is excellent. All
the differences observed between tile compu-
tational results and between the computa-
tional results and experiment can be
accounted for, except those shown in figure 4
for the pressure distributions on the rear partof the lower surface. These particular
differences will not impact the way the
codes will be applied in the design proce-dures.
Glove Design Constraints
Before a detailed description of the
design steps and the supporting data are
presented, the physical constraints of theactual modification should be addressed.
These constraints had a significant impact on
the design process. Although the constraints
changed often over the course of the design
study, only the final constraints and support-
ing rationale will be presented herein.
The wing upper surface was allowed to
be modified from the leading edge aft to
approximately the 60-percent chord line._Aodifications to the lower surface were
limited to the first 10 percent of the chord.
The upper surface constraint was imposed tostop the _,love modification in front of the
spoiler hinge line, since the spoilers are used
for roll control over a portion of the flight
envelope. Consideration of the techniques
employed in manufacturing the glove was
responsible for the lower surface constraintbeing imposed.
Instrumentation leads were to be routed
inside the leading edge of the glove, hence it
was necessary to extend the glove leadingedge 2 inches in front of the actual leading
edge of the wing. There was also concern
over slat movement under flight-loading
conditions. This could have possibly caused
undesirable contour changes in the glove
shape. To minimize this possibility, the
glove thickness was constrained to be aminimum of 0.65 inches over the upper
surface. Under static loading conditions this
thickness of foam and fiberglass was suffi-
"/2
cient to absorbany relative movementof theslot and the main wing element. This mini-mum thickness constraint in turn posedanother constraint. In order to maintainadequate spoiler effectiveness, the thicknessof the glove at the spoiler hinge line waslimited to a maximumof 1 inch.
It is obvious that these are quite strin-gent constraints from a design standpoint.
Detailed descriptions of the design steps and
supporting data are included in the followingdiscussion.
Glove Design Procedures
Rased on the trends which were observed
in the wing pressure data and the excellent
comparisons which were obtained with thepotential flow analysis codes, it was felt that
an integrated two-dimensional/three-
dimensional analysis and design process could
be effectively formulated. The procedure,
which evolved during the design effort, was
not formulated a priori but did follow this
loosely defined integrated approach.
The design point was chosen which
corresponded to a "worst case" condition for
the targeted M ach number of interest (M =
0o70). Because of the difficulty of maintain-
ing favorable pressure gradients near the
wing leading edge, the angle of attack for 1-g flight at the highest altitude in the test
envelope was designated the design point. If
a slightly favorable pressure gradient could
be generated from the leading edge to the
pressure rise at that condition, then reducingthe altitude, hence the total lift coefficient
and angle of attack required for level flight,
would yield a rnore favorable pressure gradi-
ent, The design point corresponded to 1-g
flight at /vl = 0.70 and 35,000 feet.
Five defining stations were chosen to be
recontoured with linear lofting utilized
between the defining stations. These
corresponded to the inboard and outboard
extent of tile gloved region, where laminar
flow was desired, and three intermediate
defining stations. By relying on two-
dimensional analyses, simple sweep correc-
tions, and design procedures which generate
modifications to pressure distributions within
specified physical constraints, tipper surfacecontours were defined for each defining
station which ,net the aerodynamic and
physical constraints. The design procedure
employed was a relatively simple algorithmwhich relates changes in local surface curva-
ture to increments in surface pressure coef-
ficients. The resulting curvature changes
could be integrated to yield surface ordinate
increments while monitoring the various
physical constraints on the glove contour.
Pressure distributions for a range of lift
coefficients for the mid-span defining station
are presented in figure 7. A sectional lift
coefficient of 0.60 corresponds to the "worst
case," and the other values to less severecases. Note the favorable pressure gradient
aft to the pressure rise for the range of lift
coefficients presented.
After two-dimensional designs were
completed for the five defining stations, tile
question of three-dimensional effects was
addressed. Tile recontoured outer panel wasfnodeled and analyzed in a three-dimensional
analysis and design code (ref. 5). Thisallowed the identification of adverse three-
dimensional effects resulting frown the wing
planform, twist distribution, etc. Twoadverse characteristics were observed in the
three-dimensional pressure distribution (fig.
8) which were not evident in the two-
dimensional analyses. This includes a
pressure peak at the wing leading edge and aflow expansion just forward of the shock. Of
course, it was desirable to remove the
adverse pressure gradient associated with theleading-edge pressure peak and to minimize
the flow acceleration just forward of the
shock. As described previously, the code has
a design option available. A target pressuredistribution was defined at each of the
defining stations to minimize the adverseeffects (fig. 8)° The design option in the
code was then employed to modify the wing
outer panel to minimize the difference
between the predicted and target pressure
distributions. This step in the design process
yielded modified contours for each of thedefining stations.
73
These five new defining station airfoilswere examined relative to the smoothness of
their curvature distributions and constraint
violations. Where appropriate, refairing and
smoothing of the new contours were
employed. This yielded final smoothed
contours which met the design constraints at
each of the defining stations. A typical
contour is presented in figure 9 showing its
relationship to the F-14 baseline contour at
that wing station. Two-dimensional analyses
were used to verify that no adverse effects
had inadvertently shown up in the pressuredistributions (fig. 10).
However, final computational verifica-
tion of the design was realized by analyzing
the entire configuration (fuselage, nacelles,
strake, and outer panel) in the TA'NFIVE
code. Results presented in figure 11 show
that the design objectives were realized over
the range of lift coefficients correspondingto the altitudes of interest at ht = 0.7. Data
are also presented for a glove designed by
Boeing for a design M ach number of 0.8.
This glove will be flown concurrently with
the 1'_ASA-designed glove. Data arepresented for the _,i = 0.7 and _l = 0.8 flight
conditions. The boundary-layer analysis for
the high altitude case at M = 0.8 (fig. 11(c)),
gave no evidence of flow separation. Since
the computational analysis predicted accep-
table results and the design constraints were
met, the glove design was frozen at this
point.
VST F E Status
Glove design has been completed for theVSTFE, and fabrication is underway for a
wind-tunnel test to be conducted in the NTF
during the early summer of 1985. ]he objec-tives of the test are to obtain data to verify
the glove design and safety-of-flight data for
support of the flight test program. Flight
test instrumentation techniques will be
validated in a program which will be flown inthe late summer or early fall of 1985. A
"clean-up' glove has been fabricated for the
F-14 outer panel which employs the physicalconstraints described previously and corre-
sponds to the baseline F-14 outer panel
contour. Any manufacturing or instrumen-
tation problems uncovered during this pro-
gram can be addressed before the NLF glove
experiment is flown, l_anufacture of the
NLF glove will commence in the last quarterof 1985 with the flight test following 9 to 12months later.
HIGH ASPECT RATIO NLF WING
NASA has been interested in extending
the applicability of the concept of natural
laminar flow into the transonic speed regime,
in addition to low- and medium-speed appli-
cations (ref. 16). In support of this objective,a program was undertaken to incorporate the
concept of NLF into a high aspect ratio, low
sweep wing designed for a corporate trans-
port configuration. ,_,uch of the design work
had been accomplished prior to NASA's
involvement in the program including identi-fication of the configuration characteristics
such as fuselage geometry and wing planform
(fig. 12). However, the wing section contour
had not been defined, and this provided the
basis for this discussion. An objective was
identified to design a wing contour whichwould generate a significant extent of lami-
nar flow on both the upper and lower sur-
faces at a transonic cruise design point. In
addition, there were aerodynamic and geo-
metric constraints imposed on the design. Inorder to provide adequate volume for fuel
and for landing gear storage, the wing was
required to have a mininlum thickness to
chord ratio of 12.5 percent. The configura-
tion was powered by a single engine which
dictated a rather low landing speed require-
ment. To meet this requirement, a largewing area had been specified along withairfoils which had a maximum sectional lift
coefficient of 3.8. The large wing area
translated to a cruise design point at M = 0.7
at a wing lift coefficient of 0.25. A self-
imposed constraint was that the design offer
acceptable aerodynamic characteristics with
a fully turbulent boundary layer on the wing
(as opposed to the long runs of laminar flow)
over the flight envelope.
Computational Design
Again an integrated two- and three-
dimensiona( computational design approachwas identified. Both two-dimensional and
three-dimensional analysis codes which had
?4
been verified for transport application wereidentified to be used. This includes the two-dimensionalGarabedianand Korn (ref. 7) andhigh-lift codes (ref. 8). Three-dimensional
analyses were provided by the small-disturbance WBPPW code (ref. 2) and the
full-potential TAWFIVE code (ref. 1).
As previously discussed, the wing plan-
form had be e_ specified as having a wingarea of 250 ft , an aspect ratio of 8.0, and a
taper ratio of 0.35. The quarter-chord of the
wing had essentially no sweep, which mini-mized crossflow influences on the laminar
boundary layer. In addition, except for
interactions in the wing-body juncture
regions and near the wing tip, the flow field
was essentially two-dimensional. Thisallowed much of the contour modification
work to be accomplished two dimensionally,
employing three-dimensional analyses to
verify the configuration characteristics.
The initial airfoil design was a deriva-
tive of a medium-speed NLF airfoil design by
Viken (ref. 20). This airfoil had been
designed for a lift coefficient of 0.4, bl = 0.4,
and a Reynolds nufnber of 10 million. At the
design condition, the airfoil generated favor-
able pressure gradients back to approxi-
mately 70 percent of the chord on the upper
and lower surfaces. Viken's medium-speed
design was scaled down for the higher speed
applications, and the trailing edge was modi-
fied to account for the lower design lift
coefficient. Analysis of the resulting airfoil
is included in figure 13 for M = 0.70 and asectional lift coefficient of 0.25. Two fea-
tures of the flow over the airfoil at these
conditions caused concern. The slight pres-
sure peak at the lower surface leading edgewas not desirable from a laminar flow stand-
point. Of greater concern, however, was the
pressure gradient through the pressure rise
(at approximately 70 percent of the chord).
Computational analyses predicted boundary-
layer separation at these conditions. At
overspeed conditions, the boundary-layer
separation would be worse.
A computational 'cut and try' approachwas employed to modify the initial airfoil
contour. Using two-dimensional analysis as a
guide, the mid-chord region of the upper and
lower surfaces and the leading edge of thelower surface were modified to eliminate the
undesirable flow characteristics at the design
condition. Two-dimensional analysis of the
final airfoil design is presented in figure 14along with the pressure distribution fro_ the
initial design. Note the softening of the
gradients through the pressure rise and themodification of the lower surface leading-
edge pressure expansion. It is also important
to note that the extent of favorable pressure
gradient has been reduced to approximately
50 percent of the chord on the upper surface
and 60 percent of the chord on the lower
surface. Analysis indicated no evidence of
flow separation at the design condition.
The two-dimensional analysis calculates
a turbulent boundary-layer skin-friction drag
coefficient as part of the viscous solution.
Estimates of skin-friction drag reduction can
be inferred from figure 15 based on an analy-
sis at two Mach numbers over a range ofsectional lift coefficients. Transition was
fixed at 10 percent of the chord for bothsurfaces for the forward transition case and
50 to 65 percent of the chord on the upperand lower surfaces for the aft transition
case. These show a reduction of turbulent
skin-friction drag ranging from 50 to 70
percent. Note that there is no estimate of
the contribution from the laminar boundary
layer. In addition, the reader should use theabsolute levels judiciously; however, the
relative differences are representative.
Up to this point, the discussion hascentered around two-dimensional design and
analysis. Three-dimensional analyses were
employed at appropriate checkpoints in the
design process to monitor the possible gener-ation of adverse three-dimensional effects.
An example of the three-dimensional analysis
is included in figure 16. The data presented
show the effect of varying the boundary-
layer transition location on the pressure
distribution on the inboard portion of the
wing span. As expected, these data show
little change in the pressure distribution;
however, more important is the fact that no
boundary-layer separation is predicted withthe forward transition location. These same
75
characteristics were evident at higher free-stream _,_ach numbers for cruise conditions.
Computational Wing Design Effort
Only a small arnount of data directly
concerned with the wing section design has
been included in this paper. However,
several areas were addressed during this
study which are not described in detail or
supported with data presentations herein. It
seems appropriate to describe the complete
wing design effort so that the reader can
obtain an appreciation for the various design
areas deemed important.
While the initial two-dimensional design
effort was underway, three-dimensional
analyses yielded initial spanwise loadingdistributions. This led to a rather involved
study to define an appropriate twist distri-bution for the wing. Tradeoffs were _nade
among various twist and airfoil section
distributions along the span. Final decision
will have to be made by factoring in econom-
ic and manufacturing considerations. During
the study, an evaluation was made on a
proposed planform modification. Analyses
yielded the effect of the modification on
design decisions which had already beenmade.
As the airfoil modifications were
completed, they were analyzed as part of the
complete configuration in the three-
dimensional codes. Although the majority of
the analyses were near the design point, off-
design analyses were performed and moni-tored to ensure that design goals were being
,net. Of pri,'nary importance for the off-
design case was the shock strength associ-
ated with the overspeed flight conditions.
In anticipation of improvements in the
configuration stall characteristics, two
drooped leading-edge extensions were
designed. Outboard leading-edge extensions
have been found to improve stability levels in
the vicinity of stall for certain classes of
general aviation aircraft. The two exten-sions designed corresponded to 2- and 3-
percent chord extensions and were employed
in the outboard 25 percent of the wing semi-
span. Transonic and low-speed analysis codeswere used to analyze these modifications.
Final Design Characteristics
The wing designed through the use of
computational procedures yielded excellent
aerodynamic characteristics. At the cruise
design point, favorable pressure gradients
were generated on the upper and lowersurfaces to 50 and 60 percent of the chord,
respectively. This should yield significantruns of laminar flow and reductions in
viscous drag. In addition, there was no
indication of boundary-layer separation when
transition _as specified at the wing leading
edge. The wing possessed good aerodynamic
characteristics from low-speed conditions up
to M = 0.80. Analyses indicated a drag
divergence _, ach number of 0.75 at cruise. Atrade-off between the aerodynamic and
propulsion characteristics might yield a
cruise _ach number slightly higher than
0.70. Through the use of airfoil modification
techniques, the drooped leading-edge exten-
sions were smoothly incorporated into the
airfoil contours. Overall, the computational
analyses indicated the wing achieved or
exceeded the originally specified perfor-
mance goals.
SUMMARY AND CONCLUSIONS
State-of-the-art potential flow analysis
techniques have been relied on to supporttwo design studies involving natural laminar
flow. Two- and three-dimensional small-
disturbance and full-potential equation
analysis codes have been verified for appli-
cation to the present studies by comparison
with experimental data. The various codes
were used in analysis and design modes to
meet the design objectives and constraints.
A process evolved during the studies which
effectively integrated the two- and three-dimensional codes. Results proved the
potential flow codes to be accurate and
reliable, and provided significant confidence
in the design to be investigated.
During the course of this preliminary
study, several salient observations were
made concerning the computer codes exer-
cised, These are summarized below:
76
1oTAWFIVE and WBPPWanalyses each
provided excellent prediction of flight-test
results when compared at flight angle of
attack, Mach number, and Reynolds numberfor the F-14 aircraft.
2, The integrated two- and three-
dimensional design process proved to beefficient. Detailed contour modifications
were made utilizing two-dimensional codes,
Adverse three-dimensional effects were
identified and appropriate contour modifica-
tions incorporated using three-dimensionaldesign and analysis codes,
3. The auto hated three-dimensional
design code was reliable. However, whencontour changes were required near shock
locations, additional fairing and smoothingwere requi red.
In conclusion, computational wing design
methodologies were successfully applied in
two unique programs° The two- and three-
dimensional aerodynamic codes used in thesestudies proved to be robust and reliable in a
stringent schedule environment. The auto-
mated design procedure yielded excellent
results, and the inclusion of that procedureor a similar one in the three-dimensional
analysis codes is being pursued, Some defici-
encies in the capabilities of the codes were
identified, and possible corrections and
improved running strategies are beingaddressed. The final accuracy of the designmethods will be evaluated when wind-tunnel
tests of both configurations are completed.
REFERENCES
1. _Aelson, N. D.; and Streett, C. L.:
TAWFIVE: A User's Guide. NASA TM-84619,September 1983.
2. goppe, C. W.; and Stern, M.:Simulated Transonic Flows for Aircraft With
Nacelles, Pylons, and Winglets. AIAA Paper80-130, January 1980.
3. Waggoner, E. G.: Computational
Transonic Analysis for a Supercritical Trans-
port Wing-Body Configuration. AIAA Paper
80-0129, Jariuary 1980.
4. Waggoner, E. G.: ComputationalTransonic Analysis for an Advanced Trans-
port Configuration with Engine Nacelles.
AIAA Paper 83-1851, July 1983.
5. Raj, P.; and Reaser, Jo S.: An
Improved Full-Potential Finite-Difference
Transonic-Flow Code (FLO22.5) for Wing
Analysis and Design. Lockeed California
Company Report 29759, November 1981.
6. Bauer, F.; Garabedian, P.; and
t_cFadden, G.: The NYtJ Inverse Swept WingCode. NASA CR-3662, January 1983.
7, Bauer, F,; et al,: Supercritical WingSections II. Lecture Notes in Economics and