N95- 27261 Design, Testing and Evaluation of Latching /./U 5q/ End Effector /_, B. Walker" and R. Vandersluis* Abstract The Latching End Effector (LEE) forms part of the Space Station Remote Manipulator System (SSRMS) for which Spar Aerospace Ltd, Space Systems Division is the prime contractor. The design, testing and performance evaluation of the Latching End Effector mechanisms is the subject of this paper focusing on a) ambient, thermal and vibration testing b) snare/rigidize performance testing and interaction during payload acquisition and c) latch/umbilical test results and performance. Introduction The Latching End Effector is a descendant of Shuttle Remote Manipulator System End Effector. The Space Station Arm required substantial increases in the life, load carrying capabilities, maintainability and reliability. The end effector design will a) provide compatibility with existing grapple fixture interfaces, b) provide a high- tolerance-to-misalignment payload interface and c) provide a stiff, backlash free interface with high load carrying capability. Lee Design Overview The complete Latching End Effector assembly (Figure 1) is an orbit replaceable unit. The Latching End Effector consists of the snare and rigidize subassembly inside the shell (Figure 2), and four latch/umbilical subassemblies outside the shell (Figure 3). The snare and rigidize mechanisms provides the capability to reduce large interface misalignments of free flying objects to the very accurate positioning required for latching. The latch mechanism was added to withstand large moment loads required by the larger payloads anticipated by Space Station use. An umbilical mechanism was built into the latch to provide an electrical connection for power and data across the end effector/payload interface. Latching End Effector Mechanism Design & Development The Latching End Effector design requirements for the space station were as follows: a) compatibility with existing grapple fixtures as well as new Power Data Grapple Fixtures for the Space Station. b) 30 second free flyer capture time (snare/rigidize and latch). c) increased on-orbit life (without maintenance). d) increased redundancy. e) stiff, backlash free interface. f) improved maintainability by on orbit replaceability of the entire end effector. * Spar Aerospace Lid, Space Systems Division, Brampton, Ontario, Canada https://ntrs.nasa.gov/search.jsp?R=19950020841 2018-07-01T07:42:15+00:00Z
Transcript
N95- 27261
Design, Testing and Evaluation of Latching
/./U 5q/
End Effector /_,
B. Walker" and R. Vandersluis*
Abstract
The Latching End Effector (LEE) forms part of the Space Station Remote ManipulatorSystem (SSRMS) for which Spar Aerospace Ltd, Space Systems Division is the primecontractor. The design, testing and performance evaluation of the Latching EndEffector mechanisms is the subject of this paper focusing on a) ambient, thermal andvibration testing b) snare/rigidize performance testing and interaction during payloadacquisition and c) latch/umbilical test results and performance.
Introduction
The Latching End Effector is a descendant of Shuttle Remote Manipulator System EndEffector. The Space Station Arm required substantial increases in the life, loadcarrying capabilities, maintainability and reliability. The end effector design will a)provide compatibility with existing grapple fixture interfaces, b) provide a high-tolerance-to-misalignment payload interface and c) provide a stiff, backlash freeinterface with high load carrying capability.
Lee Design Overview
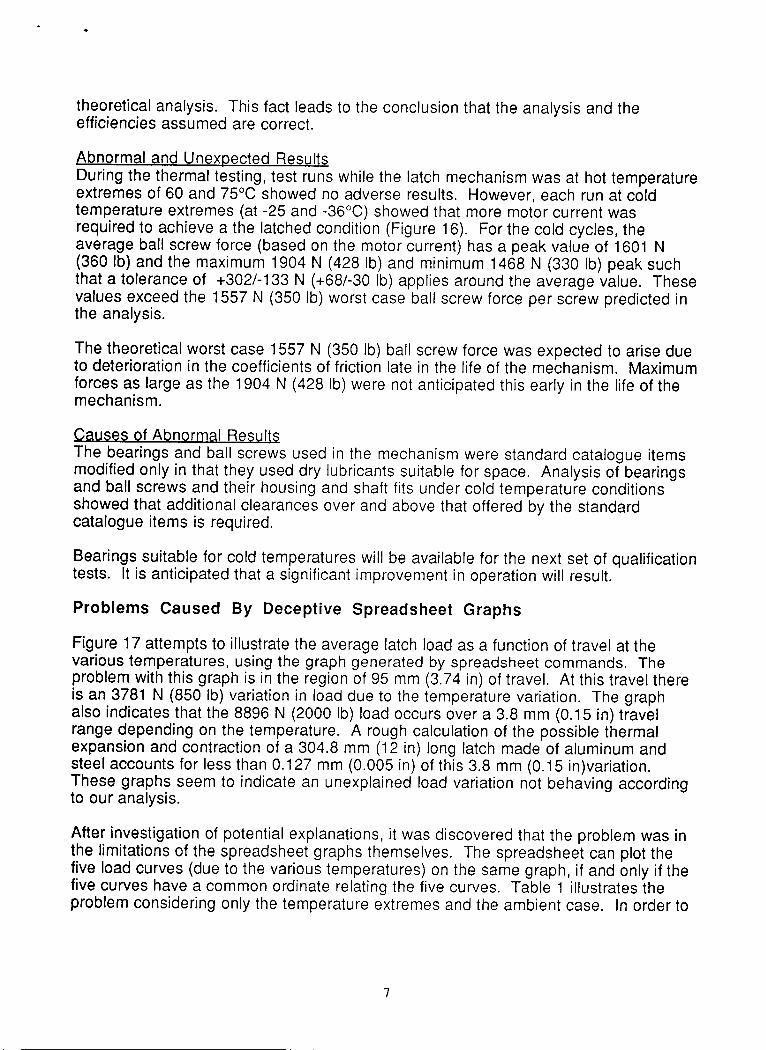
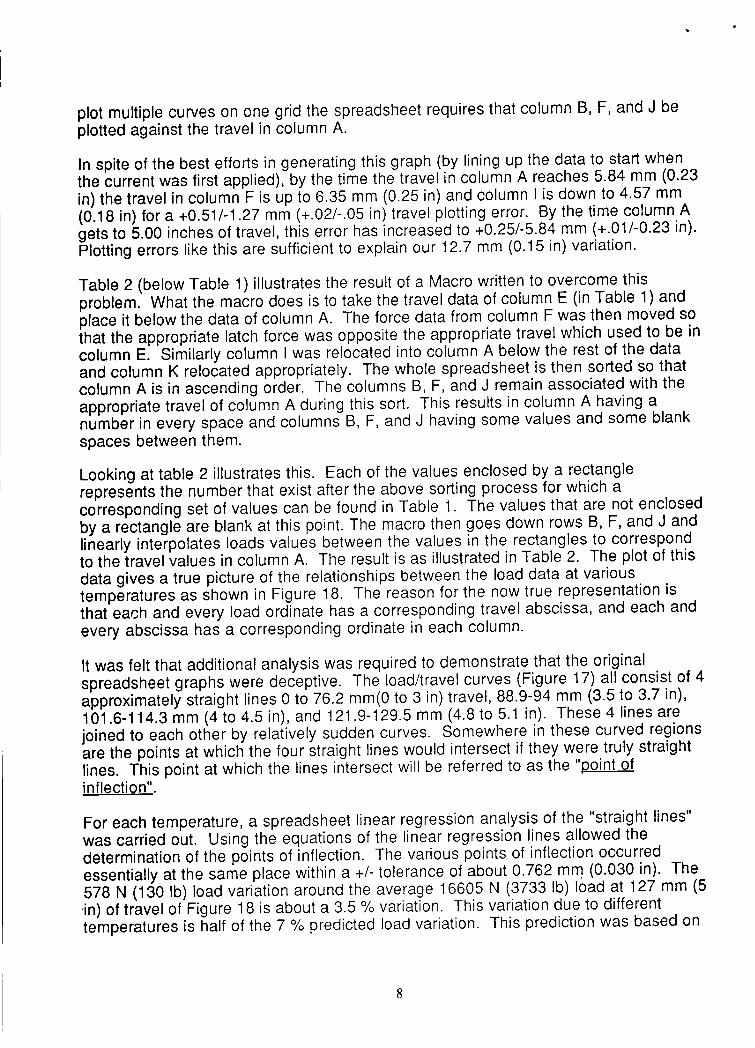
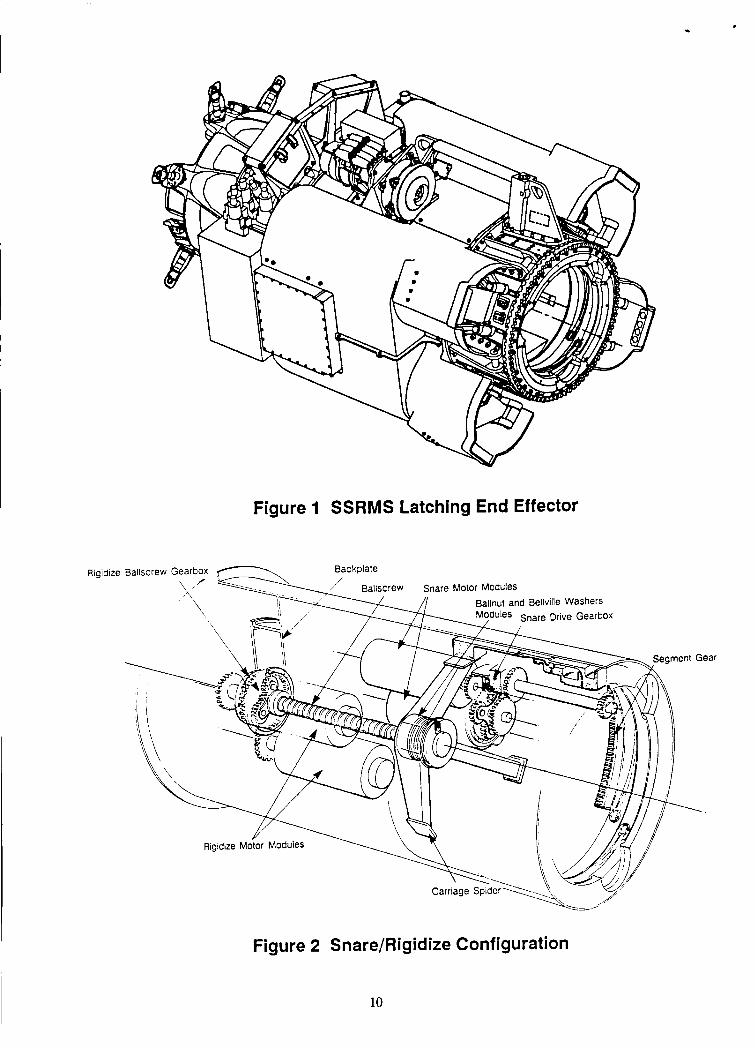
The complete Latching End Effector assembly (Figure 1) is an orbit replaceable unit.The Latching End Effector consists of the snare and rigidize subassembly inside theshell (Figure 2), and four latch/umbilical subassemblies outside the shell (Figure 3).The snare and rigidize mechanisms provides the capability to reduce large interfacemisalignments of free flying objects to the very accurate positioning required forlatching. The latch mechanism was added to withstand large moment loads requiredby the larger payloads anticipated by Space Station use. An umbilical mechanismwas built into the latch to provide an electrical connection for power and data acrossthe end effector/payload interface.
Latching End Effector Mechanism Design & Development
The Latching End Effector design requirements for the space station were as follows:a) compatibility with existing grapple fixtures as well as new Power Data
Grapple Fixtures for the Space Station.b) 30 second free flyer capture time (snare/rigidize and latch).c) increased on-orbit life (without maintenance).d) increased redundancy.e) stiff, backlash free interface.f) improved maintainability by on orbit replaceability of the entire end effector.
* Spar Aerospace Lid, Space Systems Division, Brampton, Ontario, Canada
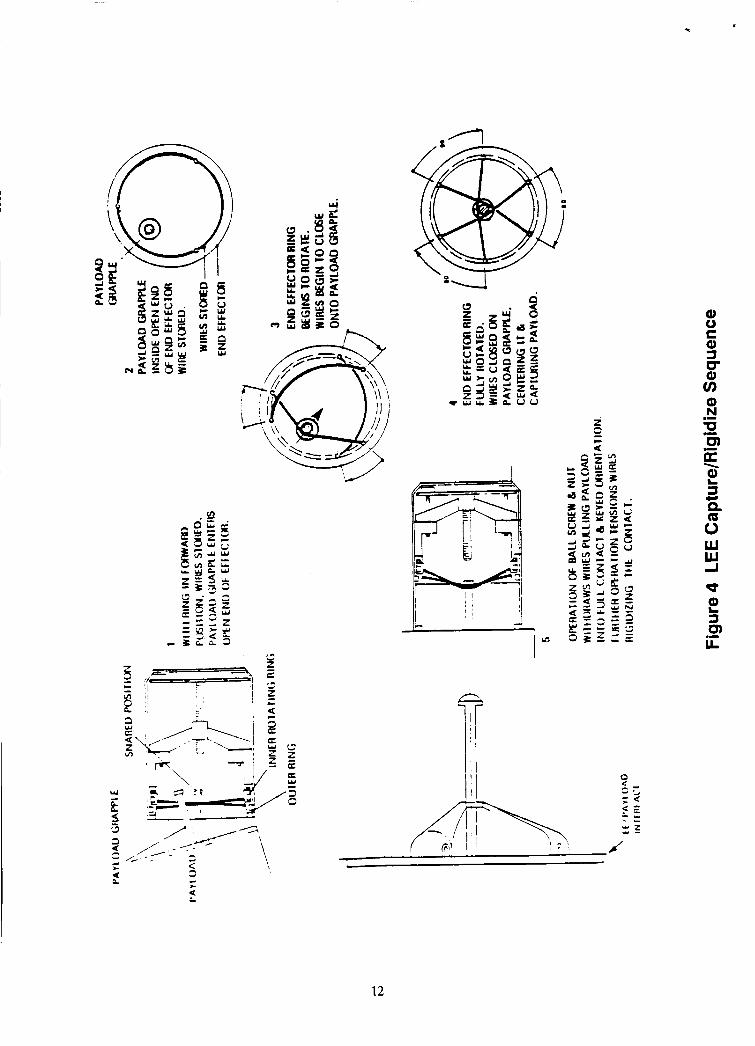
Snare/Rigidize MechanismThe snare mechanism motor module is mounted on the inner carriage. The motordrives through a three stage planetary gearbox to a segment gear mounted on arotating ring (Figures 2 and 4) to which one end of each of the three snare cables aremounted. As the motor/gearbox drives the rotating ring with respect to the fixed ringthe snare cables contact with the grapple shaft and wrap around the probe centering it(Figure 3). Once a successful snare has been completed, the snare brake is engagedand the rigidize mechanism can now be actuated.
The rigidize mechanism motor module, mounted on the rear outer shell and drives atwo stage planetary gearbox (Figure 2). A ballscrew drives directly from the gearboxoutput mounted centrally in the rear outer shell. As the ballscrew rotates, the ballnutmounted on the inner carriage translates, moving the carriage along three sets oflinear bushings mounted to the inside of the shell. A load cell located under theballscrew measures the rigidize load.
After completion of the snare operation, the rigidize mechanism is commanded toretract the carriage. Initial carriage retraction (Figure 4) cause the snare cables toslide along the grapple shaft until the underside of the shaft end grapple camcontacted. The carriage continues to retract drawing the end effector and grapplefixture together until the three large grapple fixture cams align, first removing pitch andyaw misalignments (Figure 4), followed by the grapple cam/end effector pocketengagement to remove roll misalignments. Finally the two curvic couplings at theinterface engage to remove backlash and provide precise alignment with the rigidizemechanism being preloaded to 4893 N (1100 Ib).
Latch/Umbilical MechanismEach of the four latches consists of the parts shown in Figure 5. The tension bracketsupport and the ball nut pinion housing are stationary parts fixed to the shell. Four ballnut pinions driven by a ring gear on the outside of the shell (Figure 2), allows a singlemotor gearbox package to simultaneously drive the latches, maintaining thesynchronization established at assembly.
The motor drives the ball screws moving the electrical connector carriers toward thegrapple fixture in the sequence shown by Figures 6 through 9. The connector carrierrides on linear bearings (Figure 9) moving along tracks fixed to the shell.
Initially the sequencing rollers roll up the straight portion of the sequencing cams,holding the latch levers in their angled position. In this position, the latch deploymentrollers are held captive by the levers causing the tension bracket to be pulled alongwith the connector carriers.
At the deployed position of the latch, the sequencing cam no longer restricts themovement of the levers. The disc spring stack's outer preload bushing has contactedthe underside of the tension bracket support, preventing the tension bracket frommoving any further unless the disc spring stack is compressed.
2
I
Continued movement causes the latch levers to spread, achieving the initial contactposition (Figure 8). As the grapple fixture rollers continue to move up, the grapplefixture ramp, the pivot points on the latch lever (and thus the tension bracket) move upby about 3 mm. This movement compresses the belleville springs to result in a loadbetween 16013 to 17125 N (3600 to 3850 Ib) at each of the four latches. This 64054 N(14,400 Ib) total load is a significant improvement over the 4894 N (1100 Ib) rigidizeload. This load applied at the curvic coupling teeth (Figure 1) at end effector/grapplefixture allows the capture and movement of large payloads without backlash orseparation.
In the latched/connector mated position deployment rollers are on a "flat" portion of thelatch lever (Figure 2). As the connector carrier moves between the connector matedposition and the latched position (Figure 9) the compression of the disc spring stackremains constant. As the spring stack is not being compressed, the ball screw forcerequired to move between the connector mated position and the latched positioninvolves only overcoming bearing friction and the force to mate or demate theconnector(about 222-445 N ( 50 to 100 lb) total)
The reverse delatch sequence is such that the disc spring stack is relaxing rather thanbeing compressed. Since the disc springs are relaxing the retraction forces aresubstantially lower than the engagement forces.
Engineering Model Testing
In 1993, testing of the latching end effector and power data grapple fixture was carriedout at ambient (room temperature) conditions and at hot and cold temperatureextremes (representative of operating extremes in space). These tests wereconducted after vibration testing (which simulated launch conditions), and aftersubjecting the end effector latched to the grapple fixture to structural loading(representative of the worst case loading conditions expected during operation andlaunch) and including representative simulation of capture envelope.
Test Rig Operation/Description
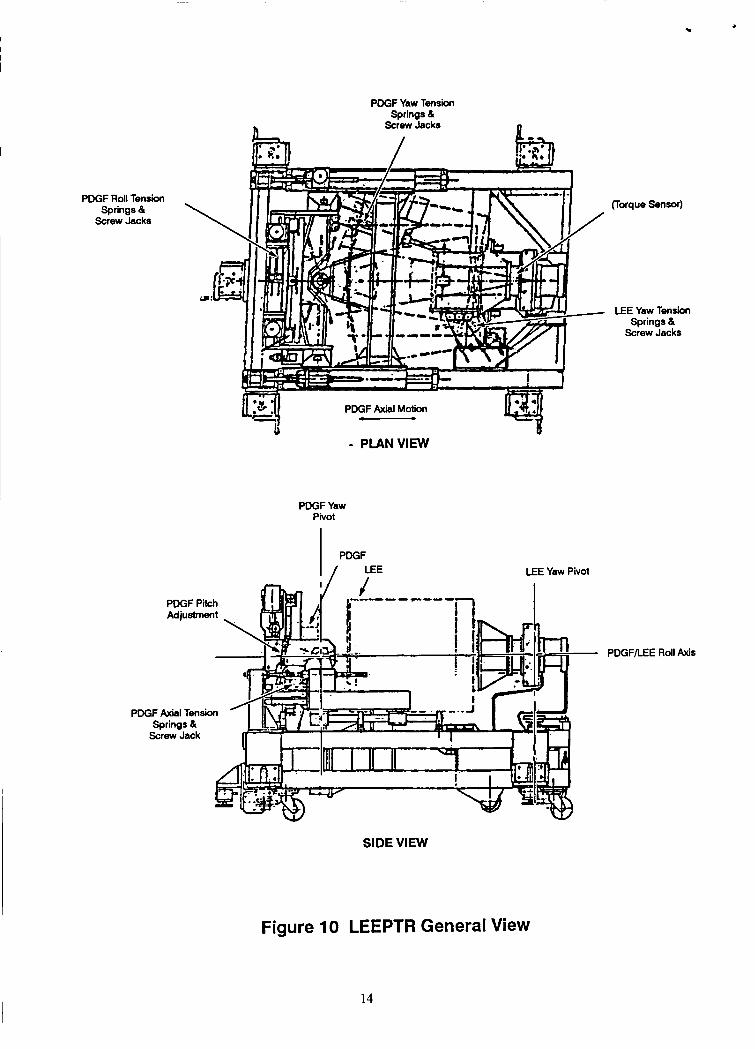
The Performance Test Rig design and geometry (Figure 10) articulates to enable therig to simulate a pitch/yaw/roll misaligned end effector/grapple fixture interface. Thetest rig contains a data acquisition capability for real time monitoring of all mechanismparameters, the applied and reacted loads, and test rig position (in 6 Degrees ofFreedom) during various misalignment simulations. The test rig also providesrepresentative worst external joint load during capture.
Data Acquisition
Raw data was recorded at 50 millisecond intervals, in ASCII format. The forces in themechanism; the motor current; the open or closed status of microswitches, a count ofmotor revolutions (from the motor resolver) multiplied by appropriate gear ratios so asto represent travel of the mechanism were measured as a function of time. Thesoftware also calculated the speed of the mechanism over the 50 millisecond intervals.
Data Reduction
Initial tests were run at a slow speed requiring up to 80 seconds for a latch/delatchresulting in 28,800 numbers for a single test. A dozen tests run at this speed resultedin 345,600 numbers. This amount of data becomes overwhelming if not summarized.
For the latch/umbilical results, computer spreadsheet macro analysis was used todetermine the average value, and maximum and minimum value for each of therecorded parameters over each one tenth inch travel increment for each individualtest. These values were then attributed to the average travel over the increment. Aslong as the extremes (max and min) and the average values compared favorably tothe expected theoretical results the individual test run was considered to besuccessful.
The range of values of the seven latch ambient tests at slow speed was small andshowed no significant variations. These test runs were considered as a consistentstable homogeneous group of results. Because of this, further summarization of all theambient test at the slow speed was done. The overall average, overall maximum andoverall minimum values of the variables in these seven test runs (Figure 15) becamethe criteria representative of "normal and expected" results; to be used to judge furthertest results against.
In the case of snare/rigidize mechanisms, performance is more directly influenced bythe overall effect of misalignment loads during capture and hence the same detailedanalysis is not required.
Normal and Expected Results
Having established a criteria for "normal and expected" results, it was found thatchanging the speed of latching from 40 seconds, to the normal operating speedrequiring 6 seconds to latch had no significant effect. Similarly the comparison of slowspeed for snare and rigidize to fast speed had no significant effect. Ambient test runsafter the vibration tests, structural load tests also showed normal results.
Theoretical Results Compared to Test Results
Motor current is one of the more important test variables because from it themechanism output force can be calculated. This is done by multiplying the current bythe drive train gear ratio, by the drive train efficiencies assumed during analysis, byother appropriate constants which include the mechanism motor torque constant. Thetheoretical ball screw force was calculated based on the analysis of the equilibriumbetween (a) the ball screw force, (b) the sliding and rolling friction forces in thebearings, rollers and mechanism components, and (c) the forces in the bellevillesprings and structure as they were compressed.
For the snare mechanism, the determination of snare drive train torque must betranslated from the gearbox to the cables mounted on the rotating ring as they are
wrapped around the probe thereby compress belleville springs mounted on the cableends.
Snare/Rigidize Results
SnareThe snare mechanism ambient performance testing consisted of a series of runs from
maximum grapple probe misalignment to fully aligned. The worst case capturescenario was with a radial offset was 4 inches, a pitch/yaw 15 degree misalignmentand with a side load of 156 N (35 Ib) (derived from the theoretical force to back drivethe closest arm joint). A significant number of runs were performed under eachmisalignment case in order to verify performance of the mechanism. This datademonstrated mechanism repeatability under the various conditions.
Snare ambient performance is summarized in Figure 11. The highest current peaksoccur at 0 and 75 degrees of rotation of the rotating ring. These high currrents at thestart and finish of the snare represent the acceleration and deceleration of the highrotating inertia of the rotating ring. This motor load must then be accelerated (underclosed loop control) to the maximum speed (300 rad/s), drive the snare cables to nearend of travel (75 degrees) and decelerate the drive train within the maximum time of 3
seconds. The deceleration peak at 75 degrees is 0.5 amps lower than theacceleration peak, because of the cables tensioning and the 156 N (35 Ib) externalload, both act tend to slow the motor down, there by reducing the servo braking themotor must deliver.
The next load peak (Figure 11) is at 30 degrees and occurs at the maximum
misalignment of the grapple fixture. Comparing this peak with subsequent peaks (asalignment is improved), shows the magnitude of the load is decreasing. This is aresult of improved alignment geometry. Separating outdy_namiC-inertia load effects
from the constant 156 N (35 Ib) radial load was accomplished by comparing the slowand fast snare runs. Fast snare operation runs were 5 times faster than the slow snareoperation runs, resulting in the inertia load effect of 25 times greater. The much morebenign slow speed runs (60 rad/s motor speed) therefore allowed a relative
comparison of the inertia effects versus the steady state 156 N (35 Ib) radial load. The
external loading from the rig (proportional to motor current 1) correlated well toanalytical predictions and control simulations. Overall mechanism performance withand without external loads was assessed by comparing snare (loaded and unloaded)as well as desnare performance to assess the mechanism performance in bothdirections.
Mechanism thermal and post vibration baseline tests were performed using the sametest rig misalignment case (Figure 12). Thermal extreme runs were carried out and
results were as anticipated. The cold case runs (-36 ° C) exhibited lower overall
1 Separate motor module performance tests under similar ambient and thermal conditions enabled mostof the uncertainties in assuming the current is proportional to the load (e.g., running friction, motorparameter variations) to be accounted for and hence removed from the absolute current for analysispurposes.
i
efficiency (i.e., higher torque to complete an operation). Hot (+71° C) snare operationresulted in the lowest torque. The ambient run was consistent with previous runs.
RigidizeRigidize testing simulated both worst case payload misalignment (15 degreespitch/yaw and 10 degrees roll offset and an axial offset) and the best case with only theaxial misalignment. The test rig imposed a 448 N (100 lb) axial load to simulate anaverage arm back driving while rigidizing. Friction in the rigidize mechanism washigher than expected, therefore current could not be relied on as an indicator ofapplied load. This was overcome by using the rigidize load cell (Figure 3) whichprovided axial load measurement as well as the strain gauged grapple shaft.
As with the snare ambient performance, dynamic loading was found to have asignificant effect particularly under high speed, and at maximum misalignmentconditions. Again it was found that dynamic loads could be accounted by comparisonof the fast and slow runs. This in turn leads to a better understand and analysis theeffects of the alignment load effects. Rigidization of loaded grapple shafts wascompared to unloaded rigidizations in the absence of a grapple shaft. Loaded rigidizedata was compared to unloaded derigidize operation provided bidirectional testresults.
Rigidize mechanism thermal and post vibration baseline tests were performed usingonly the axial/longitudinal misalignment (Figure 14). Unlike the other mechanisms,there was no appreciable difference between temperature extremes. In addition thecurrent "ripple" seen consistently throughout the ambient runs is not present in the cold(-36 ° C) case.
The relationship between current and external force (including dynamic effects) werevalidated using the multiple degree of freedom test rig. The relative sliding andalignment forces were determined to be within acceptable limits. However testing stillneeds to be carried in thermal vacuum to complete interface validation.
Abnormal and Unexpected Results
Rigidize mechanism friction losses were higher than expected resulting in lower thanexpected efficiency. Disassembly showed a multiple source interference problemwithin the rigidize gearbox. The resultant design changes will be implemented on theQualification Model LEE with the gearbox to be tested prior to integration to ensurethe problem has been solved.
Latch/Umbilical Results
Normal Results
The average ball screw force during ambient testing has a peak value of 1081 N (243Ib) and the maximum 1214 N (273 Ib)and minimum 1005 N (226 Ib) peak for a +133/-75 N (+30/-17 Ib) tolerance around the average value. These values correspond verywell to the 1112 N (250 Ib)maximum ball screw force per screw predicted in the
6
theoretical analysis. This fact leads to the conclusion that the analysis and theefficiencies assumed are correct.
Abnormal and Unexpected ResultsDuring the thermal testing, test runs while the latch mechanism was at hot temperatureextremes of 60 and 75°C showed no adverse results. However, each run at coldtemperature extremes (at -25 and -36°C) showed that more motor current wasrequired to achieve a the latched condition (Figure 16). For the cold cycles, theaverage ball screw force (based on the motor current) has a peak value of 1601 N(360 Ib) and the maximum 1904 N (428 Ib) and minimum 1468 N (330 Ib) peak suchthat a tolerance of +302/-133 N (+68/-30 Ib) applies around the average value. Thesevalues exceed the 1557 N (350 Ib) worst case ball screw force per screw predicted inthe analysis.
The theoretical worst case 1557 N (350 Ib) ball screw force was expected to arise dueto deterioration in the coefficients of friction late in the life of the mechanism. Maximumforces as large as the 1904 N (428 Ib) were not anticipated this early in the life of themechanism.
Causes Qf AbnQrmal Re$_lt8
The bearings and ball screws used in the mechanism were standard catalogue itemsmodified only in that they used dry lubricants suitable for space. Analysis of bearingsand ball screws and their housing and shaft fits under cold temperature conditionsshowed that additional clearances over and above that offered by the standardcatalogue items is required.
Bearings suitable for cold temperatures will be available for the next set of qualificationtests. It is anticipated that a significant improvement in operation will result.
Problems Caused By Deceptive Spreadsheet Graphs
Figure 17 attempts to illustrate the average latch load as a function of travel at thevarious temperatures, using the graph generated by spreadsheet commands. Theproblem with this graph is in the region of 95 mm (3.74 in) of travel. At this travel thereis an 3781 N (850 Ib) variation in load due to the temperature variation. The graphalso indicates that the 8896 N (2000 Ib) load occurs over a 3.8 mm (0.15 in) travelrange depending on the temperature. A rough calculation of the possible thermalexpansion and contraction of a 304.8 mm (12 in) long latch made of aluminum andsteel accounts for less than 0.127 mm (0.005 in) of this 3.8 mm (0.15 in)variation.These graphs seem to indicate an unexplained load variation not behaving accordingto our analysis.
After investigation of potential explanations, it was discovered that the problem was inthe limitations of the spreadsheet graphs themselves. The spreadsheet can plot thefive load curves (due to the various temperatures) on the same graph, if and only if thefive curves have a common ordinate relating the five curves. Table 1 illustrates theproblem considering only the temperature extremes and the ambient case. In order to
plot multiple curves on one grid the spreadsheet requires that column B, F, and J beplotted against the travel in column A.
In spite of the best efforts in generating this graph (by lining up the data to start whenthe current was first applied), by the time the travel in column A reaches 5.84 mm (0.23in) the travel in column F is up to 6.35 mm (0.25 in) and column I is down to 4.57 mm(0.18 in) for a +0.51/-1.27 mm (+.02/-.05 in) travel plotting error. By the time column Agets to 5.00 inches of travel, this error has increased to +0.25/-5.84 mm (+.01/-0.23 in).Plotting errors like this are sufficient to explain our 12.7 mm (0.15 in) variation.
Table 2 (below Table 1) illustrates the result of a Macro written to overcome thisproblem. What the macro does is to take the travel data of column E (in Table 1) andplace it below the data of column A. The force data from column F was then moved sothat the appropriate latch force was opposite the appropriate travel which used to be incolumn E. Similarly column I was relocated into column A below the rest of the dataand column K relocated appropriately. The whole spreadsheet is then sorted so thatcolumn A is in ascending order. The columns B, F, and J remain associated with theappropriate travel of column A during this sort. This results in column A having anumber in every space and columns B, F, and J having some values and some blankspaces between them.
Looking at table 2 illustrates this. Each of the values enclosed by a rectanglerepresents the number that exist after the above sorting process for which acorresponding set of values can be found in Table 1. The values that are not enclosedby a rectangle are blank at this point. The macro then goes down rows B, F, and J andlinearly interpolates loads values between the values in the rectangles to correspondto the travel values in column A. The result is as illustrated in Table 2. The plot of thisdata gives a true picture of the relationships between the load data at varioustemperatures as shown in Figure 18. The reason for the now true representation isthat each and every load ordinate has a corresponding travel abscissa, and each andevery abscissa has a corresponding ordinate in each column.
It was felt that additional analysis was required to demonstrate that the originalspreadsheet graphs were deceptive. The load/travel curves (Figure 17) all consist of 4approximately straight lines 0 to 76.2 mm(0 to 3 in) travel, 88.9-94 mm (3.5 to 3.7 in),101.6-114.3 mm (4 to 4.5 in), and 121.9-129.5 mm (4.8 to 5.1 in). These 4 lines arejoined to each other by relatively sudden curves. Somewhere in these curved regionsare the points at which the four straight lines would intersect if they were truly straightlines. This point at which the lines intersect will be referred to as the "point ofinflection".
For each temperature, a spreadsheet linear regression analysis of the "straight lines"was carried out. Using the equations of the linear regression lines allowed thedetermination of the points of inflection. The various points of inflection occurredessentially at the same place within a +/- tolerance of about 0.762 mm (0.030 in). The578 N (130 Ib) load variation around the average 16605 N (3733 Ib) I()ad at 127 mm (5•in) of travel of Figure 18 is about a 3.5 % variation. This variation due to differenttemperatures is half of the 7 % predicted load variation. This prediction was based on
the fact that at high temperatures the modulus of elasticity of the disc springs isexpected to change and the spring rate is expected to soften. This variation in itself issufficient to explain the +0.762 mm (+/- 0.030 in) tolerance on the point of inflectionand convince skeptics that the problems of Figure 17 are due to the limitations of thespreadsheet graphing capability.
Discussion and Conclusions
These tests demonstrated a sophisticated (real time data acquisition) test rigsimulation of the snare/rigidize process. The performance was verified in both thermaland ambient performance environments.
The tests show that having a multitude lot of test data is easier to handle as long ascomputers are available to analyze and summarize the data into a comprehensiblesummary.
However, the use of computers to reduce data to something that can becomprehended occasionally points to false conclusions (as with the deceptivegraphs). Care must be taken to avoid the blind acceptance of computer generateddata and the possible false conclusions that result.
In process testing (at subassembly level) would have highlighted the rigidize gearboxproblems earlier in the design.
Cold temperature operation is the latch mechanism's most significant concern.qualification testing with bearings having suitable clearances calculated by ouranalysis should alleviate this concern.
Further
A successful design and development program is dependent not only on theoreticalanalysis, but just as importantly on hardware testing that provides direct designvalidation and confidence in the analysis.