Page 1
8/3/2019 NA Industrial Highlights - 3Q 2011
http://slidepdf.com/reader/full/na-industrial-highlights-3q-2011 1/13
HIGHLIGHTSNORTH AMERICA
www.COllIERs.COM
Q3 2011 | IndustrIal
ROss J. MOORE Chief Economist | USA
The U.S. industrial market racked up another good quarter marked by rising occupancies and a dec
edly lower vacancy rate. Vacancies dropped in the majority of markets, and—with the exception of
Northeast—every region reported a lower vacancy rate for the quarter. Despite another considera
gain in occupancies, warehouse rents registered a further decrease, continuing an almost four-ye
trend.
With the economy registering modest growth in the third quarter, and similar expansion anticipated
the coming quarters, demand for warehouse space is expected to remain at currently levels. T
continued health of the manufacturing sector and a corresponding growth in exports remain key d
mand driver the nation’s industrial markets. As demonstrated by the Institute for Supply Managem
(ISM) index, manufacturing is o from the highs experienced in the spring, but remains in expans
territory. For October the ISM manufacturing index registered 50.8 (50 indicating expansion), wit
few sub-indexes such as new orders increasing signicantly from the previous month. Over the n
few quarters, the industrial market is expected to continue its slow crawl back to a more even balan
between supply and demand but no sharp snap back is anticipated.
With the latest slowdown in the global economy, a true rebound in the warehouse market is unlikely
occur before well into 2012. Warehouse construction, however, will remain at very low levels, so a
incremental increase in occupancies will immediately translate into lower vacancies. The rent pict
is unlikely to change soon, with vacancies still too high to give landlords any form of pricing pow
Look for the U.S.
industrial market to
surprise on the upsid
– the demand for qua
warehouse space is
quickly pushing
availabilities lower an
talk of speculative
construction is
beginning to be heard
select markets.
MARkET INdICATORsRelative to prior period
U.s. INdUsTRIAl MARkETsUMMARy sTATIsTICs, Q3 2011
U.S. Industrial Markets Showing MoreSigns of Strength
Q32011
Q42011*
VACANCy
NET ABsORPTION
CONsTRUCTION
RENTAl RATE
*Projected
U.s. INdUsTRIAl MARkET Q3 2009 – Q3 2011
Vacancy Rate: 9.99%Change from Q2 2011: -0.30%
Absorption:
36. Million Square Feet
New Construction:
1.4 Million Square Feet
Under Construction:
2. Million Square Feet
Asking Rents Per Square Foot
Average Warehouse/
Distribution Center: $4.3Change from Q2 2011: -2.7%
continued on pag
Absorption Completions Vacancy
Q3 2010Q2 2010Q1 2010Q4 2009Q3 2009
M i l l i o n S q u a r e F e e t
V a c a n c y ( % )
-50
-40
-30
-20
-10
0
10
20
30
40
50
8%
10%
12%
Q3 2011Q2 2011Q1 2011Q4 2010
10.50
10.90 11.10 11.00 11.00
10.8010.56
10.299.99
4%
6%
Page 2
8/3/2019 NA Industrial Highlights - 3Q 2011
http://slidepdf.com/reader/full/na-industrial-highlights-3q-2011 2/13P. 2 | COllIERs INTERNATIONAl
hIghlIghts | Q3 2011 | INDUSTRIAL | NRTh AmeRIcA
UNITEd sTATEs | INdUsTRIAl sURVEy
MARkET
EXIsTINGINVENTORy (sF)sEPT 30, 2011
NEw CONsTRUCTIONQ3 2011 (sF)
NEw CONsTRUCTIONyTd 2011
CURRENTly UNdERCONsTRUCTION (sF)
NORTHEAsT
Baltimore, MD 9,97, , 334, ,Boston, MA 4,94, 7,
Hartford, CT 9,97, , ,
Long Island, NY ,7, 7,
New Jersey - Central 37,9, , 49, ,
New Jersey - Northern 37,, 7, 7, 43,
Philadelphia, PA 43,, , ,79, ,
Pittsburgh, PA 3,3, , 4, 4,
Washington DC 7,4, , 4, ,4,
NORTHEAsT TOTAl ,8,, ,, ,, ,,
sOUTH
Atlanta, GA ,, 47, ,, 34,
Charleston, SC 3,7, , , ,
Charlotte, NC ,93, 7, 74,
Columbia, SC 3,4, ,,
Dallas-Ft. Worth, TX 7,9, ,, ,, ,
Ft. Lauderdale-Broward, FL 7,7, , , ,
Greenville/Spartanburg, SC 74,7, 9, ,7, 9,Houston, TX ,43, 7, ,494, 9,
Jacksonville, FL ,, 4, 3,
Little Rock, AR 4,4, 497,
Louisville, KY 7,9, 7, 3, 7,
Memphis, TN 9,9, , 9,
Miami, FL ,3, 33,
Nashville, TN 9,, 4,44, ,3, 4,44,
Orlando, FL 44,74,
Raleigh, NC ,433, 7, 93, ,
Savannah, GA 44,, 47, ,3, 7,
Tampa Bay, FL ,,
West Palm Beach, FL ,9, 4, 39, ,
sOUTH TOTAl ,5,8, ,8, 5,8, ,8,
MIdwEsT
Chicago, IL ,3,7, ,4, ,43, 3,79,
Cincinnati, OH 7,9, , 3,
Page 3
8/3/2019 NA Industrial Highlights - 3Q 2011
http://slidepdf.com/reader/full/na-industrial-highlights-3q-2011 3/13
hIghlIghts | Q3 2011 | INDUSTRIAL | NRTh AmeRI
COllIERs INTERNATIONAl | P
UNITEd sTATEs | INdUsTRIAl sURVEy
MARkET
EXIsTINGINVENTORy (sF)sEPT 30, 2011
NEw CONsTRUCTIONQ3 2011 (sF)
NEw CONsTRUCTIONyTd 2011
CURRENTly UNdERCONsTRUCTION (sF)
Cleveland, OH 4,3, 9, 9,
Columbus, OH 3,3, ,, ,, ,3,
Detroit, MI 493,99,
Grand Rapids, MI ,9,
Indianapolis, IN 79,7, 3, 4, 37,
Kansas City, MO-KS 4,4, 34, 39, 4,
Minneapolis/St. Paul, MN ,,
Omaha, NE 7,, ,
St. Louis, MO ,7, 9, 37, 39,
MIdwEsT TOTAl ,5,8, ,8, 5,, ,,
wEsT
Bakerseld, CA 3,7, 7, , 3,
Boise, ID 3,9, ,
Denver, CO 9,, 4, , ,
Faireld, CA 4,, 49,
Fresno, CA 4,,
Honolulu, HI 3,9,
Las Vegas, NV 7,93, , 47, 3,
Los Angeles - Inland Empire, CA 3,4, ,4, ,93, ,,
Los Angeles, CA ,79, ,93, ,494, 9,
Oakland, CA 3,33,
Orange County, CA ,43, ,
Phoenix, AZ 7,, 44, 3,,
Pleasanton/Walnut Creek, CA 33,3,
Portland, OR 93,3, 4, 7, 7,
Reno, NV 73,9, ,
Sacramento, CA ,74, 44, ,
San Diego, CA ,4, , , 3,
San Francisco Peninsula, CA 4,7,
San Jose/Silicon Valley, CA 3,9, 9,
Seattle/Puget Sound, WA 7,, , , 4,
Stockton/San Joaquin County, CA 9,734, 9, 9, ,
wEsT TOTAl ,,, ,, ,8, 8,5,
U.s. TOTAl ,8,85, 8,8, ,, 8,,
Page 4
8/3/2019 NA Industrial Highlights - 3Q 2011
http://slidepdf.com/reader/full/na-industrial-highlights-3q-2011 4/13P. 4 | COllIERs INTERNATIONAl
hIghlIghts | Q3 2011 | INDUSTRIAL | NRTh AmeRIcA
UNITEd sTATEs | INdUsTRIAl sURVEy
MARkETABsORPTIONQ3 2011 (sF)
ABsORPTIONyTd 2011
VACANCy RATEJUNE 30, 2011 (%)
VACANCy RATEsEPT. 30, 2011 (%)
NORTHEAsT
Baltimore, MD 34, 43, .4 .9
Boston, MA (4,) , . .7
Hartford, CT , 7, 9. 9.
Long Island, NY 93, (4,) .7 .
New Jersey - Central (,,) ,94, 9.79 .9
New Jersey - Northern (,,) (3,7,) . .7
Philadelphia, PA ,4, 3,74, 9. 9.3
Pittsburgh, PA (,) 99, .97 7.37
Washington DC 4, ,33, .9 .7
NORTHEAsT TOTAl (,,) ,85, . .5
sOUTH
Atlanta, GA 3,4, ,9, 4.4 3.3
Charleston, SC , ,37, .3 .4
Charlotte, NC ,4, 4,33, 3. .79
Columbia, SC , (9,) 7. .9
Dallas-Ft. Worth, TX ,3, ,7, .44 .3
Ft. Lauderdale-Broward, FL , (4,) 9.4 9.
Greenville/Spartanburg, SC ,, ,3, . 9.
Houston, TX 9, 3,3, .7 .7
Jacksonville, FL , 99, .97 .
Little Rock, AR 9, (9,) 4. 4.
Louisville, KY 34, ,947, .9 .
Memphis, TN (3,) ,, .9 .39
Miami, FL 47, ,3, .3 .47
Nashville, TN , 774, 4.4 .9
Orlando, FL 4, 999, .4 .3
Raleigh, NC ,3, ,3, .3 .4
Savannah, GA 3, ,99, . 4.
Tampa Bay, FL 43, ,7, .73 .43
West Palm Beach, FL , 44, 9. 9.4
sOUTH TOTAl ,, ,5, . .8
MIdwEsT
Chicago, IL 4,93, ,4, .7 .
Cincinnati, OH (39,) ,4, .77 .9
Page 5
8/3/2019 NA Industrial Highlights - 3Q 2011
http://slidepdf.com/reader/full/na-industrial-highlights-3q-2011 5/13
hIghlIghts | Q3 2011 | INDUSTRIAL | NRTh AmeRI
COllIERs INTERNATIONAl | P
UNITEd sTATEs | INdUsTRIAl sURVEy
MARkETABsORPTIONQ3 2011 (sF)
ABsORPTIONyTd 2011
VACANCy RATEJUNE 30, 2011 (%)
VACANCy RATEsEPT. 30, 2011 (%)
Cleveland, OH (49,) (4,) 9. 9.
Columbus, OH ,, 3,3, . .
Detroit, MI ,39, ,3, 3.73 3.4
Grand Rapids, MI 9, 34, .9 .
Indianapolis, IN 477, ,7, . .4
Kansas City, MO-KS ,, 9, 7.9 .
Minneapolis/St. Paul, MN 44, 49, .7 .
Omaha, NE , 447, . .
St. Louis, MO (,4,) (,,) .49 .3
MIdwEsT TOTAl ,85, ,, . .
wEsT
Bakerseld, CA , 4, 9. 9.44
Boise, ID , (7,) .4 9.9
Denver, CO 7, , 7.9 7.
Faireld, CA , 3.33 .
Fresno, CA 3, 7, . .73
Honolulu, HI 9, (,) 4.73 4.7
Las Vegas, NV (3,) 3, .9 .3
Los Angeles - Inland Empire, CA 4,, 3,374, 9.4 7.
Los Angeles, CA ,, ,4, .3 .
Oakland, CA (7,) 3, .7 9.
Orange County, CA 37, ,7, .4 4.7
Phoenix, AZ ,, 3,, . 4.
Pleasanton/Walnut Creek, CA (37,) (497,) .33 .4
Portland, OR 99, ,79, 9. .
Reno, NV , 3, .4 4.94
Sacramento, CA 4, 93, 3. .77
San Diego, CA 33, , .44 .
San Francisco Peninsula, CA (,) 3, .94 9.4
San Jose/Silicon Valley, CA (3,) 4, 3.4 .
Seattle/Puget Sound, WA ,33, 3,7, 7.4 7.
Stockton/San Joaquin County, CA 34, ,7, . .3
wEsT TOTAl ,85, ,5, . 8.
U.s. TOTAl ,5, ,, . .
Page 6
8/3/2019 NA Industrial Highlights - 3Q 2011
http://slidepdf.com/reader/full/na-industrial-highlights-3q-2011 6/13P. 6 | COllIERs INTERNATIONAl
hIghlIghts | Q3 2011 | INDUSTRIAL | NRTh AmeRIcA
UNITEd sTATEs | INdUsTRIAl sURVEy | sAlEs PRICE ANd CAP RATE As OF sEPTEMBER 2011
MARkETsAlEs PRICE
(Usd PsF)CAP RATE
(%)VACANCy FORECAsT
(3 MONTHs)ABsORPTION FORECAsT
(3 MONTHs)RENT FORECAsT
3 MONTHs
NORTHEAsT
Baltimore, MD .3 7.9 Same Same Bottoming
Boston, MA Same Same Bottoming
Hartford, CT 3. . Up Same Declining
Long Island, NY . .4 Same Same Declining
New Jersey - Central .9 7.9 Up Down Bottoming
New Jersey - Northern .4 Up Down Bottoming
Philadelphia, PA .3 . Down Up No clear direction
Pittsburgh, PA . 7.7 Same Up Increasing
Washington DC 9. . Down Up No clear direction
NORTHEAsT AVERAGE .5 . – – –
sOUTH
Atlanta, GA 37.4 .7 Down Down Same
Charleston, SC 4. 7.7 Down Same Up
Columbia, SC Down Up Up
Dallas-Ft. Worth, TX . 7. Down Same Same
Ft. Lauderdale-Broward, FL 3.7 .7 Same Up Same
Greenville/Spartanburg, SC .7 9. Down Up Up
Houston, TX 4. 7.9 Down Up Up
Jacksonville, FL . Down Down Same
Little Rock, AR .4 9. Same Same Same
Memphis, TN 3. .9 Down Up Same
Miami, FL 7.93 Same Up Up
Nashville, TN 4. . Down Down Up
Orlando, FL . Down Same Same
Raleigh, NC 4. .4 Down Up Same
Savannah, GA 37. . Same Same Same
Tampa Bay, FL 39.7 . Down Up Same
West Palm Beach, FL 3.7 Same Up Down
sOUTH AVERAGE . 8. – – –
MIdwEsT
Chicago, IL 49. .7 Same Down Same
Cincinnati, OH 3. . Same Same Same
Columbus, OH . Down Up Same
Page 7
8/3/2019 NA Industrial Highlights - 3Q 2011
http://slidepdf.com/reader/full/na-industrial-highlights-3q-2011 7/13
hIghlIghts | Q3 2011 | INDUSTRIAL | NRTh AmeRI
COllIERs INTERNATIONAl | P
UNITEd sTATEs | INdUsTRIAl sURVEy | sAlEs PRICE ANd CAP RATE As OF sEPTEMBER 2011
MARkETsAlEs PRICE
(Usd PsF)CAP RATE
(%)VACANCy FORECAsT
(3 MONTHs)ABsORPTION FORECAsT
(3 MONTHs)RENT FORECAsT
3 MONTHs
Detroit, MI . Same Same Down
Grand Rapids, MI . 3. Down Up Up
Indianapolis, IN 44. . Down Up Up
Kansas City, MO-KS .7 Same Same Same
Minneapolis/St. Paul, MN 3.97 . Down Same Same
Omaha, NE 4. 9. Down Up Same
MIdwEsT AVERAGE .8 . – – –
wEsT
Bakerseld, CA 3. . Same Same Same
Boise, ID 4. Same Same Same
Denver, CO . . Down Up Same
Faireld, CA Same Same Down
Fresno, CA 3. 9. Same Same Same
Honolulu, HI Up Down Same
Las Vegas, NV 33.9 Up Up Down
Los Angeles - Inland Empire, CA . . Down Up Up
Los Angeles, CA . . Same Same Same
Oakland, CA .97 . Down Up Up
Orange County, CA 94. . Same Same Same
Phoenix, AZ 49. . Down Same Same
Pleasanton/Walnut Creek, CA 9. . Same Same Same
Portland, OR 3.4 Same Same Same
Reno, NV Down Same Same
Sacramento, CA 44. .7 Same Same Same
San Diego, CA 79.97 . Down Same Same
San Francisco Peninsula, CA . . Same Same Same
San Jose/Silicon Valley, CA Up Same Same
Seattle/Puget Sound, WA 7.4 .44 Down Up Same
Stockton/San Joaquin County, CA . 7. Down Up Same
wEsT AVERAGE .5 .5 – – –
U.s. AVERAGE 55. 8.5 – – –
Page 8
8/3/2019 NA Industrial Highlights - 3Q 2011
http://slidepdf.com/reader/full/na-industrial-highlights-3q-2011 8/13P. | COllIERs INTERNATIONAl
hIghlIghts | Q3 2011 | INDUSTRIAL | NRTh AmeRIcA
Beginning in 2012, however, select markets should begin to see rents hold
rm and even post modest increases in certain submarkets, but wide-
spread increases are doubtful until 2013..
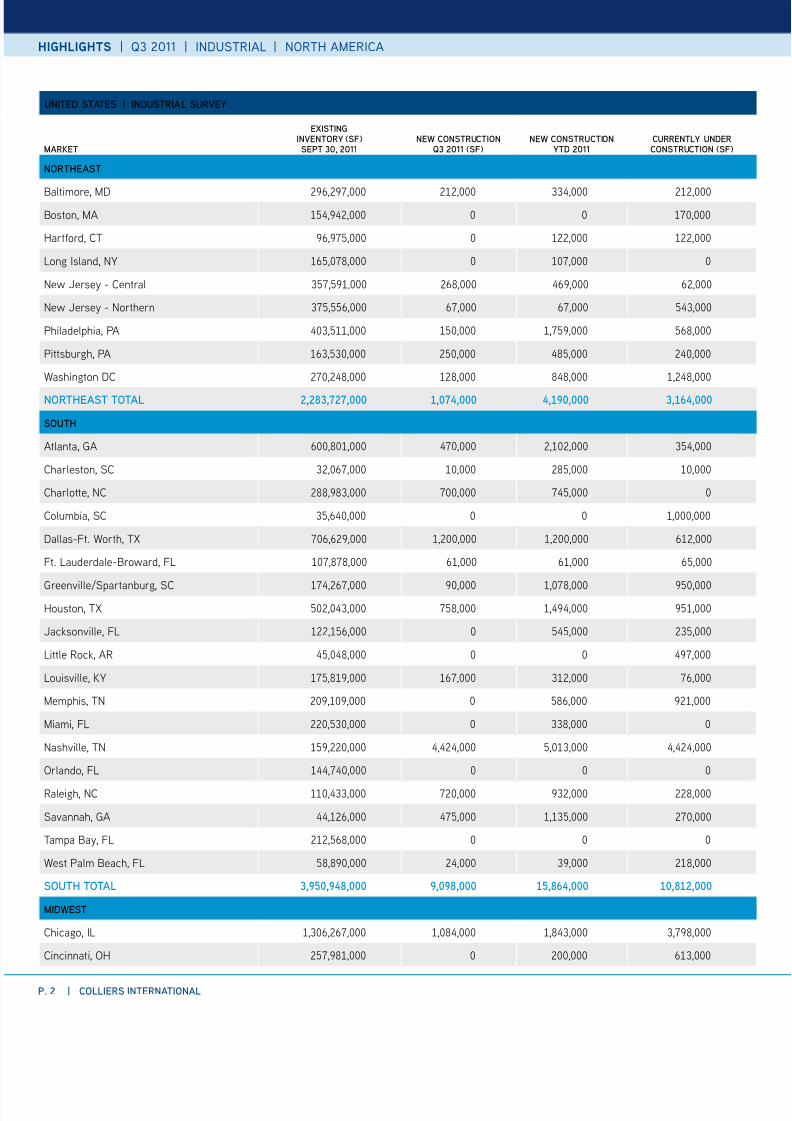
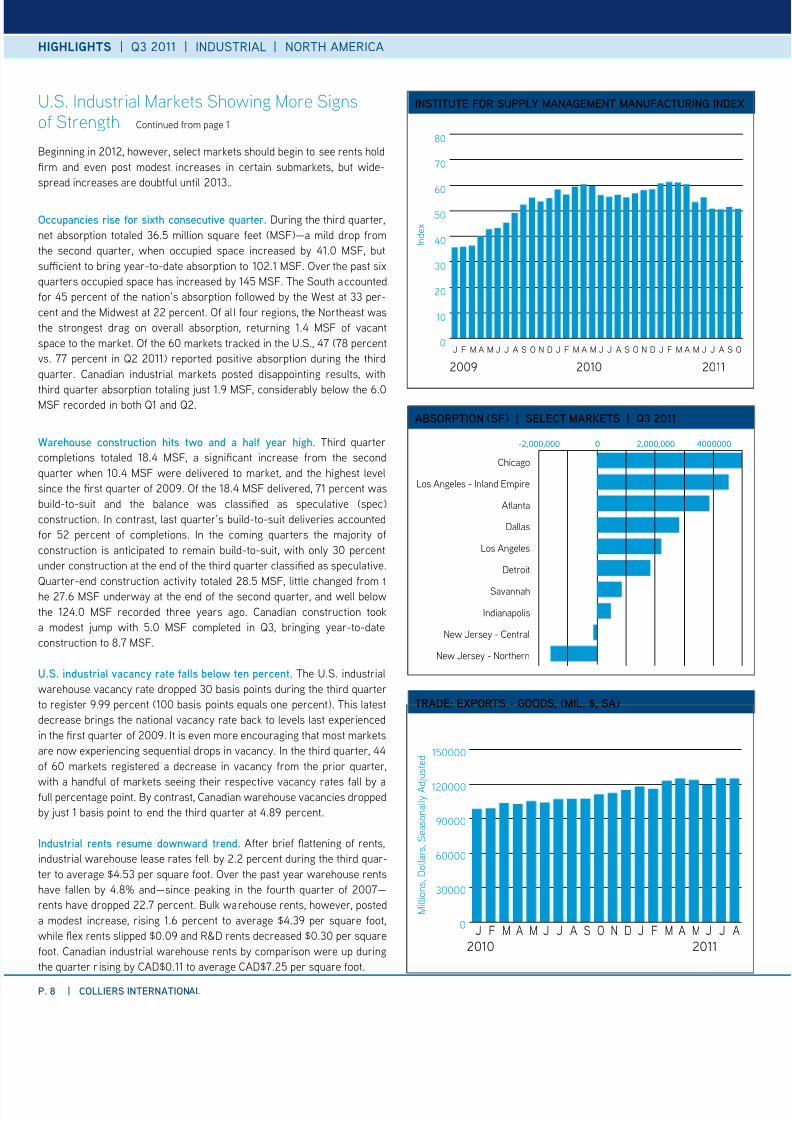
Occupancie rie for ixth conecutive quarter. During the third quarter,
net absorption totaled 6.5 million square feet (MSF)—a mild drop from
the second quarter, when occupied space increased by 1.0 MSF, but
sucient to bring year-to-date absorption to 102.1 MSF. Over the past six
quarters occupied space has increased by 15 MSF. The South accounted
for 5 percent of the nation’s absorption followed by the West at per-
cent and the Midwest at 22 percent. Of al l four regions, the Northeast was
the strongest drag on overall absorption, returning 1. MSF of vacant
space to the market. Of the 60 markets tracked in the U.S., (8 percent
vs. percent in Q2 2011) reported positive absorption during the third
quarter. Canadian industrial markets posted disappointing results, with
third quarter absorption totaling just 1. MSF, considerably below the 6.0MSF recorded in both Q1 and Q2.
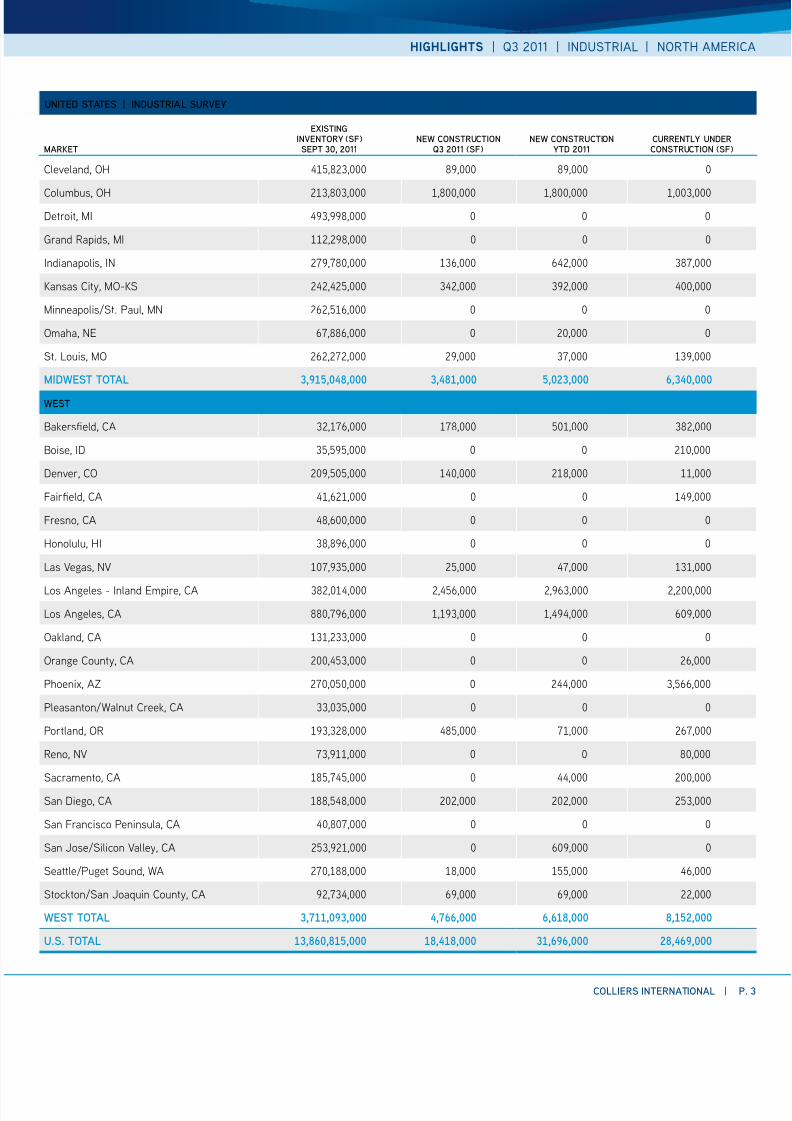
warehoue contruction hit to an a haf ear high. Third quarter
completions totaled 18. MSF, a signicant increase from the second
quarter when 10. MSF were delivered to market, and the highest level
since the rst quarter of 200. Of the 18. MSF delivered, 1 percent was
build-to-suit and the balance was classied as speculative (spec)
construction. In contrast, last quarter’s build-to-suit deliveries accounted
for 52 percent of completions. In the coming quarters the majority of
construction is anticipated to remain build-to-suit, with only 0 percent
under construction at the end of the third quarter classied as speculative.
Quarter-end construction activity totaled 28.5 MSF, little changed from t
he 2.6 MSF underway at the end of the second quarter, and well below
the 12.0 MSF recorded three years ago. Canadian construction took
a modest jump with 5.0 MSF completed in Q, bringing year-to-date
construction to 8. MSF.
U.s. inutria vacanc rate fa beo ten percent. The U.S. industrial
warehouse vacancy rate dropped 0 basis points during the third quarter
to register . percent (100 basis points equals one percent). This latest
decrease brings the national vacancy rate back to levels last experienced
in the rst quarter of 200. It is even more encouraging that most markets
are now experiencing sequential drops in vacancy. In the third quarter,
of 60 markets registered a decrease in vacancy from the prior quarter,
with a handful of markets seeing their respective vacancy rates fall by afull percentage point. By contrast, Canadian warehouse vacancies dropped
by just 1 basis point to end the third quarter at .8 percent.
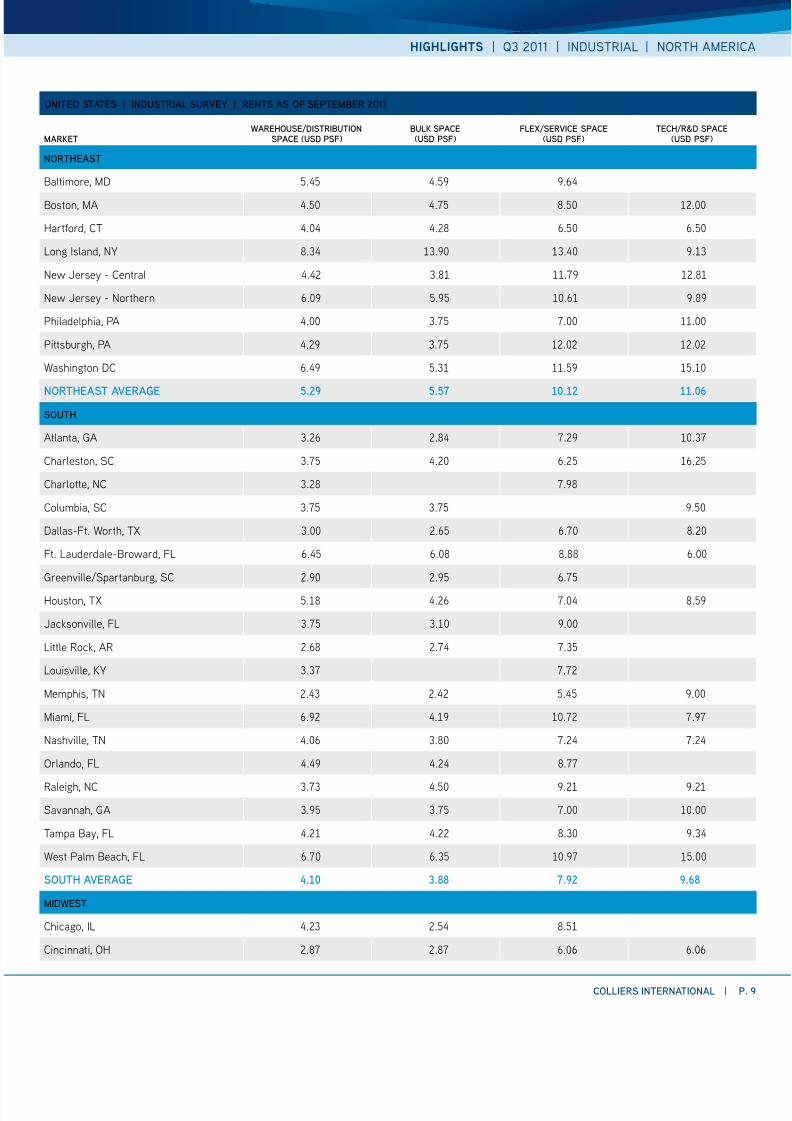
Inutria rent reume onar tren. After brief attening of rents,
industrial warehouse lease rates fell by 2.2 percent during the third quar-
ter to average $.5 per square foot. Over the past year warehouse rents
have fallen by .8% and—since peaking in the fourth quarter of 200—
rents have dropped 22. percent. Bulk warehouse rents, however, posted
a modest increase, rising 1.6 percent to average $. per square foot,
while ex rents slipped $0.0 and R&D rents decreased $0.0 per square
foot. Canadian industrial warehouse rents by comparison were up during
the quarter rising by CAD$0.11 to average CAD$.25 per square foot.
U.S. Industrial Markets Showing More Signsof Strength
I n d e x
0
10
20
30
40
50
60
70
80
2009 2010 2011
OSAJJMAMFJDNOSAJJMAMFJDNOSAJJMAMFJ
INsTITUTE FOR sUPPly MANAGEMENT MANUFACTURING INdEX
-2,000,000 0 2,000,000 4000000
New Jersey - Northern
New Jersey - Central
Indianapolis
Savannah
Detroit
Los Angeles
Dallas
Atlanta
Los Angeles - Inland Empire
Chicago
ABsORPTION (sF) | sElECT MARkETs | Q3 2011
0
30000
60000
90000
120000
150000
2010 2011
M i l l i o n s ,
D o l l a r s ,
S e a s o n a l l y A d
j u s t e d
AJJMAMFJDNOSAJJMAMFJ
TRAdE: EXPORTs - GOOds, (MIl. $, sA)
Continued from page 1
Page 9
8/3/2019 NA Industrial Highlights - 3Q 2011
http://slidepdf.com/reader/full/na-industrial-highlights-3q-2011 9/13
hIghlIghts | Q3 2011 | INDUSTRIAL | NRTh AmeRI
COllIERs INTERNATIONAl | P
UNITEd sTATEs | INdUsTRIAl sURVEy | RENTs As OF sEPTEMBER 2011
MARkETwAREHOUsE/dIsTRIBUTION
sPACE (Usd PsF)BUlk sPACE(Usd PsF)
FlEX/sERVICE sPACE(Usd PsF)
TECH/R&d sPACE(Usd PsF)
NORTHEAsT
Baltimore, MD .4 4.9 9.4
Boston, MA 4. 4.7 . .
Hartford, CT 4.4 4. . .
Long Island, NY .34 3.9 3.4 9.3
New Jersey - Central 4.4 3. .79 .
New Jersey - Northern .9 .9 . 9.9
Philadelphia, PA 4. 3.7 7. .
Pittsburgh, PA 4.9 3.7 . .
Washington DC .49 .3 .9 .
NORTHEAsT AVERAGE 5. 5.5 . .
sOUTH
Atlanta, GA 3. .4 7.9 .37
Charleston, SC 3.7 4. . .
Charlotte, NC 3. 7.9
Columbia, SC 3.7 3.7 9.
Dallas-Ft. Worth, TX 3. . .7 .
Ft. Lauderdale-Broward, FL .4 . . .
Greenville/Spartanburg, SC .9 .9 .7
Houston, TX . 4. 7.4 .9
Jacksonville, FL 3.7 3. 9.
Little Rock, AR . .74 7.3
Louisville, KY 3.37 7.7
Memphis, TN .43 .4 .4 9.
Miami, FL .9 4.9 .7 7.97
Nashville, TN 4. 3. 7.4 7.4
Orlando, FL 4.49 4.4 .77
Raleigh, NC 3.73 4. 9. 9.
Savannah, GA 3.9 3.7 7. .
Tampa Bay, FL 4. 4. .3 9.34
West Palm Beach, FL .7 .3 .97 .
sOUTH AVERAGE . .88 . .8
MIdwEsT
Chicago, IL 4.3 .4 .
Cincinnati, OH .7 .7 . .
Page 10
8/3/2019 NA Industrial Highlights - 3Q 2011
http://slidepdf.com/reader/full/na-industrial-highlights-3q-2011 10/13P. 10 | COllIERs INTERNATIONAl
hIghlIghts | Q3 2011 | INDUSTRIAL | NRTh AmeRIcA
UNITEd sTATEs | INdUsTRIAl sURVEy | RENTs As OF sEPTEMBER 2011
MARkETwAREHOUsE/dIsTRIBUTION
sPACE (Usd PsF)BUlk sPACE(Usd PsF)
FlEX/sERVICE sPACE(Usd PsF)
TECH/R&d sPACE(Usd PsF)
Cleveland, OH 3.37 .
Columbus, OH .7 . 4. 4.
Detroit, MI 3.7 3. 7.9
Grand Rapids, MI 3. 3. 4. .
Indianapolis, IN 3. 3. 7.
Kansas City, MO-KS 3. 3. 7. .
Minneapolis/St. Paul, MN 4.7 4. 4.7
Omaha, NE .7 .9 .73 3.7
St. Louis, MO 3. .9
MIdwEsT AVERAGE . . . 5.5
wEsT
Bakerseld, CA 4. 3.4 .
Boise, ID 4. 4. . .3
Denver, CO 3. 3. . 9.
Faireld, CA .4 .3 .4 .7
Fresno, CA .4 . 4. .
Las Vegas, NV 4. 4. .4 9.
Los Angeles - Inland Empire, CA 3.9 3.79 .7 7.7
Los Angeles, CA .74 . 9.7 .
Oakland, CA 4.37 4. 4. 7.7
Orange County, CA .73 .3 . 3.9
Phoenix, AZ . 4. .3 .
Pleasanton/Walnut Creek, CA .4 4. .3 .3
Portland, OR . 4.7 9.44 9.9
Reno, NV 3.4 4. .4 .4
Sacramento, CA 4.9 3.7 .3 .7
San Diego, CA .4 7.44 . 4.4
San Francisco Peninsula, CA 9.4 9.4 . .
San Jose/Silicon Valley, CA .3 . .4 3.
Seattle/Puget Sound, WA .9 . .
Stockton/San Joaquin County, CA 3.4 3. .44 7.44
wEsT AVERAGE 5.8 . 8.88 .
Us AVERAGE .5 . 8. .
U.s. QUARTERly CHANGE -.% .% -.% -.%
Page 11
8/3/2019 NA Industrial Highlights - 3Q 2011
http://slidepdf.com/reader/full/na-industrial-highlights-3q-2011 11/13
hIghlIghts | Q3 2011 | INDUSTRIAL | NRTh AmeRI
COllIERs INTERNATIONAl | P
CANAdA | INdUsTRIAl sURVEy
MARkET
EXIsTINGINVENTORy (sF)sEPT 30, 2011
NEw CONsTRUCTIONQ3 2011 (sF)
NEw CONsTRUCTIONyTd 2011
CURRENTly UNdERCONsTRUCTION (sF)
Calgary, AB 4,4, ,7, ,7, ,7,
Edmonton, AB 77,4, 3, 9,
Guelph, ON 9,94, , , 9,
Halifax, NS 7,7, , ,
Montreal, QC 347,77, ,
Ottawa, ON ,7,
Regina, SK ,9, 3, 99,
Saskatoon, SK ,, , 4, 4,
Toronto, ON 7,9, 77, ,7, ,9,
Vancouver, BC 79,3, ,, ,, ,,
Victoria, BC ,9, 43, ,
Waterloo Region, ON ,7, 9, 9, ,
CANAdA TOTAl ,5,8, ,, ,, 8,8,
CANAdA | INdUsTRIAl sURVEy
MARkETABsORPTIONQ3 2011 (sF)
ABsORPTIONyTd 2011
VACANCy RATEJUNE 30, 2011 (%)
VACANCy RATEsEPT. 30, 2011 (%)
Calgary, AB ,, ,4, .3 4.3
Edmonton, AB 7, , 3.4 3.4
Guelph, ON 9, , 3. 3.
Halifax, NS 7, (97,) .93 .3
Montreal, QC (,7,) (77,) .4 .
Ottawa, ON 9, (,) 7. .4
Regina, SK (4,) , .9 .
Saskatoon, SK 4, 3, .7 3.7
Toronto, ON ,34, 9,7, 4.97 4.9
Vancouver, BC , ,3, 4. 4.9
Victoria, BC , 3.37 3.37
Waterloo Region, ON (,) (44,) . .3
CANAdA TOTAl ,8, ,, . .8
Page 12
8/3/2019 NA Industrial Highlights - 3Q 2011
http://slidepdf.com/reader/full/na-industrial-highlights-3q-2011 12/13P. 12 | COllIERs INTERNATIONAl
hIghlIghts | Q3 2011 | INDUSTRIAL | NRTh AmeRIcA
CANAdA | INdUsTRIAl sURVEy | sAlEs PRICE ANd CAP RATE As OF sEPTEMBER 2011
MARkETsAlEs PRICE
(CAd PsF)CAP RATE
(%)VACANCy FORECAsT
(3 MONTHs)ABsORPTION FORECAsT
(3 MONTHs)RENT FORECAsT
3 MONTHs
Calgary, AB . .7 Down Up Increasing
Edmonton, AB .4 7.44 Up Down Bottoming
Guelph, ON 4. . Same Same No clear direction
Halifax, NS 9. 7.7 Down Up Increasing
Montreal, QC . . Same Same No clear direction
Ottawa, ON . . Down Up No clear direction
Regina, SK 3. 7. Same Same Peaking
Saskatoon, SK 3. 7. Same Same Peaking
Toronto, ON 7. .7 Down Up Bottoming
Vancouver, BC . . Same Same Bottoming
Victoria, BC 7. .7 Down Up Bottoming
Waterloo Region, ON 3. . Same Same No clear direction
CANAdA AVERAGE . .5 – – –
CANAdA | INdUsTRIAl sURVEy | RENTs As OF sEPTEMBER 2011
MARkETwAREHOUsE/dIsTRIBUTION
sPACE (CAd PsF)BUlk sPACE(CAd PsF)
FlEX/sERVICE sPACE(CAd PsF)
TECH/R&d sPACE(CAd PsF)
Calgary, AB . . . .
Edmonton, AB 7.7 . 9. .
Guelph, ON 4.4 4.4 7.7 7.7
Halifax, NS 7.7 . . .
Montreal, QC 4.7 4. . .
Ottawa, ON 7. 7. . .Regina, SK 9. 7. . 4.
Saskatoon, SK 9. . . 3.
Toronto, ON 4.9 4.4 7.4 7.
Vancouver, BC 7.44 7. . 9.
Victoria, BC . . 3. 3.
Waterloo Region, ON 4.3 3.4 . .
CANAdA AVERAGE .5 . . .5
CANAdA QUARTERly CHANGE .% .5% -.% .%
GlossaryAborption – Net change in leased space over agiven period of time.
Bu space – 100,000 square feet or more with upto 10 percent oce space, the balance being generalwarehouse space with 20 to 6 foot ceiling heights.All loading is dock-height.
Fex space – Single-story buildings having 10- to18-foot ceilings with both oor-height and dock-height loading. Includes wide variation in ocespace utilization, ranging from retail and personalservice through distribution, light industrial andoccasional heavy industrial use.
Inventor – Includes all existing multi or single
tenant leased and owner-occupied industrialwarehouse, light manufacturing, ex and R&Dproperties greater than or equal to 10,000square feet.
Ne Contruction – Includes completed speculativeand build-to-suit construction. New constructionquoted on a net basis after any demolitions orconversions.
service space – Single story (or mezzanine) with10- to 16-foot ceilings with frontage treatment onone side and dock-height loading or grade levelroll-up doors on the other. Less than 15% oce.
Tech/R&d – One- and two- story, 10- to 15-footceiling heights with up to 50% oce/dry lab space
(remainder in wet lab, workshop, storage and othe
support), with dock-height and oor-height loadinTripe Net Rent – Includes rent payable to thelandlord and does not include additional expensessuch as taxes, insurance, maintenance, janitorial autilities. All industrial and high-tech/R&D rents inthis report are quoted on an annual, triple net persquare foot basis in U.S. dollars.
Vacanc Rate – Percentage of total inventoryavailable (both vacant and occupied) as at the surdate including direct vacant and sublease space.
warehoue – 50,000 square feet or more with up15 percent oce space, the balance being generalwarehouse space with 18- to 0- foot ceilingheights. All loading is dock-height.
Page 13
8/3/2019 NA Industrial Highlights - 3Q 2011
http://slidepdf.com/reader/full/na-industrial-highlights-3q-2011 13/13
hIghlIghts | Q3 2011 | INDUSTRIAL | NRTh AmeRIcA
COllIERs INTERNATIONAl
601 Union Street, Suite 800
Seattle, WA 8101
TEl +1 206 65 200
FOR MORE INFORMATION
Ross J. Moore
Chief Economist | USA
TEl +1 61 22 0221
EMAIl [email protected]
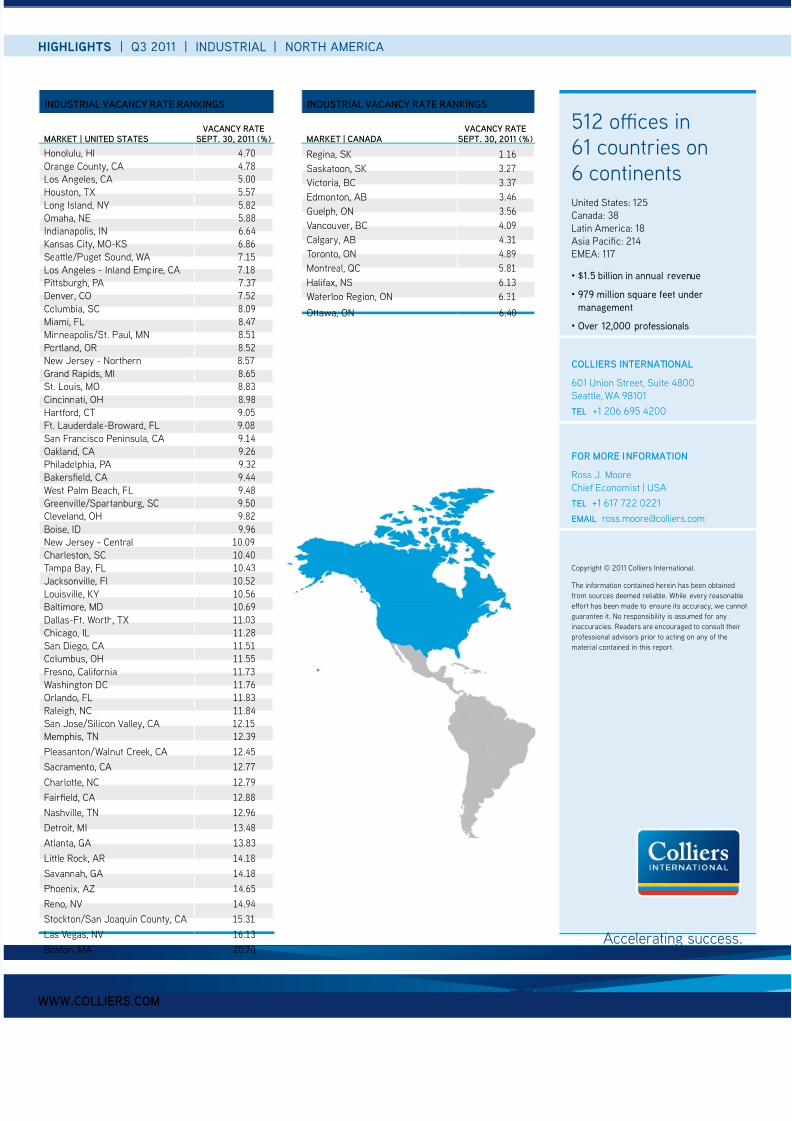
512 oces in61 countries on6 continentsUnited States: 125Canada: 8
Latin America: 18
Asia Pacic: 21EMEA: 11
• $1.5 billion in annual rvnu
• 979 illion squar ft undr
anagnt
• vr 12,000 profssionals
Copyright © 2011 Colliers International.
The information contained herein has been obtainedfrom sources deemed reliable. While every reasonable
eort has been made to ensure its accuracy, we cann
guarantee it. No responsibility is assumed for any
inaccuracies. Readers are encouraged to consult their
professional advisors prior to acting on any of the
material contained in this report.
Accelerating success
INdUsTRIAl VACANCy RATE RANkINGs
MARkET | UNITEd sTATEsVACANCy RATE
sEPT. 30, 2011 (%)
Honolulu, HI 4.7
Orange County, CA 4.7
Los Angeles, CA .
Houston, TX .7Long Island, NY .
Omaha, NE .
Indianapolis, IN .4
Kansas City, MO-KS .
Seattle/Puget Sound, WA 7.
Los Angeles - Inland Empire, CA 7.
Pittsburgh, PA 7.37
Denver, CO 7.
Columbia, SC .9
Miami, FL .47
Minneapolis/St. Paul, MN .
Portland, OR .
New Jersey - Northern .7
Grand Rapids, MI .
St. Louis, MO .3
Cincinnati, OH .9
Hartford, CT 9.
Ft. Lauderdale-Broward, FL 9.
San Francisco Peninsula, CA 9.4
Oakland, CA 9.
Philadelphia, PA 9.3
Bakerseld, CA 9.44
West Palm Beach, FL 9.4
Greenville/Spartanburg, SC 9.
Cleveland, OH 9.
Boise, ID 9.9
New Jersey - Central .9
Charleston, SC .4
Tampa Bay, FL .43
Jacksonville, Fl .
Louisville, KY .
Baltimore, MD .9
Dallas-Ft. Worth, TX .3
Chicago, IL .
San Diego, CA .
Columbus, OH .
Fresno, California .73
Washington DC .7
Orlando, FL .3
Raleigh, NC .4
San Jose/Silicon Valley, CA .
Memphis, TN .39
Pleasanton/Walnut Creek, CA .4
Sacramento, CA .77
Charlotte, NC .79Faireld, CA .
Nashville, TN .9
Detroit, MI 3.4
Atlanta, GA 3.3
Little Rock, AR 4.
Savannah, GA 4.
Phoenix, AZ 4.
Reno, NV 4.94
Stockton/San Joaquin County, CA .3
Las Vegas, NV .3
Boston, MA .7
INdUsTRIAl VACANCy RATE RANkINGs
MARkET | CANAdAVACANCy RATE
sEPT. 30, 2011 (%)
Regina, SK .
Saskatoon, SK 3.7
Victoria, BC 3.37
Edmonton, AB 3.4Guelph, ON 3.
Vancouver, BC 4.9
Calgary, AB 4.3
Toronto, ON 4.9
Montreal, QC .
Halifax, NS .3
Waterloo Region, ON .3
Ottawa, ON .4