Chickpea improvement through genetic analysis and Quantitative Trait Locus (QTL) mapping of ascochyta blight resistance using wild Cicer species Nader Aryamanesh B.Sc. (Agronomy and Plant Breeding), The Azad University of Tabriz, Iran M.Sc. (Plant Breeding), The University of Tabriz, Iran This thesis is presented for the degree of Doctor of Philosophy of the University of Western Australia School of Plant Biology Faculty of Natural and Agricultural Sciences 2007
Transcript
Chickpea improvement through genetic analysis and
Quantitative Trait Locus (QTL) mapping of ascochyta
blight resistance using wild Cicer species
Nader Aryamanesh
B.Sc. (Agronomy and Plant Breeding), The Azad University of Tabriz, Iran
M.Sc. (Plant Breeding), The University of Tabriz, Iran
This thesis is presented for the degree of Doctor of
Philosophy of the University of Western Australia
School of Plant Biology
Faculty of Natural and Agricultural Sciences
2007
i
Abstract
The genetics of ascochyta blight resistance was studied in five 5 x 5 half-diallel
24B-Isoline, IG 9337 and Kimberley Large), three accessions of Cicer reticulatum
(ILWC 118, ILWC 139 and ILWC 184) and one accession of C. echinospermum
(ILWC 181) under field conditions. Both F1 and F2 generations were used in the diallel
analysis. Almaz, ICC 3996 and ILWC 118 were the most resistant genotypes. Estimates
of genetic parameters, following Hayman's method, showed significant additive and
dominant gene actions. The analysis also revealed the involvement of both major and
minor genes. Susceptibility was dominant over resistance to ascochyta blight. The
recessive alleles were concentrated in the two resistant chickpea parents ICC 3996 and
Almaz, and one C. reticulatum genotype ILWC 118. High narrow-sense heritability
(ranging from 82 to 86% for F1 generations, and 43 to 63% for F2 generations) indicates
that additive gene effects were more important than non-additive gene effects in the
inheritance of the trait and greater genetic gain by breeding resistant chickpea cultivars
using carefully selected parental genotypes.
Current simple leaf varieties are often susceptible to ascochyta blight disease
whereas varieties of other leaf types range from resistant to susceptible. The inheritance
of ascochyta blight resistance and different leaf types and their correlation were
investigated in intraspecific progeny derived from crosses among two resistant
genotypes with normal leaf type (ICC 3996 and Almaz), one susceptible simple leaf
type (Kimberley Large) and one susceptible multipinnate leaf type (24 B-Isoline).
Susceptibility to ascochyta blight was not correlated to multipinnate or simple leaf types
in these segregating populations. Ascochyta blight resistance depends more on the
genetic background than leaf type. Leaf types were controlled by two genes with a
dihybrid supplementary gene action. Normal leaf type was dominant over both simple
and multipinnate leaf types. Inheritance of ascochyta blight resistance was mainly
controlled by two major recessive genes in this study.
An interspecific F2 mapping population derived from a cross between chickpea
accession ICC 3996 (resistant to ascochyta blight, early flowering, and semi-erect plant
growth habit) and C. reticulatum accession ILWC 184 (susceptible to ascochyta blight,
ii
late flowering, and prostrate plant growth habit) was used for constructing a genetic
linkage map. F2 plants were cloned through stem cuttings taken at pre-flowering stage,
treated with plant growth regulator powder (0.5 mg/g indole butyric acid (IBA) and 0.5
mg/g naphthalene acetic acid (NAA)) and grown in a sand + potting mix substrate.
Clones were screened for ascochyta blight resistance in controlled environment
conditions using a 1–9 scale. Three quantitative trait loci (QTLs) were found for
ascochyta blight resistance in this population. Two linked QTLs, located on linkage
group (LG) 4, explained 21.1% and 4.9% of the phenotypic variation. The other QTL,
located on LG3, explained 22.7% of the phenotypic variation for ascochyta blight
resistance. These QTLs explained almost 49% of the variation for ascochyta blight
resistance. LG3 had two major QTLs for days to flowering (explaining 90.2% of
phenotypic variation) and a major single QTL for plant growth habit (explaining 95.2%
of phenotypic variation). There was a negative correlation between ascochyta blight
resistance and days to flowering, and a positive correlation between days to flowering
and plant growth habit. The flanking markers for ascochyta blight resistance or other
morphological characters can be used in marker-assisted selections to facilitate breeding
programs.
iii
Table of Contents Abstract ..............................................................................................................................i Table of Contents .............................................................................................................iii Acknowledgements..........................................................................................................vi Statement of Candidate Contribution.............................................................................viii Publications pertaining to this thesis................................................................................ix List of Abbreviations ........................................................................................................x List of Figures ..................................................................................................................xi List of Tables .................................................................................................................xiii Chapter One ......................................................................................................................1 General Introduction .........................................................................................................1
1.1. Background .......................................................................................................1 1.2. Aims of the project............................................................................................2 1.3. Organisation of thesis........................................................................................3
Chapter Two......................................................................................................................5 Review of literature...........................................................................................................5
2.1. Chickpea............................................................................................................5 2.1.1. Origin ........................................................................................................5 2.1.2. Cultivation.................................................................................................6 2.1.3. The Genus Cicer .......................................................................................7 2.1.4. Constraints to chickpea production...........................................................8
2.2. Interspecific hybridisation of chickpea and wild Cicer species ........................9 2.2.1. Importance of wild Cicer in chickpea improvement.................................9 2.2.2. Annual Cicer species and the genepool theory .......................................11 2.2.3. Crossability of wild Cicer species with cultivated chickpea ..................12 2.2.4. Use of wild Cicer species to improve chickpea cultivars .......................15
2.3. Genetics of important traits of economic significance in chickpea ................15 2.3.1. Ascochyta blight resistance.....................................................................15 2.3.1.1. Importance ..........................................................................................15 2.3.1.2. Pathotypes of Ascochyta rabiei ...........................................................18 2.3.1.3. Source of resistance to ascochyta blight in chickpea germplasm .......19 2.3.1.4. Source of resistance to ascochyta blight in wild annual Cicer species19 2.3.1.5. Genetics of ascochyta blight resistance...............................................19 2.3.2. Leaf types................................................................................................21 2.3.2.1. Leaf features in chickpea ....................................................................21 2.3.2.2. Genetics of leaf types in chickpea.......................................................21 2.3.2.3. Leaf types and ascochyta blight resistance in chickpea......................24 2.3.3. Flowering time ........................................................................................24 2.3.3.1. Flowering time and chickpea production............................................24 2.3.3.2. Genetics of flowering time..................................................................25 2.3.3.3. Flowering time and ascochyta blight resistance in chickpea ..............26
2.4. Genetic mapping of important traits ...............................................................26 2.4.1. Current status of genetic mapping in chickpea .......................................26 2.4.2. QTL mapping of ascochyta blight resistance..........................................29 2.4.3. QTL mapping of flowering time.............................................................31 2.4.4. Limitations to mapping and disease assessment .....................................33 2.4.4.1. Population size and clonal material production ..................................33 2.4.4.2. Comparison of F2 generations and RILs in mapping studies..............33
iv
2.5. Development of stem cutting techniques for disease assessment and early generation mapping.....................................................................................................33
2.5.1. Propagation by stem cutting in chickpea ................................................34 2.5.2. Increasing population size using stem cuttings.......................................34 2.5.3. Use of stem cuttings for reliable phenotyping ........................................34
2.6. Conclusions.....................................................................................................35 Chapter Three..................................................................................................................37 Interspecific Hybridisation of Cicer species ...................................................................37
3.1. Introduction.....................................................................................................37 3.2. Materials and Methods....................................................................................38
3.2.1. Plant materials and hybridisation............................................................38 3.2.2. Evaluation of hybrid fertility...................................................................40
3.3. Results .............................................................................................................41 3.3.1. Interspecific hybridisation in compatible Cicer species .........................41 3.3.2. Interspecific hybridisation in incompatible Cicer species ......................43 3.3.3. Intraspecific hybridisation.......................................................................43 3.3.4. Assessments hybrid progeny...................................................................46 3.3.4.1. Pollen viability ....................................................................................46 3.3.4.2. Morphological assessment of hybrids.................................................47
3.4. Discussion .......................................................................................................49 Chapter Four ...................................................................................................................52 Diallel analyses reveal the genetic control of resistance to ascochyta blight in diverse chickpea and wild Cicer species .....................................................................................52
4.1. Introduction.....................................................................................................52 4.2. Materials and methods ....................................................................................54
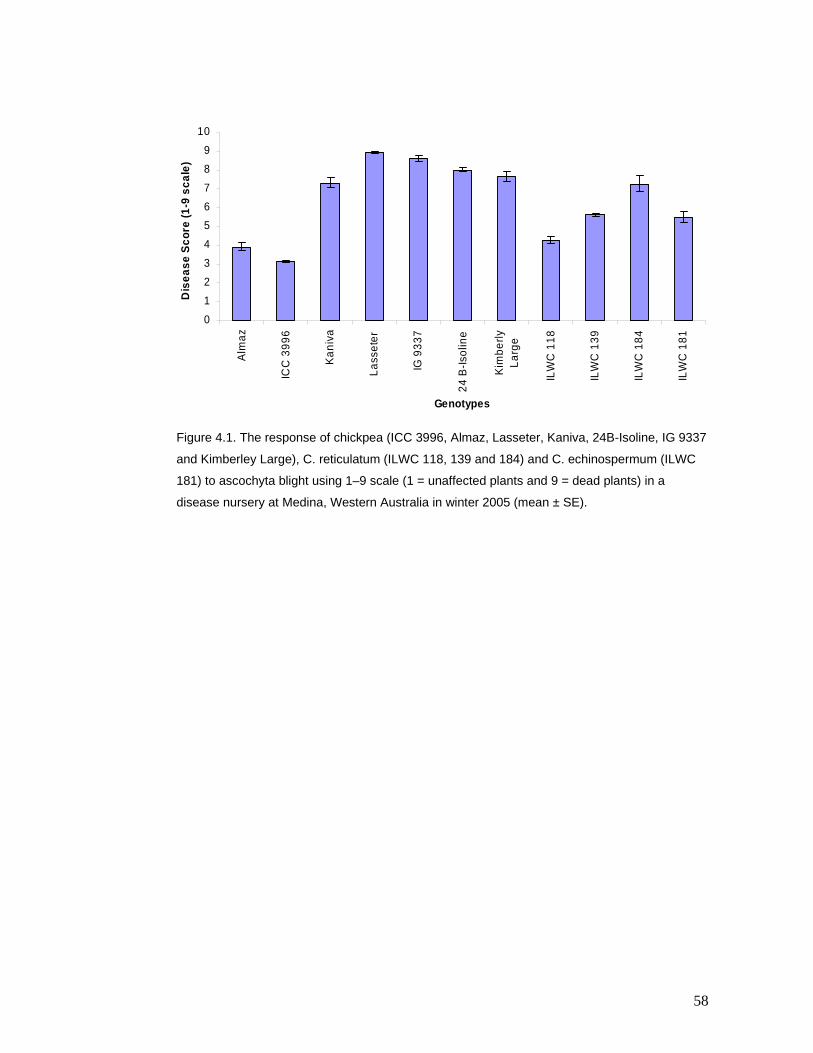
4.3. Results .............................................................................................................57 4.3.1. Ascochyta blight reaction........................................................................57 4.3.2. ANOVA using Hayman diallel analysis procedure ................................60 4.3.3. Graphic analysis of Hayman ...................................................................60 4.3.3.1. Model adequacy ..................................................................................60 4.3.3.2. Plot of Wr/Vr ......................................................................................63 4.3.4. Genetic components and heritability of ascochyta blight resistance ......63
4.4. Discussion .......................................................................................................68 Chapter Five....................................................................................................................71 Leaf type is not associated with ascochyta blight resistance in chickpea (Cicer arietinum L.) …………………………………………………………………………………….71
5.1. Introduction.....................................................................................................71 5.2. Material and methods......................................................................................73
5.2.1. Plant material ..........................................................................................73 5.2.2. Leaf type and assessment of ascochyta blight disease response.............74 5.2.3. Statistical analysis ...................................................................................76
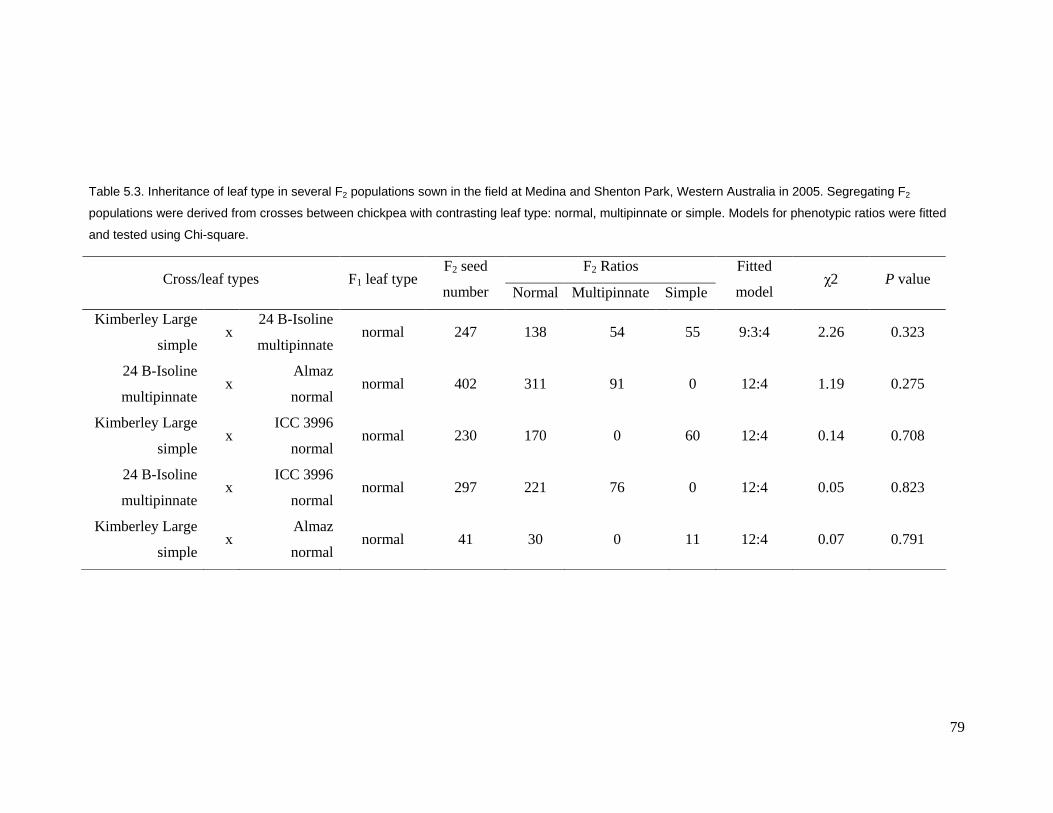
5.3. Results .................................................................................................................76 5.3.1. Inheritance of ascochyta blight resistance...............................................76 5.3.2. Inheritance of leaf types..........................................................................80 5.3.3. Correlations.............................................................................................80
Successful stem cutting propagation of chickpea, its wild relatives and their interspecific hybrids.............................................................................................................................86
6.1. Introduction.....................................................................................................86 6.2. Materials and methods ....................................................................................88
6.3.1. Rooting treatments ..................................................................................90 6.3.2. Genotype and stage of plant development ..............................................92
6.4. Discussion .......................................................................................................95 Chapter Seven .................................................................................................................98 QTL mapping of ascochyta blight resistance, days to flowering and plant growth habit in interspecific progenies derived from a cross between chickpea and C. reticulatum ..98
7.1. Introduction.....................................................................................................98 7.2. Material and methods....................................................................................100
7.2.1. Plant material and mapping population.................................................100 7.2.2. Inoculum preparation ............................................................................100 7.2.3. Phenotypic assessment of ascochyta blight resistance, days to flowering and plant growth habit in the glasshouse ..............................................................100 7.2.4. DNA extraction and microsatellite-marker analysis .............................101 7.2.5. Linkage analysis and QTL detection.....................................................102
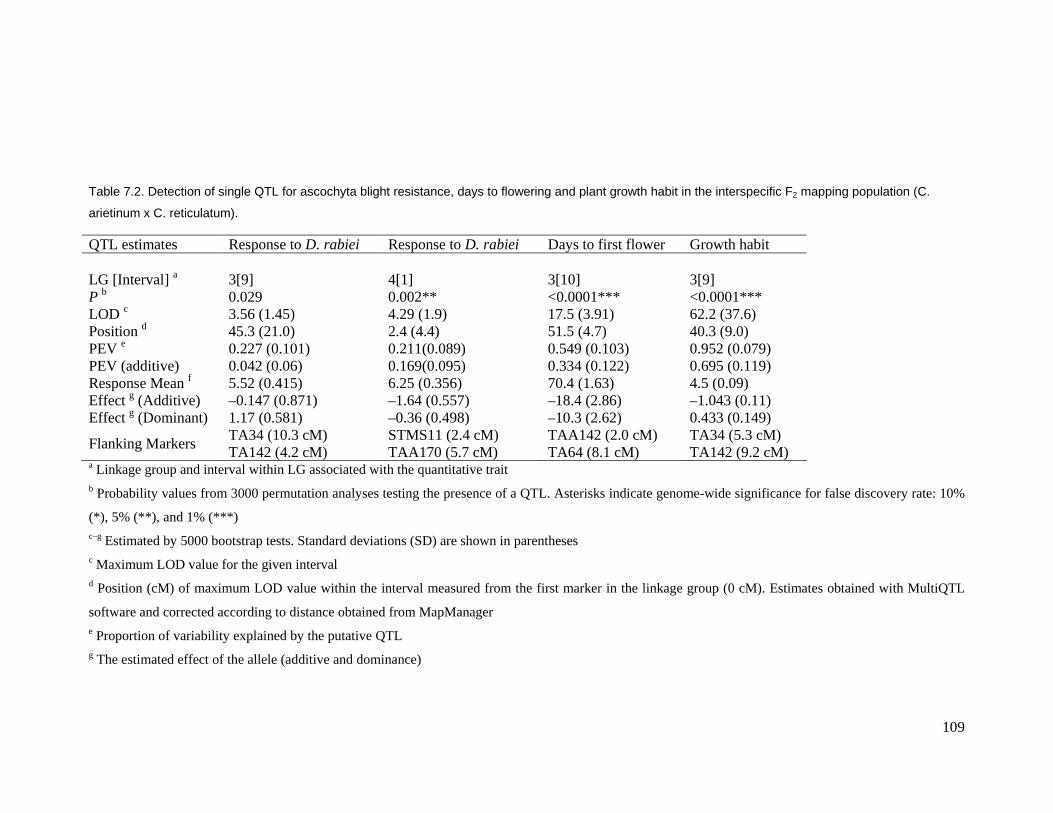
7.3. Results ...........................................................................................................103 7.3.1. Phenotypic assessment..........................................................................103 7.3.1.1. Resistance to Ascochyta rabiei .........................................................103 7.3.1.2. Days to flowering..............................................................................103 7.3.1.3. Plant growth habit .............................................................................104 7.3.2. Correlations...........................................................................................104 7.3.3. General features of the map ..................................................................104 7.3.4. QTL analysis .........................................................................................108 7.3.4.1. Effect of a single QTL on a quantitative trait ...................................108 7.3.4.2. Effect of two linked QTL on a quantitative trait...............................110
7.4. Discussion .....................................................................................................114 7.4.1. QTL mapping........................................................................................114 7.4.2. Segregation distortion ...........................................................................116 7.4.3. Inheritance of the traits..........................................................................117 7.4.4. Correlations of the three traits examined ..............................................117 7.4.5. Clonal plants .........................................................................................118
7.5. Conclusion ....................................................................................................118 Chapter Eight ................................................................................................................119 General Discussion .......................................................................................................119
8.1. Introduction...................................................................................................119 8.2. Successful utilisation of wild relatives in chickpea improvement ................119 8.3. Greater understanding of the genetic control of desirable traits and their relationship................................................................................................................121 8.4. Reliable disease screening: a new approach with ‘cloned’ F2 plants from cuttings ......................................................................................................................122 8.5. New QTLs for ascochyta blight resistance, flowering time and plant growth habit added to the chickpea map ...............................................................................123 8.6. Future Directions...........................................................................................124
24B-Isoline, IG 9337 and Kimberley Large), three accessions of Cicer reticulatum
(ILWC 118, ILWC 139 and ILWC 184) and one accession of C. echinospermum
(ILWC 181) under field conditions. Both F1 and F2 generations were used in the diallel
analysis. Almaz, ICC 3996 and ILWC 118 were the most resistant genotypes. Estimates
of genetic parameters, following Hayman's method, showed significant additive and
dominant gene actions. The analysis also revealed the involvement of both major and
minor genes. Susceptibility was dominant over resistance to ascochyta blight. The
recessive alleles were concentrated in the two resistant chickpea parents ICC 3996 and
Almaz, and one C. reticulatum genotype ILWC 118. High narrow-sense heritability
(ranging from 82 to 86% for F1 generations, and 43 to 63% for F2 generations) indicates
that additive gene effects were more important than non-additive gene effects in the
inheritance of the trait and greater genetic gain by breeding resistant chickpea cultivars
using carefully selected parental genotypes.
Current simple leaf varieties are often susceptible to ascochyta blight disease
whereas varieties of other leaf types range from resistant to susceptible. The inheritance
of ascochyta blight resistance and different leaf types and their correlation were
investigated in intraspecific progeny derived from crosses among two resistant
genotypes with normal leaf type (ICC 3996 and Almaz), one susceptible simple leaf
type (Kimberley Large) and one susceptible multipinnate leaf type (24 B-Isoline).
Susceptibility to ascochyta blight was not correlated to multipinnate or simple leaf types
in these segregating populations. Ascochyta blight resistance depends more on the
genetic background than leaf type. Leaf types were controlled by two genes with a
dihybrid supplementary gene action. Normal leaf type was dominant over both simple
and multipinnate leaf types. Inheritance of ascochyta blight resistance was mainly
controlled by two major recessive genes in this study.
An interspecific F2 mapping population derived from a cross between chickpea
accession ICC 3996 (resistant to ascochyta blight, early flowering, and semi-erect plant
growth habit) and C. reticulatum accession ILWC 184 (susceptible to ascochyta blight,
ii
late flowering, and prostrate plant growth habit) was used for constructing a genetic
linkage map. F2 plants were cloned through stem cuttings taken at pre-flowering stage,
treated with plant growth regulator powder (0.5 mg/g indole butyric acid (IBA) and 0.5
mg/g naphthalene acetic acid (NAA)) and grown in a sand + potting mix substrate.
Clones were screened for ascochyta blight resistance in controlled environment
conditions using a 1–9 scale. Three quantitative trait loci (QTLs) were found for
ascochyta blight resistance in this population. Two linked QTLs, located on linkage
group (LG) 4, explained 21.1% and 4.9% of the phenotypic variation. The other QTL,
located on LG3, explained 22.7% of the phenotypic variation for ascochyta blight
resistance. These QTLs explained almost 49% of the variation for ascochyta blight
resistance. LG3 had two major QTLs for days to flowering (explaining 90.2% of
phenotypic variation) and a major single QTL for plant growth habit (explaining 95.2%
of phenotypic variation). There was a negative correlation between ascochyta blight
resistance and days to flowering, and a positive correlation between days to flowering
and plant growth habit. The flanking markers for ascochyta blight resistance or other
morphological characters can be used in marker-assisted selections to facilitate breeding
programs.
iii
Table of Contents Abstract ..............................................................................................................................i Table of Contents .............................................................................................................iii Acknowledgements..........................................................................................................vi Statement of Candidate Contribution.............................................................................viii Publications pertaining to this thesis................................................................................ix List of Abbreviations ........................................................................................................x List of Figures ..................................................................................................................xi List of Tables .................................................................................................................xiii Chapter One ......................................................................................................................1 General Introduction .........................................................................................................1
1.1. Background .......................................................................................................1 1.2. Aims of the project............................................................................................2 1.3. Organisation of thesis........................................................................................3
Chapter Two......................................................................................................................5 Review of literature...........................................................................................................5
2.1. Chickpea............................................................................................................5 2.1.1. Origin ........................................................................................................5 2.1.2. Cultivation.................................................................................................6 2.1.3. The Genus Cicer .......................................................................................7 2.1.4. Constraints to chickpea production...........................................................8
2.2. Interspecific hybridisation of chickpea and wild Cicer species ........................9 2.2.1. Importance of wild Cicer in chickpea improvement.................................9 2.2.2. Annual Cicer species and the genepool theory .......................................11 2.2.3. Crossability of wild Cicer species with cultivated chickpea ..................12 2.2.4. Use of wild Cicer species to improve chickpea cultivars .......................15
2.3. Genetics of important traits of economic significance in chickpea ................15 2.3.1. Ascochyta blight resistance.....................................................................15 2.3.1.1. Importance ..........................................................................................15 2.3.1.2. Pathotypes of Ascochyta rabiei ...........................................................18 2.3.1.3. Source of resistance to ascochyta blight in chickpea germplasm .......19 2.3.1.4. Source of resistance to ascochyta blight in wild annual Cicer species19 2.3.1.5. Genetics of ascochyta blight resistance...............................................19 2.3.2. Leaf types................................................................................................21 2.3.2.1. Leaf features in chickpea ....................................................................21 2.3.2.2. Genetics of leaf types in chickpea.......................................................21 2.3.2.3. Leaf types and ascochyta blight resistance in chickpea......................24 2.3.3. Flowering time ........................................................................................24 2.3.3.1. Flowering time and chickpea production............................................24 2.3.3.2. Genetics of flowering time..................................................................25 2.3.3.3. Flowering time and ascochyta blight resistance in chickpea ..............26
2.4. Genetic mapping of important traits ...............................................................26 2.4.1. Current status of genetic mapping in chickpea .......................................26 2.4.2. QTL mapping of ascochyta blight resistance..........................................29 2.4.3. QTL mapping of flowering time.............................................................31 2.4.4. Limitations to mapping and disease assessment .....................................33 2.4.4.1. Population size and clonal material production ..................................33 2.4.4.2. Comparison of F2 generations and RILs in mapping studies..............33
iv
2.5. Development of stem cutting techniques for disease assessment and early generation mapping.....................................................................................................33
2.5.1. Propagation by stem cutting in chickpea ................................................34 2.5.2. Increasing population size using stem cuttings.......................................34 2.5.3. Use of stem cuttings for reliable phenotyping ........................................34
2.6. Conclusions.....................................................................................................35 Chapter Three..................................................................................................................37 Interspecific Hybridisation of Cicer species ...................................................................37
3.1. Introduction.....................................................................................................37 3.2. Materials and Methods....................................................................................38
3.2.1. Plant materials and hybridisation............................................................38 3.2.2. Evaluation of hybrid fertility...................................................................40
3.3. Results .............................................................................................................41 3.3.1. Interspecific hybridisation in compatible Cicer species .........................41 3.3.2. Interspecific hybridisation in incompatible Cicer species ......................43 3.3.3. Intraspecific hybridisation.......................................................................43 3.3.4. Assessments hybrid progeny...................................................................46 3.3.4.1. Pollen viability ....................................................................................46 3.3.4.2. Morphological assessment of hybrids.................................................47
3.4. Discussion .......................................................................................................49 Chapter Four ...................................................................................................................52 Diallel analyses reveal the genetic control of resistance to ascochyta blight in diverse chickpea and wild Cicer species .....................................................................................52
4.1. Introduction.....................................................................................................52 4.2. Materials and methods ....................................................................................54
4.3. Results .............................................................................................................57 4.3.1. Ascochyta blight reaction........................................................................57 4.3.2. ANOVA using Hayman diallel analysis procedure ................................60 4.3.3. Graphic analysis of Hayman ...................................................................60 4.3.3.1. Model adequacy ..................................................................................60 4.3.3.2. Plot of Wr/Vr ......................................................................................63 4.3.4. Genetic components and heritability of ascochyta blight resistance ......63
4.4. Discussion .......................................................................................................68 Chapter Five....................................................................................................................71 Leaf type is not associated with ascochyta blight resistance in chickpea (Cicer arietinum L.) …………………………………………………………………………………….71
5.1. Introduction.....................................................................................................71 5.2. Material and methods......................................................................................73
5.2.1. Plant material ..........................................................................................73 5.2.2. Leaf type and assessment of ascochyta blight disease response.............74 5.2.3. Statistical analysis ...................................................................................76
5.3. Results .................................................................................................................76 5.3.1. Inheritance of ascochyta blight resistance...............................................76 5.3.2. Inheritance of leaf types..........................................................................80 5.3.3. Correlations.............................................................................................80
Successful stem cutting propagation of chickpea, its wild relatives and their interspecific hybrids.............................................................................................................................86
6.1. Introduction.....................................................................................................86 6.2. Materials and methods ....................................................................................88
6.3.1. Rooting treatments ..................................................................................90 6.3.2. Genotype and stage of plant development ..............................................92
6.4. Discussion .......................................................................................................95 Chapter Seven .................................................................................................................98 QTL mapping of ascochyta blight resistance, days to flowering and plant growth habit in interspecific progenies derived from a cross between chickpea and C. reticulatum ..98
7.1. Introduction.....................................................................................................98 7.2. Material and methods....................................................................................100
7.2.1. Plant material and mapping population.................................................100 7.2.2. Inoculum preparation ............................................................................100 7.2.3. Phenotypic assessment of ascochyta blight resistance, days to flowering and plant growth habit in the glasshouse ..............................................................100 7.2.4. DNA extraction and microsatellite-marker analysis .............................101 7.2.5. Linkage analysis and QTL detection.....................................................102
7.3. Results ...........................................................................................................103 7.3.1. Phenotypic assessment..........................................................................103 7.3.1.1. Resistance to Ascochyta rabiei .........................................................103 7.3.1.2. Days to flowering..............................................................................103 7.3.1.3. Plant growth habit .............................................................................104 7.3.2. Correlations...........................................................................................104 7.3.3. General features of the map ..................................................................104 7.3.4. QTL analysis .........................................................................................108 7.3.4.1. Effect of a single QTL on a quantitative trait ...................................108 7.3.4.2. Effect of two linked QTL on a quantitative trait...............................110
7.4. Discussion .....................................................................................................114 7.4.1. QTL mapping........................................................................................114 7.4.2. Segregation distortion ...........................................................................116 7.4.3. Inheritance of the traits..........................................................................117 7.4.4. Correlations of the three traits examined ..............................................117 7.4.5. Clonal plants .........................................................................................118
7.5. Conclusion ....................................................................................................118 Chapter Eight ................................................................................................................119 General Discussion .......................................................................................................119
8.1. Introduction...................................................................................................119 8.2. Successful utilisation of wild relatives in chickpea improvement ................119 8.3. Greater understanding of the genetic control of desirable traits and their relationship................................................................................................................121 8.4. Reliable disease screening: a new approach with ‘cloned’ F2 plants from cuttings ......................................................................................................................122 8.5. New QTLs for ascochyta blight resistance, flowering time and plant growth habit added to the chickpea map ...............................................................................123 8.6. Future Directions...........................................................................................124
Table 6.2. The response of different genotypes, in rooting rates and survival rates, after
treatment with PGR powder and growth in a mixture of sand and potting mix
substrate (2:3 v/v) at the pre-flowering stage. Values are mean ± SE; n=12..........94
Table 7.1. Segregation ratios for ascochyta blight resistance, days to flowering and
growth habit based on 306 F2 individuals. Ascochyta blight resistance was assessed
on clonal plants produced by stem cuttings, while days to flowering and growth
habit were measured on original F2 plants. ...........................................................106
Table 7.2. Detection of single QTL for ascochyta blight resistance, days to flowering
and plant growth habit in the interspecific F2 mapping population (C. arietinum x
C. reticulatum). .....................................................................................................109
Table 7.3. Detection of two linked QTLs controlling ascochyta blight resistance and
days to flowering in the interspecific F2 mapping population in chickpea...........111
1
Chapter One
General Introduction
1.1. Background
Ascochyta blight, caused by Ascochyta rabiei (Pass.) Labr., is a serious fungal
disease of chickpea (Cicer arietinum L.) worldwide, occurring in more than 26
countries (Nene 1982) The pathogen attacks all aerial parts of the plant at any growth
stage, causing from 10% to complete crop failure in severely affected fields (Jimenez-
Diaz et al. 1993; Nene 1984; Nene and Reddy 1987).
Genetic improvement of chickpea is the key for controlling this disease because
fungicides are expensive, do not provide complete protection, and are not
environmentally sustainable (Nene and Reddy 1987). Sustainable management of
ascochyta blight in chickpea includes both integrated crop management practices (Gan
et al. 2006) and the development of resistant cultivars (Collard et al. 2001; Collard et al.
2003b; Nene and Sheila 1992; Pande et al. 2005). Therefore, breeders attempted to
develope high yielding chickpea cultivars with long lasting resistance to ascochyta
blight disease via gene pyramiding (Singh 1997b; van Rheenen and Haware 1997).
Chickpea is a significant grain legume, popular in farming systems in Australia as
a major cash and rotation crop (Siddique and Sykes 1997). It is widely grown as a
winter crop extending from the tropical/sub-tropical, summer rainfall environments of
northern Australia to the Mediterranean type regions of southeastern and southwestern
Australia. It is also an established crop in a number of rainfed farming systems.
Chickpea was introduced to Australia in the 1970s with the first commercial crop,
cultivar ‘Tyson’, grown in New South Wales and Queensland in 1979. The chickpea
industry spread rapidly to Victoria and South Australia, but it took until the mid-1990s
for significant adoption of chickpeas in Western Australia. The chickpea industry in
Australia is highly mechanised with production ranging from 50 ha to more than 1000
ha per farm. The chickpea growing area increased quickly during the 1980s and 1990s
with its peak at 309 000 ha in 1998 (Knights and Siddique 2002).
2
In the mid to late 1990s, the emergence of ascochyta blight in commercial
chickpea crops in Australia (Khan et al. 1999) reduced chickpea production by nearly
90% in southern Australia, resulting in a 50% reduction in chickpea exports (FAO
2005). This highlighted the need for ascochyta blight resistance in Australian-grown
chickpea cultivars (Collard et al. 2003b).
The average chickpea yield in Australia is 1.0 t/ha, ranging from 0.3–1.4 t/ha, due
to considerable seasonal variation (Knights and Siddique 2002). In recent years, yield
has fluctuated considerably with biotic and abiotic stresses causing frequent crop
failures across several regions. Ascochyta blight is the major cause of yield reductions,
potentially affecting 95% of the chickpea production area, with pod borer, drought and
cold also affecting yield and adoption of chickpea in Australia, (Knights and Siddique
2002). As a result, research and industry development efforts are working towards
overcoming the effects of biotic and abiotic stresses on yield reduction in chickpea in
Australia, with particular emphasis on fungal diseases (Knights and Siddique 2002).
The overall objectives of this study were to better understand the inheritance of
ascochyta blight resistance; to identify new sources of resistant genes available in
chickpea germplasm; and to introduce resistance genes from wild relatives among the
genus Cicer to cultivated chickpea.
1.2. Aims of the project
Previous studies have revealed numerous useful genes in wild Cicer species,
which may be used to improve cultivated chickpea (Croser et al. 2003). Among the
annual wild Cicer species, C. reticulatum and C. echinospermum are crossable with
cultivated chickpea; so they can be used as donor parents in interspecific hybridisation
programs. The specific aims of this research were to:
• study the genetics of ascochyta blight resistance in the wide hybrids between
chickpea and wild Cicer species using both F2 generations and diallel analyses;
• investigate the inheritance of leaf type, flowering time and growth habit, and
their association with ascochyta blight resistance in chickpea;
• establish a successful stem cutting method in chickpea and its hybrids to
increase seed number for mapping studies and to produce clonal plant materials
3
for the evaluation of disease response under different environmental
conditions;
• construct a genetic map in an interspecific hybrid population between a
resistant chickpea accession and a wild relative C. reticulatum accession using
microsatellite markers;
• find flanking markers associated with ascochyta blight resistance, flowering
time and plant growth habit.
1.3. Organisation of thesis
The results from this study are presented and discussed in six separate chapters,
preceded by a general introduction and review of literature.
Chapter Three entitled “Interspecific hybridisation of Cicer species” is concerned
with the wide hybridisation of chickpea with its wild Cicer relatives. Attempts were
made to cross chickpea with both compatible and incompatible Cicer species. Pollen
viability of parents, wild Cicer species and interspecific hybrids were investigated.
Chapter Four entitled “Diallel analyses reveal the genetic control of ascochyta
blight resistance in diverse chickpea and wild Cicer species” identified the genetics of
ascochyta blight resistance using diallel crosses between chickpea and both C.
reticulatum and C. echinospermum. The major findings from the study described in this
chapter have been published in Euphytica.
Chapter Five entitled “Leaf type is not associated with ascochyta blight resistance
in chickpea (Cicer arietinum L.)” dealt with the inheritance of ascochyta blight
resistance, leaf types and their correlation. The major findings from the study described
in Chapter 5 have been published in Euphytica.
Chapter Six entitled “Successful stem cutting propagation of chickpea, its wild
relatives and their interspecific hybrids” identified a successful vegetative propagation
method for chickpea and wild Cicer species, used later (in Chapter Seven) to screen
plant material for ascochyta blight resistance. The major findings of this chapter have
been published in Australian Journal of Experimental Agriculture.
Chapter Seven entitled “QTL mapping of ascochyta blight resistance, days to
flowering and plant growth habit in interspecific progenies derived from a cross
between chickpea and C. reticulatum” involved mapping microsatellite markers on the
4
integrated map of Cicer using F2 generations developed from the interspecific cross
between C. arietinum ICC 3996 and C. reticulatum ILWC 184. Several QTLs were
found for ascochyta blight resistance, flowering time, and plant growth habit in
chickpea. The major finding of this chapter will be submitted to Genome.
Chapter Eight entitled “General discussion” summarises the important findings
from this research and implications for future research.
The thesis is packaged as individual published/submitted papers or potential
papers. I have endeavored to minimize any unnecessary repetitions but some repetitions
between chapters are unavoidable.
5
Chapter Two
2. Review of literature
2.1. Chickpea
Chickpea, Cicer arietinum L., a self-pollinating diploid (2n=2x=16) member of
the family Leguminosae and subfamily Papilideae, is the third most important
cultivated grain legume in the world after dry bean (Phaseolus vulgaris L.) and field pea
(Pisum sativum L.)(FAO 2005). Being a legume, chickpea fixes atmospheric nitrogen
(Singh 1997a) and plays a vital role in farming systems as an alternative to continuous
cereal production or fallow. Rotating cereals with chickpea also decreases the potential
inoculum for soil borne root diseases such as take-all and cereal cyst nematode
(Flandez-Galves et al. 2003b)
Chickpea is an important source of protein and energy in some regions of the
world such as the Indian sub-continent, the Near East and across the Mediterranean
basin (Ladizinsky 1995) with its seeds containing 20–30% protein, about 40%
carbohydrate, and 3–6% oil (Gil et al. 1996). It is also a good source of calcium,
magnesium, potassium, phosphorus, iron, zinc and manganese (Ibrikci et al. 2003).
2.1.1. Origin
Cultivated chickpea was one of the first grain legumes to be domesticated in the
old world (van der Maesen 1972), originating as a grain legume crop in the Near East
Neolithic revolution dating some 10 000 years ago (Lev-Yadun et al. 2000). De
Candolle (1884) suggested an area south of the Caucasus and in the north of Persia as
the origin of chickpea, while Vavilov (1926) identified two primary centres of origin
including southwest Asia, the Mediterranean and Ethiopia. He found large-seeded lines
to be predominant around the Mediterranean basin and small-seeded lines to be
abundant towards the east. Ladizinsky and Adler (1976b) considered C. reticulatum the
wild progenitor of cultivated chickpea, based on seed protein electrophoresis, and
considered southeastern Turkey as the centre of origin for the cultivated chickpea.
Recent DNA studies revealed that the maximum genetic diversity of C. reticulatum, C.
6
echinospermum, C. bijugum and C. pinnatifidum was in southeastern Turkey, and of C.
judaicum in Palestine (Shan et al. 2004) (Figure 2.1).
Figure 2.1. Geographical locations of the wild annual Cicer species based on maximum genetic
variation analysis. The locations plotted on the map are represented by shaded ellipses with the
species name adjacent. The large circles surrounding the locations suggest an area with the
best potential for future collections. Source from Shan et al (2004).
2.1.2. Cultivation
Chickpea is cultivated in arid and semi-arid areas around the world, mostly in
Central and West Asia, the Indian subcontinent, southern Europe, Ethiopia, North
Africa, South America, and more recently in Canada and Australia (FAO 2005). India,
Pakistan and Turkey are the major producers of chickpea contributing 62.5%, 9.9% and
6.9%, respectively, to world production (8.75 million tonnes) (Figure 2.2).
7
Figure 2.2. World chickpea production in 2005 (million tonnes; total 8.75 million tonnes) (FAO
2005).
2.1.3. The Genus Cicer
The genus Cicer L. (family Leguminoseae, subfamily Papilionacea) was
originally in the tribe Viciae but now has its own monogeneric tribe Cicereae Alef.
(Kupicha 1977) The genus Cicer consists of 43 chickpea species with 9 annuals, 33
perennials and one unclassified (Table 2.1) (van der Maesen 1987). Based on
morphological characteristics, life cycle and geographical distribution, the nine annual
species have been classified into two sections; of which eight belong in the section
MonoCicer (C. arietinum, C. reticulatum, C. echinospermum, C. bijugum, C. judaicum,
C. pinnatifidum, C. yamashitae and C. cuneatum) and C. chorassanicum in
ChamaeCicer (van der Maesen 1987).
India (5.47)
Pakistan (0.87)
Turkey (0.61)
Myanmar (0.53)
Iran (0.31)
Ethiopia (0.22)
Mexico (0.13)
Australia (0.12)
Canada (0.1)
Other countries (0.4)
8
Table 2.1. Annual and perennial species of Cicer. Source from Croser et al.(2003)
Cicer species Annual C. arietinum L. C. bijugum K.H. Rech. C. chorassanicum (Bge.) M. Pop. C. cuneatum Hochst. ex Rich. C. echinospermum P.H. Davis
C. judaicum Boiss. C. pinnatifidum Jaub. & Sp. C. reticulatum Ladiz. (wild progenitor) C. yamashitae Kitamura
Perennial C. acanthophyllum Boriss. C. anatolicum Alef. C. atlanticum Coss. ex Maire C. balcaricum Galushko C. baldshuanicum (M. Pop.) Lincz. C. canariense Santos Guerra & Lewis C. fedtschenkoi Lincz. C. flexuosum Lipsky C. floribundum Fenzl. C. graecum Orph. C. grande (M. Pop.) Korotk. C. heterophyllum Contandr et al. C. incanum Korotk. C. incisum (Willd.) K. Maly C. isauricum P.H. Davis C. kermanense Bornm. C. korshinskyi Lincz.
C. laetum Rass. & Sharip. C. macracanthum M. Pop. C. microphyllum Benth. C. mogoltavicum (M. Pop.) A. Koroleva C. montbretii Jaub. & Sp. C. multijugum van der Maesen C. nuristanicum Kitamura C. oxyodon Boiss. & Hoh. C. paucijugum (M. Pop.) Nevski C. pungens Boiss. C. rassuloviae Lincz. C. rechingeri Podlech C. songaricum Steph. ex. DC. C. spiroceras Jaub. & Sp. C. stapfianum K.H. Rech. C. subaphyllum Boiss. C. tragacanthoides Jaub. & Sp.
2.1.4. Constraints to chickpea production
In recent decades, there have been intensive chickpea breeding programs in
international centres such as the International Crop Research Institute for the Semi-Arid
Tropics (ICRISAT) and the International Center for Agricultural Research in the Dry
Areas (ICARDA); and several local programs in the USA, Australia, Spain, India, and
Israel (Abbo et al. 2002). However, average yields of chickpea are still low compared to
those in experimental plots at research stations and in well-managed farming systems
(Ladizinsky 1995). The world average yield is about 800 kg/ha (FAO 2005) which is
well below its estimated potential of 4000 kg/ha (Singh and Ocampo 1997). A number
of biotic and abiotic stresses are thought to be the major constraints to yield
improvement and adoption of chickpea as a productive crop by farmers, namely
ascochyta blight, fusarium wilt, pod borer, drought and cold. Therefore, chickpea
breeders around the world are driven to improving resistance to biotic stresses and
tolerance to abiotic stresses (Millan et al. 2006). With the genetic diversity among
9
chickpea germplasm limited (Reddy and Singh 1984), chickpea breeders are prompted
to search for new sources of resistance to biotic stresses in wild relatives.
2.2. Interspecific hybridisation of chickpea and wi ld Cicer species
2.2.1. Importance of wild Cicer in chickpea improvement
Wild Cicer germplasm is known to have genes of interest for biotic resistance,
abiotic tolerance and other agronomically important traits, and therefore may be
exploited for improving cultivated chickpea genotypes. Wild annual Cicer species share
annual growth habits and the same chromosome number (2n=16) with chickpea, making
them amenable to hybridisation (Berger et al. 2003; Croser et al. 2003; Singh and
Ocampo 1997). There have been a number of efforts to transfer agroeconomically
important genes from wild Cicer species into cultivated chickpea through conventional
breeding practices. Those attempts were only successful in developing hybrids between
chickpea (C. arietinum) and two wild species, C. reticulatum and C. echinospermum
(Rajesh et al. 2002), two species with resistance genes for a range of stresses that
cultivated chickpea is susceptible (Croser et al. 2003; Muehlbauer et al. 1994; Singh et
al. 1998). Cicer reticulatum has been identified as a source of resistance/tolerance to
fusarium wilt (Haware et al. 1992; Singh et al. 1994; Singh et al. 1998), ascochyta
blight (Collard et al. 2001; Haware et al. 1992; Singh et al. 1998), cyst nematodes
(Singh et al. 1996), leaf miner, bruchid, cold (Singh et al. 1994; Singh et al. 1995;
Singh et al. 1998) and pod borer (Sharma et al. 2005).
A few undesirable characters limit the use of wild Cicer in chickpea breeding
programs. For example, segregants from a cross between C. arietinum and C.
reticulatum may suffer from pod shattering, reticulating and hard seed coat, unattractive
and unacceptable seed colour, prostrate habit and unpalatable seed taste (Jaiswal et al.
1986). Furthermore, seed dormancy and vernalisation requirements in many wild plants
may be a potential problem when transferred to chickpea (Abbo et al. 2003; Abbo et al.
2002; Singh and Ocampo 1997).
10
Table 2.2. The important agronomic characters available in wild annual Cicer species. Reformated and updated from Croser et al. (2003).
2.2.2. Annual Cicer species and the genepool theory
Considering all publications based on crossability, molecular diversity and
karyotyping studies, Croser et al. (2003) suggested a model to classify the annual Cicer
species (Table 2.3) with a primary, secondary and tertiary genepool. The primary
genepool consists of C. arietinum, C. reticulatum and C. echinospermum. The
secondary genepool consists of C. bijugum, C. pinnatifidum, C. judaicum, all reported
to hybridise with some degree of fertility when crossed with cultivated chickpea (Singh
et al. 1999a; Singh et al. 1999b; Verma et al. 1995; Verma et al. 1990). The tertiary
genepool consists of C. chorassanicum (unsuccessful crossing with chickpea), C.
cuneatum (hybrid either did not flower or did not germinate) (Singh et al. 1999a; Singh
et al. 1999b; Singh and Singh 1989) and C. yamashitae (hybrid either completely sterile
or did not germinate) (Singh et al. 1999a; Singh et al. 1999b). No successful
hybridisation between the wild perennial Cicer species and cultivated germplasm has
been reported.
Based on crossability data, earlier studies classified nine annual Cicer species into
four groups. Group I consisted of C. arietinum, C. reticulatum and C. echinospermum;
group II included C. bijugum, C. judaicum and C. pinnatifidum; group III comprised
only C. cuneatum while group IV contained C. yamashitae (Ahmad et al. 1987; Ahmad
et al. 1988; Ladizinsky and Adler 1976a; Ladizinsky and Adler 1976b). Vairinhos and
Murray (1983) clustered annual Cicer species into the same groups based on their seed
protein profiles. Rajesh et al. (2002) clustered the annual species based on ISSR
markers which agreed with the clustering based on crossability data and seed storage
protein data, except that C. yamashitae was clustered with C. bijugum and C. judaicum.
Based on karyotype symmetry indices, Ocampo et al. (1992) classified the nine
annual Cicer species into two groups; the first consisted of C. arietinum, C. reticulatum
and C. echinospermum, with the remaining six Cicer species in the second group. Labdi
et al. (1996) studied the phylogenetic relationships within the annual Cicer species
based on isozyme polymorphism and clustered C. arietinum, C. reticulatum and C.
echinospermum in the first group with the remaining six species in three clusters. Verma
et al. (1995; 1990) suggested that all the wild Cicer species except C. echinospermum
be grouped in the primary genepool and proposed placing C. judaicum in the first
genepool.
12
Table 2.3. Proposed genepools of the wild annual Cicer species adapted from Croser et al.
(2003).
Proposed genepool
Ladizinsky & Adler 1976a, b
Verma et al. 1990
Muehlbauer et al. 1994
Singh et al. 1999a, b
Primary C. arietinum C. reticulatum
C. arietinum C. bijugum C. judaicum C. pinnatifidum C. reticulatum
C. arietinum C. echinospermumC. reticulatum
C. arietinum C. judaicum C. reticulatum
Secondary C. echinospermum
C. echinospermum C. bijugum C. cuneatum C. echinospermum C. pinnatifidum C. yamashitae
Tertiary C. bijugum C. cuneatum C. judaicum C. pinnatifidum
C. bijugum C. chorassanicumC. judaicum C. pinnatifidum
C. chorassanicum
Omitted C. chorassanicum C. yamashitae
C. chorassanicum C. cuneatum C. yamashitae
C. cuneatum C. yamashitae
2.2.3. Crossability of wild Cicer species with cultivated chickpea
A number of attempts have been made to cross the annual wild Cicer species’
with cultivated chickpea. Fully fertile hybrids have been reported in crosses with C.
reticulatum, whereas partially sterile hybrids occurred with C. echinospermum
(Ladizinsky and Adler 1976a; Ladizinsky and Adler 1976b). Ladizinsky and Adler
(1976a; 1976b) successfully crossed C. reticulatum with cultivated chickpea and
considered this species as the wild progenitor of chickpea. Interspecific crosses between
C. arietinum and C. pinnatifidum, and C. bijugum and C. judaicum have been reported
(Verma et al. 1995; Verma et al. 1990). Badami et al. (1997) reported an interspecific
hybrid between C. arietinum and C. pinnatifidum using ovule culture which produced
albino plants in tissue culture, morphologically similar to C. pinnatifidum, but did not
survive beyond 20 days. Hybridisation of C. arietinum with C. bijugum, C. judaicum
and C. pinnatifidum produced hybrids with low fertility and poor seed set (Verma et al.
1990). Crossing C. arietinum with C. cuneatum or C. yamashitae produced sterile
hybrids (Singh et al. 1999a; Singh et al. 1999b). There are no reports of C.
chorassanicum being crossed with chickpea. Croser et al. (2003) summarised the
recognised crosses in the wild annual Cicer species (Table 2.4).
13
The success rate of interspecific hybridisation of chickpea with wild Cicer species
other than C. reticulatum usually depends on the number of pollinations attempted and
the specific genotype–wild species combinations (Verma et al. 1990). The success rate
of crossing cultivated chickpea as the female parent with both C. reticulatum and C.
echinospermum as male parents was more than 75% (Singh and Ocampo 1997). When
C. reticulatum and C. echinospermum were used as female parents, the success rate was
low, at 21% and 5%, respectively (Singh and Ocampo 1997). Comparing reciprocal
crosses of cultivated chickpea with C. echinospermum showed positive transgressive
segregants for seed yield only when the cultigen was used as a female parent,
suggesting the importance of maternal effects of Cicer species (Singh and Ocampo
1997). Similarly, Jaiswal and Singh (1989) found the success rate in pod formation, in
interspecific crosses of chickpea with C. reticulatum, was highest when chickpea was
used as the female parent.
14
Table 2.4. Novel cross combinations among the annual Cicer species. Source from Croser et al. (2003).
Year Cross Fate of F1 Author/s & Institutions (1976a) C. arietinum x C. reticulatum
C. arietinum x C. echinospermum C. reticulatum x C. echinospermum C. judaicum x C. pinnatifidum C. pinnatifidum x C. judaicum C. judaicum x C. bijugum C. bijugum x C. judaicum C. pinnatifidum x C. bijugum C. bijugum x C. pinnatifidum
fully fertile partially sterile sterile low fertility with AS1 low fertility with AS1 low fertility with AS1 low fertility with AS1 low fertility with AS1 low fertility with AS1
Ladizinsky & Adler, Hebrew University
(1983) C. judaicum x C. pinnatifidum C. judaicum x C. cuneatum
partially sterile sterile
Pundir & van der Maesen,ICARDA/ Wageningen
(1987) (1988)
C. judaicum x C. chorassanicum C. chorassanicum x C. pinnatifidum
low fertility with AS1 albino – died
Ahmad et al., Uni. of Saskatchewan Ahmad, Uni. of Saskatchewan
(1989) C. arietinum x C. cuneatum sterile Singh & Singh, Banaras Hindu University (1990) C. arietinum x C. judaicum
C. arietinum x C. pinnatifidum C. arietinum x C. bijugum
fertile 1.81% seed set fertile 1.02% seed set fertile 0.50% seed set
Verma et al., Punjab Agricultural University
(1993) C. reticulatum x C. arietinum C. echinospermum x C. arietinum C. echinospermum x C. reticulatum
fertile very low fertility very low fertility
Singh & Ocampo, ICARDA
(1999a,b) C. arietinum x C. yamashitae C. cuneatum x C. arietinum C. bijugum x C. arietinum C. judaicum x C. arietinum
no germination/sterile no germination/sterile no germination/sterile Fertile
Singh et al., Indian Institute of Pulses Research
15
2.2.4. Use of wild Cicer species to improve chickpea cultivars
Wild annual Cicer species possess many agronomically desirable traits which
have attracted chickpea breeders (Muehlbauer et al. 1994; Singh and Ocampo 1997;
Upadhyaya 2003). Jaiswal and Singh (1989) studied several generations (F2, F3 and F4)
of a cross between chickpea and C. reticulatum for yield and yield-related traits, and
improved yield through the introgression of desirable genes from C. reticulatum into
3956, ILC 4421, ILC 200 and ILC 6482 which can be used in chickpea breeding (Reddy
and Singh 1984; Singh and Reddy 1993). Many of these resistant accessions are not
cultivated due to their poor agronomic characteristics. Collard et al. (2001) found one
resistant desi accession ICC3996 among 19 chickpea accessions. Coram and Pang
(2005) revealed strong Ascochyta rabiei resistance in accession ICC 3996 and suggested
that it may be a valuable source of resistance with defense-related genes. To date,
several sources of resistance, identified within the cultivated chickpea germplasm, have
been used in genetic and breeding studies (Flandez-Galves et al. 2000; Meredith et al.
2000; Reddy and Singh 1992; Santra et al. 2000; Singh 1997a,b; Tekeoglu et al. 2000).
2.3.1.4. Source of resistance to ascochyta blight in wild annual Cicer species
Wild annual Cicer accessions have been screened for ascochyta blight resistance
at the International Center for Agricultural Research in Dry Areas (ICARDA), Syria;
the International Crops Research Institute for the Semi-Arid Tropics (ICRISAT), India;
and other national institutions. Sources of resistance to ascochyta blight have been
found in some accessions of C. pinnatifidum and C. judaicum (Singh et al. 1981), C.
bijugum (Haware et al. 1992), C. bijugum, C. echinospermum and C. reticulatum
(Stamigna et al. 1998), C. judaicum and C. pinnatifidum (Singh and Reddy 1993), and
C. echinospermum, C. pinnatifidum, C. reticulatum and C. bijugum (Collard et al.
2001). However, most of these novel sources, apart from C. reticulatum and C.
echinospermum accessions, are unable to be readily incorporated into breeding
programs because of incompatibility.
2.3.1.5. Genetics of ascochyta blight resistance
Genotypic variation has been reported for ascochyta blight resistance in chickpea
using both Mendelian and quantitative trait loci (QTL) analyses, with conflicting reports
20
about the mechanism of resistance. Recent studies using pathotype I and pathotype II
isolates showed that resistance to pathotype I is conferred by a single gene, whereas
resistance to pathotype II is conferred by two or more independent loci (multigenic)
with complementary gene action (Chen et al. 2004; Cho et al. 2004; Udupa and Baum
2003). Previous studies on the genetics of ascochyta blight resistance in chickpea using
undefined isolates of Ascochyta rabiei resulted in different genetic estimations
involving one dominant gene (Pande et al. 2005; Singh and Reddy 1983; Tewari and
Pandey 1986; Vir et al. 1975), a single recessive gene (Singh and Reddy 1983; Tewari
and Pandey 1986) or more than one gene (Kusmenoglu 1990; Muehlbauer and Kaiser
1994; Muehlbauer and Singh 1987; Singh and Reddy 1983; Singh and Reddy 1989;
Tewari and Pandey 1986).
Disease resistance in many plants is reported to be inherited quantitatively (Young
1996). The current understanding of the genetics of ascochyta blight resistance in
chickpea strongly suggests quantitative inheritance of the trait with major and minor
genes. Dey and Singh (1993) reported two dominant complementary genes in chickpea
genotypes GLG84038 and GL84099, compared with one dominant and one recessive
independent gene in chickpea genotype ICC1468. Tekeoglu et al. (2000), using
recombinant inbred line (RIL) populations, reported three complementary recessive
genes conferring resistance to ascochyta blight in chickpea. Santra et al. (2000) found
two quantitative trait loci (QTLs) which conditioned ascochyta blight resistance over
two years of field screening. Lichtenzveig et al. (2002) suggested that a single or few
QTL with major effects, in combination with other minor genes, are responsible for
ascochyta blight resistance. Collard et al. (2003a) revealed two to three QTLs for
seedling resistance in controlled glasshouse bioassays in an interspecific cross between
C. arietinum (susceptible parent) and C. echinospermum (resistance parent). Millan et
al. (2003) reported the presence of at least two major genes controlling resistance in
ILC3279, with several minor modifying gens.
Epistatic interactions between ascochyta blight resistance genes have been
reported (Collard et al. 2003a; Dey and Singh 1993; Tekeoglu et al. 2000). Epistasis
between two or three genes has been detected by analysing the segregation of resistant
and susceptible progenies in F2 and backcross populations (Dey and Singh 1993),
recombinant inbred lines (RILs) ((Tekeoglu et al. 2000) and an interspecific F2
population (Collard et al. 2003a). Santra et al. (2000) found no epistatic interactions
21
between QTLs for ascochyta blight resistance in a RILs population. Similarly, Collard
et al. (2003a) reported the abscence of epistatic interactions between QTLs in the
population. Flandez-Galves et al. (2003a) found that the major QTLs for ascochyta
blight resistance and suggested that QTL epistasis, in the form of dominance ×
dominance interactions in the field and dominance × additive interactions in the
controlled environment, was a main genetic component for ascochyta blight resistance
in chickpea.
Different results from studies across the globe would be expected because of
different scales used for rating the disease. Furthermore, climatic conditions, inoculum
densities and techniques, and plant age influence disease development (Millan et al.
2003). The degree of resistance or susceptibility in a segregating population also
depends on which susceptible or resistant chickpea parent was used in the cross
(Tekeoglu et al. 2000). Therefore, in the breeding strategy, parents need to be assessed
in specific locations and a standard approach should be developed and implemented.
2.3.2. Leaf types
2.3.2.1. Leaf features in chickpea
Generally in chickpea, the first two nodes of the seedling have small, scale-like
structures, and the subsequent leaves are imparipinnate or fern-leafed (normal) and
placed alternately on the branch. The leaf is differentiated into a 3–7 cm long rachis,
which supports 9–15 leaflets, attached on small petiolules. The number of leaflets is
generally odd and located directly on the rachis. The arrangement of leaflets is alternate
near the base of the rachis, but it becomes almost opposite towards the apex. The leaflet
shape is generally elliptic or obtuse, being 8–17 mm long and 5–14 mm wide. This is
the most common type of leaf in the Cicer genus (Pundir et al. 1990), however, mutants
with simple or unifoliate leaves (Ekbote 1937) and multipinnate leaves (Pundir et al.
1990) have been reported. In a multipinnate leaf, leaf lamina can be uni-, bi-, or
tripinnate with narrow leaflets. In a simple leaf, there is no clear differentiation into
rachis and leaflets despite the possibility of deep incisions in the leaf lamina. The simple
leaf is shorter than the normal or the multipinnate leaf (Pundir et al. 1990).
2.3.2.2. Genetics of leaf types in chickpea
A single recessive gene, slv, is reported to control the simple leaf trait (Athwal
1963; Athwal and Brar 1964; Ekbote 1942; Rao et al. 1980; Reddy and Chopde 1977;
22
Singh 1962; Singh and Shyam 1959; Singh and Singh 1992; Vachhani 1942). Pundir et
al. (1990) found that leaf type differences were governed by two genes (ml and sl) with
dihybrid supplementary gene action, using a cross between simple and multipinnate leaf
type chickpeas. Multipinnate leaves are formed when the first gene is in dominant status
(ml+sl/.sl), while simple leaves occur when the first gene is recessive irrespective of the
state of the second gene (ml./ml.). Normal leaves occur when both genes are in
dominant form (ml+sl+/..). Singh and Singh (1995) suggested monogenic recessive
inheritance for multipinnate leaves in chickpea mutant derived from cultivar K850.
Gaur and Gour (2003) reported a leaf-type mutant (JGM 4), designated broad-few-
leaflets, which were larger and had 5–9 leaflets per leaf compared with 11–17 leaflets
per leaf in the parental cultivar JG 315. A single mutant gene (bfl) caused changes in the
appearance of the leaf in chickpeas (Gaur and Gour 2003).
23
Figure 2.3. Three different leaf types in chickpea. a) simple; b) normal; and c) multipinnate
a) b) c)
24
2.3.2.3. Leaf types and ascochyta blight resistance in chickpea
Most simple leaf type chickpeas are reported to be susceptible for ascochyta blight
disease (Chonogo and Gossen 2001; Gan et al. 2003) and, in southern Australia, most
have been abandoned from production systems (Gan et al. 2003). Comparing chickpea
varieties with a range of genetic backgrounds, Gan et al. (2003) reported that disease
severity at flowering was greater in simple leaf types than in normal leaf types.
Similarly, Bonfil et al. (2007) reported higher disease resistance for normal leaf type F5
lines compared to simple leaved lines at podding stage. No differences in ascochyta
blight response between the leaf types is reported before flowering (Bonfil et al. 2007;
Gan et al. 2003). There is no comprehensive research to confirm the correlation of
ascochyta blight resistance to normal, simple and multipinnate leaf types using
segregating populations segregating for these traits. Ascochyta blight resistant chickpea
cultivars with simple leaves have been developed in recent years (Muehlbauer et al.
1998a,b). However, the resistance has been lost very quickly as the cultivar was grown
commercially. Therefore, it is not wise to use cultivar as an example to argue the view
that resistance cultivars with simple leave have been developed, and further
investigation regarding the association of leaf types and disease resistance is needed.
2.3.3. Flowering time
2.3.3.1. Flowering time and chickpea production
Time to flowering plays an essential role in determining the adaptation and
productivity of cultivated chickpea in short growing environments (Kumar and Abbo
2001). Early flowering combined with other desirable traits in chickpea might make it
possible to extend the reproductive phase in various target environments (Or et al.
1999). Chickpeas often experience short growing seasons because of drought, heat, or
end-of-season frost (Khanna-Chopra and Sinha 1987). Flowering time of chickpea
depends on season, sowing date, temperature, photoperiod, latitude and altitude (Ellis et
al. 1994; Roberts et al. 1985; Summerfield and Roberts 1988), with most Mediterranean
chickpea germplasm relatively late to flower because of their inherent long-day
requirements (Kumar and Abbo 2001; Or et al. 1999). Consequently, in Mediterranean
environments, podding and grain filling occur in the post-rainy season (Or et al. 1999;
Singh et al. 1997; Singh and Reddy 1996). Thus, late flowering exposes the crop to
water shortage during seed development, reducing its yield potential (Turner et al.
25
2000). With its indeterminate growth habit, the duration of flowering is a critical
component in determining the yield of chickpea (Bonfil and Pinthus 1995). Although,
selection for early flowering will not directly increase productivity, the possibility of
combining early flowering alleles with yield-promoting alleles has been demonstrated in
desi chickpea (Siddique and Khan 1996). Early flowering might make it possible to
extend the reproductive phase in semi-arid environments and may lead to yield
increases through more efficient water use (Kumar and Abbo 2001). However, winter
sowing exposes chickpea to a high risk of ascochyta blight and thus requires the
development of resistant cultivars (Lichtenzveig et al. 2006).
2.3.3.2. Genetics of flowering time
An understanding of the genetics of flowering time is important to develop
cultivars for a particular environment. The ability to efficiently manipulate flowering
time is an essential component of chickpea improvement (Kumar and Abbo 2001).
Roberts et al. (1985) suggested that time to flowering is a function of temperature and
photoperiod in chickpea and that two major genes respond to either factor. Gumberm
and Sarvjeet (1996) suggested that two genes control the genetics of time to flowering
based on crosses among the early-flowering parent (ICCV 2) and two late-flowering
parents (GL769, BG276). Using the same early-flowering parent ICCV 2, Kumar and
van Rheenen (2000) observed a bimodal distribution for flowering time in chickpea, and
suggested the presence of one major gene (Efl-1/efl-1) and polygenes for this trait. Or et
al. (1999) reported a single major gene for time to flowering and associated it with
sensitivity to photoperiod (Ppd/ppd), with the recessive allele conferring day-length
neutrality. Kumar and Abbo (2001) suggested that the major alleles for early-flowering
(efl-1 and ppd) may be positioned at the same locus. Cho et al. (2002) revealed a
quantitative trait locus (QTL) for days to 50% flowering by analysing quantitative data.
These reports on the inheritance of flowering time in chickpea are inconsistent, and all
come from short-day, warm-temperature environments. Using high-latitude, cool-season
environments, Anbessa et al. (2006) revealed that flowering time in chickpea is
controlled by two major genes (explaining more than 65% of phenotypic variation ) plus
polygenes mixed-inheritance model (with minimal contribution in the phenotypic
variation). For both major genes, late flowering was dominant over early flowering with
mainly digenic additive × additive interaction between them (Anbessa et al. 2006).
Arshad et al. (2003) also reported epistatic gene effects for flowering time in chickpea.
26
However, Malhotra and Singh (1989) did not observe epistasis for days to flowering,
which was probably due to the differences in allelic constituents of the parental
genotypes used.
2.3.3.3. Flowering time and ascochyta blight resistance in chickpea
The development of early flowering chickpea cultivars with resistance to
ascochyta blight has been difficult over the years (Kumar and Abbo 2001). A negative
correlation has been reported between ascochyta blight resistance and early flowering in
intraspecific segregating populations using F3 and F4 families derived from a cross
between chickpea accessions Hadas and ICC5810 (Lichtenzveig et al. 2002) and F5
progenies derived from a cross between the simple leaf chickpea cultivar Sanford and
normal leaf chickpea ICC7344 (Bonfil et al. 2007). Lichtenzveig et al. (2006) reported a
weak but highly significant negative correlation between days to first flower and
ascochyta blight severity using the recombinant inbred lines (RILs) data obtained from
the later generation of the population used by Lichtenzveig et al. (2002). Despite
separate intensive investigations of flowering time and ascochyta blight resistance, there
are limited reports on the correlation of these two traits in different populations. Since
most breeders consider including wild Cicer species in breeding programs, it seems
necessary to investigate the genetics of flowering time and ascochyta blight resistance in
interspecific crosses among chickpea and wild Cicer species. QTL mapping is one of
the most appropriate approaches to study genetics of traits. Information obtained from
QTL mapping can be used in breeding programs and marker-assisted selections (MAS).
2.4. Genetic mapping of important traits
2.4.1. Current status of genetic mapping in chickpea
Quantitative trait loci (QTL) mapping is a highly effective approach to identify
and tag disease resistance genes in plants (Young 1996). Knowledge of the extent of
genetic diversity within or among species is an important factor in selecting parents for
QTL mapping, because sufficient DNA polymorphism must exist between parents for
segregation analysis and genetic mapping, especially in inbreeding species which
generally possess lower levels of genetic variation (Young 1994).
Advances in molecular marker technology have accelerated the progress of
genome mapping in chickpea. Linkage maps have been developed, based on
27
interspecific crosses between selected chickpea cultivars and C. reticulatum accessions
(Banerjee et al. 2001; Kazan et al. 1993; Simon and Muehlbauer 1997; Winter et al.
2000; Winter et al. 1999). Molecular markers associated with quantitative trait loci
(QTL) for resistance to ascochyta blight, fusarium wilt and some morphological traits
have also been located on the interspecific linkage maps (Banerjee et al. 2001; Flandez-
Galves et al. 2003b; Iruela et al. 2006; Kazan et al. 1993; Lichtenzveig et al. 2006;
Millan et al. 2003; Ratnaparkhe et al. 1998; Santra et al. 2000; Simon and Muehlbauer
1997; Tekeoglu et al. 2000; Winter et al. 2000). The genetic map developed by Winter
et al. (2000) is considered as a standard chickpea genetic map and is often used as a
reference by other researchers. Millan et al. (2006) summarised data from three
different genetic maps (Huettel et al. 2002; Pfaff and Kahl 2003; Winter et al. 2000) to
integrate a genetic map for chickpea, based on a common set of RILs derived from the
cross between chickpea accession ICC 4958 and C. reticulatum PI 489777 (Figure 2.4).
As the transferability and repeatability of many dominant markers in the existing
chickpea map is questionable, it is necessary to allocate more co-dominant markers in
the map.
28
Figure 2.4. Integrated genetic map of chickpea based on common RILs derived from the cross
between chickpea accession ICC 4958 and C. reticulatum PI 489777; summarised data from
Winter et al. (2000), Huettel et al. (2002) and Pfaff and Kahl (2003). Markers on the left of the
vertical bar are derived from genes. Markers on the right are either STMS or dominant markers.
Sourced from Millan et al. (2006).
29
2.4.2. QTL mapping of ascochyta blight resistance
Several groups have already reported a QTL inheritance of resistance to
Ascochyta rabiei in chickpea (Collard et al. 2003a; Flandez-Galves et al. 2003b; Santra
et al. 2000). To avoid confusion with regard to the number of loci and their location on
the chickpea genome, comparison of published maps with the standard chickpea map
(Winter et al. 2000; Winter et al. 1999) makes it possible to formulate a general
conclusion about the location of ascochyta blight resistance QTLs on linkage groups.
Linkage group 4 (LG4) has a significant effect on the ascochyta blight resistance in
chickpea whereas other genomic regions have minor effects (Table 2.6) (Cho et al.
2004; Collard et al. 2003a; Flandez-Galves et al. 2003a; Flandez-Galves et al. 2003b;
Lichtenzveig et al. 2006; Santra et al. 2000; Tekeoglu et al. 2002).
Santra et al. (2000) used an interspecific RIL population for mapping with
dominant markers and detected three QTLs. Using STMS markers published by Huettel
et al. (2002) and Winter et al. (2000), Tekeoglu et al. (2002) confirmed the QTL
reported by Santra et al. (2000) and located QTL-1 on their LG8 adjacent to a STMS
marker GAA47, and QTL-2 on LG4 close to STMS markers TA72 and GA2.
Flandez-Galves et al. 2003 (2003b) found a significant major QTL effect on the
resistance response in a 25 cM region along LGIII (LG4 of the chickpea standard map).
Using a combination of dominant and co-dominant markers, Collard et al. (2003a)
reported two QTLs which were associated with seedling resistance, both located within
linkage group 4 (also LG4 in standard map) with LOD scores of 2.5 and 2.6, about 8 cM
apart (Collard et al. 2003a).
Cho et al. (2004) identified two QTLs for resistance to pathotype I co-located on
LG2A and LG2B+6B and another QTL for resistance to pathotype I on LG2B. They
also found one QTL for ascochyta blight resistance in the field mapped on LG4A
between GA24 and GAA47 (LOD score of 4.17). Using a controlled environment with
a mixture of pathotype II isolates of Ascochyta rabiei, Cho et al. (2004) found another
QTL (QTL ar2a) co-located with the QTL for blight resistance in the field. Two QTLs
for blight resistance in the field on LGIV and LGVIII of the interspecific linkage map of
Tekeoglu et al. (2002) appeared to be the same as the QTL on LG4A of the map of Cho
et al. (2004).
30
Using a recombinant inbred line (RIL) population derived from an interspecific
cross between C. arietinum (FLIP 84-92C) and C. reticulatum (PI 599072), Tekeoglu et
al. (2004) found the same 2 QTLs found by Santra et al. (2000), conferring resistance to
ascochyta blight at two field locations in three years. Using an intraspecific RILs from a
cross between ILC 1272 and ILC 3279 (resistance to pathotype I and II), Udupa and
Baum (2003) mapped a major QTL for resistance to pathotype I (QTL ar1, indicative
marker GA16) to LG2. They also identified two QTLs against pathotype II, QTL ar2a
(indicative marker GA16) and QTL ar2b (indicative markers TA130, TA72 and TR 20)
as independent recessive major resistance loci with complementary gene action and
mapped to LG2 and LG4, respectively. QTL ar2a resided in close vicinity of the
pathotype I specific resistance locus (QTL ar1), indicating a clustering of resistance
genes in that region of the chickpea genome.
Recently, Iruela et al. (2006) identified two quantitative trait loci (QTL ar1 on
LG4a and QTL ar2 an LG4b) associated with resistance to ascochyta blight using
sequence characterised amplified regions (SCARs), STMS and Random Amplified
Polymorphic DNA (RAPD). SCARs and STMS markers tightly linked to QTL ar2
revealed that this QTL could be the same as QTL-2 of Santra et al. (2000), since it was
linked to the same STMS markers TA72 and TA146.
By using more STMS markers developed by Lichtenzveig et al. (2005),
Lichtenzveig et al. (2006) identified three quantitative trait loci (QTLs) with significant
effects on resistance. Both QTL4.1 and QTL4.2 were detected on LG4 with a major
(14.4%) and minor effect (3.8%), respectively. QTL4.1 and QTL4.2 had epistatic
interactions and explained the largest proportion of the phenotypic variance with 42%.
The third QTL (QTL8) was also found on LG8 with a major effect (10.2%) explaining
16% of the total phenotypic variance. Most recently, Tar’an et al. (2007) reported three
QTLs on LG3, LG4 and LG6 for ascochyta blight resistance in chickpea using an
intraspecific population. These QTLs explained 56% of the total estimated phenotypic
variation.
The association of markers with ascochyta blight resistance needs to be confirmed
in several populations. Also more tightly linked markers to QTLs associated with
resistance should be determined. These markers could then be a useful tool for
monitoring the location of QTLs for resistance to ascochyta blight in other
intra/interspecific Cicer mapping populations; for marker-assisted selection (MAS) and
31
for the pyramiding of different resistance genes from different sources into the
cultivated chickpea.
2.4.3. QTL mapping of flowering time
Cho et al. (2002) revealed a QTL for days to 50% flowering on LG3 (LOD score
of 3.03) on the chickpea map and a minor QTL for days to first flower on the same
linkage group (LOD score of 2.34). Later, Lichtenzveig et al. (2006) detected two QTLs
by single-trait analysis of flowering time—the first on LG1 between the markers
H1F022 and GAA40, with a major effect explaining 56% and 53% of the response
variance for chickpea cultivars Massuot and Gilat, respectively; and the second on LG2
between markers H4B09 and H1B06, with a minor effect explaining 22% and 18% of
the phenotypic variance for Massuot and Gilat, respectively. They did not find any QTL
on LG3 associated with time to flowering as found by Cho et al. (2002).
32
Table 2.6. QTLs for resistance to ascochyta blight and diagnostic markers allowing their assignment to linkage groups (LG) of the map of Winter et al. (2000).
Updated from (Millan et al. 2006).
Pathotype Name of QTL Indicative marker LG Reference nd 1 GAA47 4 (Tekeoglu et al. 2002) nd 2 TA72, GA2 4 nd 1 TS12b (Flandez-Galves et al. 2003b) 2/3 TA3a/TA3b 4/5/6 TA30/TA146/TR20 nd AR2 SC/OPK13603 4 (Millan et al. 2003) SC/OPM02935 (Iruela et al. 2006) TA72, TA146 nd I STMS11, GA2, GAA47, TR20 4 (Rakshit et al. 2003) I ar1 GA16 2 (Udupa and Baum 2003) II ar2a GA16 2 II ar2b TA130, TA72, TS72 4 I ar1a GA20, GA16 2B–6B (Cho et al. 2004) I ar1b TA37, TA200 2B II ar2a GA24, GAA47 4A nd 1* STMS 11, GA2, TR20 4 (Collard et al. 2003a) nd 2∗ XLRRb280 4 nd QTL4.1 H3C041, TA2 4 (Lichtenzveig et al. 2006) QTL4.2 H1A12/H1H13, H1G20 4 QTL8 H1C092, TA3/H3C11a 8 II 1 TA64, TS19 3 (Tar’an et al. 2007) 2 TA2, TA146 4 3 TA80, TA22 6
nd: not determined; *Seedling resistance.
aXLRRb280 is an RGA marker; SCAR markers are named with SC prefix; rest are STMS markers.
33
2.4.4. Limitations to mapping and disease assessment
2.4.4.1. Population size and clonal material production
Linkage map construction requires a segregating population. F2, backcross, RILs,
near-isogenic lines and doubled haploids have been used for QTL mapping in plants.
The selected parents to construct a mapping population are different for one or more
traits of interest. The mapping population size should be large enough to identify
recombination between the target gene and DNA markers (Mohan et al. 1997). In
genetic mapping studies, population sizes of between 50 and 100 individuals have been
used (Paterson 1996). However, large populations are required for high-resolution
mapping (Collard et al. 2005). Vegetative propagation can be used to increase the
population size of F2 generation for QTL mapping in chickpea (Collard et al. 2002).
Production of clonal material gives the opportunity to increase the seed number from a
specific genotype without any alteration in its genetic make up.
2.4.4.2. Comparison of F2 generations and RILs in mapping studies
F2 populations, derived from F1 hybrids, are the simplest mapping populations in
self-pollinating species. The main advantage of F2 populations is that they are easy to
construct in a short time-frame. Individual F2 plants can be used to construct
recombinant inbred lines (RILs) after six to eight generations of inbreeding; the time
needed to generate RILs is a major disadvantage for this type of population (Collard et
al. 2005). Furthermore, no information on dominant gene expression can be obtained
from RILs populations. On the positive side, hundreds of homozygous seeds can be
produced from each individual RIL in a single generation allowing RIL populations to
be evaluated repeatedly over years and locations, and for multiple traits (McCouch and
Doerge 1995). The ability to replicate experiments in location and time using a fixed
population gives the opportunity to discriminate the environmental and genetic factors
in the expression of a phenotype (McCouch and Doerge 1995).
2.5. Development of stem cutting techniques for dis ease assessment
and early generation mapping
Vegetative propagation is a type of asexual reproduction found in plants, usually
giving rise to genetically identical clones. Agricultural and horticultural specialists take
advantage of such reproductive ability by using techniques such as rooting of cuttings,
34
grafting and tissue cloning. Rooting of stem cuttings has been reported in Cicer,
including vegetative propagation of wild Cicer species for seed production (van der
Maesen 1980), propagation of sterile or partially infertile hybrid plants (Davis and
Foster 1982), and multiplication of seeds for F2 mapping population development
(Collard et al. 2002). Tar’an et al. (2007) used F2 stem cuttings along with F3 families
for disease assessment in chickpea but did not give any detail regarding the stem cutting
procedure. Stem cuttings have not been used routinely in disease assessments or
mapping, probably due to the absence of a reliable robust protocol for chickpea.
2.5.1. Propagation by stem cutting in chickpea
A range of cutting methods have been used to propagate chickpea and wild Cicer
species, with success rates ranging from 75 to 100% (Davis and Foster 1982; Rupela
1982), 50 to 70% (Islam and Riazuddin 1993), and 48.6 to 70.8% (Collard et al. 2002).
On many occasions, a solution culture has been used (Bassiri et al. 1985; Islam and
Riazuddin 1993; Rupela 1982; Rupela and Dart 1981; Sheila et al. 1991) requiring
frequent monitoring for algal growth and a constant solution volume. Rupela and Dart
(1981) used wounded branches of donor chickpea plants dipped in root hormone
powder before potting; stem cuttings with cuts that were either too deep or too shallow
failed to root. Some recent reports have placed the stem cutting directly into the rooting
substrate (Collard et al. 2002; Syed et al. 2002). The method of Collard et al. (2002)
was relatively simple and rapid but had low rooting rates (48.6–70.8%). Syed et al.
(2002) used IAA and NAA at a range of concentrations on 3–5 day old chickpea
seedlings which are very small and hard to handle (40–100% rooting rate).
2.5.2. Increasing population size using stem cuttings
Stem cuttings of chickpea is a technique to increase seed production of early
generation chickpea lines (i.e. F1s, BCs) for breeding wild Cicer species in germplasm
collections, and precious hybrids. Collard et al. (2002) used a stem cutting technique to
increase the seed number of interspecific hybrids between chickpea and C.
echinospermum for QTL mapping studies.
2.5.3. Use of stem cuttings for reliable phenotyping
Cloned cuttings can be used to phenotype plant response to disease in F2
generations or heterozygous plants, where several clones can be tested instead of a
single plant. This enables replicated screening as well as disease screening methods,
35
without the destruction and loss of the original plants. Furthermore, cloned chickpea
cuttings can be screened for several important economic traits on multi-sites which may
reduce costs and improve efficiency of selection.
2.6. Conclusions
Chickpea is the third most important cultivated grain legume in the world which
has become popular in farming systems in Australia. The global yield of chickpea is low
with an average of about 800 kg/ha. In recent years, biotic and abiotic stresses have
resulted in frequent crop failures across several regions including Australia (Knights
and Siddique 2002). Research and industry development efforts are needed to overcome
the effects of both biotic and abiotic stresses, especially fungal diseases.
Ascochyta blight is a serious fungal disease of chickpea (Nene 1982). Fungicides
do not provide complete protection, are expensive and environmentally unsustainable
(Nene and Reddy 1987). Sustainable management of ascochyta blight in chickpea
requires both integrated crop management practices (Gan et al. 2006) and the
development of resistant cultivars (Collard et al. 2001; Collard et al. 2003b; Nene and
Sheila 1992; Pande et al. 2005). Therefore, knowledge of genetic control and
inheritance of ascochyta blight resistance is essential for the development of strategies
aimed at efficient selection and breeding.
All reported simple leaf type chickpeas are susceptible to ascochyta blight disease
(Chonogo and Gossen 2001; Gan et al. 2003) and most have been abandoned from
production systems in southern Australia (Gan et al. 2003). Gan et al. (2003) reported
much higher levels of disease severity in simple leaf type chickpea than in normal leaf
types, although this finding was based on varieties with a wide range of genetic
backgrounds. Simple leafed kabuli germplasm accessions and cultivars generally have
large seeds (Siddique and Regan 2005; Srinivasan et al. 2006); the relationship between
large leaflet size and large-seeded varieties is well-established (Dahiya et al. 1988;
Sandhu et al. 2005). Therefore, investigating the correlation between leaf type and
ascochyta blight resistance using segregating populations may pave the way for
incorporating ascochyta blight resistance into simple leafed kabuli varieties which are
paid a premium for their extra large seeds.
Time to flowering plays an essential role in determining the adaptation and
productivity of cultivated chickpea in short growing season environments (Kumar and
36
Abbo 2001). Early flowering combined with other desirable traits in chickpea may
extend the reproductive phase in various target environments (Or et al. 1999). Winter
sowing exposes chickpea to a high risk of ascochyta blight, hence the need to develop
resistant chickpea cultivars (Lichtenzveig et al. 2006). A negative correlation between
ascochyta blight resistance and early flowering has been reported (Lichtenzveig et al.
2006; Lichtenzveig et al. 2002) but this relationship needs to be clarified. Wild annual
Cicer species, such as C. reticulatum and C. echinospermum, are of interest to chickpea
breeders as they have resistance genes for a number of stresses (Croser et al. 2003;
Muehlbauer et al. 1994; Singh et al. 1998).
The aim of this study was to develop interspecific and intraspecific populations;
assess F1 and F2 hybrids in glasshouse and field conditions for a better understanding of
the genetics of ascochyta blight, leaf types, flowering time, and their relationships;
develop a saturated chickpea genetic map with more microsatellite markers; and
develop a reliable stem cutting method to screen disease resistance in a more controlled
approach and to overcome the limitations for mapping the F2 populations.
37
Chapter Three
3. Interspecific Hybridisation of Cicer species
Abstract
The crossability of cultivated chickpea was investigated with wild annual Cicer
species in the primary genepool (C. reticulatum and C. echinospermum) and the
secondary genepool (C. pinnatifidum and C. judaicum). Intraspecific hybrids (chickpea
x chickpea) had a higher rate of seed set than both of the interspecific hybrids derived
from chickpea x C. reticulatum and chickpea x C. echinospermum. Pollen viability
studies of interspecific hybrids further revealed differences in the species’ crossability.
Interspecific F1 hybrid plants of chickpea x C. reticulatum had more viable pollen than
hybrids of chickpea x C. echinospermum. Crosses between chickpea and C.
echinospermum produced both fertile F1 hybrids and sterile F1 hybrids.
Interspecific crosses between chickpea genotypes with C. pinnatifidum and C.
judaicum only produced 19 seeds from about 2000 pollinated flowers. Only one of these
hybrid seeds appeared to be a true hybrid; that derived from a cross between Kaniva and
C. pinnatifidum accession ILWC 224. Even though the hybrid was albino, it survived
for more than one month in the glasshouse suggesting that true hybrids may be possible
through wide hybridisation of chickpea with C. pinnatifidum, albeit with a low seed set.
3.1. Introduction
Wide crosses describe hybridisations between species of the same or different
genera. In modern plant breeding there is an increasing interest in transferring specific
desirable characters, such as resistance and tolerance to biotic and abiotic stresses, from
wild relatives to the genepool of cultivated plants. Many improved cultivars with
resistance to pests, diseases and other desirable traits, introgressed via wide crosses
from their wild relatives, have been released (Fatokun 1991). In some species, barriers
exist in crosses between cultivated species and their wild relatives. Therefore, new
technology must facilitate wide crosses for the improvement of those incompatible
species (Sharma 1995).
38
The wild annual Cicer species possess many agronomically desirable
characteristics of interest to chickpea breeders (Muehlbauer et al. 1994; Singh and
Ocampo 1997; Upadhyaya 2003). There have been a number of attempts to transfer
agroeconomically important genes from wild relatives into cultivated chickpea through
conventional breeding practices. Those attempts were successful only in developing
hybrids between cultivated chickpea (C. arietinum) and two wild relatives (C.
reticulatum and C. echinospermum) (Ladizinsky and Adler 1976a; Ladizinsky and
Adler 1976b). It is hypothesised that the rate of seed set in interspecific hybridisation of
chickpea will be lower than that in intraspecific hybridisation; the closer the species, the
higher the seed set rate. Therefore, the objectives of this study were (i) to develop
interspecific hybrids between chickpea and compatible wild Cicer species to introgress
important traits from wild Cicer into cultivated chickpea, and (ii) to attempt wide
hybridisation of chickpea with two incompatible wild Cicer species in the secondary
genepool.
3.2. Materials and Methods
3.2.1. Plant materials and hybridisation
This study used twelve chickpea genotypes—three accessions of C. reticulatum,
two accessions of C. echinospermum, three accessions of C. pinnatifidum, and two
accessions of C. judaicum (Table 3.1). Cicer reticulatum and C. echinospermum are
compatible with cultivated chickpea since fertile hybrids are possible, however, C.
pinnatifidum and C. judaicum are incompatible since fertile hybrids are not possible.
Plant material was inoculated with rhizobium (Nodulaid 100, Bio-care technology
Pty Ltd, Australia) and sown in potting mix in 20 cm pots in a glasshouse facility with
natural light and 20 ± 2oC at The University of Western Australia. The potting mix had
two parts fine composted bark:one part cocco peat:one part river sand, with added
superphosphate (1 kg m-3), ammonium nitrate (1 kg m-3), potassium sulfate (1 kg m-3),
trace elements in the form of Macromin1 (0.2 kg m-3; Richgro, Australia) and ferrous
sulfate (0.5 kg m-3). At least five plants per genotype were planted at two weekly
intervals in order to have a continuous flower supply for crossing. Wild types were used
as the male parent and cultivated chickpea genotypes as the female parent.
The crosses were made between 8 and 11 am. Flower buds on the main axis were
emasculated with minimal damage using forceps and immediately pollinated with
39
pollen from freshly harvested flowers of a donor parent. A mixture of growth regulators,
Table 3.3. Calculated t-statistics for different cross combinations of chickpea, C. reticulatum and
C. echinospermum accessions. The values in parentheses are the means for each cross
combination.
Cross combinations t-stat P value desi x desi (31.0) vs desi x kabuli (30.9) 0.411 0.684 desi x desi (31.0) vs kabuli x kabuli (24.3) 1.596 0.128
desi x kabuli (30.9) vs kabuli x kabuli (24.3) 1.577 0.127 chickpeaa x chickpea (29.5)vs chickpea x C. reticulatumb (20.4) 2.442 0.018 chickpea x chickpea (29.5)vs chickpea x C. echinospermumc (11.6) 3.812 <0.001
chickpea x C. reticulatum (20.4) vs chickpea x C. echinospermum (11.6) 3.050 0.007 desi x C. reticulatum (20.9) vs kabuli x C. reticulatum (20.0) 0.233 0.820
desi x C. echinospermum(14.3) vs kabuli x C. echinospermum (8.8) 1.557 0.170 a kabuli and desi type chickpeas combined; b all accessions of C. reticulatum combined; c all
accessions of C. echinospermum combined.
43
3.3.2. Interspecific hybridisation in incompatible Cicer species
Following 50–100 crosses for each of 30 cross combinations between chickpea
and both C. pinnatifidum and C. judaicum, 19 putative hybrid seeds were collected from
the mother plants (Table 3.4). In the crosses between chickpea and C. pinnatifidum
ILWC 236, chickpea mother genotypes Lasseter and ICC 3996 produced hybrid seeds.
When crossed with C. pinnatifidum ILWC 250, chickpea genotypes Lasseter, ICC 3996,
Kaniva and 24B-Isoline produced hybrid seeds. Kaniva was the only chickpea genotype
to produce hybrid seed when crossed with ILWC 224.
In the crosses between chickpea genotypes and C. judaicum, hybrid seed was
produced only when chickpea genotype ICC 3996 was crossed with ILWC 30.
3.3.3. Intraspecific hybridisation
For intraspecific crosses, the success rate for seed set ranged from 10% (Almaz x
Kaniva) to 54.1% (24 B-Isoline x Almaz) (Table 3.5). When used as female parents,
desi type 24 B-Isoline and kabuli type IG 9337 had the highest seed sets of 54.1% and
50%, respectively.
There was a significant difference in the rate of seed set among chickpea
genotypes when crossed with other chickpeas (P<0.05). Mean seed set was highest for
IG 9337 with 37.6% and lowest for Almaz with 15.1% (Table 3.6).
44
Table 3.4. Wide hybridisation of chickpea with its two incompatible wild relatives, C. pinnatifidum
and C. judaicum, in the glasshouse during 2004 and 2005.
Kaniva, 24B-Isoline, IG 9337 and Kimberley Large), three accessions of Cicer
reticulatum (ILWC 118, ILWC 139 and ILWC 184) and one accession of C.
echinospermum (ILWC 181) under field conditions. Both F1 and F2 generations were
used in the diallel analysis. The disease was rated in the field using a 1–9 scale: Almaz,
ICC 3996 and ILWC 118 were the most resistant (rated 3 to 4) and all other genotypes
were susceptible (rated 6 to 9) to ascochyta blight. Estimates of genetic parameters,
following Hayman's method, showed significant additive and dominant gene actions.
The analysis also revealed the involvement of both major and minor genes.
Susceptibility was dominant over resistance to ascochyta blight. The recessive alleles
were concentrated in the two resistant chickpea parents ICC 3996 and Almaz, and one
C. reticulatum genotype ILWC 118. The wild Cicer accessions may have different
major or minor resistant genes compared to the cultivated chickpea. High narrow-sense
heritability (ranging from 82 to 86% for F1 generations, and 43 to 63% for F2
generations) indicates that additive gene effects were more important than non-additive
gene effects in the inheritance of the trait and greater genetic gain can be achieved in the
breeding of resistant chickpea cultivars by using carefully selected parental genotypes.
4.1. Introduction
Chickpea, Cicer arietinum L., a self-pollinated diploid (2n=2x=16) member of the
family Leguminosae and subfamily Papilionoideae, is the third most important
cultivated grain legume in the world after dry bean (Phaseolus vulgaris L.) and field pea
(Pisum sativum L.) (FAO 2005). This grain legume crop is cultivated mostly in Central
53
and West Asia, the Indian subcontinent, southern Europe, Ethiopia, North Africa, North
and South America, and more recently in Canada and Australia (Ladizinsky and Adler
1976b; Millan et al. 2003; Singh 1997a).
A major biotic constraint limiting chickpea yield in the world is the fungal disease
ascochyta blight, caused by the pathogen Ascochyta rabiei (Pass) Lab., which attacks all
aerial parts of the plant (Nene and Sheila 1992). Integrated management of ascochyta
blight disease is vital to stabilise chickpea production worldwide (Gan et al. 2006).
Fungicides do not provide complete protection and are an added expense for the grower
and environmentally not sustainable. Sustainable management of ascochyta blight in
chickpea includes both integrated crop management practices (Gan et al. 2006) and the
development of resistant cultivars (Collard et al. 2001; Collard et al. 2003b; Nene and
Sheila 1992; Pande et al. 2005). Therefore, knowledge of genetic control and
inheritance of ascochyta blight resistance is essential for the development of strategies
aimed at efficient selection and breeding.
Genotypic variation has been reported for ascochyta blight resistance in chickpea
using both Mendelian and quantitative trait loci (QTL) analyses. Some classical
Mendelian studies suggest that resistance to ascochyta blight may be conferred by one
dominant gene (Pande et al. 2005; Singh and Reddy 1983; Tewari and Pandey 1986;
Vir et al. 1975), a single recessive gene (Singh and Reddy 1983; Tewari and Pandey
1986), two dominant genes (Tewari and Pandey 1986) or two recessive genes
(Kusmenoglu 1990). Lichtenzveig et al. (2002) suggested that a single (or few) QTL
with major effects, in combination with other minor genes, are responsible for ascochyta
blight resistance. More recently, Udupa and Baum (2003), using molecular techniques,
suggested that resistance to pathotype I is controlled by a major locus and resistance to
pathotype II is controlled by two recessive loci with complementary gene action. Other
molecular studies suggest that resistance is conferred by more than one gene and it may
be inherited as a quantitative trait (Collard et al. 2003a; Collard et al. 2003b; Flandez-
Galves et al. 2003a; Lichtenzveig et al. 2002; Millan et al. 2003; Muehlbauer and
Kaiser 1994; Santra et al. 2000; Tekeoglu et al. 2000).While it is understood that
ascochyta blight resistance is under strong genetic control, there are limited reports on
diallel analysis of ascochyta blight resistance in chickpea and related annual wild Cicer
species. Diallel analysis is a powerful technique in partitioning phenotypic variance,
leading to a better understanding of the size and proportion of the variation which is due
54
to the additive gene effect and to a particular combination of these genes. The objective
of this study was to fill the gap in knowledge using diallel analysis to determine the
significance and nature of gene effects, and heritability of ascochyta blight resistance in
intraspecific and interspecific progeny derived from crosses between chickpea and
annual wild Cicer genotypes resistant or susceptible to the fungal disease.
4.2. Materials and methods
The mating design for the study was five different parallel 5 x 5 half diallel sets
over two generations. In order to ensure reliable results, several parallel half-diallel sets
were used instead of a single half-diallel set (Hayward 1979). Further, the experimental
design included genetically diverse parents among cultivated chickpea and two wild
annual relatives. Combinations of statistical and graphical approaches were used to
analyse the diallel sets.
4.2.1. Plant materials and hybridisation
Four cultivars and three accessions of Cicer arietinum, three accessions of C.
reticulatum and one accession of C. echinospermum were crossed without reciprocals to
produce five different 5 x 5 half diallel sets (Table 4.1). Parents and cross combinations
were selected according to their response to ascochyta blight based on information from
chickpea breeders in Australia and from preliminary field experiments.
Parental genotypes were sown at intervals in a glasshouse at The University of
Western Australia. At least five plants per genotype were sown every two weeks to
ensure a continuous supply of flowering plants. Crosses were made in the morning,
buds were emasculated immediately prior to pollination and a solution of growth
regulators (Mallikarjuna 1999) was applied to the peduncle of buds for interspecific
crosses. Three to five F1 hybrid plants were grown in the glasshouse to produce 70–760
F2 hybrid seeds. A stem cutting method was used to clone some of the F1 hybrids to
increase seed production (Danehloueipour et al. 2006). Five to seven F1 seeds were
stored for field screening. Both F1 and F2 hybrids, and their parents in the diallel cross
sets were evaluated in the field experiment.
55
Table 4.1. Chickpea genotypes and wild Cicer accessions used in the crosses in each diallel set
for the genetic characterisation of ascochyta blight resistance. P indicates parent in a diallel set.
Diallel set Genotypes Cicer/type Phenotype
1 2 3 4 5 Almaz arietinum (kabuli) R P P P P P ICC 3996 arietinum (desi) R P P P P P Lasseter arietinum (desi) S P P P P Kaniva arietinum (kabuli) S P P P P Kimberly Large arietinum (kabuli) S P IG 9337 arietinum (kabuli) S P 24 B-Isoline arietinum (desi) S P ILWC 118 reticulatum MR P ILWC 139 reticulatum MS P ILWC 184 reticulatum S P ILWC 181 echinospermum MS P
4.2.2. Disease assessment
Parental genotypes were screened for ascochyta blight reaction in a randomised
complete block design (RCBD) with three replications. The field experiment was
planted in May 2005 in a disease nursery at Medina Field Station, Perth, Western
Australia (115° 79’ E; 32° 23’ S). Five sets of 5 x 5 half-diallel populations were
planted and, in each replication, 20–25 seeds for parents and F2 progeny and 5–7 seeds
for F1 progenies were sown. Seed was inoculated with Rhizobium (group N). One month
after sowing ascochyta-infested chickpea debris, collected from the previous year, was
spread between rows as disease inoculum. Ascochyta blight susceptible desi chickpea
cultivar Heera was used as a susceptible control and also as a spreader row to increase
the severity of disease. The rainfall from May to July was 505 mm and infection was
generally uniform in the field.
The response of chickpea to ascochyta blight was determined visually using a 1–9
scale, where 1 was unaffected and 9 was dead (Reddy and Singh 1984). Scoring
commenced soon after the first detection of ascochyta blight symptoms on plants in the
experimental plots. Subsequent assessments were made weekly until all plants of the
susceptible parent (Lasseter) were dead (Collard et al. 2003a; Pande et al. 2005). Data
collected from the final assessment were used for diallel analysis.
56
4.2.3. Statistical analyses
All statistical analyses were performed with Genstat software for WindowsTM,
Release 7.2 (Genstat, 2004). ANOVA was performed to test the response of genotypes
to ascochyta blight disease. Bartlett's test was also performed to test homogeneity of
variances.
The diallel was analysed according to Hayman and Jinks method (Hayman 1954;
Jinks 1954,1956; Mather and Jinks 1982). Validity of assumptions, the principal for
diallel analysis, was tested following Allard (1956) and Mather and Jinks (1982).
The variance (Vrij) between five families (one parent and its hybrids with the four
other parents) and the parent–offspring covariance (Wrij) were calculated from the
family means for each array (i, i = 1–5) within each block (j, j = 1–3).
The regression analysis of Wr over Vr (Wr/Vr graph) provided three useful pieces
of information (Mather and Jinks 1982): (i) epistasis is absent when the slope of the
regression line is significantly close to 1; (ii) where the regression line cuts the Wr axis
is a measure of the average level of dominance; and (iii) the relative arrangement of the
points along the regression line indicates the distribution of dominant (near origin) and
recessive (furthest from origin) genes among the parents (Mather and Jinks 1982).
The direction of the dominance is obtained from the Wr, Vr values. The relative
number of dominant to recessive alleles in the common parents of the arrays is indicated
by the relative values of the (Wr + Vr) over arrays. The correlation between (Wri + Vri)
and the phenotypic value of the common parent of the array ( iP__
) indicates the
correlation in distribution of dominant to recessive alleles with iP__
.
Two-way analysis of variance (arrays x blocks) of (Wrij + Vrij) values were used
to test the existence of dominance (Mather and Jinks 1982). Furthermore, an analysis of
the (Wrij – Vrij) values and the joint regression analysis of (Wrij – Vrij) over blocks were
performed to test the adequacy of the model (Mather and Jinks 1982).
A regression graph of parent–offspring covariance (Wr) and variance between the
families (Vr) provides a useful means of assessing genetic relationships among the
parents. As Jinks (1954) and Hayman (1954) showed, in the absence of epistasis and
with independent distribution of genes among the parents, the linear regression of
Wr/Vr has a slope of one and the Wr, Vr array points would remain along the regression
57
line, Wr = a + bVr, and within an area delimited by the parabola, Wr2 = Vp·Vr, where
Vp is the variance of the parental means.
4.3. Results
4.3.1. Ascochyta blight reaction
The germplasm showed significant variation for ascochyta blight resistance.
Among the genotypes examined, ICC 3996 (desi), Almaz (kabuli) and ILWC 118 (C.
reticulatum) were the most resistant with disease rates of 3.2, 3.9 and 4.3, respectively
Kaniva and wild C. reticulatum accession ILWC 184 were susceptible to ascochyta
blight, rating from 7.3 to 9.0. Cicer reticulatum accession ILWC 139 and C.
echinospermum accession ILWC 181 were moderately susceptible to ascochyta blight
with 5.5 and 5.6 disease scores, respectively.
Among the crosses between two resistant parents, only intraspecific hybrid Almaz
x ICC 3996 showed resistance to ascochyta blight in both F1 and F2 generations (Table
4.2). All crosses among susceptible parents resulted in susceptible offspring as
expected. Among crosses between susceptible and resistant parents, interspecific
hybrids ILWC 181 x ICC 3996 and ILWC 181 x Almaz had the best resistance even
compared to progeny obtained from crosses between two resistant parents. Overall,
resistance in F1s was higher than F2s for each cross.
58
0
1
2
3
4
5
6
7
8
9
10
Alm
az
ICC
39
96
Ka
niv
a
La
sse
ter
IG 9
33
7
24
B-I
solin
e
Kim
be
rly
La
rge
ILW
C 1
18
ILW
C 1
39
ILW
C 1
84
ILW
C 1
81
Genotypes
Dis
ease
Sco
re (1
-9 s
cale
)
Figure 4.1. The response of chickpea (ICC 3996, Almaz, Lasseter, Kaniva, 24B-Isoline, IG 9337
and Kimberley Large), C. reticulatum (ILWC 118, 139 and 184) and C. echinospermum (ILWC
181) to ascochyta blight using 1–9 scale (1 = unaffected plants and 9 = dead plants) in a
disease nursery at Medina, Western Australia in winter 2005 (mean ± SE).
59
Table 4.2. The response of chickpea, C. reticulatum, C. echinospermum genotypes and their F1/F2 hybrids to ascochyta blight. Plants were rated using a 1–9
scale (1 = unaffected plants and 9 = dead plants) in a disease nursery at Medina, Western Australia in winter 2005 (mean ± SE ).
4.3.2. ANOVA using Hayman diallel analysis procedure
Analysis of variance (ANOVA) showed that both additive (a) and dominance (b)
effects were significant (P<0.01) (Table 4.3). Diallel sets 1 and 5 showed significant
(P<0.05) directional dominance effects, demonstrating that the dominance deviations of
the genes are predominantly in one direction. Diallel sets 2, 3 and 4 did not show
directional dominance effects (b1) for ascochyta blight resistance. Dominance effects
which are common to the progeny of a particular parent (a progeny array) (b2) were
statistically significant for all diallel sets except diallel set 3, showing that some parents
contain significantly more dominant alleles than other parents. The dominance effects
specific to particular crosses (b3) were highly significant (P<0.01) for all diallel sets.
However, the significance of b3 in all diallel sets showed that dominance effects were
mostly specific to individual crosses and not, therefore, attributed to b1 and b2 items. If
incomplete dominance was directional, it would be expected to give rise to a significant
value of b1 in the Hayman’s ANOVA. Therefore, these results were also supported by
Hayman’s ANOVA with non-significant b1 for diallel sets 3 and 4, and significant b1 for
diallel set 1.
4.3.3. Graphic analysis of Hayman
4.3.3.1. Model adequacy
Analysis of Wr–Vr values over arrays did not show much difference among
parents for diallel sets 1, 3 and 4, which is consistent with the adequacy of the additive-
dominance model (Table 4.4). However, analysis of Wr–Vr values over arrays for
diallel sets 2 and 5 varied considerably among parents indicating the inadequacy of the
additive-dominance model for those two diallel sets.
The slope of the regression line in the Wr/Vr graph differed significantly from
zero but not from unity, indicating that the frequency of dominant alleles was different
among parents and the model was adequate (Table 4.5). Considering the two tests of
adequacy, only diallel sets 1, 3 and 4 agreed with the additive-dominant model.
Therefore, diallel sets 2 and 5 were eliminated from the rest of diallel analysis.
61
Table 4.3. Mean squares and P values for the Hayman analysis of variance of ascochyta blight resistance measured on parental and F2 progeny from five 5 x
5 half diallel crosses in chickpea and wild Cicer, grown in a disease nursery at Medina, Western Australia in 2005.
Diallel set 1 Diallel set 2 Diallel set 3 Diallel set 4 Diallel set 5 Source of variations
* P<0.05; ** P<0.01 (all items tested against pooled block interaction).
Source of variation is adapted from Mather and Jinks (1982) where a is total additive genetic effects; b is total dominance genetic effects; b1 is mean deviation
of F2s from their mid-parental value (directional dominance); b2 is variation of deviation of F2s from their mid-parental value over arrays; b3 is that part of
dominance variation unique to each F2; block interactions is residual non-genetic; df is degree of freedom; MS is mean of squares; VR is variance.
62
Table 4.4. Heterogeneity and homogeneity tests for (Wr+Vr) and (Wr–Vr) values for ascochyta blight resistance from 5 x 5 half diallel crosses in chickpea and
wild Cicer accessions.
Mean of Squares Source of variation df
Diallel set 1 Diallel set 2 Diallel set 3 Diallel set 4 Diallel set 5
*, ** denotes significant at 5% and 1% confidence levels, respectively.
Table 4.5. Test of adequacy of diallel model via regression analysis of Wr over Vr for ascochyta blight resistance measured on parental and F2 progeny from 5
x 5 half diallel crosses in chickpea and wild Cicer accessions.
Diallel set 1 Diallel set 2 Diallel set 3 Diallel set 4 Diallel set 5 Items Estimate SE Estimate SE Estimate SE Estimate SE Estimate SE
All slopes were significantly close to unity and there were no significant departures of the regression coefficient (slope) from unity in the diallel sets indicating
adequacy of additive-dominance model.
*, ** denotes significantly different from zero at 5% and 1% confidence level, respectively. SE = standard error.
63
4.3.3.2. Plot of Wr/Vr
The relative order of the parents along the regression line in the Wr/Vr plot
indicates the distribution of dominant and recessive genes among the parents (Figure
4.2). Parents Lasseter, Kaniva and ILWC 184 were nearest to the origin with the most
dominant genes and the parents ICC 3996 and Almaz were furthest from the origin with
the most recessive genes. Wild accessions, ILWC 181 and ILWC 118, were in the
middle showing almost equal distribution of dominant and recessive alleles.
The intercept was significantly different from zero (P<0.05) and the regression
lines passed through the Wr axis above the origin (Figure 4.2) indicating the presence of
an incomplete dominance gene action for ascochyta blight resistance. Parents ICC 3996
and Almaz had the lowest mean values for disease score and gave the largest value of
Wr+Vr for this trait (Figure 4.3). With regard to the disease score, parents ICC 3996
and Almaz were clearly distinct from all other parents. There was a high correlation
between Wr+Vr values and mid parents.
4.3.4. Genetic components and heritability of ascochyta blight
resistance
Additive genetic variance (D) and the two components of dominance (H1 and H2)
were highly significant, indicating the importance of both additive and non-additive
gene actions in the genetic control of the trait (Table 4.6). H1 and H2 values were
slightly different from each other showing different frequencies of the gene of interest
among the parents used.
The frequency of the dominant alleles was higher than recessive alleles. The value
of F, indicating the relative frequency and magnitude of dominant and recessive alleles,
was significantly positive for diallel set 1 (P<0.01) and diallel set 3 (P<0.05).
Furthermore, __
uv = ¼(H2/H1), another test of frequency of alleles, was different from
0.25 indicating the unequal frequency of the alleles (Table 4.6). However, gene
asymmetry was of a low order.
Degree of dominance was both complete and incomplete depending on the parents
in each diallel set. The values of √(H1/D) for diallel sets 3 and 4 were almost equal to
unity which indicates the presence of dominance. On the other hand, the value of
64
√(H1/D) for diallel set 1 was greater than 1 which indicates the presence of incomplete
dominance.
Overall, heritability of ascochyta blight resistance was high in all diallel sets
across two generations (Table 4.7). Narrow-sense heritability for ascochyta blight
resistance ranged from 82 to 86% for F1 generations, and 43 to 63% for F2 generations.
Broad-sense heritability was higher than 93% for all diallel sets.
65
Diallel set 1
Slope = 1.12 ± 0.12 Intercept = 0.65 ± 0.22
R2 = 0.97
-1
0
1
2
3
4
5
0 0.5 1 1.5 2 2.5 3
Vr
Wr
Lasseter
Kaniva
ILWC 118
ICC 3996
Almaz
Diallel set 3
Slope = 1.19 ± 0.15Intercept = 0.81 ± 0.26
R2 = 0.96
-1
0
1
2
3
4
5
0 0.5 1 1.5 2 2.5 3 3.5
Vr
Wr
LasseterKaniva
ILWC 184
ICC 3996Almaz
Diallel set 4
Slope = 1.14 ± 0.14 Intercept = 0.79 ± 0.25
R2 = 0.96
-1
0
1
2
3
4
5
0 0.5 1 1.5 2 2.5 3
Vr
Wr
Lasseter
Kaniva
ILWC 181
ICC 3996
Almaz
Figure 4.2. Covariance between parental and F2 progeny (Wr) plotted against the variance of all
F2 hybrids in each parental array (Vr) for ascochyta blight resistance measured in three 5 x 5
half-diallel mating designs. The curve on plot indicates the limiting parabola Wr2 = VrVp within
which all the data points must lie.
66
Diallel set 1
Slope = -1.65 ± 0.42Intercept = 14.19 ± 2.61
R2 = 0.84
0
1
2
3
4
5
6
7
0 1 2 3 4 5 6 7 8 9
Parent M ean
Wr
+ V
r
ILWC 118
Kaniva Lasseter
AlmazICC 3996
Diallel set 3
Slope = -1.56 ± 0.27 Intercept = 14.41 ± 1.79
R2 = 0.91
0
1
2
3
4
5
6
7
0 1 2 3 4 5 6 7 8 9
Parent Mean
Wr
+ V
r
ILWC 184Kaniva
Lasseter
AlmazICC 3996
Figure 4.3. Relationship between (Wr + Vr) values (sum of covariance between parental and F2
progeny (Wr) and the variance of all F2 hybrids in each parental array (Vr)) and parental means
for ascochyta blight resistance measured in three 5 x 5 half-diallel mating designs screened at
Medina, Western Australia in 2005.
Diallel set 4
Slope = -1.62 ± 0.34Intercept = 13.65 ± 1.99
R2 = 0.88
0
1
2
3
4
5
6
7
0 1 2 3 4 5 6 7 8
Parent M ean
Wr
+ V
r
ILWC 181
KanivaLasseter
AlmazICC 3996
67
Table 4.6. Diallel analysis and estimates of genetic variance components for ascochyta blight
resistance measured on parental and F2 progeny in three 5 x 5 half-diallel crosses.
Statistics Diallel set 1 Diallel set 3 Diallel set 4
rV−
1.60 1.62 1.66
rW−
2.44 2.75 2.68
−r
V 1.05 1.25 1.32
PV 6.20 6.12 5.73
E 0.12 0.14 0.12
Genetic variance component
D 6.12*** 6.00*** 5.59***
H1 11.03*** 5.96** 6.05**
H2 8.75*** 5.89** 5.46**
F 4.97** 2.02* 0.96
(H1/D)1/2 1.34 1.00 1.04 __
uv 0.20 0.24 0.23
rV−
, mean value of Vr over all arrays; rW−
, mean value of Wr over arrays; −r
V , variance of array
means; PV , variance of the inbred parents; E, variance component due to non-genetic variation;
Table 5.2. Segregation of disease resistance in several F2 hybrid populations, derived from crosses between chickpea genotypes either resistant or
susceptible to ascochyta blight. Response was based on the area under disease progress curve (AUDPC) at Medina, Western Australia in 2005. Models for
phenotypic ratios were fitted and tested using Chi-square.
Observed ratio in F2 (AUDPC values) Cross
Two categories Three categories Fitted Model(s) Value
Kimberley Large
susceptible
x
x
Almaz
resistant 35 S:6 R 23 S:12 I:6 R
13:3
12:4
15:1
9:4:3
0.45
2.34
4.91
0.66
0.502
0.126
0.027
0.719
24 B-Isoline
susceptible
x
x
Almaz
resistant 180 S:11 R 107 S:73 I:11 R 15:1
9:6:1
0.07
0.1
0.791
0.951
Kimberley Large
susceptible
x
x
ICC 3996
resistant 83 S:25 R 37 S:46 I:25 R 12:4
13:3
0.19
1.37
0.663
0.242
24 B-Isoline
susceptible
x
x
ICC 3996
resistant 237 S:60 R 80 S :157 I :60 R 13:3
12:4
0.41
3.64
0.522
0.056
R = resistant; I = intermediate; S = susceptible
79
Table 5.3. Inheritance of leaf type in several F2 populations sown in the field at Medina and Shenton Park, Western Australia in 2005. Segregating F2
populations were derived from crosses between chickpea with contrasting leaf type: normal, multipinnate or simple. Models for phenotypic ratios were fitted
and tested using Chi-square.
F2 Ratios Cross/leaf types F1 leaf type
F2 seed
number Normal Multipinnate Simple
Fitted
model χ2 P value
Kimberley Large
simple x
24 B-Isoline
multipinnate normal 247 138 54 55 9:3:4 2.26 0.323
24 B-Isoline
multipinnate x
Almaz
normal normal 402 311 91 0 12:4 1.19 0.275
Kimberley Large
simple x
ICC 3996
normal normal 230 170 0 60 12:4 0.14 0.708
24 B-Isoline
multipinnate x
ICC 3996
normal normal 297 221 76 0 12:4 0.05 0.823
Kimberley Large
simple x
Almaz
normal normal 41 30 0 11 12:4 0.07 0.791
80
5.3.2. Inheritance of leaf types
Parental disease-resistant genotypes Almaz and ICC 3996 had normal leaf types,
while the susceptible Kimberley Large and 24 B-Isoline had a simple leaf type and
multipinnate leaf type, respectively. Normal leaf type was dominant over both simple
and multipinnate leaf types, since all F1 plants from crosses among normal, multipinnate
and simple leaf types showed a normal leaf type phenotype (Table 5.3). In both crosses,
ICC 3996 x Kimberley Large and Almaz x Kimberley Large (normal vs. simple), the F2
generation had a ratio of 12 normal:4 simple leaf types. In the crosses of normal vs.
multipinnate leaf types, ICC 3996 x 24 B-Isoline and Almaz x 24 B-Isoline, the F2
generation had a ratio of 12 normal:3 multipinnate leaf types. In the cross between
Kimberley Large and 24 B-Isoline (simple vs. multipinnate leaf type) the F2 generation
had a ratio of 9 normal:3 multipinnate:4 simple leaf types.
5.3.3. Correlations
There was no correlation between ascochyta blight susceptibility and simple leaf
type (Table 5.4). In the crosses Almaz x Kimberley Large and ICC 3996 x Kimberley
Large, the segregation of these two traits was independent (χ2=0.88, P=0.639 and
χ2=3.01, P=0.794, respectively).
Similarly, there was no correlation between ascochyta blight susceptibility and
multipinnate leaf type. The cross between Almaz and 24 B-Isoline had an χ2 value of
4.92 (P=0.177) and that of ICC 3996 x 24 B-Isoline had an χ2 value of 0.48 (P=0.923)
meaning the traits were not significantly correlated in either population.
There was no significant difference in mean disease scores between F2 individuals
with normal leaf type and multipinnate leaf type on both the 1–9 scale and the AUDPC
value basis (Table 5.5). The mean disease scores were 6.9 for multipinnate leaf type
individuals and 6.7 for normal leaf type individuals in the cross Almaz x 24 B-Isoline.
The mean disease scores in the cross ICC 3996 x 24 B-Isoline were 5.7 for multipinnate
leaf type individuals and 5.4 for normal leaf type individuals.
There was no significant difference in mean disease score between F2 individuals
with normal and simple leaf types considering the 1–9 scale (Table 5.5). However,
mean disease scores using the AUDPC value were significantly different between
simple and normal leaf types in the Almaz x Kimberley Large cross (t-stat=2.59,
P=0.013) with an AUDPC of 188 for simple leaf types and 152 for normal leaf type.
81
Among all the crosses, ICC 3996 x 24 B-Isoline had the lowest AUDPC value of
143, Almaz x 24 B-Isoline had the highest with 170 and the t-test showed a significant
difference between their total means (t-stat=7.38, P<0.001) (Table 5.6).
82
Table 5.4. The correlation of ascochyta blight resistance and different leaf types in chickpea among the F2 populations segregating for these two traits.
Correlations were tested using Chi-square.
Cross Resistant Susceptible χ 2 P value
Multipinnate Normal Multipinnate Normal
24 B-Isoline x Almaz 0 11 38 142 4.92 0.177
24 B-Isoline x ICC 3996 15 45 61 176 0.48 0.923
Simple Normal Simple Normal
Kimberley Large x Almaz 1 5 10 25 0.88 0.830
Kimberley Large x ICC 3996 4 21 23 60 3.01 0.389
Table 5.5. Mean disease scores and t-statistics of ascochyta blight response in F2 populations segregating with different leaf types in chickpea. Disease score
was calculated both according to the 1–9 disease scale and the area under disease progress curve (AUDPC) at Medina, Western Australia in 2005.
Cross Mean score (1–9 scale) t-stat P value Mean score (AUDPC) t-stat P value
C. echinospermum ILWC 181 wild, secondary genepool
C. arietinum x C. reticulatum ICC 3996 x ILWC 118 interspecific F1 hybrid Lasseter x ILWC 118 interspecific F1 hybrid FLIP97-530-CLIMAS x ILWC 118 interspecific F1 hybrid Kaniva x ILWC 118 interspecific F1 hybrid ICC 3996 x ILWC 184 interspecific F1 hybrid Lasseter x ILWC 184 interspecific F1 hybrid FLIP97-530-CLIMAS x ILWC 184 interspecific F1 hybrid Kaniva x ILWC 184 interspecific F1 hybrid
C. arietinum x C. echinospermum ICC 3996 x ILWC 181 interspecific F1 hybrid Lasseter x ILWC 181 interspecific F1 hybrid FLIP97-530-CLIMAS x ILWC 181 interspecific F1 hybrid Kaniva x ILWC 181 interspecific F1 hybrid Lasseter x ILWC 245 interspecific F1 hybrid FLIP97-530-CLIMAS x ILWC 245 interspecific F1 hybrid
90
6.3. Results
6.3.1. Rooting treatments
Rooting rate was significantly (P<0.001) greater when stem cuttings were dipped
in PGR powder compared with honey (Figure 6.1). Overall, PGR powder had the
highest rooting rate (93.8%), root number (17.8 roots/cutting) and root length (2.9 cm).
There was no significant difference between PGR powder and honey + PGR powder
treatments for rooting rate, root number, root length, and survival rates.
The rooting substrate was also an important factor affecting vegetative
propagation in chickpea, Cicer species and their interspecific hybrids. According to the
results, sand + potting mix produced a higher rooting rate (79.4%), root length (2.9 cm)
and survival rate at maturity (71.4%) than sand substrate. Rooting substrates had no
effect on root number.
PGR powder treatment with sand + potting mix substrate was the best treatment
combination for cutting propagation. PGR powder treatment with sand + potting mix
substrate had the highest rooting rate, root number and root length (Figure 6.2). Survival
rates in PGR treated cuttings in sand + potting mix substrate at pre-flowering stage
ranged from 83.3 to 100% after three weeks and at maturity for chickpea accessions
(Table 6.2). High survival rates were also achieved for wild accessions (ranging from
95.8 to 100%) and interspecific hybrids (ranging from 75 to 100%).
91
Figure 6.1. The effect of different treatments on root development in chickpea (cv. Kaniva) stem cuttings. Cuttings were treated with PGR powder (0.5 mg/g
IBA and 0.5 mg/g NAA), PGR powder + honey, and honey only. Treatments with PGR powder and PGR powder + honey produced the highest number of
roots, whereas treatment with honey only produced the least number of roots. The line indicates 3 cm length.
92
6.3.2. Genotype and stage of plant development
All genotypes and crosses were successfully propagated with the stem cutting
method (Table 6.2). However, there were significant (P<0.01) differences among
genotypes for rooting rate, root number, root length and survival rates. Among chickpea
accessions, ICC 3996 had the lowest rooting rate (87.5%) even with the best treatment
combination.
The development stage of the donor plant significantly affected the rooting rate
(P<0.05), root number (P<0.05) and root length (P<0.01). Rooting rate at pre-flowering
stage was 53.7% compared with 41.7% for post-flowering stage. Pre-flowering cuttings
produced more (8 roots/cutting) and longer roots (2 cm) than those at post-flowering
stage (5.7 roots/cutting; 1 cm root length). Overall, pre-flowering stage was more
successful for propagation than post-flowering stage. There was no significant
difference between the two stages for survival rates.
Simple correlation among measured traits indicated that there is a strong
significant (P<0.001) correlation between early and final survival rates (r=0.98). The
correlations among root number and survival rates after three weeks and at maturity
were 0.72 and 0.75, respectively. There was less correlation among root length and
survival rates (r=0.38 at three weeks; r=0.41 at maturity). There was no significant
correlation between rooting rate and survival rate after three weeks (r=0.32) and at
maturity (r=0.23).
93
Figure 6.2. The effect of different rooting treatments and rooting substrate combinations on
rooting rate, root length and root number in chickpea and hybrids. Treatments are: (1) honey
with river sand, (2) honey with sand + potting mix, (3) PGR with river sand, (4) PGR with sand +
potting mix, (5) honey + PGR with river sand, and (6) honey + PGR with sand + potting mix.
Values are mean ± SE, n=12.
0
20
40
60
80
100
120
1 2 3 4 5 6
Treatment
Roo
ting
rat
e (%
)
0
5
10
15
20
25
1 2 3 4 5 6
Tre atme nt
Num
ber
of r
oots
per
cut
ting
0
1
2
3
4
5
1 2 3 4 5 6
Treatment
Roo
t le
ngth
(cm
)
94
Table 6.2. The response of different genotypes, in rooting rates and survival rates, after
treatment with PGR powder and growth in a mixture of sand and potting mix substrate (2:3 v/v)
at the pre-flowering stage. Values are mean ± SE; n=12
PGR treatments, cutting substrates and donor plant growth stage were important
factors in vegetative propagation of Cicer species, as stated in our hypothesis. Treating
cut stems with PGR powder at the pre-flowering stage and growing in sand + potting
mix substrate was the best method to obtain the highest rooting rate and maximum
survival. Secondly, genotype played an important role and we demonstrated a
significant difference in the response among different chickpea breeding lines, cultivars,
and accessions of C. reticulatum and C. echinospermum.
All accessions of chickpea, C. reticulatum, C. echinospermum and interspecific
hybrids were vegetatively propagated using stem cuttings. The success from diverse
genotypes in the present study, with rooting rates ranging from 87.5 to 100%, was equal
to or higher than previous studies (Collard et al. 2002; Rupela 1982; Rupela and Dart
1981; Sheila et al. 1991) with the best rooting rates ranging from 75 to 100% (Davis
and Foster 1982; Rupela 1982), 50 to 70% (Islam and Riazuddin 1993), and 48.6 to
70.8% (Collard et al. 2002).
There are a few recent reports of stem cutting propagation of chickpea directly
into rooting substrate (Collard et al. 2002; Syed et al. 2002). Previous reports of
vegetative propagation of chickpea and wild Cicer species by stem cuttings used
solution culture methods (Bassiri et al. 1985; Islam and Riazuddin 1993; Rupela 1982;
Rupela and Dart 1981; Sheila et al. 1991) which requires frequent monitoring for algal
growth and a constant solution volume (Collard et al. 2002). The method described by
Collard et al. (2002) was relatively simple for rapid vegetative propagation of chickpea
and wild Cicer species. However, their cutting method had lower rooting rates (48.6–
70.8%) compared with some other studies including the present one. Syed et al. (2002)
used IAA and NAA at a range of concentrations in 3- to 5-day old chickpea seedlings
which are very small and hard to handle.
This is the first comprehensive investigation on the role of different plant growth
stages in the vegetative propagation of Cicer species and their effects on stem cuttings
and survival rates. Overall, rooting rates at pre-flowering were higher than at post-
flowering. Individual stages such as post-flowering (Bassiri et al. 1985; Rupela 1982)
and pre-flowering (Collard et al. 2002; Sheila et al. 1991) have been used to propagate
96
Cicer species. Rupela (1982) removed flower buds to prevent switching to reproductive
growth of donor plants at the post-flowering stage which proved time consuming.
A study of woody species found the dipping of cuttings in honey alone was
superior for root induction (Balabushka 1984). We tested this theory to induce roots in
stem cuttings of Cicer species by dipping cuttings in honey alone, in combination with a
powdered PGR or PGR alone. All treatments produced roots in chickpea and wild Cicer
species but, in general, the PGR powder was more effective than honey in root
formation. The effectiveness of PGR powders is well recognised, especially by the
horticultural industry, and the response of chickpea to individual PGRs such as IBA,
NAA and IAA has been investigated—with IBA being the most effective treatment in
root formation (Bassiri et al. 1985; Islam and Riazuddin 1993; Sheila et al. 1991; Syed
et al. 2002). According to previous studies, treatment with 0.5 mg/L IBA produced the
highest frequency of root generation and the highest root number. Adding 0.5 mg/L
NAA to the nutrient solution containing 0.5 mg/L IBA did not increase rooting rate or
root number, but the roots that did develop were stronger and healthier than with IBA
alone (Islam and Riazuddin 1993). We conclude that a combination of IBA and NAA
promotes rooting in Cicer species, and the addition of honey is unnecessary.
In conclusion, genotype, PGR treatments, rooting substrate and plant growth stage
are important factors in the vegetative propagation of chickpea, crossable wild annual
relatives (C. reticulatum and C. echinospermum), and their interspecific hybrids. The
following steps are critical to achieve a high rooting rate in Cicer species: (i) take stem
cuttings at the pre-flowering growth stage, (ii) remove the two lowest leaves and surface
sterilise the base of the cut with 100% ethanol, (iii) dip 3 cm of the bottom end in PGR
powder (0.5 mg/g IBA and 0.5 mg/g NAA), (iv) place cuttings in 10 cm pots containing
sand + potting mix substrate (2:3) in a misting chamber for two weeks, (v) replant stem
cuttings in 25 cm pots with potting mix, apply rhizobium and place in a misting
chamber for one week, and (vi) move pots with cuttings to a glasshouse with 50% shade
cloth for three days to harden off. Then treat them as their mother plants.
Vegetative propagation of chickpea is a technique to increase seed production of
early generation chickpea lines for breeding wild Cicer species in germplasm
collections, and precious hybrids. Furthermore, cloned cuttings can be used for disease
assessment of F2 generations or heterozygous plants, where several clones can be tested.
This enables replicated screening, as well as the use of disease screening methods
97
without the destruction and loss of the original plants. Finally, cloned cuttings can be
screened for many important economic traits on multi-sites at the same time which
reduces the cost and improves efficiency. The results from this study provide a
standardised, simple, rapid and reliable method with a high success rate for propagation
of Cicer species.
98
Chapter Seven
7. QTL mapping of ascochyta blight resistance, days to flowering and plant growth habit in interspecific progenies derived from a cross between chickpea and C. reticulatum
Abstract
An interspecific F2 mapping population derived from a cross between chickpea
accession ICC 3996 (resistant to ascochyta blight, early flowering, and semi-erect plant
growth habit) and C. reticulatum accession ILWC 184 (susceptible to ascochyta blight,
late flowering, and prostrate plant growth habit) was used to construct a genetic map. F2
plants were cloned through stem cuttings taken at the pre-flowering stage, treated with
(SE=0.2) and 6.7 (SE=0.2), respectively. The segregation pattern of ascochyta blight
resistance for the mapping population was continuous and skewed toward the
susceptible parent (Figure 7.1). A bimodal phenotypic ratio of 15 resistant:1 susceptible
was the most appropriate fitted model (χ 2=1.33, P=0.250) for the F2 population (Table
7.1). Epistasis was evident from the fitted model, and two major recessive genes
controlled resistance to ascochyta blight. Susceptibility was dominant over resistance.
7.3.1.2. Days to flowering
The segregation for days to flowering was continuous in the F2 population (Figure
7.1). Chickpea genotypes ICC 3996, C. reticulatum accession ILWC 184 and their F1
hybrids flowered at 40.5 days (SE=1.9), 74.3 days (SE=5.1), and 52.0 days (SE=1.7)
after sowing, respectively. Two phenotypic ratios of 15 late flowering:1 early flowering
(χ 2=0.006, P=0.936) and 9 late flowering:6 intermediate:1 early flowering (χ 2=0.008,
P=0.966) were the most suitable fitted models for days to flowering in this population
104
(Table 7.1). The classic phenotypic ratio of 9:3:3:1 also fitted the model (χ 2=5.23,
P=0.155).
7.3.1.3. Plant growth habit
The F2 population was arranged into three categories—prostrate, spreading and
semi-spreading growth habit (Figure 7.1). The parents ICC 3996 and ILWC 184 had
semi-erect and prostrate growth habits, respectively. Interspecific F1 hybrids had a semi-
spreading growth habit. Plant growth habit in the F2 mapping population had a
phenotypic ratio of 3 prostrate:1 spreading: (χ 2=0.003, P=0.956). Prostrate growth habit
was dominant over semi-erect and the population distorted towards the wild genotype.
7.3.2. Correlations
There was a significant negative correlation between ascochyta blight resistance
and days to flowering (r=–0.22, P<0.001, n=306). There was a highly significant
correlation between days to flowering and plant growth habit (r=0.36, P<0.001, n=306).
There was no significant correlation between ascochyta blight resistance and plant
growth habit.
The correlation between clones derived from stem cuttings and seed-grown
chickpea plants was evaluated in response to ascochyta blight disease. There was a
highly significant correlation for ascochyta blight resistance (r=0.98, P<0.001, n=8).
Therefore, clonal materials propagated by stem cutting method were used to evaluate
the F2 population.
7.3.3. General features of the map
The linkage map comprised 144 microsatellite markers (Figure 7.2). The map had
eight linkage groups covering 468.0 cM of the chickpea genome and the average
spacing between microsatellite markers was 5.1 cM. Three markers remained unlinked,
and markers GA26 and H1I16 were closely linked with each other but did not join other
linkage groups.
The observed and expected marker allele segregation ratios were compared using
Chi-square tests (P<0.05). A total of 28 of the 147 markers (19%) had segregation ratios
that significantly deviated from the expected 1:2:1 ratio for co-dominant markers and
the 3:1 ratio for dominant markers in the F2 population. Of the 28 distorted markers, 21
105
were distorted towards the C. reticulatum parent (on LG3 and LG6) and 7 markers
distorted towards heterozygotes (on LG4). There were no distorted markers towards the
chickpea parent.
106
Table 7.1. Segregation ratios for ascochyta blight resistance, days to flowering and growth habit based on 306 F2 individuals. Ascochyta blight resistance was
assessed on clonal plants produced by stem cuttings, while days to flowering and growth habit were measured on original F2 plants.
7.3.4.1. Effect of a single QTL on a quantitative trait
The frequency distribution of ascochyta blight resistance was continuous implying
the oligogenic inheritance of the trait. Interval mapping conducted with MultiQTL
software detected two major regions significantly associated with ascochyta blight
resistance on LG3 (LOD=3.56, P=0.029) and LG4 (LOD=4.29, P=0.002) explaining
21.1% and 22.7% of the phenotypic variation in the population, respectively (Table
7.2).
Only one major QTL (LOD=17.5, P<0.0001) was associated with days to
flowering (Table 7.2). The QTL explained 54.9% of the phenotypic variation for days to
flowering and was flanked by markers TAA142 (2.0 cM) and TA64 (8.1 cM).
One major QTL was detected on LG4 for growth habit with an LOD score of 62.2
(P<0.0001) explaining 95.2% of the phenotypic variation (Table 7.2). Two STMS
markers TA34 and TA142 flanked the QTL at map positions 5.3 and 9.2 cM,
respectively.
Dominance played an important role in the QTL located on LG3 which was
associated with ascochyta blight disease. An additive effect controlled the response to
ascochyta blight disease by QTL located on LG4 (Table 7.2). Both additive and
dominant effects were important in the control of traits, days to flowering and plant
growth habit.
109
Table 7.2. Detection of single QTL for ascochyta blight resistance, days to flowering and plant growth habit in the interspecific F2 mapping population (C.
arietinum x C. reticulatum).
QTL estimates Response to D. rabiei Response to D. rabiei Days to first flower Growth habit LG [Interval] a 3[9] 4[1] 3[10] 3[9] P b 0.029 0.002** <0.0001*** <0.0001*** LOD c 3.56 (1.45) 4.29 (1.9) 17.5 (3.91) 62.2 (37.6) Position d 45.3 (21.0) 2.4 (4.4) 51.5 (4.7) 40.3 (9.0) PEV e 0.227 (0.101) 0.211(0.089) 0.549 (0.103) 0.952 (0.079) PEV (additive) 0.042 (0.06) 0.169(0.095) 0.334 (0.122) 0.695 (0.119) Response Mean f 5.52 (0.415) 6.25 (0.356) 70.4 (1.63) 4.5 (0.09) Effect g (Additive) –0.147 (0.871) –1.64 (0.557) –18.4 (2.86) –1.043 (0.11) Effect g (Dominant) 1.17 (0.581) –0.36 (0.498) –10.3 (2.62) 0.433 (0.149)
Flanking Markers TA34 (10.3 cM) TA142 (4.2 cM)
STMS11 (2.4 cM) TAA170 (5.7 cM)
TAA142 (2.0 cM) TA64 (8.1 cM)
TA34 (5.3 cM) TA142 (9.2 cM)
a Linkage group and interval within LG associated with the quantitative trait b Probability values from 3000 permutation analyses testing the presence of a QTL. Asterisks indicate genome-wide significance for false discovery rate: 10%
(*), 5% (**), and 1% (***) c–g Estimated by 5000 bootstrap tests. Standard deviations (SD) are shown in parentheses c Maximum LOD value for the given interval d Position (cM) of maximum LOD value within the interval measured from the first marker in the linkage group (0 cM). Estimates obtained with MultiQTL
software and corrected according to distance obtained from MapManager e Proportion of variability explained by the putative QTL g The estimated effect of the allele (additive and dominance)
110
7.3.4.2. Effect of two linked QTL on a quantitative trait
The potential presence of two linked QTLs on a trait was analysed by comparing
single-QTL and two-QTL models. The two-QTL model for the control of response to
Ascochyta rabiei on LG4 was supported (LOD=19.7, P<0.001). Two linked QTLs
(QTL 4[1] and QTL 4[7]) with unequal variance and epistatic effect was the most
appropriate model for ascochyta blight resistance on LG4. These two QTLs explained
26% of the total phenotypic variation for ascochyta blight resistance (Table 7.3). QTL
4[1] had a major effect on disease resistance with flanking markers STMS11 (3.6 cM)
and TAA170 (4.5 cM), while QTL 4[7] had a minor effect on disease resistance flanked
by markers H3D09 (1.4 cM) and H1A12 (0.2 cM).
In the case of days to flowering, two QTLs were detected on LG3 (P<0.001) with
unequal variances and epistatic effect between QTLs. The two linked QTL model was
significantly different from single QTL model (P<0.001). Two major QTLs on LG3,
QTL 3[10] and QTL 3[13], explained 90.2% of the phenotypic variation flanked by
markers TAA142 (3.2 cM) and TA64 (6.9cM) in interval 10 and markers TS29 (7.7
cM) and TA76 (10.2 cM) in interval 13, respectively.
There was no support for two linked QTLs for growth habit (P=0.549).
111
Table 7.3. Detection of two linked QTLs controlling ascochyta blight resistance and days to flowering in the interspecific F2 mapping population in
chickpea
PEV Parameters of genetic model Residual for allelic groups LOD L1 L2
ABR, ascochyta blight resistance DTF, days to flowering LOD, maximum LOD score for the given interval L, location in recombinant distance (cM) of maximum LOD value within the respective intervals measured from the first marker in LG (at 0 cM) PEV, proportion of variability explained by the putative QTLs M, response mean SD, standard deviation D, Effect of the allele in the respective locus E1, effect of the interaction between loci, the epistatic interaction in Homologous QTL1 * Homologous QTL2 E2, effect of the interaction between loci, the epistatic interaction in Homologous QTL1 * Heterologous QTL2 E3, effect of the interaction between loci, the epistatic interaction in Heterologous QTL1 * Homologous QTL2 E4, effect of the interaction between loci, the epistatic interaction in Heterologous QTL1 * Heterologous QTL2 Q, dominant allele q, recessive allele