This discussion paper is/has been under review for the journal Atmospheric MeasurementTechniques (AMT). Please refer to the corresponding final paper in AMT if available.
Design and performance of a Nafion dryerfor continuous operation at CO2 and CH4
air monitoring sites
L. R. Welp1, R. F. Keeling1, R. F. Weiss1, W. Paplawsky1, and S. Heckman2
1Scripps Institution of Oceanography, University of California San Diego, 9500 Gilman Dr.,La Jolla, CA, USA2Earth Networks, Inc., 12410 Milestone Center Dr., Suite 300 Germantown, MD, USA
Received: 30 June 2012 – Accepted: 17 July 2012 – Published: 7 August 2012
In preparation for the routine deployment of the Earth Networks greenhouse gas mon-itoring network, we have designed and tested a simple method for drying ambient airto below 0.2 % mole fraction H2O using a Nafion dryer. The inlet was designed for usewith a Picarro model G2301 cavity ring down spectrometer (CRDS) CO2/CH4/H2O an-5
alyzer. The analyzer measures water vapor mixing ratio at the same frequency as CO2and CH4 and then corrects for the dilution and peak broadening effects of H2O on theCO2 and CH4 mixing ratios. This analyzer is remarkably stable and performs well onwater vapor correction tests, but there is potentially an added benefit of reducing thedependence on the H2O correction for long term field measurement programs. Sub-10
stantially lowering the amount of H2O in the sample can reduce uncertainties in theapplied H2O corrections by an order of magnitude or more, and eliminate the need todetermine an instrument-specific H2O correction factor and to verify its stability overtime. Our Nafion drying inlet system takes advantage of the extra capacity of the an-alyzer pump to redirect 30 % of the dry gas exiting the Nafion to the outer shell side15
of the dryer and has no consumables. We tested the Nafion dryer against a cryotrap(−95 ◦C) method for removing H2O and found that it does not significantly alter the CO2and CH4 dry mixing ratios of the sample gas. Systematic differences between the dry-ing methods were at the level of 0.05 ppm in CO2 and 0.1 ppb in CH4 for the wet-airtests, well within the WMO compatibility guidelines.20
1 Introduction
There is increasing interest in regional greenhouse gas emissions estimates as stake-holders aim to reduce and verify emissions at national, state and city levels (NRC,2010). Two of the most important greenhouse gases of interest are CO2 and CH4. At-mospheric inversion methods provide a means of inferring emission rates based on at-25
mospheric concentration measurements, but their usefulness at the regional level has
been hampered by uncertainty in atmospheric transport (Houweling et al., 2010; Linet al., 2006; Stephens et al., 2007) and sparse greenhouse gas monitoring locations(Butler et al., 2010; Gurney et al., 2002). Recently, Earth Networks, Inc. has proposedto greatly increase the density of atmospheric surface measurements by deployinga network of close to 50 continuous observation stations across the United States5
(http://www.earthnetworks.com/OurNetworks/GreenhouseGasNetwork.aspx). It is im-portant that the data collected by this network is of high quality and meets or exceedsthe WMO compatibility goals of 0.1 ppm CO2 in the Northern Hemisphere and 0.05 ppmCO2 in the Southern Hemisphere, and 2 ppb CH4 (WMO, 2009).
Until recently, most highly accurate continuous CO2 measurements were made us-10
ing non-dispersive infrared (NDIR) spectroscopic analyzers (e.g. Bakwin et al., 1998).These analyzers require frequent calibration and drying the air prior to analysis. Anewer approach using wavelength-scanned cavity ring-down spectroscopy (CRDS)has greater stability, reducing the frequency of calibration, and has the potential toeliminate the need for drying (Crosson, 2008). Water vapor interferes with CO2 and15
CH4 concentration measurements by diluting the mixing ratios in air and by broaden-ing the spectroscopic absorption lines of other gases. The approach that Picarro, Inc.has taken with their CRDS analyzers is to concurrently measure H2O of the sampleand use experimentally derived algorithms to correct for the dilution and broadeningeffects (Crosson, 2008; Rella, 2010).20
Since the Picarro CRDS instruments are fairly new, there have been limited studiespublished testing the stability and transferability of the water vapor correction algorithmfor each instrument unit (Chen et al., 2010; Winderlich et al., 2010; Richardson et al.,2012). Chen et al. (2010) suggests that applying the same set of coefficients to multipleinstruments can yield high quality data. They found the residual error after the water25
vapor correction is below 0.05 ppm for CO2 and below 0.5 ppb for CH4. Winderlich etal. (2010) concludes that the water vapor correction for an individual instrument is sta-ble over a year and half and estimates the repeatability of the corrected measurementsis within 0.03 ppm for CO2 and 0.3 ppb for CH4. Because of the limited testing on the
transferability and long term stability of the water vapor correction coefficients, the man-ufacturer currently recommends experimentally calculating the correction coefficientsfor each individual instrument at the start of operations for best performance (Rella,2010). The uncertainty analysis in (Rella, 2010) shows that using instrument-specificwater vapor correction coefficients can reduce the uncertainty in the correction made5
to dry-gas mixing ratios by a factor of ∼ 7 for CO2 (0.36 to 0.048 ppm CO2 at 4 % H2Oand 380 ppm CO2) and ∼ 11 for CH4 (2.2 to 0.2 ppb at 4 % H2O and 2000 ppb CH4).
However, these types of water vapor correction experiments are inherently tricky toperform because H2O and CO2 can interact with tubing walls in most experimentalsetups. Some amount of CO2 can adsorb to the tubing walls, and increasing H2O will10
displace that CO2, creating an artifact in a dry/wet-air comparison. Simply reducing theH2O in the sample by an order of magnitude or more would reduce the uncertainty inthe corrected dry-gas mixing ratios by nearly the same amount as calibrating each indi-vidual instrument before network deployment. The simple, partial drying technique wepresent here does not eliminate the water vapor influence, but reduces the water vapor15
correction by an order of magnitude or more, thus eliminating the need to characterizethe water vapor correction on each instrument before deployment.
The Nafion membrane is known to be semi-permeable to water vapor and relativelyimpermeable to other gases (Leckrone and Hayes, 1997). Nafion dryers are designedwith the semi-permeable membrane separating an inner sample gas stream from a20
stainless steel outer shell, with a counterflow purge gas stream. If the partial pressureof water vapor is lower in the purge gas stream, then water is removed from the samplegas stream. There are many different ways to supply the purge gas to Nafion dryers.Common methods include those with no consumables, like reusing the sample gas it-self after passing through the inner Nafion membrane. And methods with consumables25
that must be replaced, such as using molecular sieve to remove all the water from thesample after the Nafion and before it is reused as the purge gas (e.g. Stephens et al.,2011) and dry air from a tank or generator. The choice depends largely on what thetolerance is for residual water in the sample gas.
For the Earth Networks stations, we designed a simple drying inlet system for am-bient air monitoring (Fig. 1) using a 72-inch long Nafion membrane dryer (PermaPure,Inc., model MD-050-72S-1). This inlet drying configuration takes advantage of the ex-tra capacity of the external analyzer pump to redirect 30 % of the dried gas exiting theNafion to the outer shell side of the dryer creating both a gradient in the H2O par-5
tial pressure and total gas pressure across the Nafion membrane. This total pressuredrop across the membrane enhances the drying capacity of the Nafion and conservessample and reference gases.
This setup also unavoidably produces partial pressure gradients in CO2 and CH4across the membrane that may allow small amounts of these gases to also perme-10
ate across the membrane (Ma and Skou, 2007). To reduce the influence of any suchpermeation on the sample measurements, the network sampling setup uses activepressure stabilization for all ambient air intakes and reference tank gases. This willensure that the Nafion is exposed to sample and reference gases at identical totalpressures, so that any direct effect of pressure-dependent permeation of CO2 and CH415
is canceled in the comparison between sample and reference gases.Even with the pressure stabilization, however, one important difference still exists
between samples and references, i.e. sample gas enters the Nafion with much highermoisture levels than calibration gases. The permeation of CO2 and CH4 through themembrane may be moisture-dependent (Ma and Skou, 2007), and this could lead to20
differential biases between sample and calibration gases that do not cancel.Here we present results of tests that evaluate the performance of this particular
setup. We show that the setup is very effective in reducing water to between 0.1 to0.15 % levels, and show that any moisture-dependent changes in the permeation ofCO2 and CH4 across the Nafion membrane are very small. We evaluated the setup25
both before and after 9 months of continuous usage to test for aging effects, and wequantify the time required for the Nafion system to stabilize after reference gases areintroduced.
The ideal inlet drying system removes H2O without modifying CO2 or CH4. In this study,we test the performance of the inlet drying system by ensuring that any changes to CO2or CH4 are negligible or correctable. This requires a humidified air source with knowndry-gas mixing ratios of CO2 and CH4. It is difficult to humidify air without changing5
its dry-gas CO2 mixing ratio slightly because of the propensity of CO2 to interact withwater adsorbed on tubing walls. For this reason, we compared our Nafion dryer systemwith a cryotrap at −95 ◦C using the experimental design in Fig. 2. Similar cyrotraps havebeen used in this community for decades and any effects on CO2 and CH4 are knownto be very small. Thus, we believe showing that the Nafion system is as good as one10
of these cryotraps is a suitable performance benchmark.The analyzer used for testing this application was a Picarro G2301 CRDS
CO2/CH4/H2O gas analyzer, but this application may be used with any similar gasanalyzer. The external pump used was a KNF pump unit supplied by Picarro, retrofitin order to make it leak-tight to ensure that the gas flow exiting the pump was identical15
to the gas flow through the CRDS analyzer. The same analyzers are used in the EarthNetworks greenhouse gas network design but with a different external pump and a fewslight changes to set air flow rates. Flow rates in the test system were controlled bymanually adjusting needle valves at the CRDS inlet and in the Nafion counterflow loop(Fig. 2). In the deployed network design, the flow rates are set by replacing the de-20
fault Picarro factory O’Keefe A-18-NY orifice with a smaller A-9-NY, and in the Nafioncounterflow by an A-6-NY orifice (Fig. 1). For these orifices to work the downstreampressure has to be low to assure sonic velocity in the orifice. This is needed for thecritical flow to be constant regardless of upstream pressure. It is also important to filterthe gas upstream of the orifice to avoid getting it clogged.25
Dry air from a standard tank was passed through a temperature-controlled bubblerstyle humidifier in wet-air tests or bypassed in dry-air tests (Fig. 2). The resulting wet-air(or dry-air) was split between the Nafion dryer and the cyrotrap, each constantly flowing
at ∼ 70 scc min−1, and alternately sampled by the Picarro analyzer, or sent to a wastepump. The cyrotrap was stainless steel, with a 1
2′′
outer tube and a 18′′
inner dip tube.Air flowed in through the outer tube, and 3 mm glass beads at the bottom reduced thechance of ice crystals entering the inner tube along with the airflow out of the cryotrap.We also added heat tape to the top of the cryotrap, above the chiller, to discourage5
liquid water build up at the top of the trap. The H2O mixing ratio of the humidified airwas adjusted by changing the temperature of the water bath surrounding the humidifierand by changing the gas pressure inside the humidifier. Delivery pressure to the Nafiondryer and cyrotrap was maintained at 600 Torr by an MKS 640 pressure controller inorder to simulate conditions appropriate for routine sampling of ambient air.10
The experiments using this test set up of the Nafion drying system were conducted atambient laboratory temperature of ∼ 24±1 ◦C over the course of each experiment. Thedrying systems deployed by Earth Networks are in an enclosure warmed to ∼ 45 ◦Cin order to minimize the chance of condensation forming in the inlet system and tobuffer temperature changes. This temperature increase makes the Nafion less effi-15
cient at removing water (Leckrone and Hayes, 1997), by approximately 0.01 % (or0.1 mmol mol−1) based on side-by-side operation of the test system described hereand a network system sampling air from the SIO pier. However, we do not expect thewarmer temperatures to affect the CO2 and CH4 permeability tested here.
Three types of experiments were completed at the start of operation: one dry-air run20
(Exp. 1), one wet-air run (2.1 % H2O, Exp. 2), and two wet-air runs (2.1 % H2O) witha secondary cyrotrap after the Nafion dryer to eliminate the need to apply the watervapor correction (Exp. 3). The secondary cryotrap was placed immediately before theCRDS. This secondary cryotrap used a “cold finger” design similar to that of the primarycyrotrap, but smaller, 1
4′′
stainless steel outer tube and 116
′′inner tube, with no glass25
beads.In all these experiments, gas was constantly flowing through the Nafion system at
100 scc min−1 (with 30 scc min−1 of that redirected to the counterflow purge) and thecryotrap at 70 scc min−1. We used the CRDS changeover valve (Fig. 2) to alternately
switch the CRDS intake between the Nafion and cryotrap, quantifying any differencesin the CO2 and CH4 mixing ratios between the two treatments.
For the wet-air runs, the H2O values were 2.1 %, which were as high as we couldachieve with the bubbler humidifier at 20 ◦C and maintaining an operating pressuregreater than 600 Torr and keeping the test system at laboratory temperature. Since5
the Nafion-dryer treatment without the secondary cyrotrap did not completely removeall of the water from the air, and in the case of the dry-air run, it added water to theair, we applied the water vapor correction from Chen et al. (2010) as recommended byRella (2010) to the data as needed (Appendix A). These corrections are on the orderof 1.0 ppm CO2 and 3.7 ppb CH4 for 0.2 % H2O.10
For these tests, we switched the changeover valve every 60 min. Preliminary testsusing 15-min switching intervals showed drifting CO2 values presumably because ofdifferent flow resistances between the Nafion system and the cryotrap causing smallpressure changes that in turn caused CO2 to be adsorbed or desorbed on the wallsafter switching.15
After completing a first round of tests as described above, the Nafion dryer inlet sys-tem with the CRDS was used continuously for nine months of routine air measurementsfrom the pier at the Scripps Institution of Oceanography (SIO). We then repeated thedry gas Exp. 1 and wet gas Exp. 3 to see if the aging of the Nafion over the nine-monthperiod had any impact on the permeability of CO2 and CH4.20
All data was processed on 1-min running means, discarding the first 30 min of dataafter switching. There was no evidence of drift in CO2 or CH4 in the last 30 min of datafor each treatment. The number of switching intervals varied in each experiment, asthe primary cryotrap would plug with ice after several hours of use, thereby ending theexperiment. Biases between the Nafion and cryotrap treatments were calculated as25
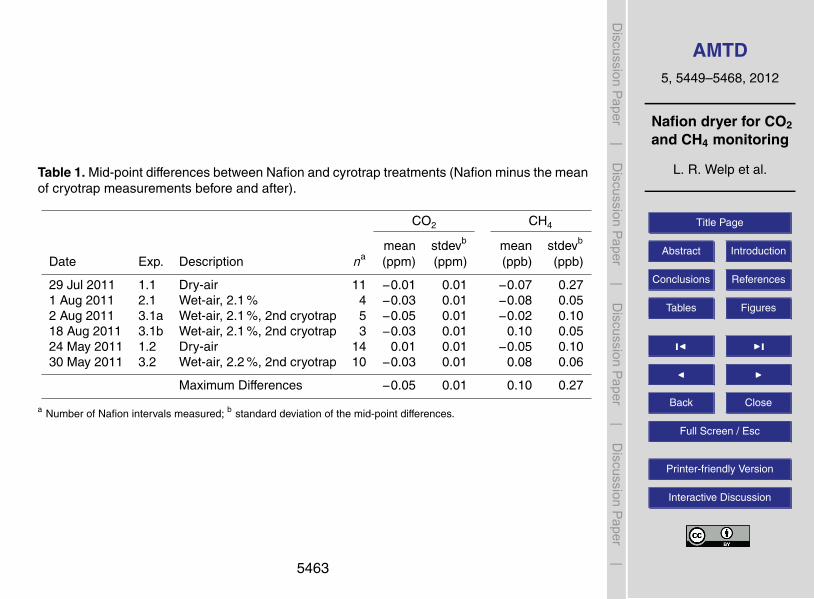
the differences between Nafion and the mean of the two cryotrap treatments beforeand after, i.e. the mid-point difference, and then averaged over the total number ofsampling pairs. In Table 1, we report the mean and standard deviation of the mid-pointdifferences.
In the first dry-air experiment, Exp. 1.1 (Fig. S1), we ran dry tank air with a CO2 drygas mixing ratio of ∼ 506 ppm and CH4 of ∼ 4787 ppb, switching between the Nafionand bypass. In this case, the cyrotrap was in-line but not chilled, rather at ambient5
laboratory temperature since the air was dry already. The mean mid-point difference ofthe Nafion and bypass treatments was −0.01±0.01 ppm for CO2 and −0.07±0.27 ppbfor CH4 (summarized in Table 1). Negative values mean that there was slightly lessCO2 and CH4 after the Nafion treatment than the cryotrap treatment. The measureddifference between treatments was within the manufacturer-specified uncertainty; a 5-10
min measurement precision of < 0.15 ppm CO2 and < 50 ppb CH4.In the first wet-air experiment, Exp. 2.1 (Fig. S2), we humidified tank air with a CO2
dry gas mixing ratio of ∼ 393 ppm CO2 and ∼ 1874 ppb CH4 to 2.1 % H2O. The Nafiondryer reduced the H2O in the humidified sample down to 0.12 %, and we applied thewater vapor correction to this data to calculate dry gas mixing ratios for CO2 and CH4,15
Eqs. (A1) and (A2). We then compared the Nafion dryer treatment with the cyrotrapand found a mean mid-point difference over 4 pairs of Nafion/cryotrap switching of−0.03±0.01 ppm for CO2 and −0.08±0.05 ppb for CH4 (Table 1).
The final two wet-air experiments, Exp. 3.1a (Fig. 3) and Exp. 3.1b (Fig. S3), used theadditional cryotrap to completely remove the residual water that makes it through the20
Nafion. The CRDS confirmed that the air was dried to below 0.00002 %, and no watervapor corrections were applied. The largest mean Nafion minus cyrotrap differenceswere −0.05±0.01 ppm of CO2 and 0.1±0.05 ppb of CH4 (Table 1). In this set of wet-air experiments, the cold trap plugged with ice after 3 to 5 pairs of Nafion/cryotrapswitching.25
After nine months of continuously monitoring ambient air from intakes on the SIO pier,we repeated similar tests to see if age or use affected the permeability of the Nafionto CO2 and CH4. We repeated the dry-air experiment, Exp. 1.2, using a different dryair tank with approximately 393.6 ppm CO2 and 1873 ppb of CH4, again, leaving the5
cryotraps at room temperature (Fig. S4). We applied the water vapor correction toaccount for the small amount of water added from the Nafion treatment. The mean of14 pairs of Nafion minus cyrotrap mid-point differences was 0.01±0.01 ppm for CO2and −0.05±0.1 ppb for CH4 (Table 1).
We also repeated the wet-air experiment, Exp. 3.2 (Fig. S5) using the same dry air10
tank as in Exp. 1.2, but humidified to 2.2 % H2O. We used the secondary cyrotrap,which eliminated the need to apply the water vapor correction. The mean of 10 pairs ofNafion minus cyrotrap mid-point differences was −0.03±0.01 ppm of CO2 and 0.08±0.06 ppb of CH4 (Table 1). These results are similar to Exp. 3.1a and 3.1b, run prior toroutine operation, and show no sign of age effects on Nafion after nine months.15
3.3 Transition times
We were also interested in addressing how much time is required for the system tostabilize under routine conditions when the intake selector switches from wet ambientair to dry reference tank air. The previous experiments focused on identifying potentialsteady state offsets caused by the Nafion. It is possible that when humidity changes20
rapidly in the Nafion when switching from moist air to a dry reference tank, that thereare transient offsets in CO2 and CH4 while the Nafion dries out. In Fig. 4 we show theambient air to dry tank transitions from one month of routine operation in April 2012.The water vapor correction in Appendix A was applied to this data. The humidity ofthe reference gas exiting the Nafion decreases from about 0.12 % to 0.08 % as the25
Nafion slowly dries. After switching, it takes the CRDS measurements about 10 min tostabilize.
We have tested a setup for drying air using a Nafion dryer in conjunction with a CRDSanalyzer. We find that the permeation of CO2 and CH4 through the Nafion membranein both dry-air and wet-air experiments, relative to a −95 ◦C cryotrap, is within the pre-cision of the analyzer measurements, 0.05 ppm CO2 and less than 0.1 ppb CH4. When5
comparing approaches for dealing with water in CRDS analysis, we estimate that theexpected precision in the CO2 and CH4 measurements at 2 % ambient H2O utilizingthe Nafion dryer with a universal water vapor correction is comparable to not drying thesample air and characterizing an instrument-specific water vapor correction (Table 2).Although, it should be noted that it is not really known statistically what the differences10
are in water vapor correction coefficients among different analyzers. At least part of therange in coefficients reported by different laboratories could be the result of experimen-tal artifacts and may not reflect actual response differences among analyzers. Moretesting is needed to determine the uncertainty in the water vapor correction acrossmany analyzers.15
The fact that both sample air and reference gases pass through the Nafion beforethe analyzer makes any drying bias due to permeation through the Nafion even smallerin routine operation, i.e. the bias will cancel out after applying the CO2 and CH4 cali-brations to the sample air based on reference gas analysis. Also, because the Nafiondryer has a slow response time for H2O, it will humidify dry tank air such that the refer-20
ence gases will have a similar humidity to the sample air when they enter the analyzer,and uncertainty in the water vapor correction will further cancel out (Richardson et al.,2012).
The Nafion dyer system was quite effective at removing water vapor from the ambientair sampled from the SIO pier. For example, the Nafion reduced the mean H2O in the25
ambient air during April 2012 to 0.11 % on average. This inlet system is entirely self-sustaining and required no intervention over the nine months it was in operation. Wealso find that the performance of the system is not subject to problems from degradation
of the Nafion, at least over a 9-month time frame. The time to achieve stable gasreadings after switching from ambient gas to sample gas is on order of 10 min.
The setup eliminates the need for establishing the H2O correction on each analyzerand monitoring its stability over time. It also reduces post-processing of the data. Thismethod more fully capitalizes on the ability of the CRDS to provide high quality mea-5
surements with reduced calibration activities, and thereby saving labor costs for de-ployments involving an extensive network of analyzers such as that planned by EarthNetworks.
Appendix A
Water vapor correction10
The water vapor correction from Chen et al. (2010), as recommended by Rella (2010),is summarized in Eqs. (A1) and (A2).
(CO2)wet
(CO2)dry= 1+aHrep +bH2
rep (A1)
(CH4)wet
(CH4)dry= 1+cHrep +dH2
rep (A2)15
where Hrep is the reported H2O mixing ratio by the analyzer, (CO2)wet and (CH4)wet arethe measured mixing ratios of the wet gas, (CO2)dry and (CH4)dry are the true dry-gasmixing ratios, a = −0.012000, b = −0.0002674, c = −0.00982, and d = −0.000239.
Supplementary material related to this article is available online at:http://www.atmos-meas-tech-discuss.net/5/5449/2012/20
Acknowledgements. The authors thank Chris Rella and Aaron Van Pelt at Picarro, Inc. fortheir discussions, technical assistance, and constructive comments on this manuscript. EarthNetworks, Inc. funded this work.
References
Bakwin, P., Tans, P., Hurst, D., and Zhao, C.: Measurements of carbon dioxide on very tall5
towers: results of the NOAA/CMDL program, Tellus B, 50, 401–415, 1998.Butler, M. P., Davis, K. J., Denning, A. S., and Kawa, S. R.: Using continental observations in
global atmospheric inversions of CO2: North American carbon sources and sinks, Tellus B,62, 550–572, doi:10.1111/j.1600-0889.2010.00501.x, 2010.
Chen, H., Winderlich, J., Gerbig, C., Hoefer, A., Rella, C. W., Crosson, E. R., Van Pelt, A. D.,10
Steinbach, J., Kolle, O., Beck, V., Daube, B. C., Gottlieb, E. W., Chow, V. Y., Santoni, G. W.,and Wofsy, S. C.: High-accuracy continuous airborne measurements of greenhouse gases(CO2 and CH4) using the cavity ring-down spectroscopy (CRDS) technique, Atmos. Meas.Tech., 3, 375–386, doi:10.5194/amt-3-375-2010, 2010.
Crosson, E. R.: A cavity ring-down analyzer for measuring atmospheric levels of methane,15
carbon dioxide, and water vapor, Appl. Phys. B, 92, 403–408, doi:10.1007/s00340-008-3135-y, 2008.
Gurney, K., Law, R., Denning, A., Rayner, P., Baker, D., Bousquet, P., Bruhwiler, L., Chen, Y.,Ciais, P., Fan, S., Fung, I., Gloor, M., Heimann, M., Higuchi, K., John, J., Maki, T., Maksyutov,S., Masarie, K., Peylin, P., Prather, M., Pak, B., Randerson, J., Sarmiento, J., Taguchi, S.,20
Takahashi, T., and Yuen, C.: Towards robust regional estimates of CO2 sources and sinksusing atmospheric transport models, Nature, 415, 626–630, 2002.
Houweling, S., Aben, I., Breon, F.-M., Chevallier, F., Deutscher, N., Engelen, R., Gerbig, C., Grif-fith, D., Hungershoefer, K., Macatangay, R., Marshall, J., Notholt, J., Peters, W., and Serrar,S.: The importance of transport model uncertainties for the estimation of CO2 sources and25
Leckrone, K. J. and Hayes, J. M.: Efficiency and temperature dependence of water removal bymembrane dryers, Anal. Chem., 69, 911–918, doi:10.1021/ac9610220, 1997.
Lin, J. C., Gerbig, C., Wofsy, S. C., Daube, B. C., Matross, D. M., Chow, V. Y., Gottlieb, E.,Andrews, A. E., Pathmathevan, M., and Munger, J. W.: What have we learned from intensiveatmospheric sampling field programmes of CO2?, Tellus B, 58, 331–343, doi:10.1111/j.1600-0889.2006.00202.x, 2006.
Ma, S. and Skou, E.: CO2 permeability in Nafion® EW1100 at elevated temperature, Solid State5
Ionics, 178, 615–619, doi:10.1016/j.ssi.2007.01.030, 2007.NRC: Verifying greenhouse gas emissions: Methods to support international climate agree-
ments, 124 pp., 2010.Rella, C. W.: Accurate greenhouse gas measurements in humid gas streams using the Picarro
G1301 carbon dioxide/methan/water vapor gas analyzer, 1–18, 2010.10
Rella, C. W., Chen, H., Andrews, A. E., Filges, A., Gerbig, C., Hatakka, J., Karion, A., Miles,N. L., Richardson, S. J., Steinbacher, M., Sweeney, C., Wastine, B., and Zellweger, C.: Highaccuracy measurements of dry mole fractions of carbon dioxide and methane in humid air,Atmos. Meas. Tech. Discuss., in review, 2012.
Richardson, S. J., Miles, N. L., Davis, K. J., Crosson, E. R., Rella, C. W., and Andrews, A. E.:15
Field testing of cavity ring-down spectroscopy analyzers measuring carbon dioxide and watervapor, J. Atmos. Ocean. Tech., 29, 397–406, doi:10.1175/JTECH-D-11-00063.1, 2012.
Stephens, B. B., Gurney, K. R., Tans, P. P., Sweeney, C., Peters, W., Bruhwiler, L., Ciais, P.,Ramonet, M., Bousquet, P., Nakazawa, T., Aoki, S., Machida, T., Inoue, G., Vinnichenko, N.,Lloyd, J., Jordan, A., Heimann, M., Shibistova, O., Langenfelds, R. L., Steele, L. P., Francey,20
R. J., and Denning, A. S.: Weak northern and strong tropical land carbon uptake from ver-tical profiles of atmospheric CO2, Science, 316, 1732–1735, doi:10.1126/science.1137004,2007.
Stephens, B. B., Miles, N. L., Richardson, S. J., Watt, A. S., and Davis, K. J.: AtmosphericCO2 monitoring with single-cell NDIR-based analyzers, Atmos. Meas. Tech., 4, 2737–2748,25
doi:10.5194/amt-4-2737-2011, 2011.Winderlich, J., Chen, H., Gerbig, C., Seifert, T., Kolle, O., Lavric, J. V., Kaiser, C., Hofer, A.,
and Heimann, M.: Continuous low-maintenance CO2/CH4/H2O measurements at the ZotinoTall Tower Observatory (ZOTTO) in Central Siberia, Atmos. Meas. Tech., 3, 1113–1128,doi:10.5194/amt-3-1113-2010, 2010.30
WMO: Report of the 15th WMO/IAEA meeting of experts on carbon dioxide, other greenhousegases, and related tracers measurement techniques, Jena, Germany, 7–10 September 2009,GAW Report No. 194, WMO TD No. 1553, 2009.
Quadrature sum of 0.17 1.3 0.06 0.7 0.07 0.7errorse
a 5-min mean from the Picarro G2301 manufacturer specifications sheet. b Based on Rella et al. (2012).c Interpolated from values in Rella (2010). d From this experiment. e The quadrature sum oferrors=
√(a2 +b2 +c2 +d2). This was used assuming that the errors are not correlated and do not act in the same
Fig. 1. The gas-handling design for the Earth Networks greenhouse gas monitoring stations.The “Sample Module” houses the Nafion dryer inlet system. All ambient air and reference gasespass through the Nafion dryer.
Figure 2: Experimental setup for testing the Nafion dryer. Dry tank air is humidified with a 3
bubbler. The Nafion and cryotrap portions are continuously flowing and the CRDS 4
changeover valve allows the CRDS analyzer to alternately monitor each of the treatments. 5
The second cyrotrap downstream of the CRDS changeover valve was added in some 6
experiments to remove the residual water exiting the Nafion and eliminate the need to apply 7
any water vapor correction. In the dry-air experiments the cyrotraps were left at room 8
temperature. 9
10
Fig. 2. Experimental setup for testing the Nafion dryer. Dry tank air is humidified with a bubbler.The Nafion and cryotrap portions are continuously flowing and the CRDS changeover valveallows the CRDS analyzer to alternately monitor each of the treatments. The second cyrotrapdownstream of the CRDS changeover valve was added in some experiments to remove theresidual water exiting the Nafion and eliminate the need to apply any water vapor correction. Inthe dry-air experiments the cyrotraps were left at room temperature.
Figure 3: Wet air Exp. 3.1a on 2 Aug 2011. The cryotrap treatment is shown in black and the 3
Nafion treatment is in grey for (a) H2O, (b) CO2, (c) CH4. The first 30 minutes of data were 4
excluded for each treatment. The straight lines are mean values for the cryotrap (black 5
dashed) and Nafion (solid grey) over the entire experiment. The cryotraps plugged up with 6
ice, ending the experiment after approximately 11 hours. The secondary cryotrap was used in 7
this experiment, so no water vapor correction was applied. 8
Fig. 3. Wet-air Exp. 3.1a on 2 August 2011. The cryotrap treatment is shown in black and theNafion treatment is in grey for (a) H2O, (b) CO2, (c) CH4. The first 30 min of data were excludedfor each treatment. The straight lines are mean values for the cryotrap (black dashed) andNafion (solid grey) over the entire experiment. The cryotraps plugged up with ice, ending theexperiment after approximately 11 h. The secondary cryotrap was used in this experiment, sono water vapor correction was applied.
Figure 4: Grey lines are the 1-min averages of the first reference tank switched to after 2
ambient air during the daily reference tank checks for (a) CO2 and (b) CH4. This tank was 3
sampled for 1 hour. The 5-min ensemble averages over every daily tank run are shown in 4
black, plotted at the end-point, along with 1-standard deviation error bars. This data was 5
collected during the month of April 2012. The Nafion wets the dry reference gas to similar 6
levels during ambient monitoring. On average, the water level started at 0.12% and dropped 7
to 0.08% by the end of this hour. It shows that after switching from wet ambient air to a dry 8
reference tank, the CO2 and CH4 values stabilize by 10 minutes. 9
Fig. 4. Grey lines are the 1-min averages of the first reference tank switched to after ambientair during the daily reference tank checks for (a) CO2 and (b) CH4. This tank was sampledfor 1 h. The 5-min ensemble averages over every daily tank run are shown in black, plotted atthe end-point, along with 1-standard deviation error bars. This data was collected during themonth of April 2012. The Nafion wets the dry reference gas to similar levels during ambientmonitoring. On average, the water level started at 0.12 % and dropped to 0.08 % by the end ofthis hour. It shows that after switching from wet ambient air to a dry reference tank, the CO2and CH4 values stabilize by 10 min.