46
North American Steel Trade Committee Laredo, Texas November 2007 NAFTA Steel Industry ‘Pulse’
| Date post: | 01-Jan-2016 |
| Category: |
Documents |
| Upload: | lucius-lancaster |
| View: | 37 times |
| Download: | 1 times |

North American Steel Trade Committee
Laredo, Texas
November 2007
NAFTA Steel Industry ‘Pulse’
2
Outline• Preamble
• Industry Developments
• Market & Trade Trends
• Intra-NAFTA Policy Issues
• Feature Topic: Trade and Manufacturing
• Key Policy Imperatives

3
Preamble

4
Putting Recent Performance In Context
• Earning the Cost of Capital Over Economic Cycles:– Over the past 25 years, the U.S. and Canadian industries’ after tax
returns have averaged 0.95% and 1.6%, respectively
• Volatility: – From 1950-2006, the coefficient of volatility for the U.S. steel
industry has been 266.7%, vs. 27.6% for all manufacturing
• Competitiveness:– Consolidation / restructuring– Operational efficiencies / technology– Cost structure dynamics– Location

5
No Immunity
• Conditions Leading to Past Crises Are Still in Place:– World Overcapacity
– Governmental Ownership / Interventions
– Non-Market Behaviour
– Special Case of China (and India)
• No Immunity From Longstanding and Ongoing Threats

6
Proper Role of Governments
• Defending The Free Market From Abuse:– Eliminating market interventions and distortions by all governments
– Enforcing compliance with trade agreements and competition law
– Maintaining and enforcing trade remedy laws
– Assisting trading partners with understanding / adopting best practices
• Recognizing And Fostering The Steel Industry’s Contribution To National Goals:– Economic Security
– National Security
– Staple of a Strong Manufacturing Sector
7
Industry Developments
8
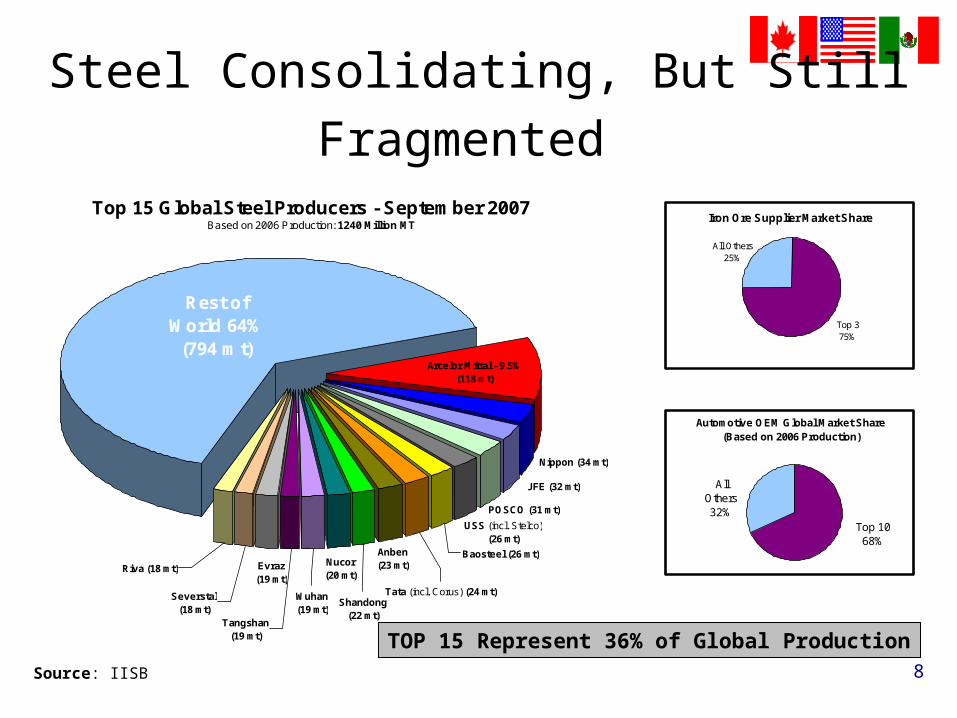
Steel Consolidating, But Still Fragmented
Top 15 Global Steel Producers - September 2007Based on 2006 Production: 1240 Million MT
Baosteel (26 mt)
Tata (incl. Corus) (24 mt)
USS (incl. Stelco) (26 mt)
POSCO (31 mt)
JFE (32 mt)
Anben (23 mt)
Shandong (22 mt)
Nucor (20 mt)
Wuhan (19 mt)
Tangshan (19 mt)
Evraz (19 mt)
Riva (18 mt)
Severstal (18 mt)
Nippon (34 mt)
Rest of World 64%
(794 mt)Arcelor Mittal - 9.5%
(118 mt)
Automotive OEM Global Market Share(Based on 2006 Production)
Top 1068%
All Others32%
Iron Ore Supplier Market Share
Top 375%
All Others25%
TOP 15 Represent 36% of Global Production
Source: IISB

9
Consolidation: China The Exception
Source: IISI *2006 Production in Million MT
Regional Top 5 Producer Market Share
% of T
otal P
rodu
ction
# of Facilities
10m+ 33 9
5-10m 19 12
2-5m 23 32
<2m 25 N/a
Total 100 N/a
2006 Chinese Steel Production By Facility Size
(in Million MT)
Source: CISA
ROW: Market-Driven China
67%
Total US / Canada 114 *
58%
Total Europe 173
47%
Total CIS 119
77%
Total Japan 116
23%
Total China 419
65%
Total Others Asia 113Total Latin America 63
72%

10
China: World’s No. 1 Is Government Directed
Privately OwnedGovernment Owned or
Controlled
191 million tonnes
19 million tonnes
Source: Money for Metal (2007)
Top 20 Chinese Steel Producers:Government Control Vs. Private Ownership
Top 20 Capacity: 210 Million Tons
-
100,000
200,000
300,000
400,000
500,000
600,000
China Asia other thanChina
European Union(25)
North America C.I.S. (6) South America Other Europe Africa Middle East Oceania
Metr
ic t
on
s p
rod
uced
(in
'000s)
Source: World crude production through 9/07 annualized; IISI
2007 Projected Global Production
Australian Government Predicting China Will Reach 1B Tons by 2015
91%
11
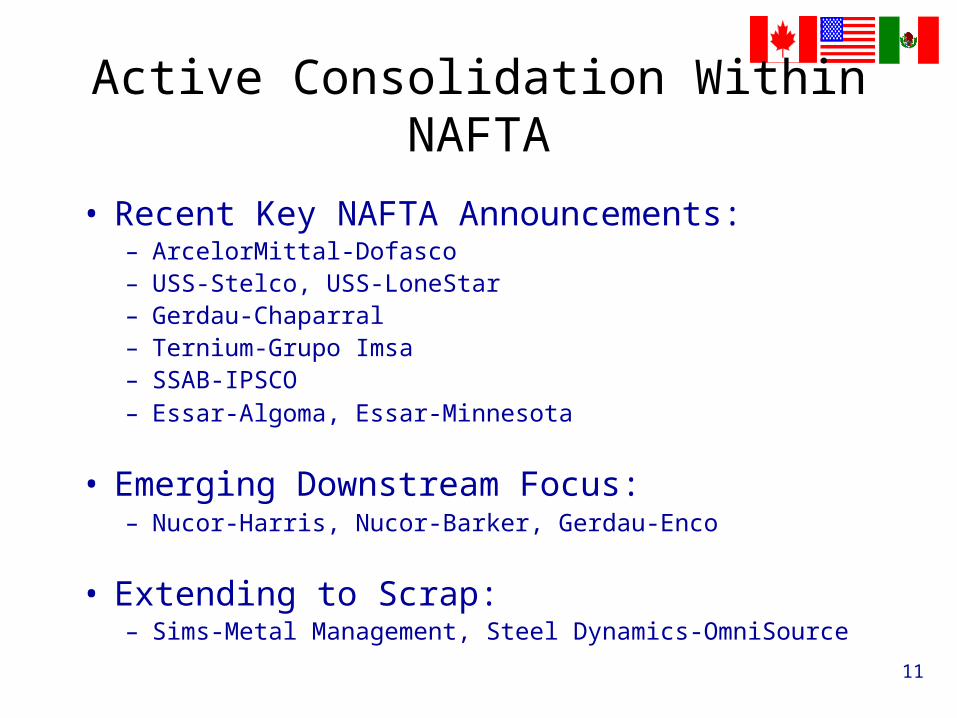
Active Consolidation Within NAFTA
• Recent Key NAFTA Announcements:– ArcelorMittal-Dofasco– USS-Stelco, USS-LoneStar– Gerdau-Chaparral– Ternium-Grupo Imsa– SSAB-IPSCO– Essar-Algoma, Essar-Minnesota
• Emerging Downstream Focus:– Nucor-Harris, Nucor-Barker, Gerdau-Enco
• Extending to Scrap:– Sims-Metal Management, Steel Dynamics-OmniSource
12
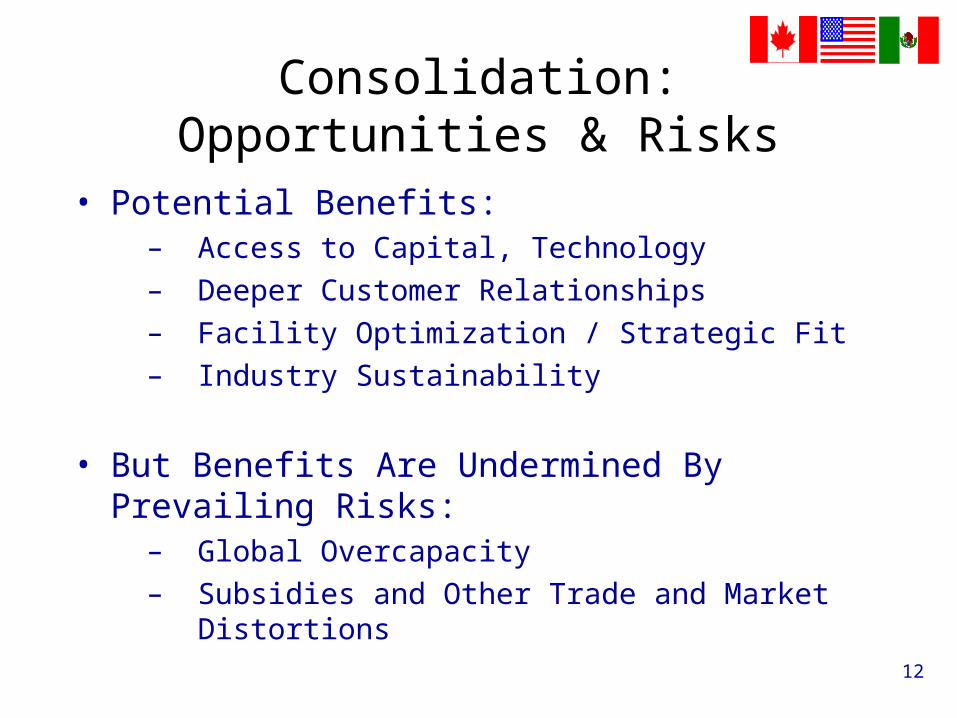
Consolidation: Opportunities & Risks
• Potential Benefits:– Access to Capital, Technology
– Deeper Customer Relationships
– Facility Optimization / Strategic Fit
– Industry Sustainability
• But Benefits Are Undermined By Prevailing Risks:– Global Overcapacity
– Subsidies and Other Trade and Market Distortions

13
New Capacity Outpaces Consumption Growth
Capacity – Multiple Sources; Nucor Analysis
Demand – IISI projections thru ’08; 6% increase “09 – ‘10
EU-251%
India23%
NAFTA2%Other Asia
15%
Other Europe3%
CIS6%
Africa & Middle East5%
Central & South America
12%
China33%
Announced Steel Capacity Increases By Region
(2006 – 2012)
Announced Steel Capacity Vs. Projected Consumption 2007 – 2010
(Million Metric Tonnes)
Compound Annual Growth Rates:Capacity: 6.83% Demand: 4.65%
14
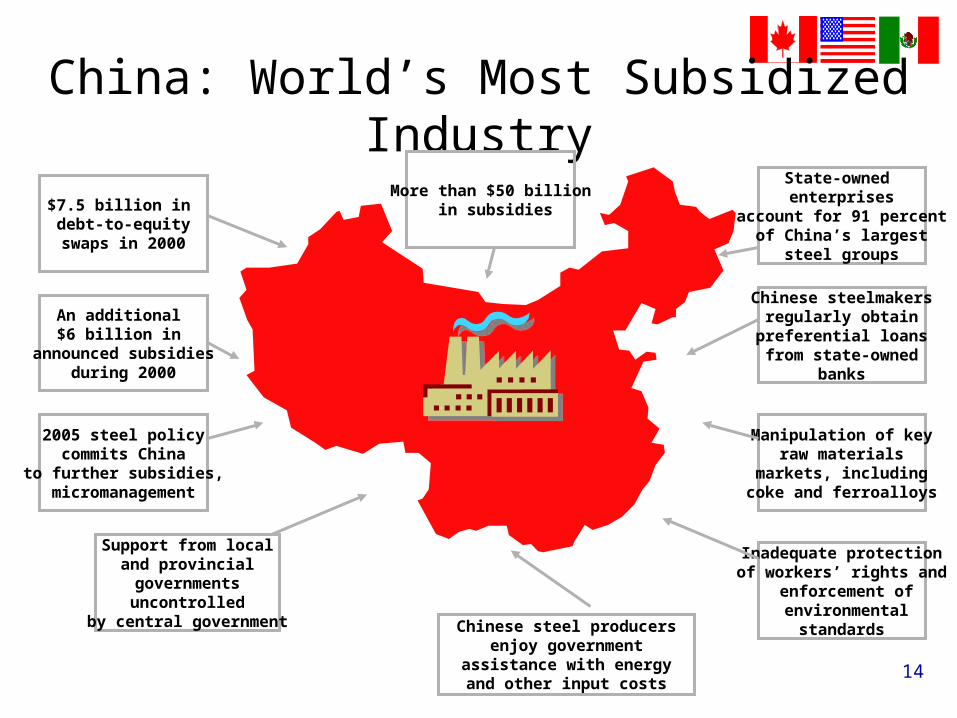
China: World’s Most Subsidized Industry
More than $50 billion in subsidies$7.5 billion in
debt-to-equityswaps in 2000
An additional $6 billion in
announced subsidiesduring 2000
2005 steel policycommits China
to further subsidies,micromanagement
Support from localand provincialgovernmentsuncontrolled
by central government Chinese steel producersenjoy government
assistance with energyand other input costs
Inadequate protectionof workers’ rights and
enforcement of environmental
standards
Manipulation of keyraw materials
markets, includingcoke and ferroalloys
Chinese steelmakersregularly obtain
preferential loansfrom state-owned
banks
State-owned enterprises
account for 91 percentof China’s largest
steel groups

15
Raw Materials: Governments Still Intervening
• Governments (e.g., China, India) Continue to Intervene in Key Raw Materials Markets For Steel:– Iron Ore– Coke– Ferroalloys– Refractory Materials
• Export Tax Manipulations / Restrictions
• Distortions Created; NAFTA Competitiveness Negatively Impacted

16
Consolidation: Key Takeaways
• Consolidation is Creating a Stronger Global Industry– NAFTA companies now competing for capital on a global basis– China, the dominant producer, not participating in the trend
• Level Playing Field Necessary to Ensure NAFTA Benefits from Market-Driven Consolidation– Continued overcapacity threat, led by China– Subsidies & government interventions driving export growth and
potential for continued trade distortions
• Successful Consolidation Outcomes Require:– Working to address effectively “root causes” of trade distortions– Ensuring NAFTA trade remedies are fair, accessible, enforceable and
able to respond effectively to market distortions as they occur

17
Market & Trade Trends

18
Global Growth, But Non-NAFTA
Global Crude Steel Production
2006 vs. 2007
Cou
ntry /
Region
2006 P
rodu
ction
2007* P
rodu
ction
% C
han
ge
NAFTA 132 132 -
EU 25 198 211 +6.6
CIS 120 124 +3.3
S. Amer. 45 47 +4.4
China 421 483 +14.7
Japan 116 119 +2.6
Other Asia 136 119 -12.5
World 1248 1308 +4.8Source: IISI *2007 Data Annualized From 9 Months
19
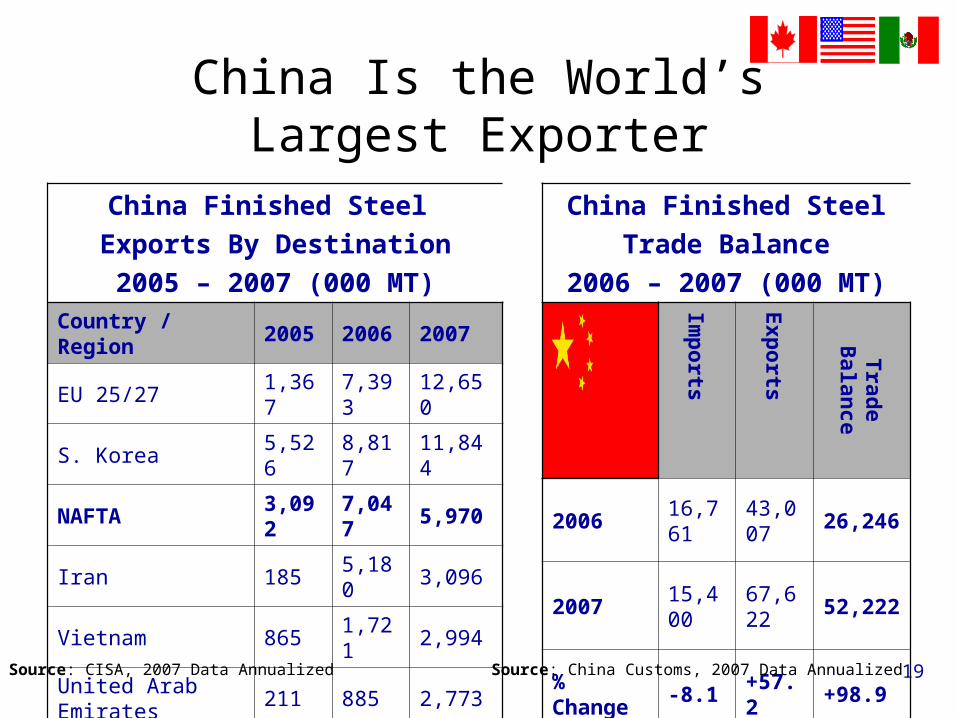
China Is the World’s Largest Exporter
China Finished Steel
Exports By Destination
2005 – 2007 (000 MT)Country / Region 2005 2006 2007
EU 25/27 1,367 7,393 12,650
S. Korea 5,526 8,817 11,844
NAFTA 3,092 7,047 5,970
Iran 185 5,180 3,096
Vietnam 865 1,721 2,994
United Arab Emirates 211 885 2,773
India 417 1,574 2,447
Others 8,861 15,052 25,848
TOTAL 20,524 43,007 67,622Source: CISA, 2007 Data Annualized
China Finished Steel
Trade Balance
2006 – 2007 (000 MT)Im
ports
Exp
orts
Trad
e B
alance
2006 16,761 43,007 26,246
2007 15,400 67,622 52,222
% Change -8.1 +57.2 +98.9
Source: China Customs, 2007 Data Annualized

20
World Market And Trade Flows Are Dynamic
• NAFTA Faces a Potential Significant Import Surge Risk
• Concerns about the Combined Effects of:– Unrelenting Chinese Export Expansion– Effect of Other Nations (e.g., EU) Taking Actions Against China
• No Immunity for the NAFTA Market Despite Industry Consolidation and Enhanced Competitiveness
• Need for NAFTA Governments to Counter Adverse Spillover Effects from Chinese Non-Market Behaviour

21
NAFTA Apparent Steel Demand Fell in 2007
1995 1996 1997 1998 1999 2000 2001 2002 2003 2004 2005 2006 20070
20
40
60
80
100
120
140
160
180
12%12%
15% 22% 17%18%
16% 16% 12%
17%
17%
21%17%
Domestic Shipments Imports
Mill metric tonnes
Sources: AISI, Statistics Canada, Canacero
22
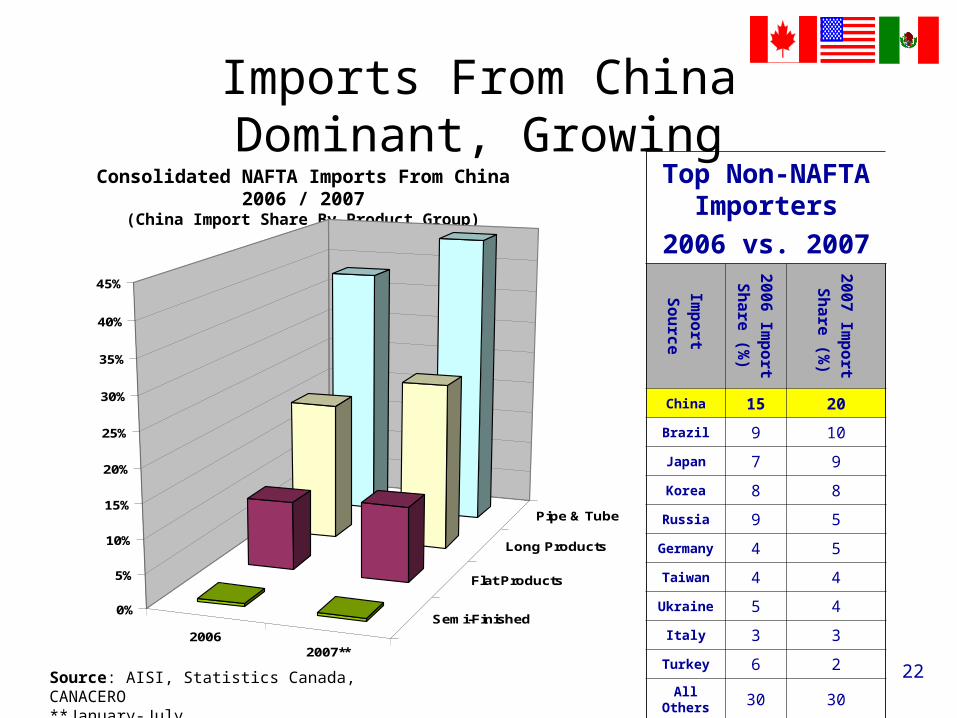
Imports From China Dominant, GrowingTop Non-NAFTA
Importers
2006 vs. 2007Im
port
Sou
rce
2006 Im
port
Sh
are (%)
2007 Im
port
Sh
are (%)
China 15 20
Brazil 9 10
Japan 7 9
Korea 8 8
Russia 9 5
Germany 4 5
Taiwan 4 4
Ukraine 5 4
Italy 3 3
Turkey 6 2
All Others 30 30
Consolidated NAFTA Imports From China 2006 / 2007(China Import Share By Product Group)
Source: AISI, Statistics Canada, CANACERO**January-July
20062007**
Semi-Finished
Flat Products
Long Products
Pipe & Tube
0%
5%
10%
15%
20%
25%
30%
35%
40%
45%
23
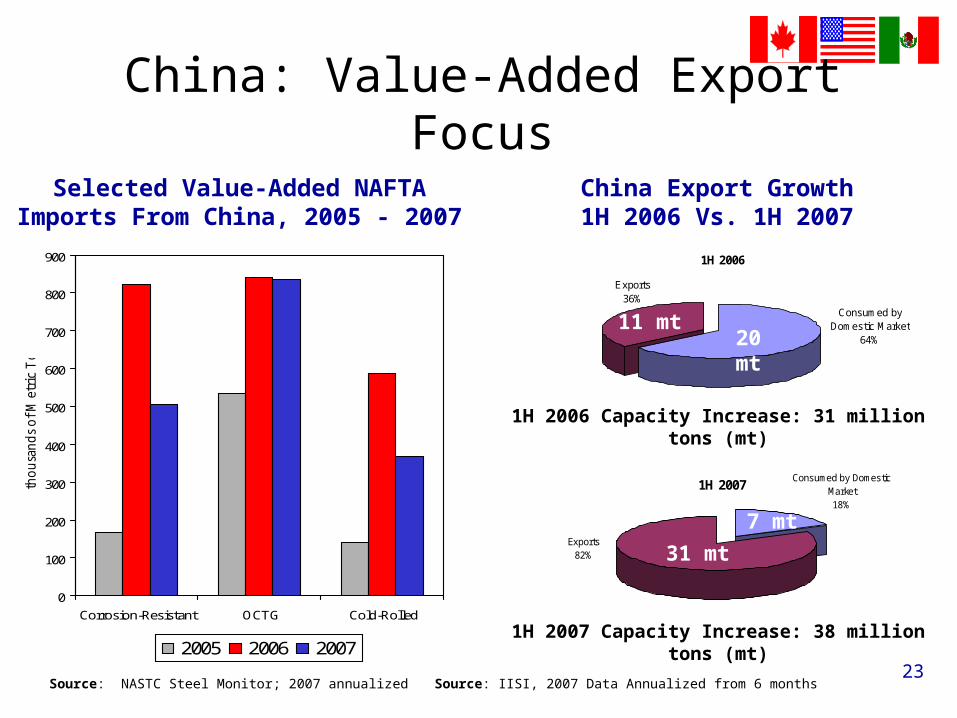
China: Value-Added Export Focus
1H 2006
Exports36%
Consumed by Domestic Market
64%
1H 2007
Exports82%
Consumed by Domestic Market18%
1H 2006 Capacity Increase: 31 million tons (mt)
1H 2007 Capacity Increase: 38 million tons (mt)
Source: IISI, 2007 Data Annualized from 6 months
0
100
200
300
400
500
600
700
800
900
Corrosion-Resistant OCTG Cold-Rolled
tho
usa
nd
s o
f M
etri
c T
on
s
2005 2006 2007
Source: NASTC Steel Monitor; 2007 annualized
11 mt20 mt
31 mt
7 mt
Selected Value-Added NAFTA Imports From China, 2005 - 2007
China Export Growth1H 2006 Vs. 1H 2007
24
China: Unfulfilled Commitments
“All the measures taken by the Chinese governments to curb exports have been without effect so far…If China wishes to avoid long-running trade conflicts, the rules of the market have to be obeyed.”
-Ekkehard D. Schulz, Chairman, ThyssenKrupp AG
September 30, 2007

25
China Central To Current NAFTA CasesKey NAFTA Steel Trade Cases (Ch. 72 & Ch. 73)
May–November 2007
Country New Cases Current Sunsets
Canada Seamless OCTG Plate
United States
Pipe x 2
Nails
Wire Hangers
Hot-Rolled*
Mexico
Plate
Seamless OCTG
Nails
Wire Hangers
Wire Mesh
*Finding renewed against China on October 10, 2007
26
Intra-NAFTA Policy Issues
27
Steel Remains a Strategic NAFTA Sector
• Recent Developments (August 2007):– Montebello SPP Leaders Summit– NAFTA Commission / Trade Ministers Meeting– North American Competitiveness Council
(NACC) Report
28
Context: NAFTA Economic Uncertainties
• Economic Concerns in All NAFTA Countries– U.S. Weakening– Mexico: Tracking U.S. Performance– Canada: Uneven Performance, Slowing Growth,
Currency Appreciation ($CDN > $USD)
• Rising Input Costs and Uncertainties (e.g., Energy)
• Potential Negative Impacts on Both Steel Producers and Customers
29
Effective Trade Policies Remain Essential
• WTO: NAFTA Governments’ Coordination– Subsidies Case– Rules Negotiations
• Expanding Focus from Doha to Bilaterals– US: Korea, Columbia, Peru, Panama– Canada: Korea, Columbia/Peru, EFTA– Mexico: Korea, Peru
• Key Industry Priorities on FTAs:– Remedies– Steel Customer Impacts / Incentives for Value-Added in North America
• NAFTA Policy Coordination– AD/CVD Applicability to NMEs– Need to Adopt Best Practices / Highest Level of Enforcement
30
Climate Change: Trade Impacts
• Emerging Legislative & Regulatory Issues in NAFTA:– U.S.: Congress Debating Cap & Trade, Border Adjustability– Canada: New Plan – Technical & Compliance Issues– Mexico: Government Open to Discussion of IISI / Sectoral Model
• The Pressure For Stringent Regulation Could Have Significant Trade Consequences– “Decoupling” / Production Loss and Migration– Increased Import Penetration– “Next Generation” Trade Policy: “Green Content”
• Bottom Line: Need to Avoid Creating Trade Distortions or Reducing NAFTA Competitiveness

31
Feature Topic: Trade and Manufacturing
32
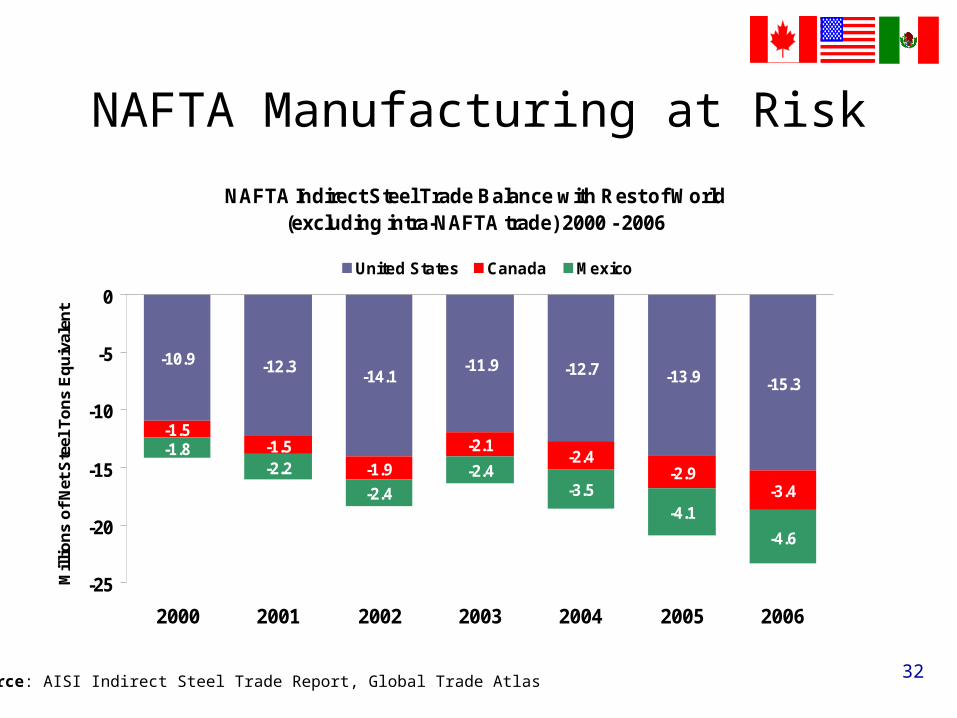
NAFTA Manufacturing at Risk
Source: AISI Indirect Steel Trade Report, Global Trade Atlas
NAFTA Indirect Steel Trade Balance with Rest of World(excluding intra-NAFTA trade) 2000 - 2006
-10.9 -12.3-14.1
-11.9 -12.7 -13.9 -15.3
-1.5-1.5
-1.9
-2.1-2.4
-2.9-3.4
-1.8-2.2
-2.4-2.4
-3.5-4.1
-4.6
-25
-20
-15
-10
-5
0
2000 2001 2002 2003 2004 2005 2006
Mil
lio
ns
of
Net
Ste
el T
on
s E
qu
ival
ent
United States Canada Mexico
33
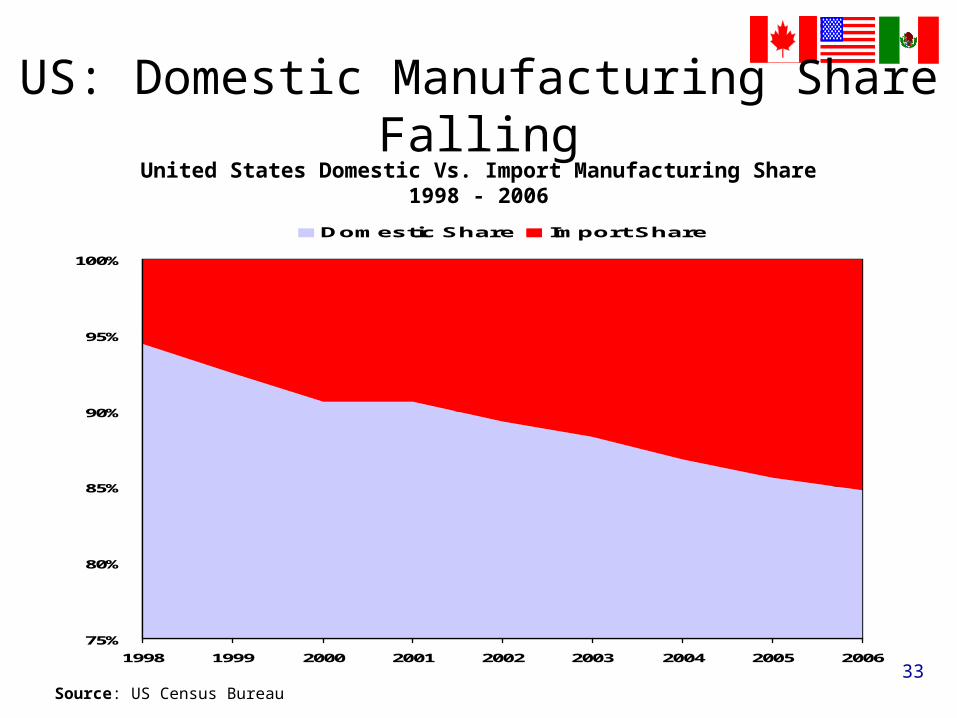
US: Domestic Manufacturing Share Falling
75%
80%
85%
90%
95%
100%
1998 1999 2000 2001 2002 2003 2004 2005 2006
Domestic Share Import Share
Source: US Census Bureau
United States Domestic Vs. Import Manufacturing Share1998 - 2006

34
US: 3m Jobs Lost; Trade Deficits GrowingU.S. Manufacturing Jobs vs. Trade Deficit
2000 - 2007
14,000
14,500
15,000
15,500
16,000
16,500
17,000
17,500
Ma
r-0
0
Sep
-00
Ma
r-0
1
Sep
-01
Ma
r-0
2
Sep
-02
Ma
r-0
3
Sep
-03
Ma
r-0
4
Sep
-04
Ma
r-0
5
Sep
-05
Ma
r-0
6
Sep
-06
Ma
r-0
7
U.S
. E
mp
loy
ees
in M
an
ufa
ctu
rin
g (
00
0's
)
250
350
450
550
650
750
850
950
U.S
. T
ra
de D
efi
cit
in
Bil
lio
ns
of
Do
lla
rs
(Ov
er P
rev
iou
s 4
Qu
arte
rs)
Manufacturing Jobs Trade Deficit
Sources: US Census Bureau (trade data), US Labor Dept. (employment data)
*Dr. Peter Morici, former Chief Economist of ITC (estimate of lost mfg. jobs due to China trade)
Estimated 1m Jobs Lost Due to
China Trade*
Trade Deficit: +123% Since 2000

35
US: China Drives Indirect Steel Trade Deficit
United States Indirect Steel Trade Balance with China2000 - 2006
-3.2
-3.2 -3.7
-4.6
-5.5
-2.1 -2.5
-6
-5
-4
-3
-2
-1
0
2000 2001 2002 2003 2004 2005 2006
Mill
ion
s o
f Net
ton
s E
qu
ival
ent
Source: AISI Indirect Steel Trade Report
36
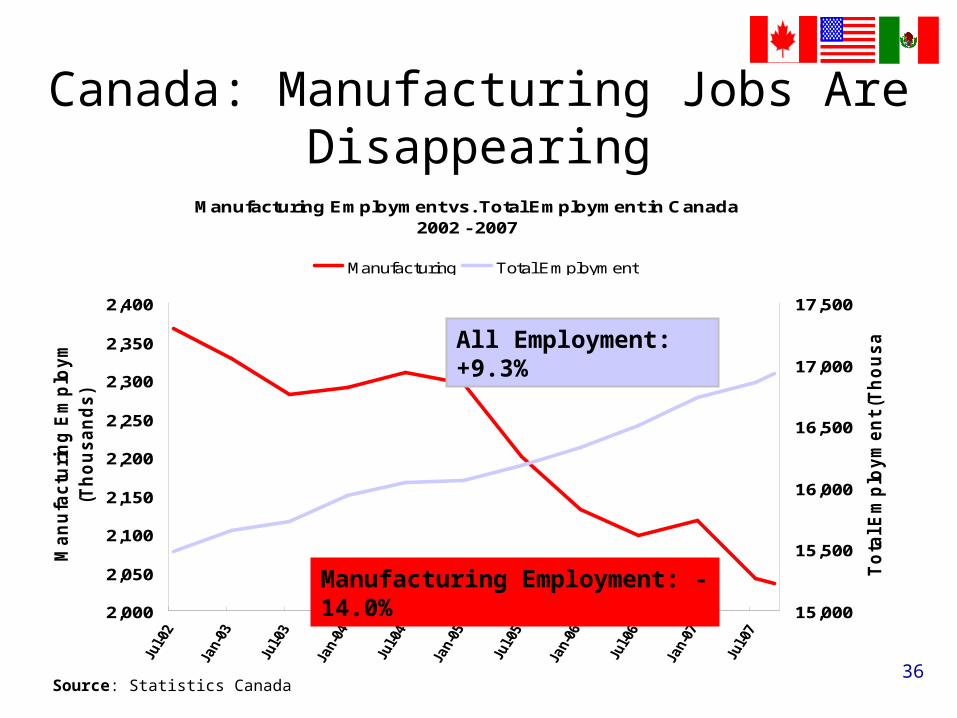
Canada: Manufacturing Jobs Are Disappearing
Manufacturing Employment vs. Total Employment in Canada 2002 - 2007
2,000
2,050
2,100
2,150
2,200
2,250
2,300
2,350
2,400
Ma
nu
fac
turi
ng
Em
plo
ym
en
t
(Th
ou
sa
nd
s)
15,000
15,500
16,000
16,500
17,000
17,500
To
tal E
mp
loy
me
nt
(Th
ou
sa
nd
s)
Manufacturing Total Employment
All Employment: +9.3%
Manufacturing Employment: -14.0%
Source: Statistics Canada

37
Canada's Steel and Steel-Containing Goods^ Trade Balance 1997-2007
-$30
-$25
-$20
-$15
-$10
-$5
$0
$5
1997 1998 1999 2000 2001 2002 2003 2004 2005 2006 2007*
Va
lue
(B
illio
ns
of
CD
N$
)
China All Countries (incl. China)
Canada: Steel-Related Trade Deficit Persists
^Steel-containing goods includes all HS Sections for Base Metals and articles of Base Metals (Sec. XV), Machinery, Appliances and Equipment (Sec. XVI), and Vehicles, Aircraft, Vessels and Transportation Equipment (Sec. XVII).
Canada’s Projected 2007 Deficit With China Represents 71% of the Total
Source: Statistics Canada*2007 Data Annualized from January-July Actuals

38
Canada: China Growing Value, Market ShareAPPLIANCES
Source2005 Imports
(CDN$ Millions)
Import
Share(%)
2007 Imports
(CDN$ Millions)
Import
Share (%)
% Value Change
05 / 07
1. United States 1579.7 53.75 1560.9 48.6 -2.2
2. China 605.0 20.59 764.2 23.8 +26.3
3. Mexico 146.6 4.99 226.9 7.1 +54.7
CONSTRUCTION PRODUCTS / FURNISHINGS
Source2005 Imports
(CDN$ Millions)
Import
Share (%)
2007 Imports
(CDN$ Millions)
Import
Share (%)
% Value Change
05 / 07
1. United States 3677.93 65.12 3860.88 61.11 +5.0
2. China 509.04 9.01 776.47 12.29 +52.5
3. Mexico 212.0 3.75 212.78 3.37 +0.03
Source: World Trade Atlas / AISI.
DOMESTIC & COMMERCIAL EQUIPMENT
Source2005 Imports
(CDN$ Millions)
Import
Share (%)
2007 Imports
(CDN$ Millions)
Import
Share (%)
% Value Change
05 / 07
1. United States 1493.3 50.34 1467.1 45.49 -1.8
2. China 619.13 20.87 802.42 24.88 +29.6
3. Mexico 351.68 11.86 377.16 11.69 +7.24

39
Mexico Real Manufacturing GDP & Imports1994 - 2007
RealManufacturingGDP (LHS)
Manufacturing Imports (RHS)
Source: BIE – Mexico’s Economic Statistics Data Bank
40,000
90,000
140,000
190,000
240,000
1Q 1
994
3Q 1
994
1Q 1
995
3Q 1
995
1Q 1
996
3Q 1
996
1Q 1
997
3Q 1
997
1Q 1
998
3Q 1
998
1Q 1
999
3Q 1
999
1Q 2
000
3Q 2
000
1Q 2
001
3Q 2
001
1Q 2
002
3Q 2
002
1Q 2
003
3Q 2
003
1Q 2
004
3Q 2
004
1Q 2
005
3Q 2
005
1Q 2
006
3Q 2
006
1Q 2
007
30,000
50,000
70,000
90,000
110,000
130,000
Mil
lio
n U
SD
Mil
lio
n U
SD
Mil
lio
n
Mil
lio
n
US
DU
SD
Mexico: Imports Gaining Market Share

40
Mexico Real Manufacturing GDP & Employment1994 - 2007
Source: BIE – Mexico’s Economic Statistics Data Bank
Th
ou
san
ds
Th
ou
san
ds
Mil
lio
n U
SD
Mil
lio
n U
SD
Real ManufacturingGDP
ManufacturingEmployment
3,650
3,850
4,050
4,250
4,450
4,650
4,850
5,050
5,250
1Q 1
994
3Q 1
994
1Q 1
995
3Q 1
995
1Q 1
996
3Q 1
996
1Q 1
997
3Q 1
997
1Q 1
998
3Q 1
998
1Q 1
999
3Q 1
999
1Q 2
000
3Q 2
000
1Q 2
001
3Q 2
001
1Q 2
002
3Q 2
002
1Q 2
003
3Q 2
003
1Q 2
004
3Q 2
004
1Q 2
005
3Q 2
005
1Q 2
006
3Q 2
006
1Q 2
007
30,000
55,000
80,000
105,000
130,000
155,000
180,000
205,000
230,000
255,000
Mexico: Significant Employment Loss
41
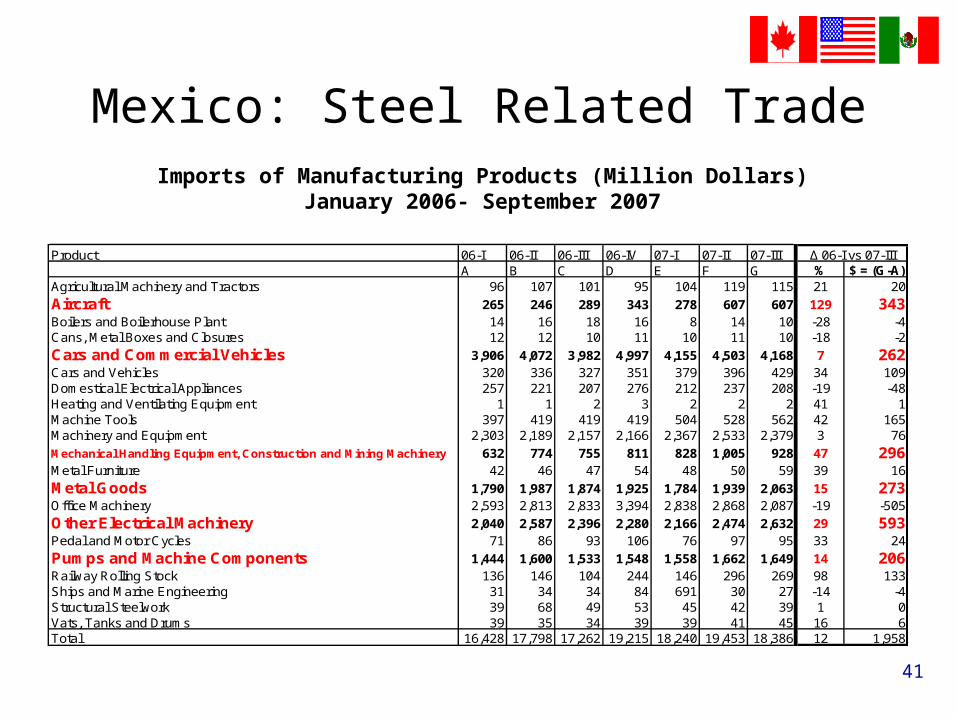
Imports of Manufacturing Products (Million Dollars)January 2006- September 2007
Product 06-I 06-II 06-III 06-IV 07-I 07-II 07-IIIA B C D E F G % $ = (G-A)
Agricultural Machinery and Tractors 96 107 101 95 104 119 115 21 20
Aircraft 265 246 289 343 278 607 607 129 343Boilers and Boilerhouse Plant 14 16 18 16 8 14 10 -28 -4Cans, Metal Boxes and Closures 12 12 10 11 10 11 10 -18 -2
Cars and Commercial Vehicles 3,906 4,072 3,982 4,997 4,155 4,503 4,168 7 262Cars and Vehicles 320 336 327 351 379 396 429 34 109Domestical Electrical Appliances 257 221 207 276 212 237 208 -19 -48Heating and Ventilating Equipment 1 1 2 3 2 2 2 41 1Machine Tools 397 419 419 419 504 528 562 42 165Machinery and Equipment 2,303 2,189 2,157 2,166 2,367 2,533 2,379 3 76
Mechanical Handling Equipment, Construction and Mining Machinery 632 774 755 811 828 1,005 928 47 296Metal Furniture 42 46 47 54 48 50 59 39 16
Metal Goods 1,790 1,987 1,874 1,925 1,784 1,939 2,063 15 273Office Machinery 2,593 2,813 2,833 3,394 2,838 2,868 2,087 -19 -505
Other Electrical Machinery 2,040 2,587 2,396 2,280 2,166 2,474 2,632 29 593Pedal and Motor Cycles 71 86 93 106 76 97 95 33 24
Pumps and Machine Components 1,444 1,600 1,533 1,548 1,558 1,662 1,649 14 206Railway Rolling Stock 136 146 104 244 146 296 269 98 133Ships and Marine Engineering 31 34 34 84 691 30 27 -14 -4Structural Steelwork 39 68 49 53 45 42 39 1 0Vats, Tanks and Drums 39 35 34 39 39 41 45 16 6Total 16,428 17,798 17,262 19,215 18,240 19,453 18,386 12 1,958
∆ 06-I vs 07-III
Mexico: Steel Related Trade
42
Trade And Manufacturing: Initial Conclusions
• Manufacturing Remains Critical to NAFTA Economies– Significant source of wealth creation and innovation
• Factory Employment is Down, While Imports of Key Steel-Containing Products Are Up– Trade imbalances are having an effect– Manufacturing jobs transforming into service jobs?
• Persistent Imbalances Have Wider Supply Chain Ramifications – Diminishing customer base is a top concern for NAFTA steel producers
• NAFTA Manufacturing Policies Must Include A Strong Trade Component

43
Overall Conclusions –NAFTA Policy Implications

44
Strategic Government Actions Required:
• Ensure Rules-Based Trade For Manufacturing Industries
• Achieve Highest Level Of AD/CVD Practice & Enforcement
• Prevent Market Distortions Before They Impact The NAFTA Region
• Strengthen Intra-NAFTA Trade Facilitation
45
Immediate Focus:
• Treat China As NME In AD Cases, And Fully Apply CVD Law To NMEs
• Promote NAFTA Manufacturing In FTAs
• Enhance Government Information-Sharing Across Jurisdictions On Trade Remedy Practice And Experience
46
With Sustained Emphasis On:
• Joint Efforts To Challenge China’s Subsidies, Currency Manipulation and Other Distortions – WTO / Multilateral – Not allowing China to impose a non-market model on
the WTO– Political / Diplomatic / Economic – Recognition of China’s growing
alliances with Latin American countries, with both backward linkages (mines, ports, raw materials, energy) and forward linkages (customers)
• NAFTA-Wide Pro-Manufacturing Policies
• Reducing Intra-NAFTA Logistical / Border Costs
• Incorporating Trade Impacts In Any Climate Change Policies


