Liquidity: The degree to which an asset or security can be bought or sold in the market without affecting the asset’s price.
Increased regulatory oversight and requirements have greatly reduced the risk of a financial crisis similar to that experienced in 2008. However, an ancillary result of the new regulations is greatly reduced liquidity in the corporate bond market due in large part to increased capital costs and other regulatory and financial restrictions on banking institutions to hold corporate bond inventory. The result is a changed business model for the banking industry.
Going forward, banks will have a lower risk profile, which has come at the cost of liquidity for investors globally across the risk spectrum in corporate bonds. Reduced liquidity could hamper a manager’s ability to transact at reasonable prices, however, it may also have the effect of potentially increasing market inefficiencies and therefore create attractive investment opportunities. In many cases, forced sellers will receive a price below fair value in exchange for exiting a position quickly. Opportunistic investors can take advantage of these types of situations , which have become more frequent in the post-financial-crisis market. Market participants whose investment approach is predicated on frequent trading strategies to generate more than a marginal amount of performance are likely to be challenged to do so going forward. Alternatively, managers whose investment style is based on taking a long-term approach supported by proven fundamental credit research expertise and the ability to accurately identify relative value opportunities should benefit from the increase in market inefficiency.
Though reduced liquidity across the various credit asset classes can be frustrating at times for all fixed-income managers, Western Asset believes its investment style is well suited to such an environment. In our view, there has never been a time when the credit market offered a more compelling argument for active management. Market inefficiencies and dislocations have created opportunity, which Western Asset’s Credit Team will look to exploit on a regular basis. As a manager within the credit space, Western Asset and our client portfolios have been impacted by the reduced liquidity. However, as a long-term value investor with the ability to employ strategies that offset reduced market liquidity, Western Asset has minimized the effect. In this white paper we address the key drivers of reduced liquidity, its impact on the market, and strategies Western Asset is employing as it seeks to mute the impact in credit portfolios.
Key Drivers of Reduced Liquidity in the Credit Markets
Risk-Weighted Capital Charge The financial crisis of 2008 saw the global banking industry come as close to a total collapse as any
time since The Great Depression. In the aftermath of The Great Depression, government oversight and regulation of the banking system were significantly increased, including the creation of the Securities and Exchange Commission (SEC) and Federal Deposit Insurance Corporation (FDIC) in the US. Similarly, the financial crisis of 2008 ushered in an era of increasing government oversight. A good deal of new
Because of new regulations and f inancial restrictions, banks are carrying lower risk profiles, lowering liquidity for global investors across the cor-porate bonds risk spectrum.
While reduced liquidity may hamper a manager’s ability to transact at reasonable prices, it also has the potential to increase market inefficiencies, creating attractive investment opportunities.
Investors who heavily rely on frequent trading strategies for significant performance gains are likely to be challenged going forward while man-agers who take a long-term approach supported by fun-damental credit research and the ability to identify relative value opportunities should benefit from the increase in market inefficiency.
In our view, there has never been a time when the credit market offered a more com-pelling argument for active management, and we believe our investment style is well suited to such an environment.
We are employing specific strategies in an effort to damp-en the impact of reduced liquidity in credit portfolios.
Executive Summary
Western Asset April 2015
Analyzing Credit Market Liquidity
2
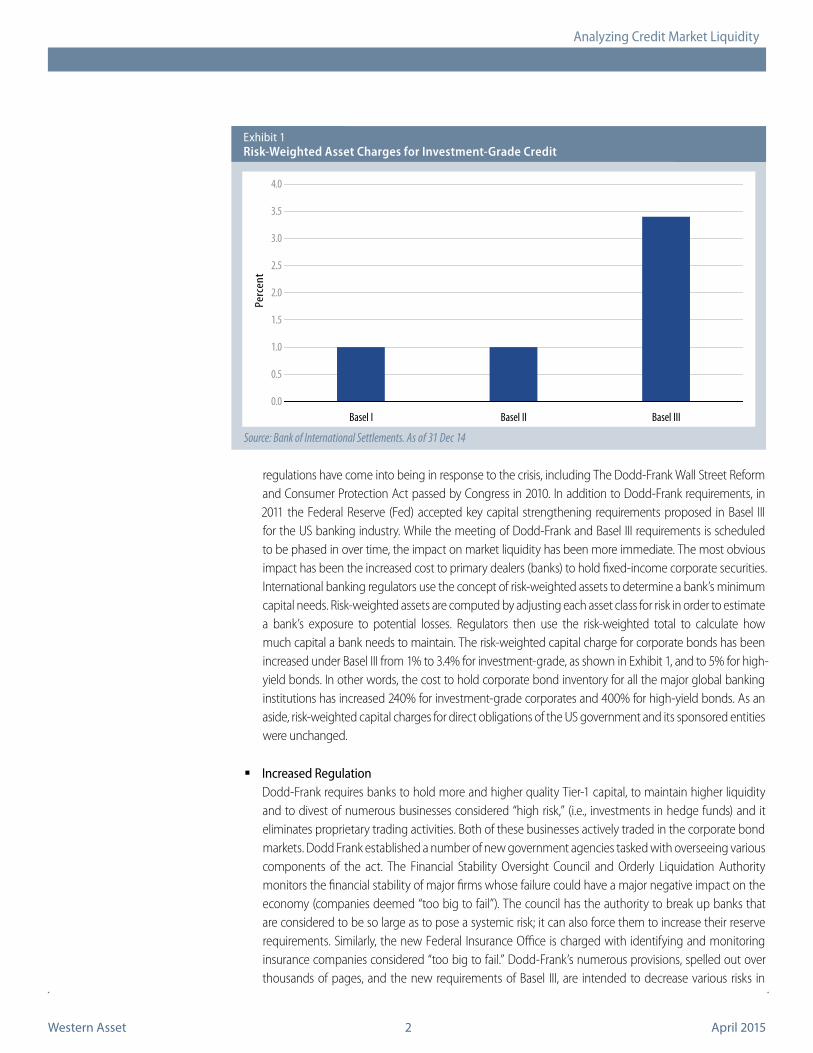
regulations have come into being in response to the crisis, including The Dodd-Frank Wall Street Reform and Consumer Protection Act passed by Congress in 2010. In addition to Dodd-Frank requirements, in 2011 the Federal Reserve (Fed) accepted key capital strengthening requirements proposed in Basel III for the US banking industry. While the meeting of Dodd-Frank and Basel III requirements is scheduled to be phased in over time, the impact on market liquidity has been more immediate. The most obvious impact has been the increased cost to primary dealers (banks) to hold fixed-income corporate securities. International banking regulators use the concept of risk-weighted assets to determine a bank’s minimum capital needs. Risk-weighted assets are computed by adjusting each asset class for risk in order to estimate a bank’s exposure to potential losses. Regulators then use the risk-weighted total to calculate how much capital a bank needs to maintain. The risk-weighted capital charge for corporate bonds has been increased under Basel III from 1% to 3.4% for investment-grade, as shown in Exhibit 1, and to 5% for high-yield bonds. In other words, the cost to hold corporate bond inventory for all the major global banking institutions has increased 240% for investment-grade corporates and 400% for high-yield bonds. As an aside, risk-weighted capital charges for direct obligations of the US government and its sponsored entities were unchanged.
Increased Regulation Dodd-Frank requires banks to hold more and higher quality Tier-1 capital, to maintain higher liquidity
and to divest of numerous businesses considered “high risk,” (i.e., investments in hedge funds) and it eliminates proprietary trading activities. Both of these businesses actively traded in the corporate bond markets. Dodd Frank established a number of new government agencies tasked with overseeing various components of the act. The Financial Stability Oversight Council and Orderly Liquidation Authority monitors the financial stability of major firms whose failure could have a major negative impact on the economy (companies deemed “too big to fail”). The council has the authority to break up banks that are considered to be so large as to pose a systemic risk; it can also force them to increase their reserve requirements. Similarly, the new Federal Insurance Office is charged with identifying and monitoring insurance companies considered “too big to fail.” Dodd-Frank’s numerous provisions, spelled out over thousands of pages, and the new requirements of Basel III, are intended to decrease various risks in
Exhibit 1Risk-Weighted Asset Charges for Investment-Grade Credit
Source: Bank of International Settlements. As of 31 Dec 14
Risk-Weighted Asset Charges for Investment Grade Credit
Perc
ent
0.0
0.5
1.0
1.5
2.0
2.5
3.0
3.5
4.0
Basel I Basel II Basel III
Western Asset April 2015
Analyzing Credit Market Liquidity
3
the US financial system. The financial sector is under more scrutiny, subject to more regulation than it has ever been, and the cost of maintaining inventory in corporate bonds has never been higher. Not surprisingly, therefore, banks have been averse to continuing in their pre-financial crisis role of market-makers in the corporate space at the risk of accumulating large high cost inventory positions.
Liquidity Metrics There are many different ways to analyze liquidity in the fixed-income markets, none of which would provide an observer with enough information from which to draw a definitive conclusion. However, when viewed collectively, an analysis of the results can provide an understanding of current market conditions relative to historical observations. The most commonly used gauges to measure liquidity within the credit market include: 1) dealer inventory levels 2) trading volumes/turnover and 3) bid/offer spreads.
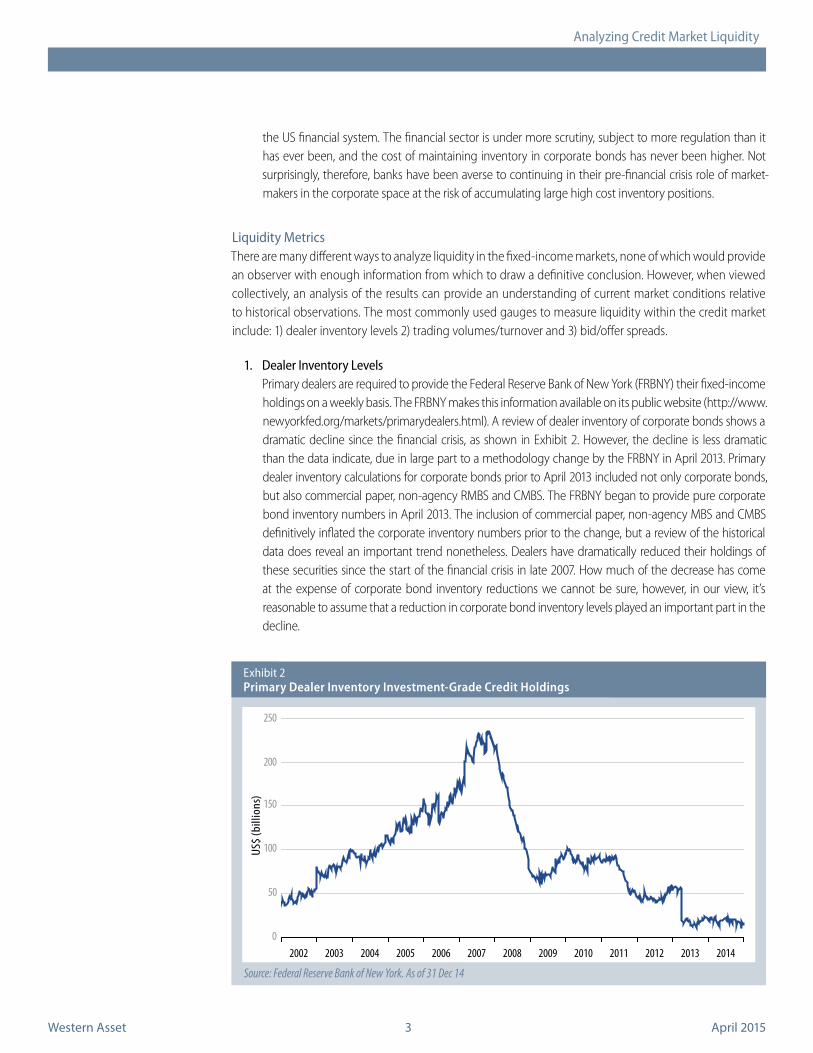
1. Dealer Inventory Levels Primary dealers are required to provide the Federal Reserve Bank of New York (FRBNY) their fixed-income
holdings on a weekly basis. The FRBNY makes this information available on its public website (http://www.newyorkfed.org/markets/primarydealers.html). A review of dealer inventory of corporate bonds shows a dramatic decline since the financial crisis, as shown in Exhibit 2. However, the decline is less dramatic than the data indicate, due in large part to a methodology change by the FRBNY in April 2013. Primary dealer inventory calculations for corporate bonds prior to April 2013 included not only corporate bonds, but also commercial paper, non-agency RMBS and CMBS. The FRBNY began to provide pure corporate bond inventory numbers in April 2013. The inclusion of commercial paper, non-agency MBS and CMBS definitively inflated the corporate inventory numbers prior to the change, but a review of the historical data does reveal an important trend nonetheless. Dealers have dramatically reduced their holdings of these securities since the start of the financial crisis in late 2007. How much of the decrease has come at the expense of corporate bond inventory reductions we cannot be sure, however, in our view, it’s reasonable to assume that a reduction in corporate bond inventory levels played an important part in the decline.
Regardless of the magnitude of the decline in corporate bond inventory, the current levels of primary dealer corporate bond inventory by various measures are small by comparison. Current dealer inventory levels approximate $15 billion versus a total market size of over $11 trillion, versus average daily trading volume of $19 billion, versus 2014’s average monthly new issuance of $120 billion and versus a number of individual transactions including a single new issue transaction totaling $17 billion by Medtronic Inc., in early December. Corporate bond inventory levels were inflated in 2007, but nonetheless the drop in overall inventory is staggering and should give the reader a sense of how little dealers position in risk assets, including corporate bonds, relative to the pre-crisis period.
By contrast, we take a look at agency MBS dealer inventories, which show a much different story. As shown in Exhibit 3, the current level of dealer inventory in agency MBS holdings, while off from the highs reached in early 2013, is still well above the longer-term average. No doubt a key contributing factor to dealers maintaining robust inventory in agency MBS securities is that Basel III made no change to the risk-weighted capital charge to hold such securities. Consequently, dealers that made 1/32nd markets on a variety of MBS coupons prior to 2008 continue to do so today. Trading 100 million blocks of agency MBS within the context of a 1/32nd bid/ask spread is as common today as it was in 2006. As a percentage of the entire agency MBS market, pre-crisis dealer inventory averaged 1.1% of the overall outstanding amount of agency MBS securities, versus 1.2% on average in 2014. With relatively low capital charges, dealers have remained willing market makers able to position a large inventory. Therefore, it’s not surprising the asset class has experienced little if any drop off in liquidity.
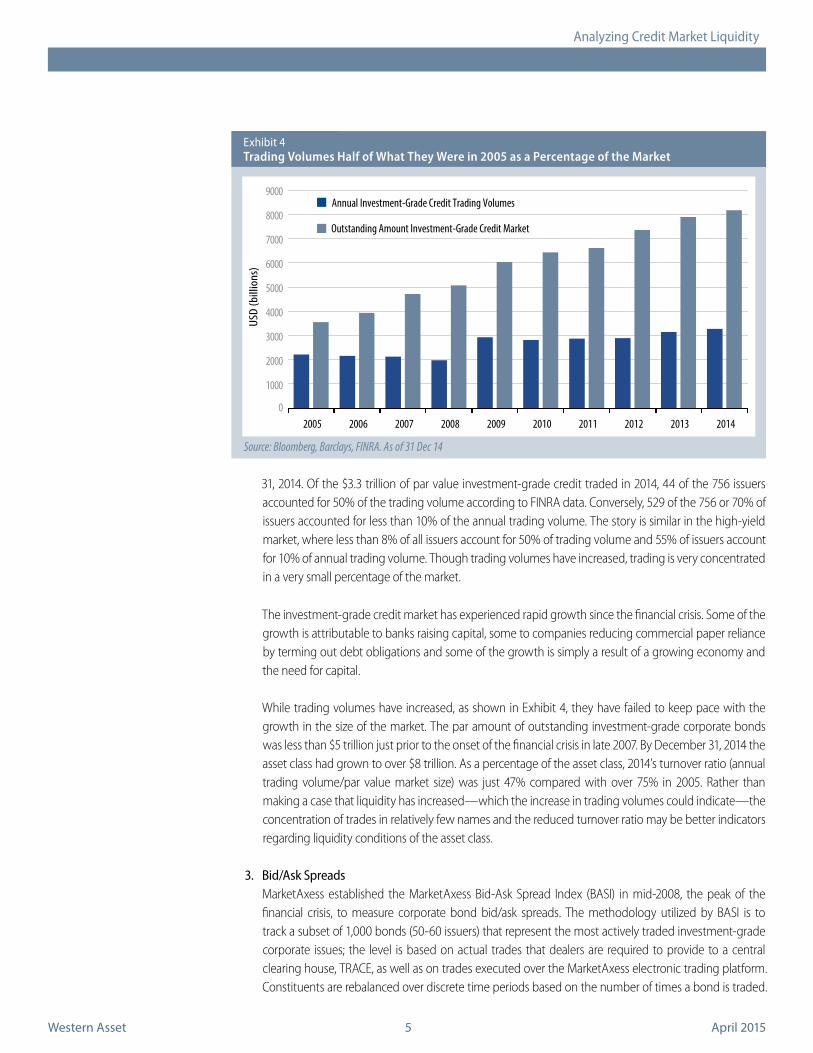
2. Trading Volumes/Turnover While dealer corporate bond inventory levels have declined, trading volumes have risen. After dropping
as the market entered the financial crisis, volumes have trended higher. Higher trading volumes could be an indication of increasing market liquidity.
However, closer inspection of the data as well as consideration of the increased market size tell a different story. The Barclays U.S. Credit Index included over 6,000 issues represented by 756 issuers as of December
Exhibit 3Primary Dealer MBS Holdings
Source: Federal Reserve Bank of New York. As of 18 Jun 14
31, 2014. Of the $3.3 trillion of par value investment-grade credit traded in 2014, 44 of the 756 issuers accounted for 50% of the trading volume according to FINRA data. Conversely, 529 of the 756 or 70% of issuers accounted for less than 10% of the annual trading volume. The story is similar in the high-yield market, where less than 8% of all issuers account for 50% of trading volume and 55% of issuers account for 10% of annual trading volume. Though trading volumes have increased, trading is very concentrated in a very small percentage of the market.
The investment-grade credit market has experienced rapid growth since the financial crisis. Some of the growth is attributable to banks raising capital, some to companies reducing commercial paper reliance by terming out debt obligations and some of the growth is simply a result of a growing economy and the need for capital.
While trading volumes have increased, as shown in Exhibit 4, they have failed to keep pace with the growth in the size of the market. The par amount of outstanding investment-grade corporate bonds was less than $5 trillion just prior to the onset of the financial crisis in late 2007. By December 31, 2014 the asset class had grown to over $8 trillion. As a percentage of the asset class, 2014’s turnover ratio (annual trading volume/par value market size) was just 47% compared with over 75% in 2005. Rather than making a case that liquidity has increased—which the increase in trading volumes could indicate—the concentration of trades in relatively few names and the reduced turnover ratio may be better indicators regarding liquidity conditions of the asset class.
3. Bid/Ask Spreads MarketAxess established the MarketAxess Bid-Ask Spread Index (BASI) in mid-2008, the peak of the
financial crisis, to measure corporate bond bid/ask spreads. The methodology utilized by BASI is to track a subset of 1,000 bonds (50-60 issuers) that represent the most actively traded investment-grade corporate issues; the level is based on actual trades that dealers are required to provide to a central clearing house, TRACE, as well as on trades executed over the MarketAxess electronic trading platform. Constituents are rebalanced over discrete time periods based on the number of times a bond is traded.
Exhibit 4Trading Volumes Half of What They Were in 2005 as a Percentage of the Market
Source: Bloomberg, Barclays, FINRA. As of 31 Dec 14
USD
(bill
ions
)
Annual Investment-Grade Credit Trading Volumes
Outstanding Amount Investment-Grade Credit Market
0
1000
2000
3000
4000
5000
6000
7000
8000
9000
2005 2006 2007 2008 2009 2010 2011 2012 2013 2014
Western Asset April 2015
Analyzing Credit Market Liquidity
6
As Exhibit 5 shows, bid/ask spreads were extremely elevated back in 2008 and have more or less trended down since then (bid/ask spreads are levels at which that dealer is willing to buy and sell a particular security at a particular moment in time).
Exhibit 5 would appear to indicate that transaction costs have trended down over the past few years. Lower bid/ask spreads could be an indicator of improving liquidity. According to BASI, bid/ask spreads have compressed from over 40 basis points (bps) in 2008 to 6 bps today. What is less obvious when viewing Exhibit 5 is that dealers typically only make bid/ask markets in the most liquid issues. These issues are the handful of issuers that comprise a majority of the trading mentioned earlier. Trading in the rest of the market is typically done with the dealer acting as agent. As opposed to taking the risk of buying or selling a security when making a market, as agent the dealer simply acts as the middle man by connecting buyers with sellers. Acting as an agent the dealer takes no risk. The decline in dealer corporate bond inventories means dealers are taking less risk and most likely the risks they are taking are concentrated only in the most liquid issues. When taking risk, dealers expect to make a higher return than when taking less or no risk. Since a great majority of trading executed in 2008 (when dealers carried significantly higher corporate bond inventory, versus today’s trading, which is done almost exclusively with the dealer acting as agent), the bid/ask spreads between 2008 and today are not perfectly comparable. In 2008, dealers took risk in hopes of making the difference between the bid and ask. Today dealers take little to no risk and on average make 6 bps on every bond they trade. The decline in bid/ask spreads most likely has more to do with dealers willing to work for less spread in exchange for taking incrementally less risk. The fact that a majority of the trading volume is done in the most liquid issuers and trading in most other names is done on an agency basis are the reasons behind the decline in bid/ask spreads, hardly conclusions that would support an argument that lower bid/ask spreads are an indication for greater liquidity. Therefore, the decline in bid/ask spreads could be an indication of less liquidity rather than increased liquidity.
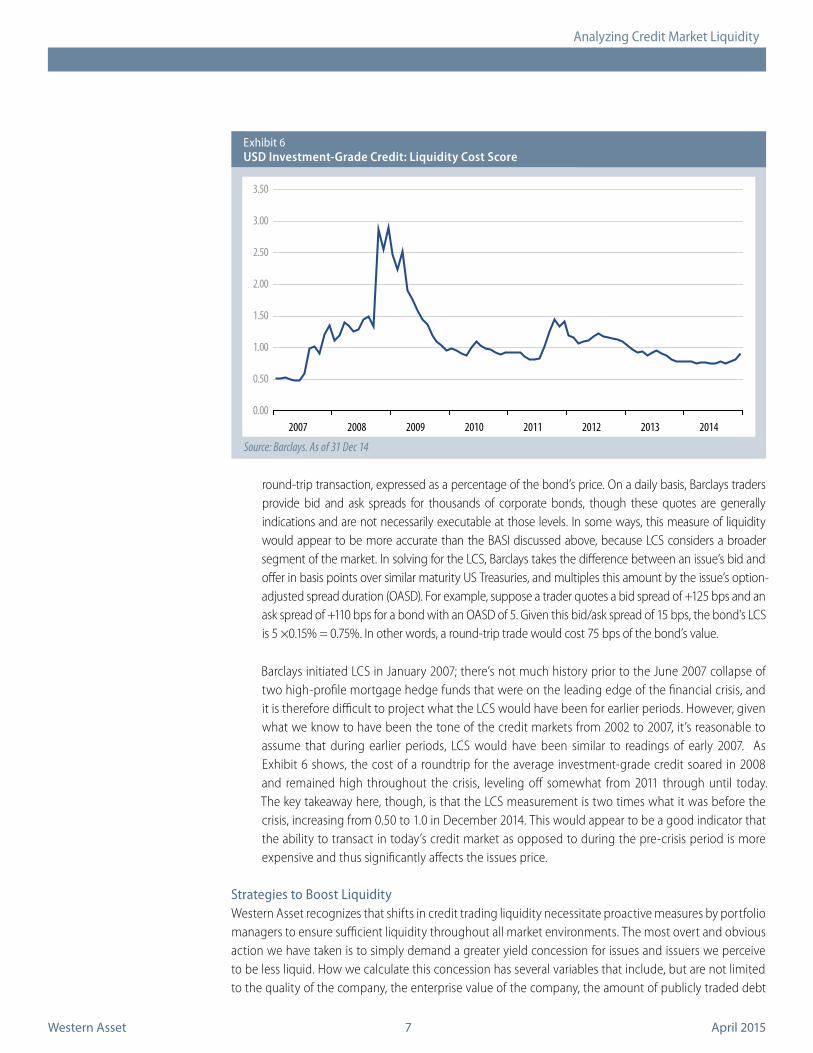
Another quantitative measure of liquidity based on bid/ask spreads is the Barclays proprietary Liquidity Cost Scores (LCS). For the purpose of LCS, Barclays defines “liquidity” as the cost of an institutional-sized
Exhibit 5MarketAxess Bid/Ask Spread Index (BASI)
Source: MarketAxess. As of 07 Oct 14
Basis
Poi
nts
0
5
10
15
20
25
30
35
40
45
Feb 2008 Jul 2009 Nov 2010 Apr 2012 Aug 2013 Dec 2014
MarketAxess Bid Ask Spread Index, bp
Western Asset April 2015
Analyzing Credit Market Liquidity
7
round-trip transaction, expressed as a percentage of the bond’s price. On a daily basis, Barclays traders provide bid and ask spreads for thousands of corporate bonds, though these quotes are generally indications and are not necessarily executable at those levels. In some ways, this measure of liquidity would appear to be more accurate than the BASI discussed above, because LCS considers a broader segment of the market. In solving for the LCS, Barclays takes the difference between an issue’s bid and offer in basis points over similar maturity US Treasuries, and multiples this amount by the issue’s option-adjusted spread duration (OASD). For example, suppose a trader quotes a bid spread of +125 bps and an ask spread of +110 bps for a bond with an OASD of 5. Given this bid/ask spread of 15 bps, the bond’s LCS is 5 ×0.15% = 0.75%. In other words, a round-trip trade would cost 75 bps of the bond’s value.
Barclays initiated LCS in January 2007; there’s not much history prior to the June 2007 collapse of two high-profile mortgage hedge funds that were on the leading edge of the financial crisis, and it is therefore difficult to project what the LCS would have been for earlier periods. However, given what we know to have been the tone of the credit markets from 2002 to 2007, it’s reasonable to assume that during earlier periods, LCS would have been similar to readings of early 2007. As Exhibit 6 shows, the cost of a roundtrip for the average investment-grade credit soared in 2008 and remained high throughout the crisis, leveling off somewhat from 2011 through until today. The key takeaway here, though, is that the LCS measurement is two times what it was before the crisis, increasing from 0.50 to 1.0 in December 2014. This would appear to be a good indicator that the ability to transact in today’s credit market as opposed to during the pre-crisis period is more expensive and thus significantly affects the issues price.
Strategies to Boost LiquidityWestern Asset recognizes that shifts in credit trading liquidity necessitate proactive measures by portfolio managers to ensure sufficient liquidity throughout all market environments. The most overt and obvious action we have taken is to simply demand a greater yield concession for issues and issuers we perceive to be less liquid. How we calculate this concession has several variables that include, but are not limited to the quality of the company, the enterprise value of the company, the amount of publicly traded debt
outstanding, the size of the issue as well as the number and quality of the underwriters, and the industry in which the issuer operates. Beyond this, we use a broader array of derivatives within portfolios where flows tend to be more vulnerable. Specifically, credit default swap indices (CDX) as well as options on credit default indices that trade frequently in size and with minimal bid/ask spreads, though there are inherent risks associated with these instruments. Incorporating such positions into a credit portfolio can act to dampen volatility as well as enhance liquidity when used appropriately. Total return swaps such as iBoxx High Yield Index can also be effective tools in managing portfolio liquidity, although Western Asset’s utilization of such swaps has been more limited to date due to a slightly more complex and less transparent settlement process. Diversification can also offer an elevated level of liquidity to a portfolio. Western Asset owns over 900 individual issuers across our portfolios. This breadth of exposure increases the range of options for portfolio managers when the need to raise cash arises. Finally, the growth in credit sector exchange-traded funds (ETFs) such as JNK for high-yield credit and LQD for investment-grade credit has led to increased block trading by dealers. Markets on more liquid ETFs trade with narrow 10 cents or less bid/ask spreads and in sizes of $20 million or more on either side. Portfolio managers can quickly and efficiently express proxy positions in the credit markets through using such ETFs. When used in moderation, the liquidity benefits to a credit portfolio can outweigh the relinquished alpha.
To quantify how these strategies impact a portfolio, Western Asset’s portfolio managers rely on the output of the Firm’s Risk Management Team. This framework has been developed by Western Asset’s Risk Management Team; it produces an estimate of portfolio liquidity under stress. Repo haircut levels are obtained from the Federal Reserve Bank of New York and the International Capital Markets Associa-tion. These haircut levels are analyzed and used with other inputs to assign each holding a liquidity score from one to five. Since repo haircut levels are set with a view to providing a cushion even under stressed market conditions, they are useful in estimating liquidity behavior in disrupted markets. The individual holding scores are aggregated to provide a view of the portfolio’s liquidity supply, either on an absolute or on a relative (to benchmark) basis.
Conclusions and Investment ImplicationsNew regulatory requirements (as well as elevated internal risk oversight) on banking institutions have hampered banks’ abilities to engage in proprietary trading and increased the cost of holding corporate bond inventories. As a result, the ability to smoothly transact in the corporate bond markets has become more challenged in terms of timely execution and at a price within the context of the quoted market. In addition to the liquidity enhancing strategies mentioned above, managers have the option of utilizing electronic trading platforms. Any investor registered with one of these platforms can execute buys and sells of corporate bonds, however, to date most trades on electronic platforms have been of odd lot sizes. Most institutional investors are reluctant to place larger orders on these platforms due to transparency concerns, potentially prohibitive costs and exacerbating the perceptions of any supply/demand imbalances. Specifically, buyers and sellers are identified on these platforms. In addition, some market participants feel that the fee they are charged for the service may not be commensurate with the service provided. That said, major electronic trading platforms, including MarketAxess, TradeWeb and Bloomberg as well as a host of new entrants are exploring ways to entice institutional money managers to use their platforms for larger trades. Western Asset’s utilization of electronic trading platforms to trade corporate bonds has been fairly limited, but we continue to work with the major platform providers in the development of an electronic product that truly enhances liquidity in a value-added format for our clients.
Western Asset places a high level of importance on maintaining constructive and collaborative relation-ships with those dealers on the Firm’s approved broker list. We believe that these relationships will serve
Western Asset April 20159
Past results are not indicative of future investment results. This publication is for informational purposes only and reflects the current opinions of Western Asset Management. Information contained herein is believed to be accurate, but cannot be guaranteed. Opinions represented are not intended as an offer or solicitation with respect to the purchase or sale of any security and are subject to change without notice. Statements in this material should not be considered investment advice. Employees and/or clients of Western Asset Management may have a position in the securities mentioned. This publication has been prepared without taking into account your objectives, financial situation or needs. Before acting on this information, you should consider its appropriateness having regard to your objectives, financial situation or needs. It is your responsibility to be aware of and observe the applicable laws and regulations of your country of residence. Western Asset Management Company Distribuidora de Títulos e Valores Limitada is authorized and regulated by Comissão de Valores Mobiliários and Banco Central do Brasil. Western Asset Management Company Pty Ltd ABN 41 117 767 923 is the holder of the Australian Financial Services Licence 303160. Western Asset Management Company Pte. Ltd. Co. Reg. No. 200007692R is a holder of a Capital Mar-kets Services Licence for fund management and regulated by the Monetary Authority of Singapore. Western Asset Management Company Ltd is a registered financial instruments dealer whose business is investment advisory or agency business, investment management, and Type II Financial Instruments Dealing business with the registration number KLFB (FID) No. 427, and members of JIAA (membership number 011-01319) and JITA. Western Asset Management Company Limited (“WAMCL”) is authorized and regulated by the Financial Conduct Authority (“FCA”). In the UK this communication is a financial promotion solely intended for professional clients as defined in the FCA Handbook and has been approved by WAMCL.
Analyzing Credit Market Liquidity
clients well in times when credit markets and liquidity are under pressure. In our opinion, trading liquid-ity is poised to remain challenged for the foreseeable future. Trading platforms will eventually evolve to complement the existing dealer-dominated approach. However, this is likely to be years away. In the meantime, Western Asset will continue to scrutinize the liquidity profiles of our credit portfolios and strive to ensure these portfolios maintain sufficient liquidity regardless of market conditions.