+ All Categories
Home > Documents > Name: Pre- Calc. 11 Chapter 7 Absolute Value and ... _____ Pre- Calc. 11 Date: _____ Chapter 7 –...

Name: Pre- Calc. 11 Chapter 7 Absolute Value and ... _____ Pre- Calc. 11 Date: _____ Chapter 7 –...

Date post: 09-Mar-2018
Category:
Upload: lyanh
View: 221 times
Download: 4 times
Share this document with a friend
2
Name: ____________________ Pre- Calc. 11 Date: _____________ Chapter 7 Absolute Value and Reciprocal Functions Section 7.2B Graphing Absolute Value Functions of the Form continue Notice the ‘ ’ value is inside the absolute value. If this is the case, the absolute value should be graphed using a completely different method. Example 1: Sketch the graph of 3 1 y x Step 1 : Sketch the graph of y-intercept: slope: Step 2 : Calculate the -intercept by setting in the absolute value equation. The -intercept can also be located graphically from step 1. The -intercept of is also the -intercept of . This is called an invariant point. Step 3 : Reflect in the -axis the part of the graph of that is below the -axis. The V- shaped graph that results is the graph of . Step 4 : State the domain and range: Since the right branch is from the equation and the left branch is from the equation _________________________________ , the graph can be described as a piecewise function: Invariant points are points that remain unchanged when a transformation is applied. What other points on the graph are invariant points? Example 2: Sketch the graph of . State the domain and range, and express as a Piecewise function.
Transcript

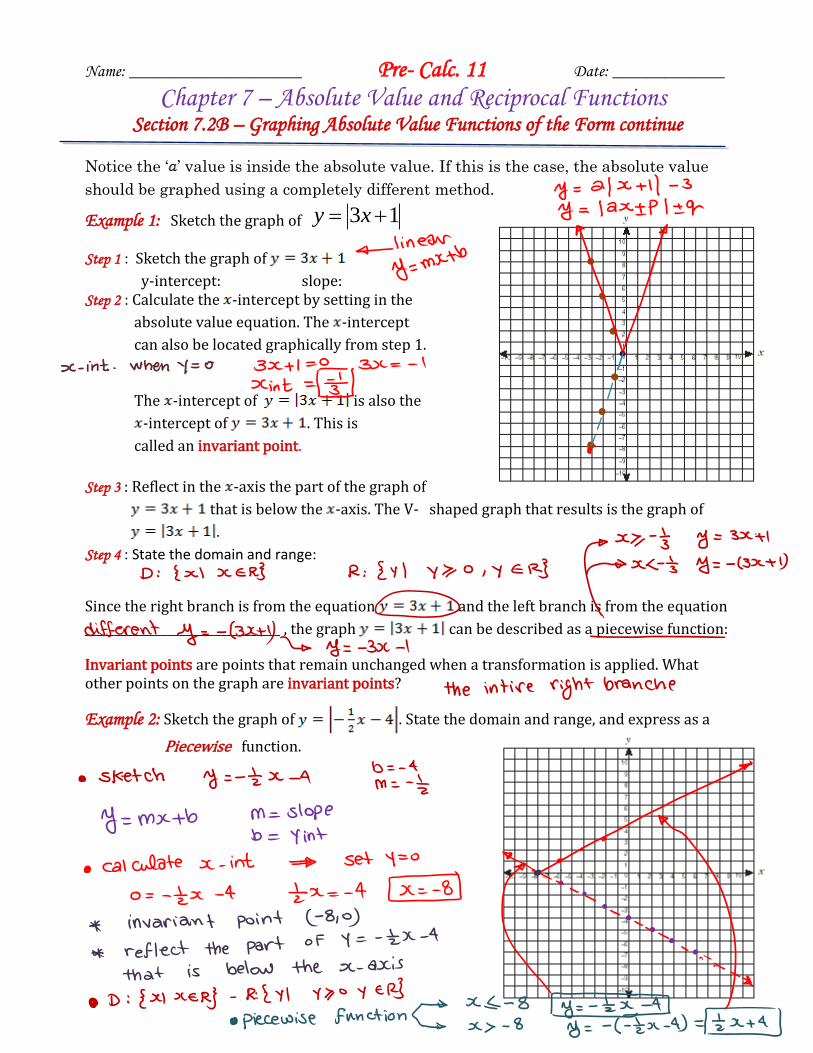
Name: ____________________ Pre- Calc. 11 Date: _____________

Chapter 7 – Absolute Value and Reciprocal Functions Section 7.2B – Graphing Absolute Value Functions of the Form continue

Notice the ‘ ’ value is inside the absolute value. If this is the case, the absolute value

should be graphed using a completely different method. Example 1: Sketch the graph of 3 1y x

Step 1 : Sketch the graph of

y-intercept: slope: Step 2 : Calculate the -intercept by setting in the

absolute value equation. The -intercept

can also be located graphically from step 1. The -intercept of is also the

-intercept of . This is

called an invariant point.

Step 3 : Reflect in the -axis the part of the graph of

that is below the -axis. The V- shaped graph that results is the graph of

.

Step 4 : State the domain and range:

Since the right branch is from the equation and the left branch is from the equation

_________________________________ , the graph can be described as a piecewise function:

Invariant points are points that remain unchanged when a transformation is applied. What other points on the graph are invariant points?

Example 2: Sketch the graph of . State the domain and range, and express as a

Piecewise function.

Quadratic absolute functions

Graphing an Absolute Value Function of the Form

Example 3: Sketch the graph of by first sketching the graph of

. Then state the domain and range of the absolute value graph only.

1) Factor the corresponding quadratic equation to find the roots (x-intercepts). 2) Complete the square on the function to find the vertex. Graph the parabola. 3) Reflect in the x-axis the part of the graph that lies below the x-axis in order to build the absolute value graph. The negative y values in the original parabola will have the absolute value applied to them, thereby making them positive.

The absolute value graph above is actually a combination of two parabolas. What are the quadratic functions of the two parabolas?

We can define the absolute value function as a piecewise function of the two quadratic functions:

Example 3: Sketch the graph of and

a) State the domain and range of the absolute value graph. b) Express the absolute value as a piecewise function.

Assignment: Pg. 376-379 Q. 7, 8, 10, 11cd, 13, 22


Recommended