Persistent link: http://hdl.handle.net/2345/2551 This work is posted on eScholarship@BC, Boston College University Libraries. Pre-print version These materials are made available for use in research, teaching and private study, pursuant to U.S. Copyright Law. The user must assume full responsibility for any use of the materials, including but not limited to, infringement of copyright and publication rights of reproduced materials. Any materials used for academic research or otherwise should be fully credited with the source. The publisher or original authors may retain copyright to the materials. The corporate social performance- financial performance link Authors: Sandra A. Waddock, Samuel B. Graves
Transcript
Persistent link: http://hdl.handle.net/2345/2551
This work is posted on eScholarship@BC,Boston College University Libraries.
Pre-print version
These materials are made available for use in research, teaching and private study,pursuant to U.S. Copyright Law. The user must assume full responsibility for any use ofthe materials, including but not limited to, infringement of copyright and publication rightsof reproduced materials. Any materials used for academic research or otherwise shouldbe fully credited with the source. The publisher or original authors may retain copyrightto the materials.
The corporate social performance-financial performance link
The Corporate Social Performance--Financial Performance Link
Sandra A. Waddock
Carroll School of Management
Boston College
Chestnut Hill, MA 02167
617-552-0477
and
Samuel B. Graves
Carroll School of Management
Boston College
Chestnut Hill, MA 02167
617-552-0464
Strategic Management Journal, Fall 1997
Acknowledgments: The authors would like to thank Steven Lydenberg of Kinder, Lydenberg,
Domini for his help with access to the data and his input into this research. An earlier version of
this paper was presented at the Academy of Management Annual Meeting, Dallas, TX, August
1994. We would also like to acknowlege the input of the two reviewers, who helped us improve
the manuscript greatly. In particular, we thank reviewer #2 for the suggestion regarding the
posturing hypothesis.
Post-print version of an article published in Strategic Management Journal 18(4): 303-319 (1997 April). doi: 10.1002/(SICI)1097-0266(199704)18:4<303::AID-SMJ869>3.0.CO;2-G
2
1/96
Post-print version of an article published in Strategic Management Journal 18(4): 303-319 (1997 April). doi: 10.1002/(SICI)1097-0266(199704)18:4<303::AID-SMJ869>3.0.CO;2-G
3
The Corporate Social Performance--Financial Performance Link
ABSTRACT
Strategic managers are consistently faced with the decision of how to allocate
scarce corporate resources in an environment that is placing more and more pressures on
them. Recent scholarship in strategic management suggests that many of these pressures
come directly from sources associated with social issues in management, rather than
traditional arenas of strategic management. Using a greatly-improved source of data on
corporate social performance, this paper reports the results of a rigorous study of the
empirical linkages between financial and social performance. CSP is found to be
positively associated with prior financial performance, supporting the theory that slack
resource availability and CSP are positively related. CSP is also found to be positively
associated with future financial performance, supporting the theory that good
management and CSP are positively related.
Post-print version of an article published in Strategic Management Journal 18(4): 303-319 (1997 April). doi: 10.1002/(SICI)1097-0266(199704)18:4<303::AID-SMJ869>3.0.CO;2-G
4
The Corporate Social Performance-Financial Performance Link
Introduction
Strategic managers are consistently faced with the decision of how to allocate scarce
corporate resources in an environment that is placing more and more pressures on them. Recent
scholarship in strategic management suggests that many of these pressures are coming directly
not from traditional concerns of strategic management but instead from concerns about social
issues in management (see, e.g., Prahalad and Hamel, 1994). Strategic resource allocation
decisions have always been complex, but now they are even more so, since companies are
assessed not only on the financial outcome of their decisions but also on the ways in which their
companies measure up to a broader set of societal expectations.
Prahalad and Hamel (1994) indicate that influences on strategic decisions now come from
influences that go well beyond traditional industry-based competitive forces identified by Porter
(1980). Changing customer expectations, regulatory shifts, problem of excess capacity (and
presumably the associated employees), and environmental concerns are now becoming important
influences on strategy (Prahalad and Hamel, 1994). These emerging influences on strategic
decision making are the result of the impact of different stakeholder expectations (Freeman,
1983) and company's interactions with a range of stakeholders arguably comprise its overall
corporate social performance record (c.f., Wood, 1991 a,b; Waddock, forthcoming). To
illustrate the importance of such influences on companies, it should be noted that investors now
hold some $650 billion in social investment funds. Within many of the investment houses that
run these so-called socially responsible investment funds are analysts who carefully screen
potential investments both on financial and social performance criteria.
Further, watchdog groups like the Council on Economic Priorities (CEP) have long
evaluated company performance on a range of social dimensions. In recent years CEP has
produced a widely-disseminated guide called "Shopping for a Better World" that interested
Post-print version of an article published in Strategic Management Journal 18(4): 303-319 (1997 April). doi: 10.1002/(SICI)1097-0266(199704)18:4<303::AID-SMJ869>3.0.CO;2-G
5
consumers use to help guide purchasing decisions. More recently independent services have
sprung up that evaluate companies' social performance across a broad range of “social" activities
and sell that information to the investment community. As a result, these ratings are now
available to the investment community as input to investor decisions. These ratings services
seem to be having an effect on some investment decisions, which is evident in research that
shows that institutional investors are favorably inclined toward companies with higher corporate
social performance when other factors are held constant and independent information about CSP
is available (Teoh and Shiu, 1990; Graves and Waddock, 1994).
Despite these developments, the linkages between CSP and financial performance are
still far from clear (Ullman, 1985). Results of empirical work indicate an ambiguous relationship
(e.g., Alexander and Buchholtz, 1983; Aupperle, Carroll and Hatfield, 1985; Ullman, 1985;
Shane and Spicer, 1983). Further, even when a positive link is established (e.g., Wokutch and
Spencer, 1987; McGuire, Sundgren and Schneeweis, 1988), it is still unclear whether financially
successful companies simply have more resources to spend on CSP and therefore attain a higher
standard (a slack resources theory) or whether better performance along various dimensions of
CSP itself results in better financial outcomes (which we will characterize as good management
theory) (McGuire, Schneeweiss, and Sundgren, 1990; Ullman, 1985).
Using a greatly-improved source of data on corporate social performance, this paper
reports the results of a rigorous study of the empirical linkages between financial and social
performance. With a broad-based index of corporate social performance, we test whether there
is a positive relationship between CSP and financial performance and whether both slack
resource and good management theory may be operating simultaneously.
The Measurement Problem
One fundamental reason for the uncertainty about the relationship between CSP and
financial performance is that a serious problem has plagued researchers to date: the problem of
measuring CSP. CSP is a multidimensional construct, with behaviors ranging across a wide
variety of inputs (e.g., investments in pollution control equipment or other environmental
Post-print version of an article published in Strategic Management Journal 18(4): 303-319 (1997 April). doi: 10.1002/(SICI)1097-0266(199704)18:4<303::AID-SMJ869>3.0.CO;2-G
6
strategies), internal behaviors or processes (e.g., treatment of women and minorities, nature of
products produced, relationships with customers), and outputs (e.g., community relations and
philanthropic programs) (see Wood, 199la, b; Aupperle et al., 1985; Wolfe and Aupperle, 1991;
Aupperle, 1991; Miles, 1987; Gephardt, 1991). These behaviors also occur across a wide range
of industries with significantly different characteristics, histories, and performance in the
different CSP domains (see Waddock and Graves, 1994). Further, numerous issues, managerial
decisions, and corporate behaviors are encompassed by the term CSP (Wood, 199la, b;
Lydenberg, Marlin and Strub, 1986). As a result, little clarity has been reached on measurement
of CSP, and the measures used in empirical work have frequently been one dimensional, and
have been applied to small samples of companies. There is a clear need for a multidimensional
measure applied across a wide range of industries and larger samples of companies.
CSP measures used in the past have included forced-choice survey instruments
(Aupperle, 1991; Aupperle et al., 1985), the Fortune reputational and social responsibility index
or Moskowitz' reputational scales (Bowman and Haire, 1975; McGuire et al., 1988; O'Bannon
and Preston, 1993), content analysis of documents (Wolfe, 1991), behavioral and perceptual
measures (Wokutch and McKinney, 1991), and case study methodologies resembling social
audits (Clarkson, 1991). In some instances social disclosure has been used as a surrogate for
CSP (e.g., Preston, 1978; Abbott and Monson, 1979; Ingram, 1978). Pollution control
investments are another frequently used one-dimensional measure (e.g., Bowman and Haire,
1975; Chen and Metcalf, 1980; Spicer, 1978a, b; Shane and Spicer, 1983).
Each of these measurements, while offering some benefits, has limitations. Survey
methodologies have problems relating to return rates and consistency of raters across a variety of
firms. The Fortune rating of CSP tends to be viewed as a measure of overall management of a
firm rather than being specific to CSP. Further, it is highly correlated with other measures.
Content analysis of existing documents, while yielding valuable insights into corporate behavior,
depends to a large extent on the comprehensiveness and purposes for which the documents were
originally created and can be biased by omission or inclusion. Case study methodologies, by
Post-print version of an article published in Strategic Management Journal 18(4): 303-319 (1997 April). doi: 10.1002/(SICI)1097-0266(199704)18:4<303::AID-SMJ869>3.0.CO;2-G
7
their nature, can be applied to only a limited sampling of companies; further, although significant
progress has been made (e.g., Clarkson, 1991), there are problems of consistency across cases
studied by different research teams. Social disclosure and pollution control investments are
unidimensional measures. Thus, many measures are either unidimensional and may not properly
reflect the overall level of a company's CSP or they are difficult to apply consistently across the
range of industries and companies that need to be studied.
So problematic has been the measurement problem that an entire section of the annual
research volume Research in Corporate Social Performance and Policy was devoted to this topic
(see Wolfe and Aupperle, 1991, for the introduction to this special section). The research we
report in this paper attempts to overcome some of the measurement problems that in the past
have hindered examination of the strategic links between firms’ CSP and financial performance.
As noted, many empirical studies of CSP tend to focus on only one or two areas of social
performance while ignoring the rest. It is difficult to construct a truly representative CSP
measure in part because of its complexity and because measurements of a single dimension
provide too limited a perspective on how well a company is actually performing in the relevant
social domains (Lydenberg, 1986; Wolfe and Aupperle, 1991). In part because of the
measurement difficulties, previous findings on the relationship between profitability and
corporate social performance have been mixed. Some find tenuous positive linkages (McGuire,
et al., 1988, 1990; Aupperle, Carroll, and Hatfield, 1985), others find clear positive relationships
(Cochran and Wood, 1984), while others document negative linkages (Shane and Spicer, 1983).
It is simply unclear at this point whether linkages between financial performance and CSP exist,
and if so whether they are positive or negative (Aupperle et al., 1985). Ullman (1985) provides a
comprehensive review of the mixed results up to 1985, concluding, in fact, that "the situation
pertaining to relationships among social performance, social disclosure, and economic
performance can best be characterized at this time as empirical data in search of an adequate
theory" (p. 555).
Post-print version of an article published in Strategic Management Journal 18(4): 303-319 (1997 April). doi: 10.1002/(SICI)1097-0266(199704)18:4<303::AID-SMJ869>3.0.CO;2-G
8
Hypotheses
In forming our hypothesis, it is evident that there are two issues to address: 1) the sign of
the relationship, and 2) the direction of causation (O'Bannon & Preston, 1993). The sign of the
relationship may indicate negative, neutral, or positive linkages between CSP and financial
performance. Separately, it is possible that changes in CSP influence financial performance, or
the opposite, that change in financial performance influence CSP. Together, these two issues
result in a total of six possible hypotheses (O'Bannan and Preston (1993). Below we recount the
arguments for these different hypotheses.
Negative Association. Those arguing for a negative relationship between social and
financial performance believe that firms that perform responsibly incur a competitive
disadvantage (Aupperle, Carroll, and Hatfield, 1985) because they are incurring costs that might
otherwise be avoided or that should be borne by others (e.g., individuals or government). An
example of this kind of action would be the decision to invest in pollution control equipment
when other competitors do not. According to this line of thinking, which is fundamental to
Friedman's (1970) and other neoclassical economists' arguments, there are few readily
measurable economic benefits to socially responsible behavior while there are numerous costs.
The costs, by this argument, fall directly to the bottom line, reducing profits and thus shareholder
wealth. These theorists expect the relationship between CSP and financial performance to be
negative.
Neutral Association. The empirical results to date lend themselves to a second
possibility: that there is simply no relationship, positive or negative, between social and financial
performance. Proponents of this line of reasoning (e.g., Ullman, 1985) argue that there are so
many intervening variables between social and financial performance that there is no reason to
expect a relationship to exist, except possibly by chance. On the other hand, the measurement
problems that have plagued CSP research may mask any linkage that exists.
Positive Association. The third perspective, based on stakeholder analysis, proposes that
a tension exists between the firm's explicit costs (e.g., payments to bondholders) and its implicit
Post-print version of an article published in Strategic Management Journal 18(4): 303-319 (1997 April). doi: 10.1002/(SICI)1097-0266(199704)18:4<303::AID-SMJ869>3.0.CO;2-G
9
costs to other stakeholders (e.g., product quality costs, environmental costs). This theory
predicts that a firm that attempts to lower its implicit costs by socially irresponsible actions will,
as a result, incur higher explicit costs, resulting in competitive disadvantage. According to this
argument, then, there is a positive relationship between CSP and financial performance.
A compatible view is that the actual costs of CSP are minimal and the benefits potentially
great. For example, an enlightened employee relations policy may have a very low cost, but can
result in substantial gains in morale and productivity, actually yielding a competitive advantage
in comparison to less responsible firms. Firms that are reported in lists of "best companies to
work for," for example, may find it easier to recruit top quality employees, possibly resulting in
increases in productivity at relatively low cost (e.g., Moskowitz, 1972). Although this argument
is a fundamentally normative one, there is a recent emphasis in strategic management on the
construction of meaningful strategies that emphasize the importance of core values to which
employees and other key stakeholders can relate. Sometimes this "meaning-making" is called
strategic intent (e.g., Hamel and Prahalad, 1989). Others term it purpose (Bartlett and Ghoshal,
1994) or enterprise strategy, which is explicit about what the corporation "stands for" in the
linkages between its values and strategy (Freeman and Gilbert, 1988).
In any case, strategic postures with an overlay of social and other normatively defined
purposes have historically been held in low regard as possible sources of competitive advantage.
These new ideas in strategic management, however, suggest that such socially-embedded
purposes and strategic postures may be related to positive strategic outcomes in important ways.
By extension, such purposes may have positive impact on financial performance as well.
Finally, some take the position that high levels of CSP are indicators of superior
management skill, and thus lead to lower explicit costs (Alexander and Buchholz, 1978), a
perspective that would tend to be supported by the high correlations among Fortune's indicators
of good management and social performance. The weight of these arguments about the potential
positive benefits of CSP suggests to us that the sign of any relationship between financial and
Post-print version of an article published in Strategic Management Journal 18(4): 303-319 (1997 April). doi: 10.1002/(SICI)1097-0266(199704)18:4<303::AID-SMJ869>3.0.CO;2-G
10
social performance will be positive, hence we will hypothesize that the relationship between
social and financial performance is a positive one.
Direction of Causality: Slack Resources or Good Management?
The second aspect of the CSP-financial performance relationship has to do with the
direction of causality. Two views, mentioned earlier can be contrasted and tested empirically.
We will call the first the slack resources theory and the second the good management theory.
Slack Resources. Slack resource theorists argue that better financial performance
potentially results in the availability of slack (financial and other) resources that provide the
opportunity for companies to invest in social performance domains, such as community relations,
employee relations, or environment (e.g., IBM's or Digital Equipment Corporation's philanthropy
programs during earlier good times). If slack resources are available, then better social
performance would result from the allocation of these resources into the social domains, and thus
better financial performance would be a predictor of better CSP. Some of the empirical evidence,
particularly that of McGuire and colleagues (1988, 1990), provides support for the slack
resources theory.
Good Management. Good management theorists argue, alternatively, that there is a
high correlation between good management practice, and CSP, simply because attention to CSP
domains improves relationships with key stakeholder groups (e.g., Freeman, 1983), resulting in
better overall performance. For example, good employee (including women and minorities)
relations might be expected to enhance morale, productivity, and satisfaction. Excellent
community relations might provide incentives for local government to provide competition
better workforce over the long term), or reduced regulation, thereby reducing costs to the firm
and improving the bottom line.
Further, positive customer perceptions about the quality and nature of a company's
products, its environmental awareness, and its government and community relations, are
increasingly becoming bases of competition (c.f., Prahalad and Hamel, 1994), blurring the lines
Post-print version of an article published in Strategic Management Journal 18(4): 303-319 (1997 April). doi: 10.1002/(SICI)1097-0266(199704)18:4<303::AID-SMJ869>3.0.CO;2-G
11
between good management practice and "social" performance. Such positive perceptions of the
firm by outside stakeholders may lead to increased sales or reduced stakeholder management
costs. The work of McGuire and colleagues (1988, 1990) also supports the good management
theory in that it provides empirical support for financial performance as the dependent variable.
Following these latter findings and based on McGuire et al. (1990), we hypothesize that
CSP is both a predictor and consequence of firm financial performance. That is, there is a
simultaneous relationship, or a kind of "virtuous circle," such that:
Hl: Better financial performance results in improved CSP, ceteris paribus.
H2: Improved CSP leads to better financial performance, ceteris paribus.
Method
Measuring CSP
To deal with the measurement problems noted above, we constructed an index of CSP (as
proposed by Ullman, 1985), based on the eight corporate social performance attributes rated
consistently across the entire Standard and Poors 500 by the firm Kinder, Lydenberg, Domini
(KLD).1 KLD is an independent rating service that focuses exclusively on assessment of
corporate social performance across a range of dimensions related to stakeholder concerns.
KLD's rating scheme makes several advances beyond those used in earlier research.
First, all companies in the S&P 500 are rated. Second, each company is rated on multiple
attributes considered relevant to CSP. Third, a single group of researchers, working
independently from the rated companies or any particular brokerage house applies the same set
of criteria to related companies. Fourth, the criteria are applied consistently across a wide range
of companies, with data gathered from a range of sources, both internal and external to the firm.
As noted, KLD rates companies on eight attributes of CSP, providing a multidimensional
assessment. Five of the rated attributes emphasize key stakeholder relations that might be
included among those emphasized as important emerging influences on corporate strategy
1Data source: Kinder, Lydenber, Domini & Co., Inc., 129 Mt. Auburn St., Cambridge, MA 02138.
Post-print version of an article published in Strategic Management Journal 18(4): 303-319 (1997 April). doi: 10.1002/(SICI)1097-0266(199704)18:4<303::AID-SMJ869>3.0.CO;2-G
12
(Prahalad and Hamel, 1994), specifically, community relations, employee relations, performance
with respect to the environment, product characteristics, and treatment of women and minorities.
These five are rated on scales ranging from -2 (major concerns) to neutral to +2 (major strength).
Three of the attributes are less directly related to stakeholder groups but encompass areas in
which companies have received significant external pressures in recent years. These areas are
military contracting, participation in nuclear power, and involvement in South Africa (relevant
during the time period of analysis); these are rated only from -2 (major concern) to 0 (neutral)
because KLD awards no positive assessment of activities in these domains.
In each of the areas, KLD investigates a range of sources to determine, for example,
whether the company has paid fines or penalties in an area (for concerns) or has major strengths
in the area (e.g., strong family policies for the Employee Relations category). Appendix A
provides details on the factors used in determining ratings for each of the eight categories.
Where possible, KLD uses quantitative criteria to determine the rating (e.g., $ amount paid in
fines or penalties; % of employees receiving certain kinds of benefits). Judgment is necessary,
of course, in the determination of the cutoff point for a negative rating, as well as in borderline
case and in interpretation of qualitative criteria (e.g., an excellent employee or community
relations program). KLD staff members meet on a weekly basis to discuss borderline cases and
assure that decisions on ratings are being made in a consistent manner across companies and
from year to year.
KLD uses a variety of sources to capture social performance data about each company.
Each company's investor relations office is sent a yearly questionnaire about CSP practices and
KLD maintains continuing relations with investor relations offices to assure the accuracy of data.
KLD maintains the independence and integrity of its ratings, but the firm is willing to respond to
company concerns where accuracy is at issue. Corporate data sources include annual reports,
10K forms, proxy statements, and quarterly reports, as well as reports issued for specific CSP
arenas, such as environment and community. External data sources include articles about a
company in the general business press (e.g., Fortune, Business Week, Wall St. Journal), trade
Post-print version of an article published in Strategic Management Journal 18(4): 303-319 (1997 April). doi: 10.1002/(SICI)1097-0266(199704)18:4<303::AID-SMJ869>3.0.CO;2-G
13
magazines, and general media. KLD staffers also draw on relevant articles on companies from
periodicals such as the Chronicle of Philanthropy, regional Environmental Protection Agency
newsletters, academic journals, and, for legal or regulatory issues, such as fines and penalties, the
National Law Journal. External surveys and ratings are also used, where appropriate, for
instance Working Mother's listing of the 100 best companies for women to work for.
Each attribute in the KLD scheme is implicitly given equal weighting, ranging from
major concern (2 X's), concern (1 X), no concern (neutral), to strength and major strength. In
our weighting scheme, major concern was given an index of -2, while major strength equaled +2.
Because experts on CSP consider certain attributes to be more important to an overall assessment
of CSP than others at any given time (Preston and Post, 1975), the authors developed a panel of
three experts from the Social Issues in Management division of the Academy of Management,
who had been active in the social issues arena for more than 15 years, and asked them to help
construct an appropriate weighting scheme for the index.
Using the simple multi-attribute rating technique (SMART) (Von Winterfeldt and
Edwards, 1986), we asked each panelist to evaluate the eight CSP attributes, perform tradeoffs
among the attributes, then construct a scale. Values from 0-100 were derived, representing the
relative importance of each attribute to the overall index. Normalized values were averaged
across the panelists and a weighted average CSP index was computed for each company. A
Friedman's nonparametric analysis of variance indicated that the ratings of each panelist were not
significantly different from each other. The index developed is statistically the same as that used
by Ruf et al. (1993) and reported in Graves and Waddock (1994).
We believe that this weighting scheme deals with the problem of shifting of the relative
importance of items in the KLD rating over time and with changng social standards (c.f., Preston
and Post, 1975). For example, South Africa, nuclear, and military involvement, which carry low
weight in the index, seem in terms of face validity to have relatively less importance to the
currently emerging construct of CSP than do the more stakeholder-oriented measures of
Post-print version of an article published in Strategic Management Journal 18(4): 303-319 (1997 April). doi: 10.1002/(SICI)1097-0266(199704)18:4<303::AID-SMJ869>3.0.CO;2-G
14
community, product, employee relations, diversity (women and minority), and environment. The
actual weighting by our panel of experts reflects this common sense.
Raw CSP data were taken from KLD as of 1990. For the models that treated CSP as a
dependent variable, financial data from 1989 were used. For the models that treated financial
performance (profitability) as the dependent variable, we took profitability in 1991 as the
dependent variable and used 1990 data for CSP and control variables.
Control Variables
Because size, risk, and industry have been suggested in previous articles to be factors that
affect both firm performance and CSP (e.g., Ullman, 1985), each of these characteristics was
operationalized as a control variable. Size is a relevant variable because there is some evidence
that smaller firms may not exhibit as many overt socially responsible behaviors as do larger
firms. Perhaps this is the case because as they mature and grow, firms attract more attention
from external constituents and need to respond more openly to stakeholder demands (c.f., Burke,
Logsdon, Mitchell, Reiner, and Vogel, 1986). Management's risk tolerance influences its
attitude toward activities that have the potential to 1) elicit savings (e.g., a recycling or waste
reduction effort, costly at first but potentially money saving in the long run, such as 3M
Corporation's Pollution Prevention Pays program; 2) incur future or present costs (e.g., pollution
control equipment that helps avoid future fines), or 3) build (environmentally friendly firm) or
destroy (perceived as unfriendly to certain types of people) markets. As a proxy ifor
managemetn's risk tolerance, w use the level of debt held by the firm.
Finally, earlier research (Graves and Waddock, 1994) has shown that clear differences in
performance and levels of R&D investment exist among different industries. A quick scan of
Table 1 suggests that unless the overall differences in CSP among industries are controlled for,
understanding the main effects may blurred, since depending on its characteristics, an industry
may or may not experience significant problems in a given social arena. Controlling for industry
takes these differences into account.
Post-print version of an article published in Strategic Management Journal 18(4): 303-319 (1997 April). doi: 10.1002/(SICI)1097-0266(199704)18:4<303::AID-SMJ869>3.0.CO;2-G
15
Firm size was measured by total assets and by total sales. As a proxy for the riskiness of
a firm, we used the long-term debt to total assets ratio. Industry was determined by four-digit
SIC (see Table 1) and represented in the model by dummy variables. All financial data were
derived from COMPUSTAT tapes.
Financial Performance
Firm financial performance (profitability) was measured using three accounting
variables: return on assets, return on equity, and return on sales, providing a range of measures
used to assess corporate financial performance by the investment community.
Analysis
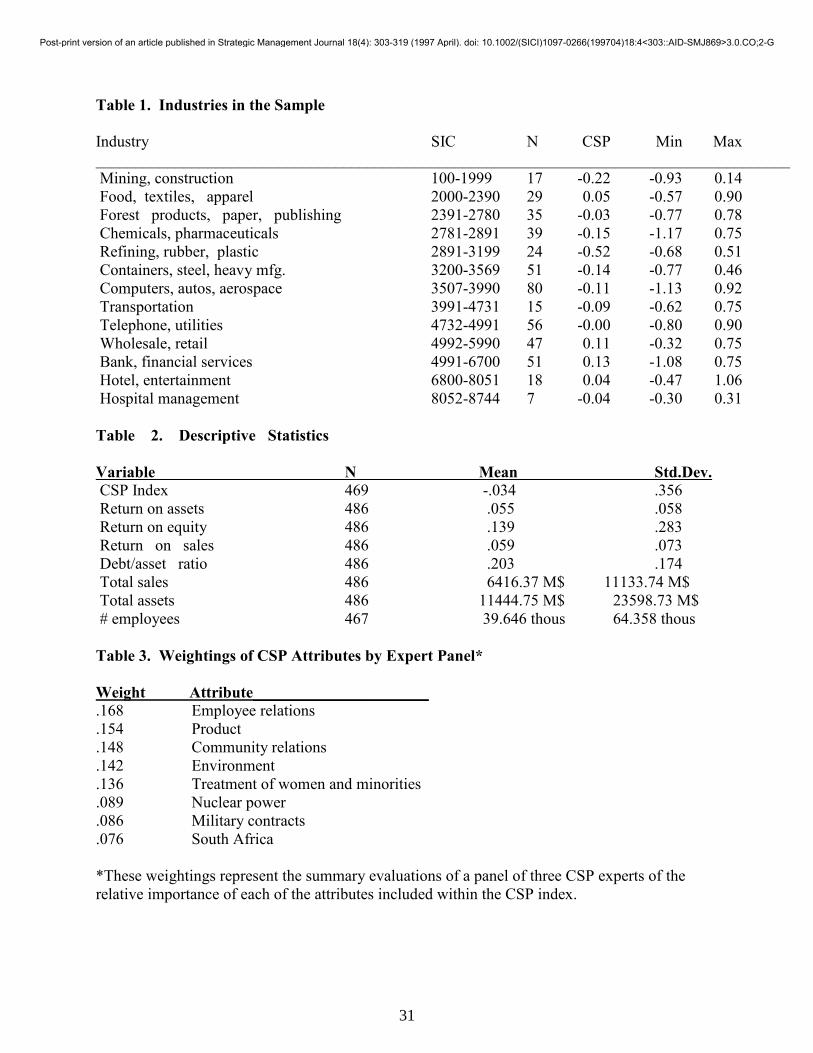
Table 1 gives a listing of the industries, SIC codes, and average industry CSP ratings,
Table 2 gives descriptive statistics for all variables used in the study; and Table 3 gives the
relative weights assigned to each CSP attribute. Regression analysis was used to test our
hypotheses, first using CSP as the dependent variable, while controlling for size (three size
measures were used: total sales, total assets, and number of employees), debt level, and industry,
then using profitability as the dependent variable and employing the same control variables.
Results
A total of 469 companies remained in the sample after companies missing either financial
or CSP data were eliminated. As can be seen in Table 1, there are considerable differences in the
ratings among industries, with the lowest CSP rated industry being refining, rubber, and plastic
(SIC 2891-3199) at -0.52. Other heavy manufacturing and extraction industries (e.g., mining,
construction at -0.22, chemicals and pharmaceuticals at -0.15 and containers, steel, and heavy
manufacturing at -0.14) also rated considerably lower than less manufacturing intensive
industries, which scored much higher on the CSP rating (e.g., banking and financial services at
0.13 and wholesaling and retailing at 0.11). Note from Table 1 that most industries (9 out of 13)
were rated below 0 on the overall CSP scoring and that only those industries not engaged in
activities as likely to have significant CSP consequences (e.g., environmental impact or
Post-print version of an article published in Strategic Management Journal 18(4): 303-319 (1997 April). doi: 10.1002/(SICI)1097-0266(199704)18:4<303::AID-SMJ869>3.0.CO;2-G
16
community, employee, and product-related issues) were rated positively on overall CSP. These
descriptive results indicate the importance of controlling for industry in the assessment of the
relationship between financial and CSP performance.
Table 3 shows the panel's weighting of the CSP attributes in the KLD database. As can
be seen, employee relations, product, community relations, environment, and treatment of
women and minorities (now called diversity) were considered more important than the three
issues of nuclear power, military contracts, and South Africa, which today would likely not be
considered important at all. The data are from 1990, however, when South Africa was still an
issue. These panelist ratings are consistent with other research on stakeholder rankings of the
KLD data (Ruf et al., 1993; Graves and Waddock, 1994) as well as assessments of the validity of
the KLD rankings compared to other potential measures of CSP (e.g., Sharfman, 1993).
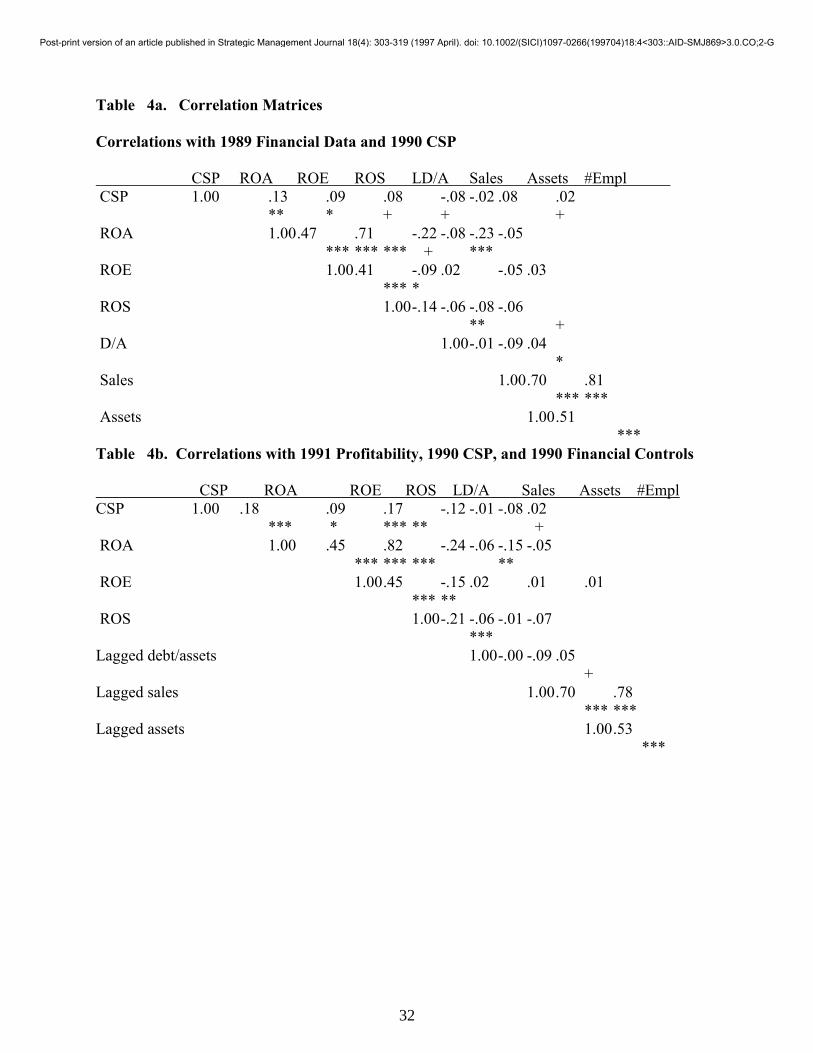
Table 4 provides the correlation matrices for the key variables. Table 4a shows 1989
financial data and 1990 CSP. These data were used for the models which treated CSP as the
and 1990 CSP and financial controls. These data were used for the models which treated
financial performance (profitability) as the dependent variable. Note first that CSP is positively
and significantly correlated at p<.10 or better with all three of the financial performance
measures (ROA--return on assets; ROE--return on equity; ROS--return on sales) for the 1989
financial data, and with those measures at the p<.05 level or better for the correlations with the
1991 financial data. Further, we can see from Table 4 that the three financial variables are
highly correlated with each other (at P<.001 for all three variables), as would be expected.
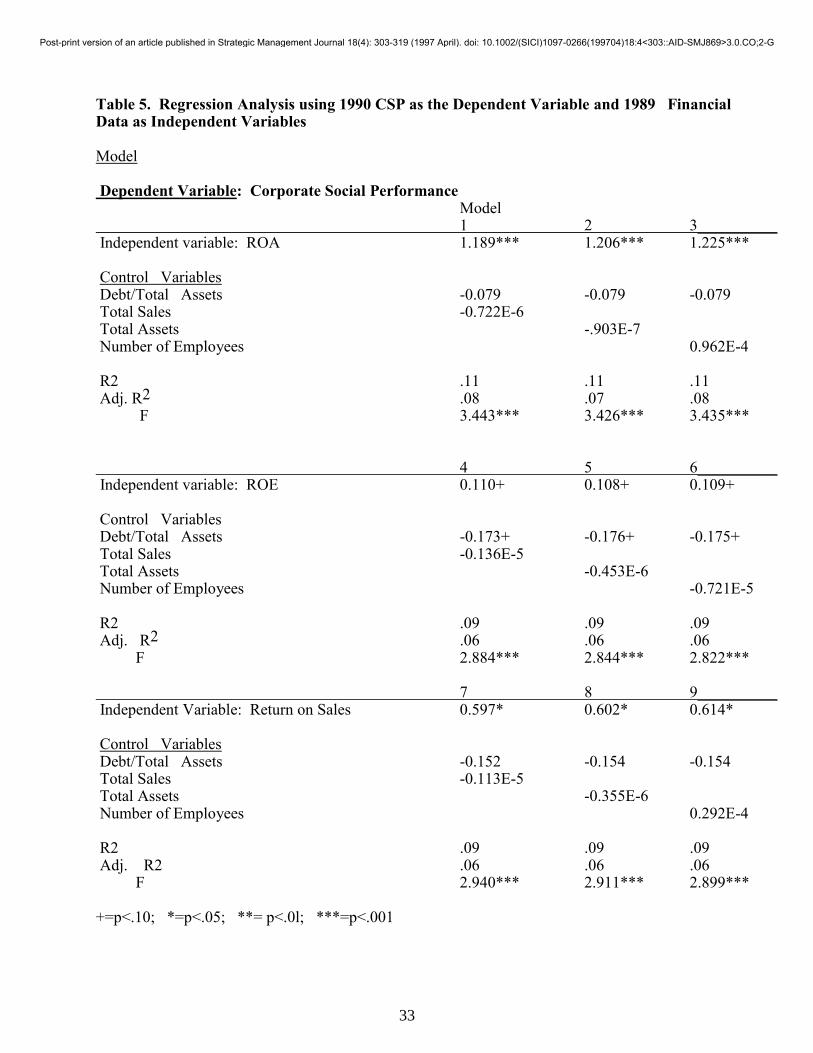
Table 5 presents the results of the regression analysis using CSP as the dependent
variable and financial performance as the independent variable, controlling for debt, size, and
industry (industry controls are omitted from the table in the interest of space), using a one-year
lag between the financial performance (1989 data) and the CSP measurement (1990 data). In all
nine of these models, corporate social performance is the dependent variable and measurement of
the key independent variable, financial performance, varies. Models 1-3 present the results using
Post-print version of an article published in Strategic Management Journal 18(4): 303-319 (1997 April). doi: 10.1002/(SICI)1097-0266(199704)18:4<303::AID-SMJ869>3.0.CO;2-G
17
return on assets (ROA) as the key independent variable and controlling for debt, industry, and
size (with size measured three ways, yielding the different models).
As can be seen (Table 5), each of the models is significant overall at the p<.001 level and
CSP as the dependent variable is seen to be strongly related to the ROA at P<.001 for all the
models as well. The results are less strong, but still significant at p<.10 when the financial
variable used is return on equity (ROE) (models 4-6) and at p<.05 when the independent
financial variable is return on sales (models 7-9). These results strongly support hypothesis 1,
which posits that better financial performance leads to improved CSP. CSP is negatively related
to debt-to-asset ratio in each of the first nine models, but is only significant (p<.10) when ROE is
used. Size shows no significant relationship in any of these models; its sign is negative in all but
two instances.
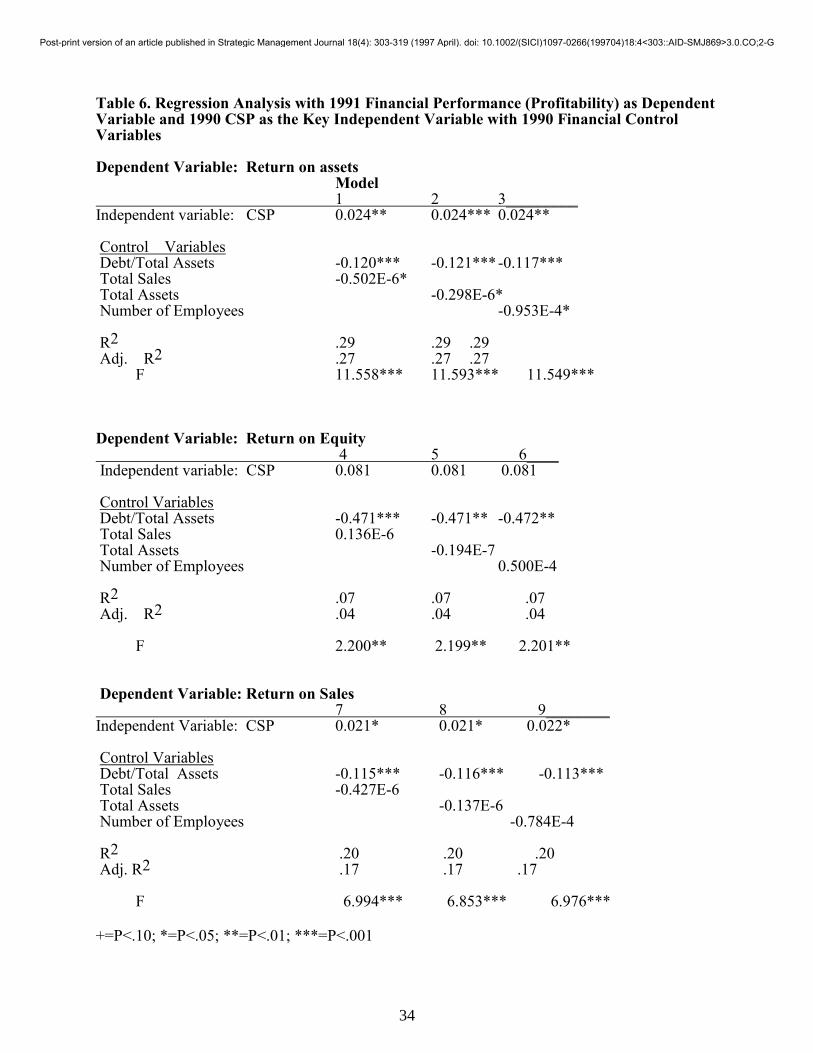
Our second hypothesis proposed that improved CSP results in improved financial
performance. Using a one-year lag for financial performance (1991 data) and the 1990 CSP data
(and 1990 financial control variables), we performed a set of regression analyses using the
financial performance variables, ROA, ROE, and ROS as the dependent variables and CSP as the
independent variable, while again controlling for debt, size (measured three ways), and industry.
As can be seen (Table 6), the results generally support the hypothesis that financial performance
depends on CSP. In the ROA models (models 1-3) there is a significant relationship between
ROA and CSP (p<.0l) when size is measured by sales; p<.001 when size is measured by total
assets; and p<.01 when size is measured by number of employees.
When profitability is measured by ROE, the relationship, while in the same direction, is
not significant (models 4-6), however, when the financial variable ROS is used, each model is
significant at the p<.05 level (models 7-9). In these models there is a consistently negative and
significant relationship between debt-to-asset ratio and CSP. The size effect is significantly
negative in the first three models, and negative in all but two cases.
Discussion and Conclusions
Post-print version of an article published in Strategic Management Journal 18(4): 303-319 (1997 April). doi: 10.1002/(SICI)1097-0266(199704)18:4<303::AID-SMJ869>3.0.CO;2-G
18
This study has attempted to address what has become a perennial question: whether
corporate social performance is linked to financial performance and, if so, in what direction the
causation runs. In undertaking the study, we are exploring whether or not strategic linkages exist
between CSP behaviors and financial performance. Using a greatly improved source of CSP
assessment, we evaluated the linkage between financial and social performance when CSP was
both a dependent and independent variable. Our data set included most of the Standard and
Poors 500 firms.
In support of those studies that have found positive linkages in the past (e.g., Cochran and
Wood, 1984; McGuire et al., 1988, 1990; Aupperle et al., 1985), we found, using this improved
measure, that CSP does depend on financial performance and that the sign of the relationship is
positive. That is, in support of the slack resources theory, firms with slack resources potentially
available from strong financial performance may have greater freedom to invest in positive CSP.
Thus, it may well be that firms with available resources may chose to spend those resources on
"doing good by doing well," and that those resource allocations may result in improved CSP
overall.
Clearly, firms that are in financial trouble may have little ability to make discretionary
investments in traditional CSP activities such as philanthropy, while those doing well financially
have resources to spend in ways that may have more long-term strategic impacts, such as
investments in improved local schools or community conditions to improve a workforce. Such
resource allocations may be strategically linked to improvements in long-term image and
relationships with the communities with which it must interact. If, as will be discussed below,
CSP is redefined to encompass critical stakeholder relations, as the measure used in the present
study does, then expenditures on CSP activities are far from discretionary and may actually be
strategic because they encompass daily corporate life.
Further, we found (in a kind of simultaneous relationship) that financial performance also
depends on good social performance, suggesting that there is something about performing well in
social arenas that may be simply linked to good managerial practice. Thus, in support of what
Post-print version of an article published in Strategic Management Journal 18(4): 303-319 (1997 April). doi: 10.1002/(SICI)1097-0266(199704)18:4<303::AID-SMJ869>3.0.CO;2-G
19
we termed the "good management theory," firms may also "do well by doing good," to turn the
phrase used above. This finding provides support for researchers using the Fortune reputational
index in the past (McGuire et al., 1988, 1990; O'Bannon and Preston, 1993), who have implicitly
suggested that there may be a linkage between good management and good social performance.
A Virtuous Circle?
As we consider the relationship between the first and second hypothesis, we can begin to
speculate that wherever the cycle begins, whether in an initial availability of slack resources or in
initial attention to the social performance dimension, there may be a simultaneous and interactive
impact, possibly forming what we earlier termed a virtuous circle. The impact appears to be
positive: better CSP, based on these findings, seems to be positively related to better financial
performance, whichever measure we choose as the dependent variable. We interpret this finding
to mean that causation may run in both directions. That is, better financial performance may lead
to improved CSP. Also, better CSP may lead to improved financial performance, ceteris paribus.
The first finding, if upheld in future research, would be explained by the slack resources theory.
The second finding is somewhat more difficult to explain. At this point in the research,
we can forward only tentative, yet plausible, explanations. First, meeting stakeholder
expectations in advance of their becoming problematic may simply reflect proactive attention to
domains that others (Prahalad and Hamel, 1994) have recognized as becoming increasingly
important. Such concerns reflect a variety of stakeholder interests, thereby aligning stakeholder
interests more closely to the very definition of CSP than previous research has done and making
these stakeholder relations more prominent in the link to financial performance. Importantly, the
heavier weights in the CSP index are those that most closely represent critical stakeholders, such
as employees, customers, and community, while less directly stakeholder-related categories of
involvement in nuclear industries, military contracting, or South Africa receive considerably less
weight.
Post-print version of an article published in Strategic Management Journal 18(4): 303-319 (1997 April). doi: 10.1002/(SICI)1097-0266(199704)18:4<303::AID-SMJ869>3.0.CO;2-G
20
Alternatively, the positive finding may represent (at least initially) simple "posturing" on
the part of companies to improve their external reputations, possibly boost employee morale, and
improve investor relations, and hence may not be real at all. According to this explanation, good
managers may not be fully committed to improved CSP, but they may recognize that certain
benefits may be gained by appearing to support social performance goals. Such managers might
pursue social performance goals just enough to avoid significant bad publicity, but may do so at
a minimum investment. Although this possibility is somewhat obviated by the higher weights on
the key stakeholder relationships encompassed by the CSP measure, it does remain a possibility
until these relationships are explored in more depth.
Although the comprehensiveness of the KLD data on CSP mitigate somewhat the
posturing hypothesis because the data are gathered across such a wide range of activities and
behaviors, it is entirely possible firms wishing to appear socially responsible will initially engage
in posturing behaviors only to find that over time, they have actually institutionalized cultural or
strategic changes in what Mintzberg (1987) has termed emergent strategy. We can speculate, for
example, that CSP expenditures, whether derived from real strategic intent or posturing
behaviors, may, once implemented, result in actual improved attention to key external and
internal stakeholders, such as customers (via products that meet real needs), communities and the
environment, or employees, including women and minorities. Alternatively, they may provide
benefits beyond their costs that are eventually reflected in financial performance.
Our findings indicate minimally that attention to CSP arenas does not represent a
competitive disadvantage and may in fact be a competitive advantage. If, for example, better
performance along CSP dimensions allows companies to attract better employees more easily,
forego difficult and costly battles for site placement with communities or governmental officials,
or avoid payments of fines for environmental problems, then potentially we are changing the
definition of CSP so that it no longer represents a discretionary activity on the part of
management (Carroll, 1979), but is fundamentally linked to management performance itself.
Thus, stakeholder relations are corporate social performance in this new definition and
Post-print version of an article published in Strategic Management Journal 18(4): 303-319 (1997 April). doi: 10.1002/(SICI)1097-0266(199704)18:4<303::AID-SMJ869>3.0.CO;2-G
21
expenditures in key stakeholder domains become an important element of improved corporate
performance as well as improved CSP.
It is thus entirely possible that there are direct linkages between the overall quality of
management and CSP, with the clear implication that good CSP and good management may be
one and the same thing if CSP is measured and defined properly, that is, if CSP is defined in
terms of stakeholder relations considered critical to firm performance and not as simply
discretionary activities, such as philanthropy or corporate volunteerism. Even if CSP and quality
of management can be differentiated, the meaning-making that goes with creating strong social
performance may elicit greater loyalty to firms from two important constituencies: employees
and customers, while simultaneously providing at least certain categories of owners (i.e., those
with social concerns) even more reason to invest in a particular firm.
The data used in this study support that latter notion, indicating that it may pay to give
attention to dimensions of management that are normally outside of strict financial, productivity,
and efficiency considerations. The components of the CSP index encompass a range of social
concerns not always considered central strategic issues, but which can now be considered
important to performance (c.f., Prahalad and Hamel, 1994), when factors such as company size,
industry, and debt (or risk) level are taken into account. That is, good management and its
reflection in financial outcomes may also encompass the nature of products produced, a
company's posture with respect to the natural environment, its relations to employees, including
women and minorities, and its community relations, among others.
Implications for Future Research
Much remains to be learned about the relationship between CSP and financial
performance, which has been explored in the present study. For example, as more CSP data
become available it would be useful to determine whether or not the relationships that we have
examined hold consistently over time. Additionally, it would be useful to examine lags other
than the one-year time period used in the present study. Further, if quality of management is a
critical variable in financial outcomes, as the relationships identified in this study suggest, then
Post-print version of an article published in Strategic Management Journal 18(4): 303-319 (1997 April). doi: 10.1002/(SICI)1097-0266(199704)18:4<303::AID-SMJ869>3.0.CO;2-G
22
controlling for the quality of management while assessing the CSP-financial performance link
might also be beneficial. Such an approach would incorporate financial performance as part of
the measure of CSP, by recognizing that financial/market performance implicitly measures
treatment of a key stakeholder, the owner. Although, additional research is clearly necessary to
explore these specific relationships between the stakeholder categories and financial
performance, the findings here are suggestive of the need to alter current definitions of CSP to
bring them more closely into line with stakeholder relations (c.f., Wood & Jones, 1995;
Waddock, forthcoming) as the weighted index does.
Implications for Management
As strategic managers consider where to place their investments, they may wish to take
into account the results reported above. This study suggests that there is no detrimental impact
or penalty from allocating some resources towards corporate social performance (as has also
been recognized in earlier research, e.g., Graves and Waddock, 1994). In fact, it would seem
that such investments might be beneficial, especially if they improve key stakeholder relations.
This research indicates that good CSP may go beyond simple "good deeds" in excess of
normal strategic activity to encompass a panoply of stakeholder relations, simply because we
have used a broader measure of CSP than has traditionally been used in the past and because our
measure does both encompass and highly weight these stakeholders' concerns. Typically single
dimension, narrow measures (for example, philanthropic contributions, corporate volunteer
records, building pollution control devices in excess of mandate, or the building of day care
centers) have been used to assess CSP on the assumption that CSP isdiscretionary activity above
and beyond required daily activities. Thus, prior CSP research has been undertaken with an
assumption that CSP is an extra activity, an add-on to normal strategic and management decision
making, with reference to the normal activities of corporate life, (see Carroll, 1979, 1995 for an
articulation of this type of framing of CSP). The present research indicates that poor
performance in primary stakeholder domains, including environmental pollution (measured by
fines), poor labor relations, problematic products, and so on, may have significant deleterious
Post-print version of an article published in Strategic Management Journal 18(4): 303-319 (1997 April). doi: 10.1002/(SICI)1097-0266(199704)18:4<303::AID-SMJ869>3.0.CO;2-G
23
impacts on firm financial performance, thus linking CSP-stakeholder relations more tightly and
simultaneously allowing more in-depth exploration of the link to financial performance than has
been possible with more limited databases in the past.
Managers and scholars arguably need to broaden their understanding of the term
corporate social performance to encompass the on-going nature of activities of a firm with
respect to key stakeholders. If good management theory and the virtuous circle hold, as this
research begins to suggest, then CSP involves more than doing the extras: it is a way of doing
business. It may be true that firms with available resources sometimes go beyond minimum
expectations of good management to achieve sound stakeholder relations by investing in extras
that are traditionally associated with the slack-resources view of CSP. Nonetheless, if strong
performance is to continue, strategic managers must focus increasingly on the concerns of all
stakeholders.
Post-print version of an article published in Strategic Management Journal 18(4): 303-319 (1997 April). doi: 10.1002/(SICI)1097-0266(199704)18:4<303::AID-SMJ869>3.0.CO;2-G
24
References
Abbott, W.F., and R.J. Monsen. 1979. On the Measurement of Corporate Social Responsibility:
Self-Reported Disclosure as a Method of Measuring Corporate Social Involvement.
Academy of Management Journal, 22, 501-515.
Alexander, G., and R. Buchholtz. 1982. Corporate Social Responsibility and Stock Market
Performance, Academy of Management Journal, 21: 479-486.
Aupperle, K. E. 1991. The Use of Forced Choice Survey Procedures in Assessing Corporate
Social Orientation. In J. E. Post (Ed.), Research in Corporate Social Performance and
Policy, 12: 269-280.
Aupperle, K. E., A.B. Carrol, and J.D. Hatfield. 1985. An Empirical Examination of the
Relationship between Corporate Social Responsibility and Profitability. Academy of
Management Journal, 28 (2): 446-463.
Bartlett, C. A., and S. Ghoshal. 1994. Changing the Role of Top Management: Beyond Strategy
to Purpose. Harvard Business Review, November-December, pp. 79-88.
Belkaoui, A. 1980. The Impact of Socio-Economic Accounting Statements on the Investment
Decision: An Empirical Study. Accounting, Organizations and Society, 5(3): 263-283.
Bowman, E.H., and M. Haire. 1975. A Strategic Posture Toward Corporate Social
Responsibility. California Management Review, 18 (2), 49-58.
Burke, L., J.M. Logsdon, W. Mitchell, M. Reiner, and D. Vogel. 1986. Corporate Community
Involvement in the San Francisco Bay Area. California Management Review, XXVIII
(3), Spring, 122-141.
Carroll, Archie B. (1995). Stakeholder Thinking in Three Models of Management Morality: A
Perspective with Strategic Implications. in Juha Nasi (ed.), Understanding Stakeholder
Clarkson, M. B. E. 1991. Defining, Evaluating, and Managing Corporate Social Performance:
The Stakeholder Management Model. In J. E. Post (Ed.) Research in Corporate Social
Performance and Policy, 12: 331-358.
Cochran, P.L., and R.A. Wood. 1984. Corporate Social Responsibility and Financial
Performance. Academy of Management Journal, 27, 42-56.
Post-print version of an article published in Strategic Management Journal 18(4): 303-319 (1997 April). doi: 10.1002/(SICI)1097-0266(199704)18:4<303::AID-SMJ869>3.0.CO;2-G
25
Freeman, R. E., and D. R. Gilbert, Jr., 1989. Corporate Strategy and the Search for Ethics.
Englewood Cliffs, NJ: Prentice-Hall.
Friedman, M., 1970. Social Responsibility of Business. The New York Times Magazine,
September 13, by The New York Times Company.
Gephart, R. P., Jr. 1991. Multiple Methods for Tracking Corporate Social Performance: Insights
from A Study of Major Industrial Accidents. In J. E. Post (Ed.), Research in Corporate
Social Performance and Policy, 12: 359-385.
Graves, S.B., and S.A. Waddock, 1994. Institutional Owners and Corporate Social Performance.
Academy of Management Journal, 37 (4): 1035-1046.
Hamel, G., and C.K. Prahalad, 1989. Strategic Intent. Harvard Business Review, May-June, 63-
71,.
Ingram, R.W. 1978. An Investigation of the Information Content of (Certain) Social
Responsibility Disclosures. Journal of Accounting Research, 16: 2, 270- 285.
Lydenberg, S., A.T. Marlin, and S. Strub. 1986. Rating America's Corporate Conscience.
Reading, MA: Addison-Wesley.
Mahapatra, S. 1984. Investor Reaction to a Corporate Social Accounting. Journal of Business
Finance and Accounting, II (1), Spring: 29-40.
McGuire, J. B., A. Sundgren, and T. Schneeweiss. 1988. Corporate Social Responsibility and
Firm Financial Performance. Academy of Management Journal, 31 (4): 854-872.
McGuire, J.B., T. Schneeweiss, and B. Branch. 1990. Perceptions of Firm Quality: A Cause or
Result of Firm Performance. Journal of Management, 16 (1), 167180.
Mintzberg, Henry. (1987). "Five P's for Strategy" California Management Review. Fall,
(Reprinted in The Strategy Process: Concepts, Contexts, Cases, third edition, edited by
Henry Mintzberg and James Brian Quinn. Upper Saddle River, NJ: Prentice Hall, 1996).
Moskowitz, M. 1972. Choosing Socially Responsible Stocks. Business and Society, 1: 71-75.
O'Bannon, D.P., and L.E. Preston. 1993. The Corporate Social-Financial Performance
Relationship: A Typology and Analysis. Paper presented at the l993 Annual Meeting of
the Academy of Management, Atlanta, GA.
Porter, M. E. 1980. Competitive Strategy. Techniques for Analyzing Industries and
Competitors. New York: Free Press.
Post-print version of an article published in Strategic Management Journal 18(4): 303-319 (1997 April). doi: 10.1002/(SICI)1097-0266(199704)18:4<303::AID-SMJ869>3.0.CO;2-G
26
Prahalad, C.K., and G. Hamel. 1994. Strategy as a Field of Study: Why Search for a New
Paradigm? Strategic Management Journal, 15: 5-16.
Preston, L.E. 1978. Analyzing Corporate Social Performance-- Methods and Results. Journal of
Contemporary Business, 7 (1) 135- 150.
Preston, L.E. and J.E. Post. 1975. Measuring Corporate-Responsibility. Journal of General
Management, 2 (3): 45- 52.
Ruf, B., K. Muralidhar, and K. Paul. 1993, Eight dimensions of Corporate Social Performance:
Determination of Relative Importance Using the Analytical Hierarchy Process. Academy
of Management Best Papers Proceedings, Atlanta, Georgia.
Shane, P. B., and B.H. Spicer. 1983. Market Response to Environmental Information Produced
Outside the Firm. LVIII , (3) July: 521-536.
Spicer, B. H. 1978. Investors, Corporate Social Performance and Information Disclosure: An
Empirical Study. The Accounting Review, Llll (1), January: 94-111.
Teoh, H. Y., and G.Y. Shiu. 1990. Attitudes Towards Corporate Social Responsibility and
Perceived importance of Social Responsibility Information Characteristics in a Decision
Context. Journal of Business Ethics, 9: 71-77.
Ullman, A. H. 1985. Data in Search of a Theory: A Critical Examination of the Relationships
Among Social Performance, Social Disclosure, and Economic Performance of US Firms,
Academy of Management Review, 10: 3, 540557.
Von Winterfeldt, D., and W. Edwards 1986. Decision Analysis and Behavioral Research.
Cambridge: Cambridge University Press.
Waddock, S.A., and S.B. Graves. 1994. Industry Performance and Investment in R&D and
Capital Goods. The Journal of High Technology Management Research, 5 (1): 1-17.
Waddock, S.A. (forthcoming). Strategy, Structure, and Social Performance: Implications of the
W-Form Enterprise. Business and the Contemporary World.
Wokutch, R. E., and E.W. McKinney. 1991. Behavioral and Perceptual Measure of Corporate
Social Performance. In J. E. Post (Ed.), Research in Corporate Social Performance and
Policy, 12: 309-330.
Wolfe, R. 1991. The Use of Content Analysis to Assess Corporate Social Responsibility. In J.
E. Post (Ed.), Research in Corporate Social Performance and Policy, 12: 281-308.
Wolfe, R., and K. Aupperle. 1991. Introduction to Corporate Social Performance: Methods for
Evaluating an Elusive Construct. In J. E. Post (Ed.), Research in Corporate Social
Performance and Policy, 12: 265-268.
Post-print version of an article published in Strategic Management Journal 18(4): 303-319 (1997 April). doi: 10.1002/(SICI)1097-0266(199704)18:4<303::AID-SMJ869>3.0.CO;2-G
27
Wood, D. J. 199 la. Corporate Social Performance Revisited. Academy of Management
Review, 16 (4): 691-718.
Wood, D. J. 1991 b. Social Issues in Management: Theory and Research in Corporate Social
Performance. Journal of Management, 17 (2): 383-406.
Wood, D. J., and R. E. Jones (1995). Stakeholder Mismatching: A Theoetrical Problem in
Empirical Research on Corporate Social Performance. The International Journal of
Organizatonal Analysis, 3 (3), July, 229-267.
Post-print version of an article published in Strategic Management Journal 18(4): 303-319 (1997 April). doi: 10.1002/(SICI)1097-0266(199704)18:4<303::AID-SMJ869>3.0.CO;2-G
28
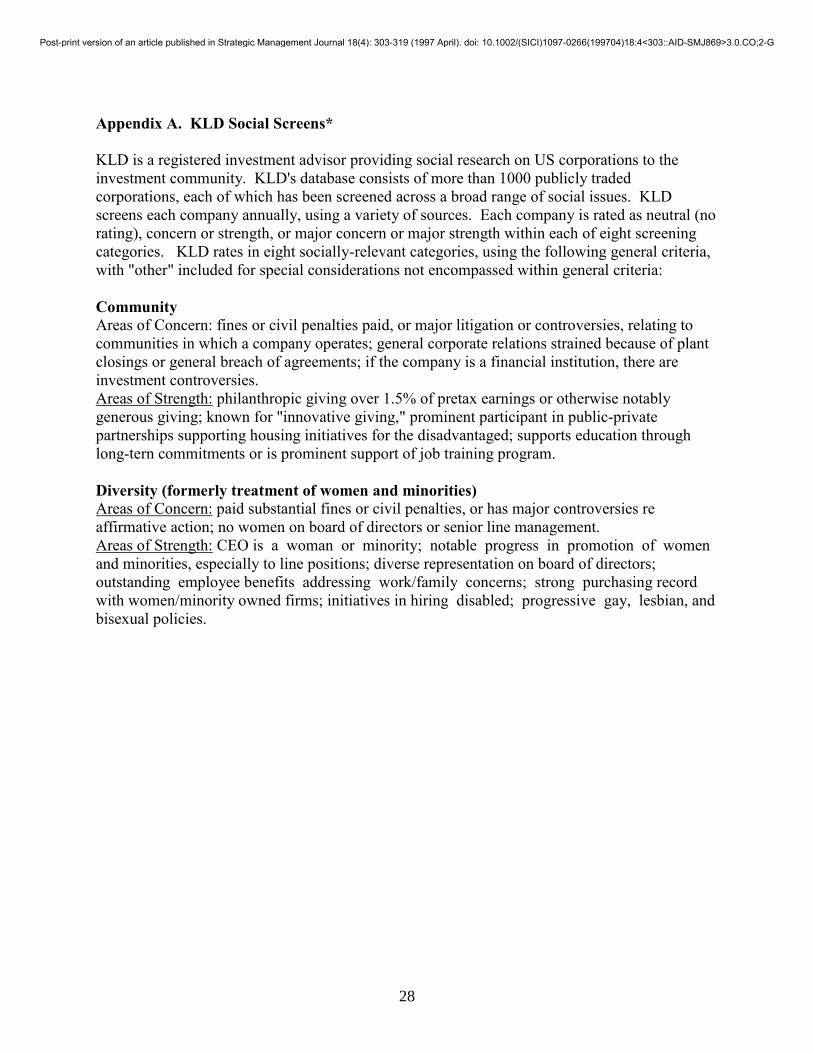
Appendix A. KLD Social Screens*
KLD is a registered investment advisor providing social research on US corporations to the
investment community. KLD's database consists of more than 1000 publicly traded
corporations, each of which has been screened across a broad range of social issues. KLD
screens each company annually, using a variety of sources. Each company is rated as neutral (no
rating), concern or strength, or major concern or major strength within each of eight screening
categories. KLD rates in eight socially-relevant categories, using the following general criteria,
with "other" included for special considerations not encompassed within general criteria:
Community Areas of Concern: fines or civil penalties paid, or major litigation or controversies, relating to
communities in which a company operates; general corporate relations strained because of plant
closings or general breach of agreements; if the company is a financial institution, there are
investment controversies.
Areas of Strength: philanthropic giving over 1.5% of pretax earnings or otherwise notably
generous giving; known for "innovative giving," prominent participant in public-private
partnerships supporting housing initiatives for the disadvantaged; supports education through
long-tern commitments or is prominent support of job training program.
Diversity (formerly treatment of women and minorities) Areas of Concern: paid substantial fines or civil penalties, or has major controversies re
affirmative action; no women on board of directors or senior line management.
Areas of Strength: CEO is a woman or minority; notable progress in promotion of women
and minorities, especially to line positions; diverse representation on board of directors;
outstanding employee benefits addressing work/family concerns; strong purchasing record
with women/minority owned firms; initiatives in hiring disabled; progressive gay, lesbian, and
bisexual policies.
Post-print version of an article published in Strategic Management Journal 18(4): 303-319 (1997 April). doi: 10.1002/(SICI)1097-0266(199704)18:4<303::AID-SMJ869>3.0.CO;2-G
29
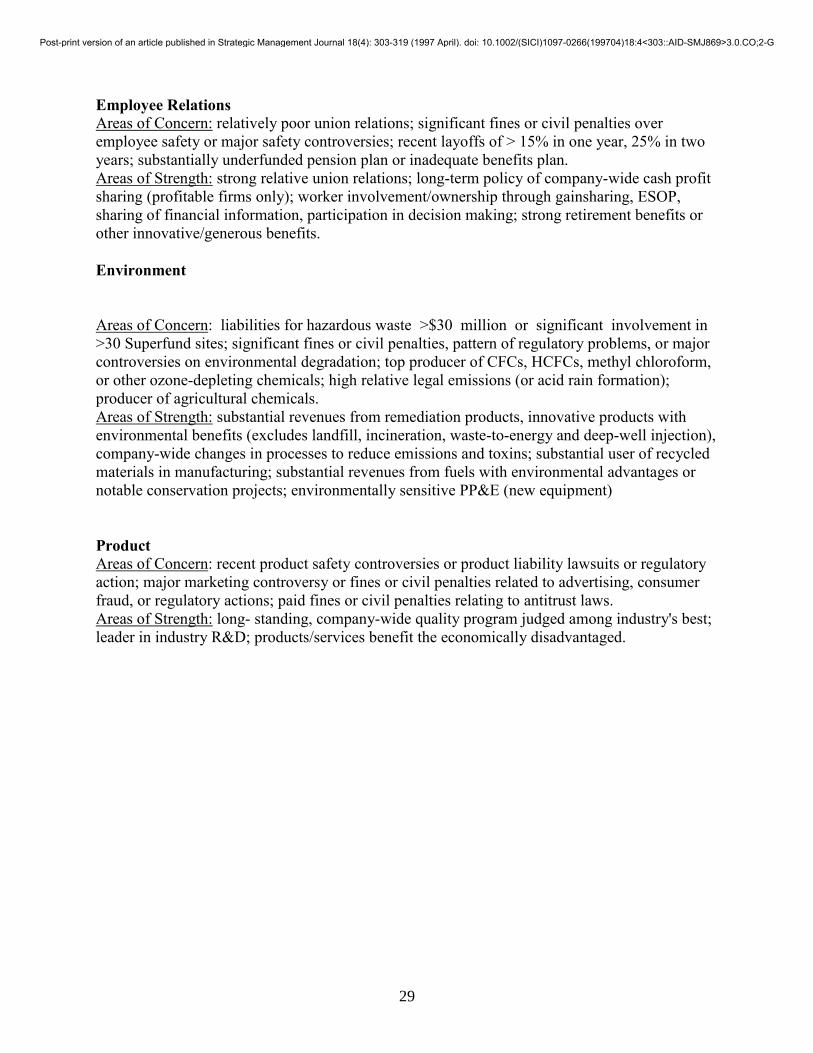
Employee Relations Areas of Concern: relatively poor union relations; significant fines or civil penalties over
employee safety or major safety controversies; recent layoffs of > 15% in one year, 25% in two
years; substantially underfunded pension plan or inadequate benefits plan.
Areas of Strength: strong relative union relations; long-term policy of company-wide cash profit
sharing (profitable firms only); worker involvement/ownership through gainsharing, ESOP,
sharing of financial information, participation in decision making; strong retirement benefits or
other innovative/generous benefits.
Environment
Areas of Concern: liabilities for hazardous waste >$30 million or significant involvement in
>30 Superfund sites; significant fines or civil penalties, pattern of regulatory problems, or major
controversies on environmental degradation; top producer of CFCs, HCFCs, methyl chloroform,
or other ozone-depleting chemicals; high relative legal emissions (or acid rain formation);
producer of agricultural chemicals.
Areas of Strength: substantial revenues from remediation products, innovative products with
environmental benefits (excludes landfill, incineration, waste-to-energy and deep-well injection),
company-wide changes in processes to reduce emissions and toxins; substantial user of recycled
materials in manufacturing; substantial revenues from fuels with environmental advantages or
notable conservation projects; environmentally sensitive PP&E (new equipment)
Product Areas of Concern: recent product safety controversies or product liability lawsuits or regulatory
action; major marketing controversy or fines or civil penalties related to advertising, consumer
fraud, or regulatory actions; paid fines or civil penalties relating to antitrust laws.
Areas of Strength: long- standing, company-wide quality program judged among industry's best;
leader in industry R&D; products/services benefit the economically disadvantaged.
Post-print version of an article published in Strategic Management Journal 18(4): 303-319 (1997 April). doi: 10.1002/(SICI)1097-0266(199704)18:4<303::AID-SMJ869>3.0.CO;2-G
30
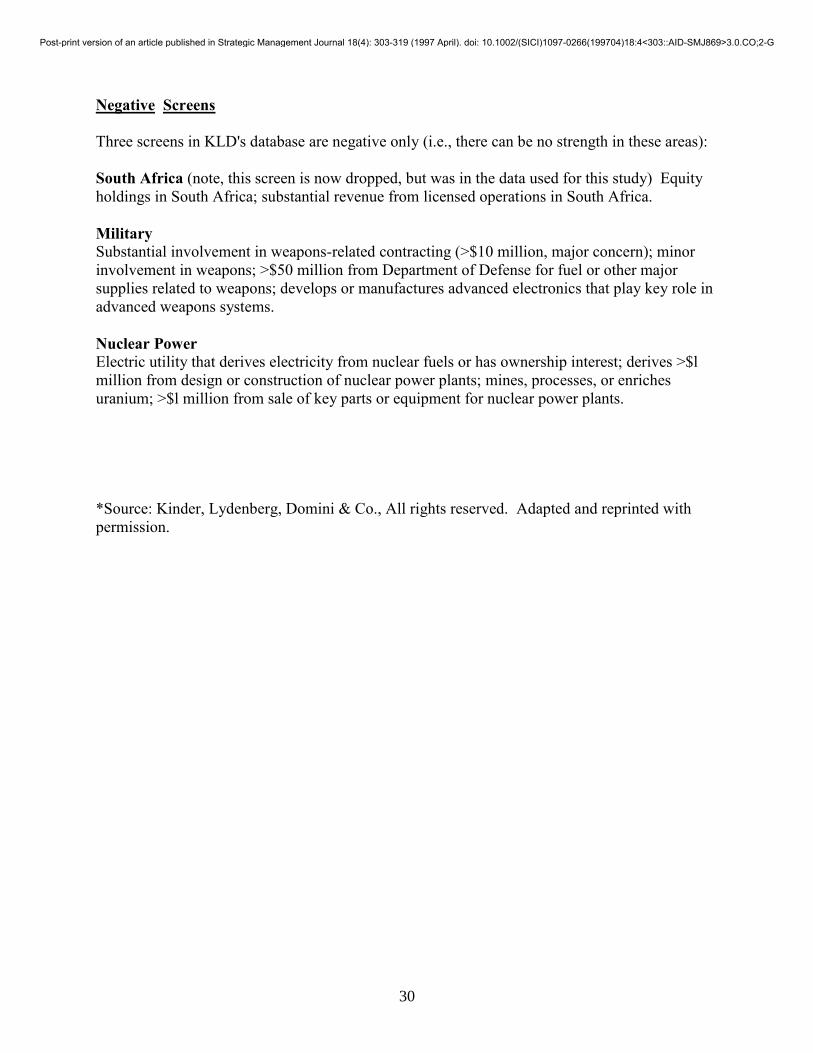
Negative Screens
Three screens in KLD's database are negative only (i.e., there can be no strength in these areas):
South Africa (note, this screen is now dropped, but was in the data used for this study) Equity
holdings in South Africa; substantial revenue from licensed operations in South Africa.
Military Substantial involvement in weapons-related contracting (>$10 million, major concern); minor
involvement in weapons; >$50 million from Department of Defense for fuel or other major
supplies related to weapons; develops or manufactures advanced electronics that play key role in
advanced weapons systems.
Nuclear Power Electric utility that derives electricity from nuclear fuels or has ownership interest; derives >$l
million from design or construction of nuclear power plants; mines, processes, or enriches
uranium; >$l million from sale of key parts or equipment for nuclear power plants.
*Source: Kinder, Lydenberg, Domini & Co., All rights reserved. Adapted and reprinted with
permission.
Post-print version of an article published in Strategic Management Journal 18(4): 303-319 (1997 April). doi: 10.1002/(SICI)1097-0266(199704)18:4<303::AID-SMJ869>3.0.CO;2-G
*These weightings represent the summary evaluations of a panel of three CSP experts of the
relative importance of each of the attributes included within the CSP index.
Post-print version of an article published in Strategic Management Journal 18(4): 303-319 (1997 April). doi: 10.1002/(SICI)1097-0266(199704)18:4<303::AID-SMJ869>3.0.CO;2-G
32
Table 4a. Correlation Matrices
Correlations with 1989 Financial Data and 1990 CSP
CSP ROA ROE ROS LD/A Sales Assets #Empl
CSP 1.00 .13 .09 .08 -.08 -.02 .08 .02
** * + + +
ROA 1.00 .47 .71 -.22 -.08 -.23 -.05
*** *** *** + ***
ROE 1.00 .41 -.09 .02 -.05 .03
*** *
ROS 1.00 -.14 -.06 -.08 -.06
** +
D/A 1.00 -.01 -.09 .04
*
Sales 1.00 .70 .81
*** ***
Assets 1.00 .51
***
Table 4b. Correlations with 1991 Profitability, 1990 CSP, and 1990 Financial Controls
CSP ROA ROE ROS LD/A Sales Assets #Empl
CSP 1.00 .18 .09 .17 -.12 -.01 -.08 .02
*** * *** ** +
ROA 1.00 .45 .82 -.24 -.06 -.15 -.05
*** *** *** **
ROE 1.00 .45 -.15 .02 .01 .01
*** **
ROS 1.00 -.21 -.06 -.01 -.07
***
Lagged debt/assets 1.00 -.00 -.09 .05
+
Lagged sales 1.00 .70 .78
*** ***
Lagged assets 1.00 .53
***
Post-print version of an article published in Strategic Management Journal 18(4): 303-319 (1997 April). doi: 10.1002/(SICI)1097-0266(199704)18:4<303::AID-SMJ869>3.0.CO;2-G
33
Table 5. Regression Analysis using 1990 CSP as the Dependent Variable and 1989 Financial Data as Independent Variables Model Dependent Variable: Corporate Social Performance Model 1 2 3__________ Independent variable: ROA 1.189*** 1.206*** 1.225*** Control Variables Debt/Total Assets -0.079 -0.079 -0.079 Total Sales -0.722E-6 Total Assets -.903E-7 Number of Employees 0.962E-4 R2 .11 .11 .11 Adj. R2 .08 .07 .08 F 3.443*** 3.426*** 3.435*** 4 5 6__________ Independent variable: ROE 0.110+ 0.108+ 0.109+ Control Variables Debt/Total Assets -0.173+ -0.176+ -0.175+ Total Sales -0.136E-5 Total Assets -0.453E-6 Number of Employees -0.721E-5 R2 .09 .09 .09 Adj. R2 .06 .06 .06 F 2.884*** 2.844*** 2.822*** 7 8 9__________ Independent Variable: Return on Sales 0.597* 0.602* 0.614* Control Variables Debt/Total Assets -0.152 -0.154 -0.154 Total Sales -0.113E-5 Total Assets -0.355E-6 Number of Employees 0.292E-4 R2 .09 .09 .09 Adj. R2 .06 .06 .06 F 2.940*** 2.911*** 2.899*** +=p<.10; *=p<.05; **= p<.0l; ***=p<.001
Post-print version of an article published in Strategic Management Journal 18(4): 303-319 (1997 April). doi: 10.1002/(SICI)1097-0266(199704)18:4<303::AID-SMJ869>3.0.CO;2-G
34
Table 6. Regression Analysis with 1991 Financial Performance (Profitability) as Dependent Variable and 1990 CSP as the Key Independent Variable with 1990 Financial Control Variables Dependent Variable: Return on assets Model 1 2 3_________ Independent variable: CSP 0.024** 0.024*** 0.024** Control Variables Debt/Total Assets -0.120*** -0.121*** -0.117*** Total Sales -0.502E-6* Total Assets -0.298E-6* Number of Employees -0.953E-4* R2 .29 .29 .29 Adj. R2 .27 .27 .27 F 11.558*** 11.593*** 11.549*** Dependent Variable: Return on Equity 4 5 6____ Independent variable: CSP 0.081 0.081 0.081 Control Variables Debt/Total Assets -0.471*** -0.471** -0.472** Total Sales 0.136E-6 Total Assets -0.194E-7 Number of Employees 0.500E-4 R2 .07 .07 .07 Adj. R2 .04 .04 .04 F 2.200** 2.199** 2.201** Dependent Variable: Return on Sales 7 8 9________ Independent Variable: CSP 0.021* 0.021* 0.022* Control Variables Debt/Total Assets -0.115*** -0.116*** -0.113*** Total Sales -0.427E-6 Total Assets -0.137E-6 Number of Employees -0.784E-4 R2 .20 .20 .20 Adj. R2 .17 .17 .17 F 6.994*** 6.853*** 6.976*** +=P<.10; *=P<.05; **=P<.01; ***=P<.001
Post-print version of an article published in Strategic Management Journal 18(4): 303-319 (1997 April). doi: 10.1002/(SICI)1097-0266(199704)18:4<303::AID-SMJ869>3.0.CO;2-G