24
SITARA Process JewelBox TM Key Features of a Good Process Capability Baseline Report Raghav S. Nandyal SITARA Technologies Pvt. Ltd. Chief Executive Officer [email protected]
| Date post: | 16-Aug-2015 |
| Category: |
Documents |
| Upload: | raghav-nandyal |
| View: | 3 times |
| Download: | 0 times |
SITARA Process JewelBoxTM
Key Features of a Good Process
Capability Baseline Report
Raghav S. Nandyal
SITARA Technologies Pvt. Ltd.
Chief Executive Officer

SITARA Process JewelBoxTM
OBJECTIVES
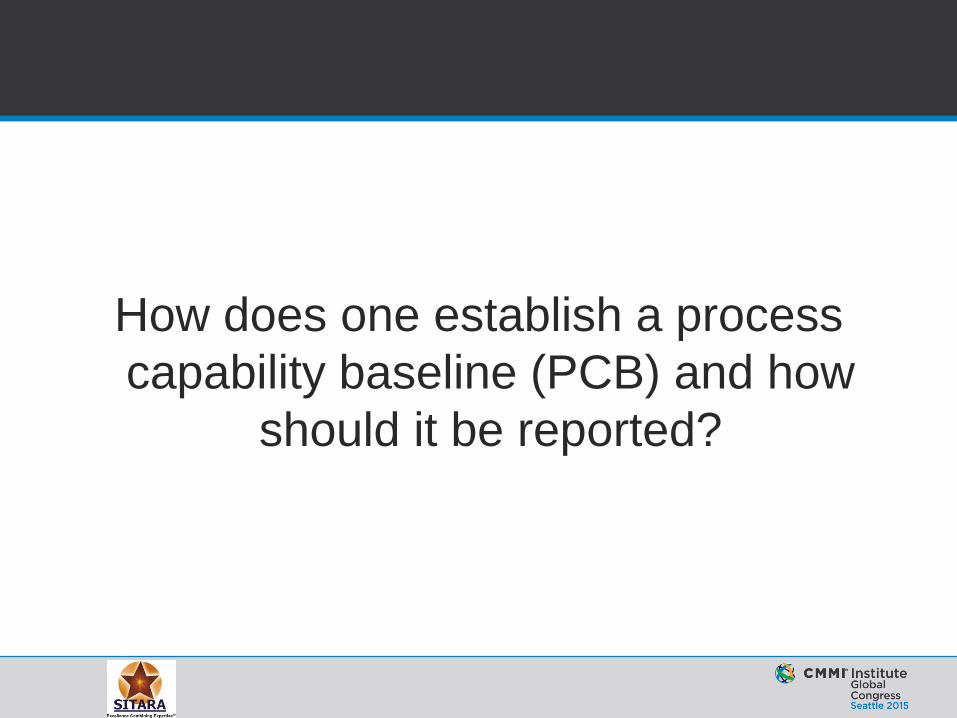
– How does one establish a process capability baseline
(PCB) and how should it be reported? • Think of a situation when standard formats to report financial
performance of a company did not exist; that is the current
situation with respect to reporting “process performance”
– What are the typical considerations that must be addressed
within a process capability baseline analysis report? • Key considerations in a PCB report is pure conjecture and the
format has remained unspecified
• As few as a 5-page report and, 90-pages on the high-end
– Three numbers become important in the context of high-
process maturity: what are they?
SITARA Process JewelBoxTM
Some Perspectives …
(1 of 3)
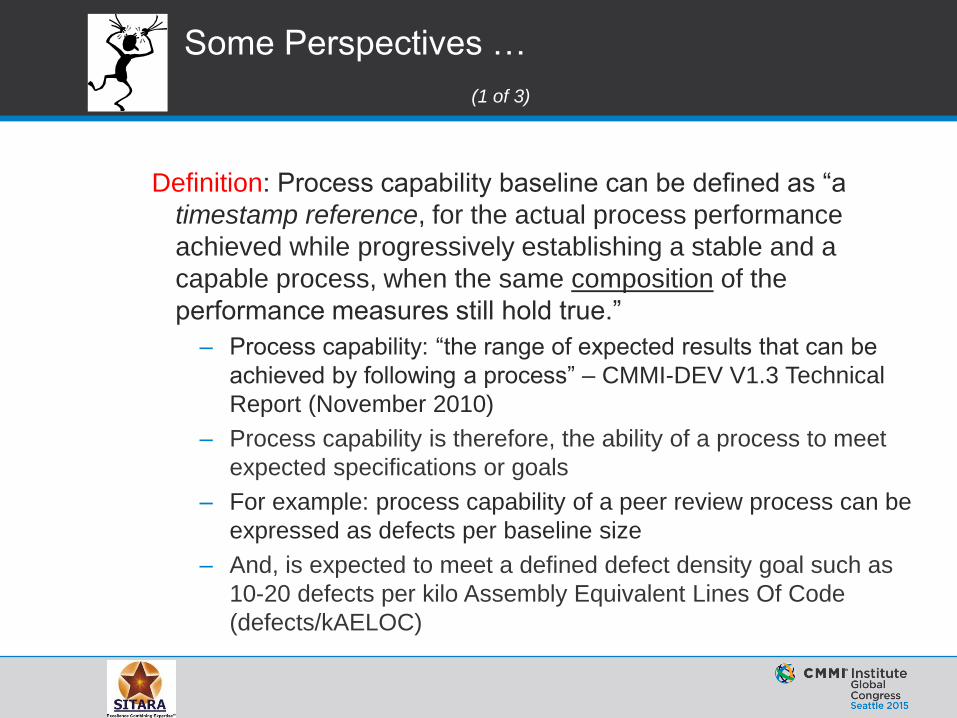
Definition: Process capability baseline can be defined as “a
timestamp reference, for the actual process performance
achieved while progressively establishing a stable and a
capable process, when the same composition of the
performance measures still hold true.”
– Process capability: “the range of expected results that can be
achieved by following a process” – CMMI-DEV V1.3 Technical
Report (November 2010)
– Process capability is therefore, the ability of a process to meet
expected specifications or goals
– For example: process capability of a peer review process can be
expressed as defects per baseline size
– And, is expected to meet a defined defect density goal such as
10-20 defects per kilo Assembly Equivalent Lines Of Code
(defects/kAELOC)

SITARA Process JewelBoxTM
Some Perspectives …
(2 of 3)
Process performance measures must be identified and defined for the core processes used to develop and maintain software, or in general, for “any solution”
Tracking three numbers become important in the context of high-
process maturity: business/organizational goal (G), predicted value (P) and actual value (A) of the process parameter
Objective behind studying the progression of process performance
is twofold: – One: to make sure that there is congruence among these three
numbers and – Two: to observe the trends of the actual and predicted values for
the key software metrics that requires to be controlled and take corrective actions
SITARA Process JewelBoxTM
Some Perspectives …
(3 of 3)
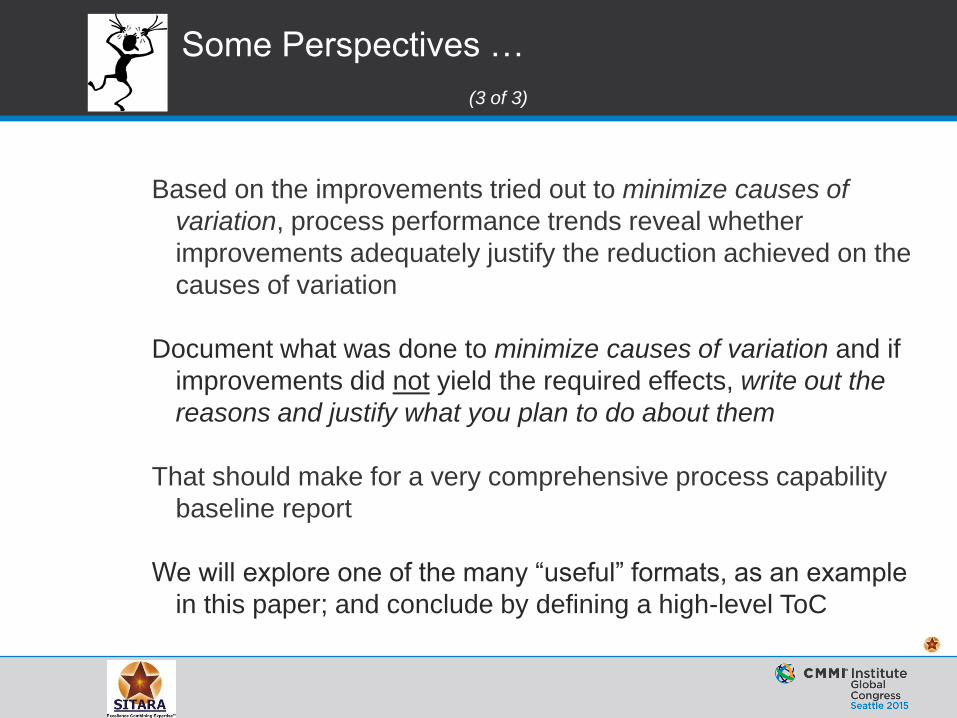
Based on the improvements tried out to minimize causes of
variation, process performance trends reveal whether
improvements adequately justify the reduction achieved on the
causes of variation
Document what was done to minimize causes of variation and if
improvements did not yield the required effects, write out the
reasons and justify what you plan to do about them
That should make for a very comprehensive process capability
baseline report
We will explore one of the many “useful” formats, as an example
in this paper; and conclude by defining a high-level ToC
SITARA Process JewelBoxTM
How does one establish a process
capability baseline (PCB) and how
should it be reported?
SITARA Process JewelBoxTM
How does one establish a PCB?
(1 of 4)
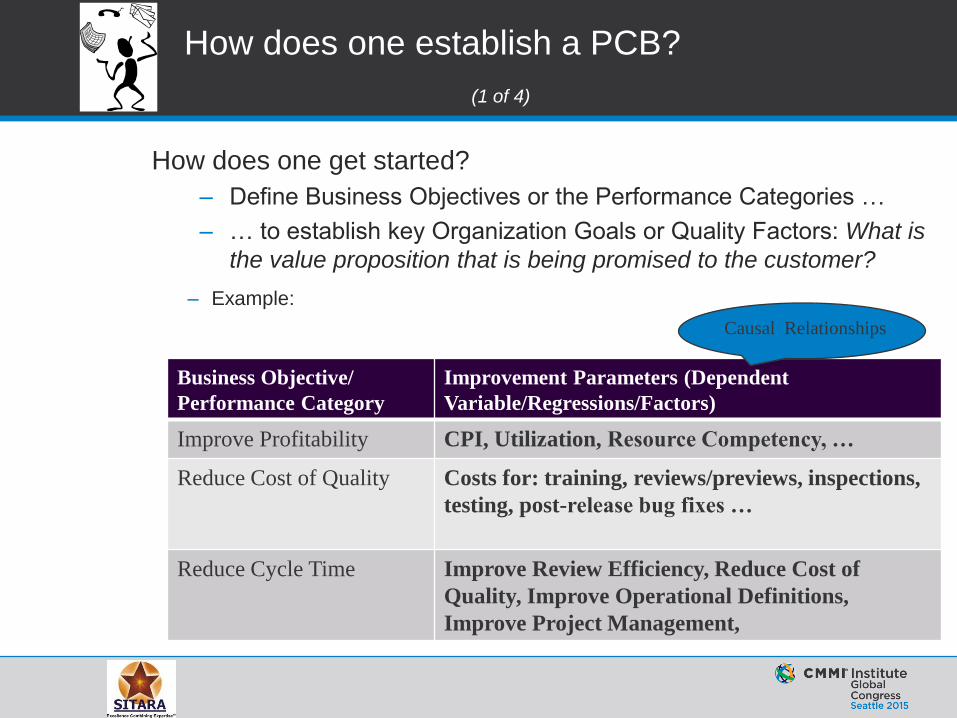
How does one get started?
– Define Business Objectives or the Performance Categories …
– … to establish key Organization Goals or Quality Factors: What is
the value proposition that is being promised to the customer?
– Example:
Business Objective/
Performance Category
Improvement Parameters (Dependent
Variable/Regressions/Factors)
Improve Profitability CPI, Utilization, Resource Competency, …
Reduce Cost of Quality Costs for: training, reviews/previews, inspections,
testing, post-release bug fixes …
Reduce Cycle Time Improve Review Efficiency, Reduce Cost of
Quality, Improve Operational Definitions,
Improve Project Management,
Causal Relationships

SITARA Process JewelBoxTM
How does one establish a PCB?
(2 of 4)
Using a Y-to-X tree establish an understanding of the
Controllable/Measurable Factors
– One of the key challenges: to ensure data collection, analysis,
storage and communication of results for process adjustments
and subsequent improvements are made part of the process itself
– Example: Reduce Cycle Time

SITARA Process JewelBoxTM
How does one establish a PCB?
(3 of 4)
Establish an understanding for “both” the necessary and
sufficiency conditions in order to establish the required
operational context
– Example:
Necessary Conditions Sufficiency Conditions
Identify competency development plans
to transition 10% of workforce from
“proficient level” to “expert level” over
the next X quarters
Competency assessments using formal
assessment centers for all “turn potential
assessments”
100% of projects must adhere to the
stated and implied requirements of the
defined process
Quarterly appraisals of process using
structured appraisal techniques ensuring
a minimum process compliance score of
85%
Attrition of critical talent at less than X% On time delivery > 95%, CPI >= 1.2

SITARA Process JewelBoxTM
How does one establish a PCB?
(4 of 4)
Establish contextual or the background information under which
circumstances, process measurements are being made and
capability analysis is being rendered
– Example:
Contextual Information Details
Standardized Project Execution
Environment
List common tools used for development,
testing, metrics collection and analysis …
Data Collection Who collects, competencies required for
analysis
Age of the metric Period of relevance (Quarter or monthly is best)
Project types or categories
(homogeneity is very important)
Development, maintenance, testing, Agile
development, other methodologies …

SITARA Process JewelBoxTM
What are the typical considerations that
must be addressed within a process
capability baseline analysis report?

SITARA Process JewelBoxTM
What are the typical considerations?
(1 of 2)
Since process performance baselines are derived based on past
performance data, accurate measurements from a
homogeneous group of projects, is essential
– How do we know we have a homogenous group?
• For the “group” of projects having a common
contextual information, compare the sample
means of the parameter of interest defining
commonality, say for instance: CoQ
• Ensure that there is no statistically significant
difference using One way ANOVA test
• If the P-value is greater than 0.05, it means that
there is no difference in the mean value of the
parameter of interest (there is 95% confidence)
• Therefore, the set of projects can be compared to
establish a NEW reference value of 19.90 without
losing accuracy

SITARA Process JewelBoxTM
What are the typical considerations?
(2 of 2)
Compare current quarter performance achievement with previous
quarter performance for the parameter of interest
– Example: Cost of Quality
– NOTE: Within a quarter/baseline period: It is as easy as checking if the 95%CI
includes the monthly sample mean for COQ
Clearly identify the contributors whose individual data is used for
providing this roll up summary – Example: Project 1 to Project 17
– Report detailed process characteristics for each of the organizational
performance parameter using a simple 4-steps process as follows
Metric Unit of measure
Q1 YYYY performance Q2 YYYY performance
Average Std. Dev. Sample Size
Min. Average Max. Std. Dev.
95% CI Mean
COQ % 13.88 0.97 9 17.98 19.90 21.82 1.35 19.02-20.78

SITARA Process JewelBoxTM
What is the 4-step process?
(1 of 4)
1. Establish that the process is
stable and capable–
– Key Point: every stable and capable process, can be made more stable and more capable
– Use control charts/time-series charts to analyze outliers
– Example: 5-Whys to arrive at a process cause
– Key Point: When using sample data, consider the mean value of a large number of observations from independent homogenous projects

SITARA Process JewelBoxTM
2. Understand the underlying
process distribution– – Key Point: Anderson-Darling
test of normality is the most widely used test by statistical software (E.g., Minitab)
– High p-value shows no statistically significant departure from normality
– Null hypothesis is that the data is normal – so a high p-value > 0.05 is indicative of a normal distribution
– Key Point: If the “statistical mean” of derived measures of a number of homogenous projects is used, there is no need for the normality test
What is the 4-step process?
(2 of 4)

SITARA Process JewelBoxTM
– Key Point: Every derived measure uses some combination of the basic metric data
– Key Point: A derived measure can itself be a combination of several phase-wise factors (sub-process control)
3. For a stable process identify the regressions and the residuals–
Key Point: Regressions or, the factors are picked based on
process knowledge, cost, risks and ease of measurement
Key Point: Residuals are a measure of the error in a model; difference between a fit (predicted value) and the actually observed value
What is the 4-step process?
(3 of 4)

SITARA Process JewelBoxTM
4. Generalize the regression into a model–
– Key Point: Statistical models help to tie process inputs with the process output using statistically relevant data
– Key Point: Models establish a structure using which, estimation and hypothesis testing are enabled
– Key Point: Model can be deterministic or predictive • Deterministic: simple math equation: E = mc2
• Probabilistic: Uses underlying probability distribution/density functions of random variables that defines the dependent variable
• Example: Z = A + P + F (for one sample of a project) • What if there are 10 samples from 10 different projects?
– For each project, Z = A + P + F may still be valid – Taken together, Z = 0.199 + 0.658 * A + 0.789 * P + 0.345 F + e – Regression model must be iteratively improved by fine-tuning it
using the “actual” value – Using large samples makes the regression equation better
What is the 4-step process?
(4 of 4)

SITARA Process JewelBoxTM
At least 3 numbers become important in
the context of high-process maturity:
what are they?
SITARA Process JewelBoxTM
3 Important Numbers …
(1 of 1)
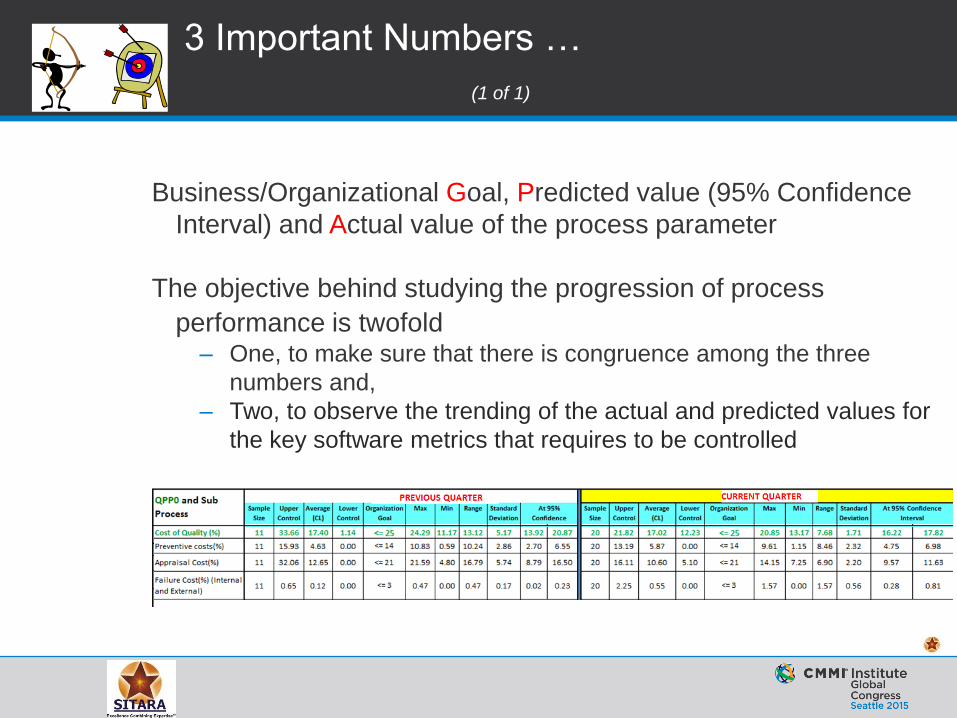
Business/Organizational Goal, Predicted value (95% Confidence
Interval) and Actual value of the process parameter
The objective behind studying the progression of process
performance is twofold – One, to make sure that there is congruence among the three
numbers and,
– Two, to observe the trending of the actual and predicted values for
the key software metrics that requires to be controlled
SITARA Process JewelBoxTM
One of the key challenges while designing a software process that
is positively enabled for process measurements is – – to ensure data collection, analysis, storage and communication of
results to relevant stakeholders for process adjustments and,
– subsequent improvements are made part of the process itself
Simple, yet accurate measures for phase-wise effort, schedule,
errors and defects from committed stakeholders is all it takes – A paper titled “Top 10 Software Metrics/Measures for every
Software Organization” is being presented by SITARA in this
conference (CMMI Institute Global Congress Seattle 2015)
– I invite you to attend the paper presentation/review the slides in
the proceedings
Conclusion
(1 of 3)

SITARA Process JewelBoxTM
It is important to realize that since process performance baselines
are derived based on past performance data, accurate
measurements from a homogeneous group of projects, is
essential
A well defined Process Capability Baseline (PCB) Analysis report
must – – highlight the current state of the process quantitatively, using data
and information from project execution within quarterly/monthly
intervals;
– effect pin-pointed quarter-on-quarter improvements to the process
with the objective of building process capability and improving
process stability; and
– facilitate decisions and management reviews at various levels in
the organization based on quantitative analysis to realize business
objectives
Conclusion
(2 of 3)
SITARA Process JewelBoxTM
Recommended Table of Contents for a Good Process Capability
Baseline (PCB) Analysis report
1 Organization Goals
2 Business Objectives
3 Process Performance Measures to achieve Business Objectives
4 Contextual or Background Information (Necessary & Sufficient Conditions)
5 Historical Process Performance Analysis of Performance Measures
6 Executive Summary showing Q-o-Q trends of Performance Measures
7 4-Step Process providing detailed views of Analysis of Current Data
8 Conclusions to effect pin-pointed improvements
9 Revision of Organizational Goals and Process Approach
Conclusion
(3 of 3)

SITARA Process JewelBoxTM
References
[Chrissis 2011] Chrissis, Mary Beth et al, “CMMI for
Development®: Guidelines for Process Integration and
Product Improvement, Third Edition”, Addison-Wesley
Professional. 2011
[Nandyal 2012] Nandyal, Raghav, “Building and Sustaining High-
maturity Software Organizations”, McGraw-Hill Education.
2012
[Nandyal 2012] Nandyal, Raghav, “How to Accelerate High-
Maturity Implementation of CMMI using Six Sigma”,
Proceedings of the 24th SEPG 2012. Albuquerque, NM USA
[Nandyal 2015] Nandyal, Raghav, “Top 10 Software
Metrics/Measures for every Software Organization”,
Proceedings of the CMMI Institute Global Congress 2015.
Seattle, WA USA

SITARA Process JewelBoxTM
Thank You!
DISCUSSIONS, Q&A
Raghav S. Nandyal Chief Executive Officer
SITARA Technologies Pvt. Ltd. SITARA Technologies #54, Sri Hari Krupa 435, Marshall Road 6th Main Road Southlake, TX 76092 Malleswaram USA Bangalore KA 560 003 INDIA
Telephone: +91.80.2334-3222 Mobile: +91.984-523-3222 Email: [email protected]
URL: http://www.SITARATECH.com


