Chapter 2 Nano-scale Force Spectroscopy Applied to Biological Samples Sandor Kasas, Charles Roduit, and Giovanni Dietler 2.1 Introduction The term force spectroscopy (FS), being widely used and somewhat broadly applied in the scientific community, can convey a rather misleading impression. In the framework of the present article, its use will be confined to the technique where measurements are made to study the behavior of a molecule or a system that is subjected to stretching or torsional forces. The number of published studies relating to this topic has notably increased during the recent years, a trend that reflects technical advancements in the means of manipulating single atoms or single molecules. FS is performed by applying a controlled pulling force to the molecule or system of interest. The force may be exerted optically [1], with magnetic tweezers [2], by the application of biomembrane force probes of hydrodynamic drag [3], via the mediation of fibers [4], or by the use of an atomic force microscope (AFM) [5]. The latter technique is the most commonly applied option. Conse- quently, this review will report mainly on AFM experiments. Similarly, since the vast majority of force-spectroscopy studies nowadays involve biological systems, these will be dealt in most detail. Biological entities, from single proteins to whole organisms, are continuously exposed to mechanical stress. Consequently, numerous force-resisting structures have been developed during the course of evolution. The physical principles that underlie the mechanical functions of proteins are still a subject of intensive investigation. Fortunately, FS now offers us an opportunity of exploring and understanding the molecular basis of the different solutions that have been selected by evolution. AFM-based FS permits an exploration of biological assemblies on different scales. This review article will open with a short introduction to the forces that act on the molecular scale and this will be followed by a brief description of the S. Kasas (*) Laboratoire de Physique de la Matie `re Vivante, EPFL, CH-1015 Lausanne, Switzerland e-mail: sandor.kasas@epfl.ch S. Carrara (ed.), Nano-Bio-Sensing, DOI 10.1007/978-1-4419-6169-3_2, # Springer Science+Business Media, LLC 201 23 1
Transcript
Chapter 2
Nano-scale Force Spectroscopy Applied
to Biological Samples
Sandor Kasas, Charles Roduit, and Giovanni Dietler
2.1 Introduction
The term force spectroscopy (FS), being widely used and somewhat broadly
applied in the scientific community, can convey a rather misleading impression.
In the framework of the present article, its use will be confined to the technique
where measurements are made to study the behavior of a molecule or a system that
is subjected to stretching or torsional forces. The number of published studies
relating to this topic has notably increased during the recent years, a trend that
reflects technical advancements in the means of manipulating single atoms or single
molecules. FS is performed by applying a controlled pulling force to the molecule
or system of interest. The force may be exerted optically [1], with magnetic
tweezers [2], by the application of biomembrane force probes of hydrodynamic
drag [3], via the mediation of fibers [4], or by the use of an atomic force microscope
(AFM) [5]. The latter technique is the most commonly applied option. Conse-
quently, this review will report mainly on AFM experiments. Similarly, since the
vast majority of force-spectroscopy studies nowadays involve biological systems,
these will be dealt in most detail.
Biological entities, from single proteins to whole organisms, are continuously
exposed to mechanical stress. Consequently, numerous force-resisting structures
have been developed during the course of evolution. The physical principles
that underlie the mechanical functions of proteins are still a subject of intensive
investigation. Fortunately, FS now offers us an opportunity of exploring and
understanding the molecular basis of the different solutions that have been selected
by evolution. AFM-based FS permits an exploration of biological assemblies on
different scales. This review article will open with a short introduction to the forces
that act on the molecular scale and this will be followed by a brief description of the
S. Kasas (*)
Laboratoire de Physique de la Matiere Vivante, EPFL, CH-1015 Lausanne, Switzerland
instrument and its working principles. Finally, FS experiments that have been
conducted using systems of increasing complexities from single-molecule stretch-
ing to protein–plasmalemma interactions will be described.
2.2 Forces on the Molecular Scale
The smallest forces that act on a molecule are of entropic origin and are generated
by thermal agitation. They represent the work that has to be undertaken to fully
stretch a polymeric molecule without deforming its chemical bonds. This polymeric
molecule spontaneously adopts a randomly coiled configuration, which maximizes
its configurational entropy. These forces are rather weak and typically involve
energies in the order of kBT, where kB is the Boltzman constant and T is the absolute
temperature. Bond lengths in the order of a nanometer are typically implicated, and
the resulting forces lie in the pN-range.
Noncovalent-interaction forces are stronger than the entropic ones and usually
involve van der Waals, hydrogen, or ionic bonding. A single noncovalent interac-
tion can be in the order of 10–100 pN. These are typically the forces that are needed
to break most of the receptor–ligand bonds encountered in biology and to deform
the internal structure of a molecule (e.g., secondary, tertiary, or quaternary structure
of a protein).
Covalent bonds are the strongest forces encountered on the molecular scale, and
they have a magnitude of approximately 1 nN. To deflect a typical AFM cantilever
by 1 nm, a force of 60 pN must be applied to its end. Hence, depending upon the
sensitivity of the instrument, all of the aforementioned forces lie within the mea-
surable range of an AFM.
2.3 The Atomic Force Microscope
The AFM was invented in 1986 [6] for the imaging of samples, and it soon became
popular among biologists. The reason thereof lies in the instrument’s potential to
“observe”, with an unprecedented vertical and lateral resolution, biological systems
that are immersed in a fluid (viz., under near-physiological conditions). The working
principle of the instrument can be summarized as follows. A very sharp tip, which is
fixed to the end of a cantilever, scans the sample. During the scanning, the interac-
tion forces between the atoms of the sample and the atoms of the tip-end bend the
cantilever. The vertical deflection of the cantilever is computationally correlated
with the x and the y-coordinates of the tip to yield the three-dimensional topography
of the sample. The tip and the cantilever are composed of silicon or silicon nitride
and are available in different sizes and shapes and with different spring constants.
Typically, the tips are pyramidal in shape with a base length of about 5 mm and an
apical radial curvature of less than 15 nm. Cantilevers can have either a triangular or
a rectangular form, with the longest-side lengths ranging from maximally 200 mm
24 S. Kasas et al.
down to 3 mm. Cantilevers with the smallest dimensions are used for high-speed
AFM imaging. The vertical position of the tip is detected by a laser beam, which is
reflected off the end of the cantilever. The beam terminates on a multi-segment
photodiode (2 or 4 components), which converts the light intensity into a current.
Variations in the illumination of the different segments of the photodiode are used by
the controlling computer to calculate the tip’s position along the z-axis. In most
instruments, sample scanning beneath the tip is achieved using piezo electric
crystals, which deforms in a predictable manner when exposed to a certain voltage.
The scanning process can be achieved by different means. In some microscopes, the
sample is moved in the x, y, and z-directions beneath an immobile tip. Instruments
that are used for the observation of large samples and that are designed to be
mounted above an inverted optical microscope are usually equipped with a tip that
can be moved above an immobile sample. A combination of these two options has
recently become available on the market: the sample is moved in the x and the
y-directions, while the tip is displaced only along the z-axis. This configuration
maximizes the scanning size and the displacement of the tip in the z-direction.The feature that renders the instrument particularly interesting for biological
applications is its capacity to operate equally well within vacuum, air, or fluid. By
virtue of special injection systems, near-atomic resolution can be preserved even
during the course of fluid exchange within the imaging chamber [7] (Fig. 2.1).
As aforementioned, the AFMwas originally developed to map the topography of
nonconducting samples. However, since 1992, the instrument has been shown to
be capable of probing also the mechanical properties of a sample, or its affinity for
e
d a
b
c
Fig. 2.1 The principal
components of an AFM: (1)
laser diode, (2) cantilever and
tip, (3) piezo and sample
(green), (4) mirror, (5)
photodiode
2 Nano-scale Force Spectroscopy Applied to Biological Samples 25
tip-attached molecules. This type of measurement is achieved by recording and
analyzing the so-called force–distance (FD) curves. These curves represent the
deformation of the cantilever during its approach toward and its withdrawal from
the sample. The mechanical properties of the sample are explored by pushing the tip
into the sample, which causes its indentation, and recording the deformation of the
cantilever during the process. If the sample is hard, the tip will not penetrate it, and
the in-contact region of the FD curve will be a straight line with a slope of 45�. If thesample is soft, the tip will penetrate it, and the in-contact region of the FD curve will
be flatter and of a more complex shape, which, in ideal cases, can be fitted to
the Hertz model. This model predicts the shape of the FD curve for a sample that is
flat, of infinite dimensions, isotropic, and homogeneous. For this mathematical
modeling, the shape of the tip and the spring constant of the cantilever must be
known. A comprehensive review of the factors that influence the shape of FD
curves has been published by Cappella [8].
The affinity between the tip (or between any chemical species attached to it) and
the sample can be deduced by careful examination of the retraction part of the
FD curve. After making contact with the sample, the tip retracts, and if no link
connects it to the sample, the cantilever recovers its resting position as soon the tip
leaves the surface. However, if the tip (or the chemical species that coats it)
interacts with the sample due to the existence of a strong attractive force or to the
establishment of a molecular link between the tip and the sample, the cantilever is
first deflected downwards. However, as soon as the retraction force of the cantilever
exceeds the rupturing point of the newly formed bond, the cantilever recovers its
resting position, which is maintained until the end of the FD curve.
If one knows the spring constant of the cantilever (viz., the constant that relates the
deflection of the cantilever to the restoring force that it generates) and its deformation
at the moment when the unbinding event occurs, then it is possible to calculate the
force that is required to detach the tip from the surface or to break the bond between
the tip-attached molecules and those on the surface of the sample (Fig. 2.2).
FD curves can be successively recorded all over the sample to yield a
force–volume (FV) image. To this end, an FD curve is recorded for each pixel that
composes the image. This type of imaging is extremely rich in information: a single
FV file can furnish data respecting the topography of the sample, its stiffness as a
function of depth, the position of a molecule of interest at its surface, and the
interaction force between this molecule and those attached to the tip.
The potential of the AFM has been greatly exploited in recent years to gain an
insight into numerous molecular phenomena in the fields of biology and biophysics,
such as protein folding and ligand–receptor affinity. In the following sections, some
of the domains in which the analysis of FD curves has significantly contributed to
our understanding of the bio-nano world will be reviewed. Several other fields of
investigation, which have been less successful to date, but are likely to benefit from
future developments in nanotechnology, are also mentioned.
26 S. Kasas et al.
2.4 Unzipping and Stretching of DNA Molecules
Because of its profound importance to life, DNA has been more intensively studied
than any other polymeric molecule. In living cells, certain proteins and drugs exert
forces that can unzip and stretch DNA molecules. The development of instruments
that permit the application of forces at a molecular level offers a unique opportunity
of mimicking these physiological and pharmacological interactions. An under-
standing of the way in which proteins can exert DNA-deforming forces is of
paramount importance in the fields of molecular biology, pharmacology, and
polymer sciences. Furthermore, in recent years, several applications of DNA have
been identified in the field of nanotechnology. These include its use as a molecular
handle in single-molecule experiments [9], as a building block for the self-assembly
of nanostructures [10], and as a base material for computing [11]. Hence, this field
would also benefit from an improved knowledge of the physical properties of DNA.
Experiments that havebeenconducted todisclose thepropertiesofDNAbyapplying
forces to it can be essentially divided into two categories: those that pull the molecule
along its axis, and those that unzip the molecule by pulling its two strands apart.
A study of the force-induced separation of double-stranded DNA is an important
step toward understanding the processes of transcription and replication.
The approach has been proposed as an alternative to the existing sequencing
methods, since a sensitive force probe, such as optical tweezers [12] or an
AFM [13], can accurately detect the binding strength between complementary
base-pairs during the unzipping process. Krautbauer et al. used the AFM to
sequence short DNA molecules with a resolution of 10 base-pairs. In these experi-
ments, complementary molecules of single-stranded DNA were chemically
attached to the AFM tip and to the substrate by their 50 and 30 ends, respectively.As the tip approached the substrate, complementary single strands came into
Force
Distance
0a
b
dc
Fig. 2.2 Graph depicting the four relevant sections of a typical force–distance (FD) curve:
(a) extension, (b) retraction, (c) in contact, (d) off-contact region
2 Nano-scale Force Spectroscopy Applied to Biological Samples 27
contact and double-stranded DNA was formed. As the tip was retracted from the
substrate, the newly formed double strand was opened in a zipper-like fashion.
The DNA sequence consisted of repeating blocks of 10 pure GC and 10 pure AT
base-pairs. Since base-pairs of AT and GC are characterized by different pairing
free energies (3.2 kT for AT and 5.2 kT for GC), the unzipping forces for the AT
and the GC blocks should differ by approximately 5–10 pN over a stretch of about
20–25 nm. The experimental data confirmed this theoretical prediction (Fig. 2.3).
However, this technique suffers from the serious limitation that an ever-
increasing amount of flexible, single-stranded DNA is created between the tip
and the unzipping site. The stiffness of the single-stranded DNA thus rapidly
dominates the FD curve, dramatically reducing the resolution of the instrument.
The stretching of double-stranded DNA along its axis can afford an insight into
the stability and the phase transitions of the molecule. DNA is known to exist in
different conformations, the B-form being the most common in living cells. How-
ever, if a force of about 65 pN is applied to the molecule, its contour length
increases by a factor of 1.7, with the result that the B-form is converted into an
over-stretched s-configuration [14–16].
Depending on which extremities of the DNA molecule are being pulled, the
helical configuration is either conserved (if both 50 ends are pulled) or transformed
into a ladder-like structure. By using an AFM to stretch different double-stranded
DNA molecules, the B- to S-transition has been shown to depend upon the specific
base-pairing in the double helix.
2.5 The Unfolding of Single Proteins
Proteins play a major role in all biological systems. Several of their functions are
more or less directly related to their static structure and/or to their dynamics.
Among the structural functions of proteins, conservation of the three-dimensional
Distance
Force
Fig. 2.3 Unzipping of complementary DNA oligonucleotides in the AFM (adapted from [13])
28 S. Kasas et al.
shapes of cells and cellular rigidity via the cytoskeleton involving actin, tubulin, or
intermediate filaments are the most obvious examples. Important dynamic func-
tions include muscular contraction, vesicular transport in neuronal cells, and
mechano-transduction in the inner ear. These functions are achieved by virtue of
the particular molecular assemblies that permit proteins to resist deformation or to
change their conformation under the influence of mechanical or chemical stimuli.
Unveiling the subtle arrangements that underlie these functions is necessary to
understand how biological systems operate and the reasons for their failure.
Knowledge about the atomic structure of a protein cannot throw any light on the
constituents that are important for its mechanical properties. This information can
be obtained only by applying a load to the protein and monitoring its pattern of
deformation. Such experiments can be conducted using various tools, such as
optical and magnetic tweezers. These devices can apply forces in the range of
1–100 pN to a single molecule. However, a survey of 7,500 proteins in a coarse-
grained molecular-dynamics model has revealed that the unfolding forces lie
between 0 and 350 pN [17]. The AFM operates precisely in this range of forces
and is therefore the ideal (or at least a most appropriate) tool to monitor the behavior
of proteins under force regimes that can unfold them completely and measure their
changes in length at an Angstrom-level of resolution. Table 2.1 compares the
specificities of various measurements made using optical tweezers, magnetic twee-
zers, and the AFM.
In a typical protein-unfolding experiment with the AFM, one end of the protein
of interest is first attached to AFM tip of the instrument, and the other end is fixed to
the substrate. Numerous techniques are available for anchoring the proteins to the
AFM tip and to the substrate, a comprehensive overview of which has been
published by Bizzarri and Cannistraro [18]. The measurement begins at the onset
of tip retraction, which stretches the suspended segment of the protein. During its
deflection downward, the cantilever applies a force to the protein, which is propor-
tional to its vertical deflection. The first source of resistance to the extension is an
entropic force, which tends to cause coiling up of the protein to maximize its
disorder. Extension of the molecule reduces its entropy and produces a restoring
force that bends the cantilever downwards. Knowing the spring constant of the
cantilever, its deformation can be calibrated and translated into force.
Table 2.1 Comparison of the different specificities of single-molecule manipulation techniques
2 Nano-scale Force Spectroscopy Applied to Biological Samples 29
A further extension of the protein may cause an unfolding of some of its
segments and an increase in its effective length. A sudden increase in the length
of the protein causes a drop in the force acting on the cantilever and its return to the
resting position. If the tip retraction continues and the protein contains other
segments that can unfold, the process is repeated unless the protein breaks or
detaches from the surface or the tip.
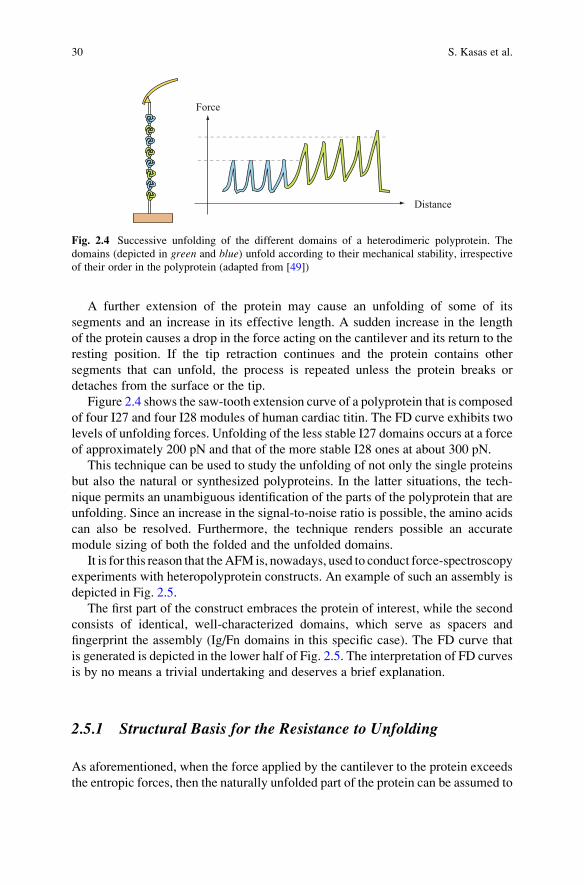
Figure 2.4 shows the saw-tooth extension curve of a polyprotein that is composed
of four I27 and four I28 modules of human cardiac titin. The FD curve exhibits two
levels of unfolding forces. Unfolding of the less stable I27 domains occurs at a force
of approximately 200 pN and that of the more stable I28 ones at about 300 pN.
This technique can be used to study the unfolding of not only the single proteins
but also the natural or synthesized polyproteins. In the latter situations, the tech-
nique permits an unambiguous identification of the parts of the polyprotein that are
unfolding. Since an increase in the signal-to-noise ratio is possible, the amino acids
can also be resolved. Furthermore, the technique renders possible an accurate
module sizing of both the folded and the unfolded domains.
It is for this reason that theAFM is, nowadays, used to conduct force-spectroscopy
experiments with heteropolyprotein constructs. An example of such an assembly is
depicted in Fig. 2.5.
The first part of the construct embraces the protein of interest, while the second
consists of identical, well-characterized domains, which serve as spacers and
fingerprint the assembly (Ig/Fn domains in this specific case). The FD curve that
is generated is depicted in the lower half of Fig. 2.5. The interpretation of FD curves
is by no means a trivial undertaking and deserves a brief explanation.
2.5.1 Structural Basis for the Resistance to Unfolding
As aforementioned, when the force applied by the cantilever to the protein exceeds
the entropic forces, then the naturally unfolded part of the protein can be assumed to
Distance
Force
Fig. 2.4 Successive unfolding of the different domains of a heterodimeric polyprotein. The
domains (depicted in green and blue) unfold according to their mechanical stability, irrespective
of their order in the polyprotein (adapted from [49])
30 S. Kasas et al.
be completely stretched. A characteristic unfolding then ensues, which leads to a
sudden increase in the contour length of the protein and to a sharp drop in the acting
force. The entropic elasticity of the unfolded portion of the protein can be formally
described by different models, such as the freely jointed chain model [3], the freely
rotating chain model [19], or the worm-like chain model [20]. The latter model is
more widely implemented than any other option in the AFM community. It predicts
that the stretch force (F) is related to the relative extension of the chain (x/L):
F xð Þ ¼ kT
A
1
4 1� xL
� �2 � 1
4þ x
L
!;
where A is the persistence length, which measures the chain’s bending rigidity, k isthe Boltzmann constant, T is the absolute temperature, x is the extension, and Lis the contour length of the polyprotein. The contour length (L) increases after eachunfolding event by an increment that equals the contour length in one of the
folded domains.
Molecular-dynamics simulations reveal that the resistance of a protein to a
force is determined principally by the topology of the molecule. Beta-sheets, in
Distance
Force
Fig. 2.5 The illustrated protein construct consists of five spacer domains (blue), which serves to
fingerprint and furnish the domain of interest (red). The five evenly spaced contour-length
increments, in green, are generated during the unfolding of the spacer domains, whereas the initial
red path is generated by the domain of interest (adapted from [52])
2 Nano-scale Force Spectroscopy Applied to Biological Samples 31
which the hydrogen bonds are simultaneously loaded in a shear-geometry, appear
to be more resistant to an externally applied force than the alpha-chains or
mixtures of alpha-chains and beta-sheets [21]. However, recent studies have
shown that even the load-resistance of beta-sheets is context-dependent and
reflects other parts of the protein. It should also be borne in mind that rupture
forces and extension lengths follow a distribution curve and that experimental
parameters such as temperature [22] or the nature of the solvent [23] can
influence the behavior of a protein. Pulling speed is also an important consider-
ation in this type of measurement, and an increase in this parameter will give rise
to an increase in the unfolding force [24]. This phenomenon will be discussed
more fully later in this article, but a brief explanation is warranted here. An
increase in the external force that is applied to a protein lowers the activation
barrier between the folded and the unfolded states within the time-span of the
experiment. Consequently, the thermal fluctuations exceed the unfolding barrier.
The dependence of the unfolding forces on the force-loading rate can be used to
estimate the unfolding rate constant, which represents the time that a domain
needs to unfold spontaneously (i.e., in the absence of an external force). The
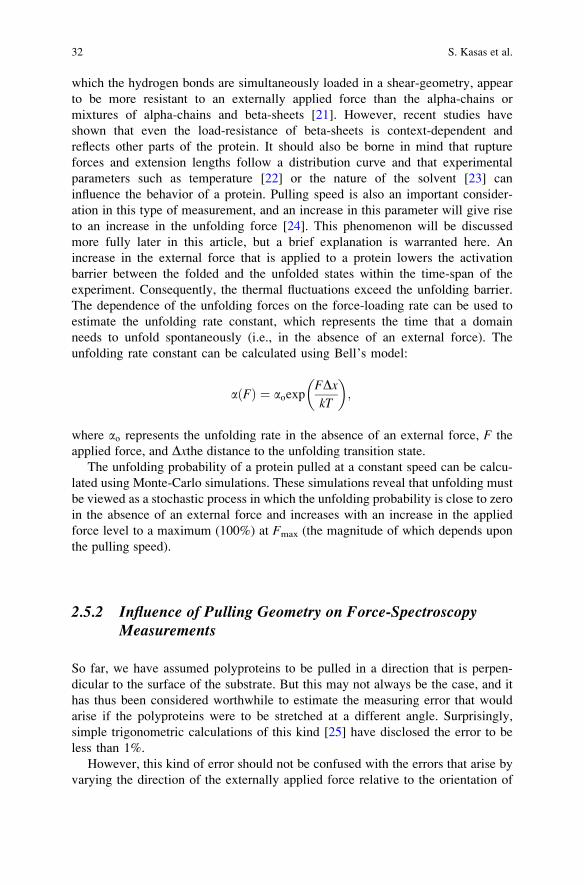
unfolding rate constant can be calculated using Bell’s model:
a Fð Þ ¼ aoexpFDxkT
� �;
where ao represents the unfolding rate in the absence of an external force, F the
applied force, and Dxthe distance to the unfolding transition state.
The unfolding probability of a protein pulled at a constant speed can be calcu-
lated using Monte-Carlo simulations. These simulations reveal that unfolding must
be viewed as a stochastic process in which the unfolding probability is close to zero
in the absence of an external force and increases with an increase in the applied
force level to a maximum (100%) at Fmax (the magnitude of which depends upon
the pulling speed).
2.5.2 Influence of Pulling Geometry on Force-SpectroscopyMeasurements
So far, we have assumed polyproteins to be pulled in a direction that is perpen-
dicular to the surface of the substrate. But this may not always be the case, and it
has thus been considered worthwhile to estimate the measuring error that would
arise if the polyproteins were to be stretched at a different angle. Surprisingly,
simple trigonometric calculations of this kind [25] have disclosed the error to be
less than 1%.
However, this kind of error should not be confused with the errors that arise by
varying the direction of the externally applied force relative to the orientation of
32 S. Kasas et al.
the polyprotein. Changes in this parameter can give rise to a much broader margin
of error [26].
2.5.3 Force-Ramp and Force-Clamp Measurements
Thus far, we have considered only constant-velocity measurements, which involve
pulling the protein at a constant speed until each of the various domains has
unfolded. On the one hand, this type of measurement furnishes precise information
relating to the end-to-end length of the polyprotein and to the positions of the
different barriers. On the other hand, force ramping [27] and force clamping [28]
involve feed-back loops to control the force that is applied to the molecule, thereby
permitting an easier determination of the folding and the unfolding rates.
In force-clamp spectroscopy, the polyprotein is held at a constant stretching
force. When a module of the protein unfolds, the global length increases and the
force (viz., the deflection of the cantilever) drops to zero. Since the feed-back
loop in this mode is programmed to keep the force constant, the tip moves rapidly
upward until the polyprotein is again stretched at the programmed force. This
cycle is repeated until each of the modules has unfolded or until the protein
detaches from the surface or the tip. One of the advantages of this technique is
that it permits a straightforward determination of the unfolding probability by
fitting a single exponential to the length versus time curve (Fig. 2.6).
In force-ramp spectroscopy, a linearly increasing force is applied to the
polyprotein by raising the tip at a predetermined, constant speed. When a module
Distance
Time
Fig. 2.6 Graph depicting a typical force-clamp measurement. The trace follows a characteristi-
cally staircase course, which reflects the stepwise unfolding of a single polyprotein (adapted
from [37])
2 Nano-scale Force Spectroscopy Applied to Biological Samples 33
of the polyprotein unfolds, the retraction force drops to zero and the feed-back
loop raises the tip rapidly until the force of the cantilever reaches the previous
value. The linearly increasing force is then once again applied until another
unfolding event occurs. The advantage of this technique is that it directly
measures the unfolding probability as a function of the force that is applied to
the protein (Fig. 2.7).
2.5.4 Refolding Studies
Force-clamp spectroscopy also permits monitoring of protein refolding at the
single-molecule level. In experiments of this kind, the protein is first unfolded at
a high force and then quenched at a lower one to permit refolding. Different types of
protein such as ubiquitin [29], titin [30], and titin-like molecules [31] have been
studied this way. Data gleaned from such experiments have revealed the different
phases of the refolding process.
2.5.5 The Unfolding of Titin
To date, the AFM has been used to probe the force-spectroscopic characteristics
of more than 50 different proteins. Notable examples include tenascin [32],
spectrin [33], ubiquitin [34], and fibrinogen [35]. However, no protein has been
more thoroughly investigated than titin. This circumstance is readily accounted for
by the fact that titin is the largest known naturally occurring protein. It was also the
first molecule to be investigated in FS by AFM [36]. Titin occurs within skeletal
and cardiac muscle, radiating from the z-line to the center of a sarcomere. Its
function can be likened to a spring that is charged to recoil the extended muscle
fibers. The bulk of its mass is represented by an assemblage of globular domains,
each of which is composed of immunoglobulin and fibronectin-type-III-like folds,
and which are connected by elastin-like units.
Distance
Time
ForceFig. 2.7 Graph depicting
a typical force-ramp
measurement during the
unfolding of a polyprotein
(adapted from [37])
34 S. Kasas et al.
Although several AFM studies have been performed using isolated molecules of
native titin, most of the experiments have been conducted on recombinant, region-
specific constructs. A comprehensive review of these investigations has been
published by Linke and Grutzner (2008) [37].
2.6 Measurement of Protein–Ligand Interactions
Protein–ligand interactions play a central role in biological processes. Recent
developments in the AFM now render possible a direct quantification of the range
and magnitude of the interactive forces operating between proteins and their
ligands. Hitherto, interactions of this kind were essentially described in terms of
the binding equilibrium, whereas now, they can be explored kinetically. This
kinetic information is not only necessary to elucidate the molecular mechanism
of the interaction, but is also important for the design of pharmacological agents.
Kinetic parameters that characterize protein–ligand interactions can be derived
from FD curves. To understand the rationale of this methodology, one has to
consider protein–ligand interaction as a molecular association with a limited life-
time. Even if no force is applied to pull the components of the complex apart, a
spontaneous dissociation will be ultimately effected by thermal fluctuations. If the
duration of the measurement exceeds the lifetime of the complex, then no unbind-
ing event will occur. But if a constant stretching force is applied to the complex, its
lifetime will be shortened, and it will dissociate more rapidly than it would in the
absence of the force. The application of a force to the complex lowers its energy
barrier, as depicted in Fig. 2.8.
The interaction force between a protein and its ligand depends greatly upon the
manner in which the external force is applied during the course of an experiment,
or, more precisely, upon the load rate, which is defined as the product of cantilever
stiffness and pulling speed. Lowering of the loading rate results in lowering of the
E(0)
E(F)
Energy
Distance
Fig. 2.8 Graph depicting the
energy barrier for the
dissociation of a
protein–ligand complex in the
absence (black line) orpresence (red line) of anexternally applied force
(adapted from [39])
2 Nano-scale Force Spectroscopy Applied to Biological Samples 35
interaction force. However, monitoring of unbinding force as a function of the
loading rate is not in itself a useful measurement. Nevertheless, this information can
be used to derive more meaningful thermodynamic and kinetic parameters, such as
the kinetic off-rate (Koff), which affords an insight into the formation of bonds, their
strength, and relaxation times. The kinetic off-rate is defined as:
Koff Fð Þ ¼ Koff 0ð Þ FxkTð Þ;
where k is the Boltzmann constant, T is the absolute temperature, and kT is the
thermal energy.
In practice, Koff is estimated by a first-order extrapolation of unbinding-force
measurements that are recorded at different loading rates, since the unbinding force
is usually linearly correlated with the logarithm of the loading rate.
If more than one barrier is involved, and if we assume that all barriers lie along a
single one-dimensional escape path, then the curve follows a continuous sequence
of linear regimes, as depicted in Fig. 2.9.
Using the AFM, loading rates ranging from 10 to 100 nN/s can be applied.
Outside this range, hydrodynamic instabilities arise. The plotting of unbinding
force against the logarithm of the loading rate permits an estimation of the dissoci-
ation rate at zero force [38].
The different steps that must be undertaken to estimate the Koff of a protein and
ligand pair are represented in Fig. 2.10. Initially, the protein is attached to the tip
and the ligand to the substrate (A), several thousand consecutive FD curves are then
recorded at different loading rates (B). The unbinding events must be identified on
the FD curves, and the corresponding unbinding force must be calculated. For each
loading rate, a histogram is then constructed in which unbinding events is repre-
sented as a function of the force (C). These data are fitted to a Gaussian or
Lorentzian curve to derive the value of the unbinding force for the protein–ligand
pair. Finally, the logarithms of the most probable unbinding-forces values are
plotted against the corresponding loading rate (D). The linear extrapolation of
this curve gives the Koff-value.
Numerous protein–ligand unbinding experiments have been conducted in the
AFM and a comprehensive review of this topic has been published by Lee et al.
Unbinding force
Loading rate
a b
Fig. 2.9 Graphs depicting
the relationship between the
unbinding force and the
logarithm of the loading rate
for a molecule with a single
energy barrier (a), and for one
with two such barriers (b)
barriers (adapted from [39])
36 S. Kasas et al.
(2007) [39]. One such study that is worth singling out here relates to the SNARE
complex [40], which plays an important role in neurotransmission. It participates in
the docking of neurotransmitter-filled vesicles and their fusion with presynaptic
membranes. In the reported AFM experiments, the physiological system was
simulated by anchoring some of the proteins onto the tip and several others onto
the substrate. The interaction forces and the Koffs-values for the different proteins
pairs that comprise the SNARE complex were calculated. Using these data, an
estimate was made of the number of complexes that is required to securely attach a
vesicle to the presynaptic membrane. The experimental set-up was also used to
follow on-line the tetanus-toxin-induced disruption of the SNARE complex.
2.7 Stretching of Single Polysaccharides in the AFM
Polysaccharides have diverse and important functions in nature. They serve as
building blocks in the construction of mechanically strong structures, as energy-
storage molecules, and as recognition and signaling intermediates. To gain an
Force
Distance
a
c d
b
Frequency
Loading rate
Force
Unbinding force
Loading rate
Fig. 2.10 Sequence of steps involved in deriving the Koff-value for a protein–ligand complex
form measurements in the AFM (adapted from [39, 51])
2 Nano-scale Force Spectroscopy Applied to Biological Samples 37
insight into the functional diversity of these molecules, it is necessary to analyze
their structures. The primary structure of all polysaccharides comprises an arrange-
ment of monosaccharides along the polymer chain. This mode of organization gives
rise to a degree of structural diversity that is reputedly three orders of magnitude
greater than is possible in proteins. Moreover, since the primary structure of
polysaccharides is not encoded in genetic material, evolutionary changes therein
cannot be effected as rapidly as with proteins.
Since 1997, AFM has been used to probe the elastic properties of single
polysaccharide chains [41]. In the first experiments of this kind, chains of carbox-
ymethylated dextran were mechanically stretched with a view to record the confor-
mational changes in the C5–C6 bond of the glucose unit. Among the published
studies, one in particular is worthy of mention here. It involved an attempt to
identify the composition of polysaccharide samples by mechanically stretching
individual, fluid-suspended molecules [42]. The FD curves that were collected
during the course of these experiments differed according to the different shapes
of the various length-normalized polysaccharides and could be used as fingerprints
to identify single molecules (Fig. 2.11).
For reviews of investigations in which the AFM has been used to characterize
the elastic properties of polysaccharides, the interested reader is referred to the
publications of Sletmoen et al. [43] and Abu-Lail and Camesano [44].
2.8 Extraction of Surface Molecules
The methodology that is used to unfold single proteins can also be applied to extract
proteins from the plasma membranes of living cells. In such experiments, the AFM
tip is coated with covalent cross-linkers against the extracellular domains of the
membrane proteins. When the tip approaches the cell, covalent bonds are formed
Force
Distance
Fig. 2.11 Elasticity
fingerprints of two linear
polysaccharides (adapted
from [43])
38 S. Kasas et al.
between the tip and the membrane proteins, and the maximal downward deflection
of the cantilever during its retraction path yields information respecting the extrac-
tion force. Such experiments were conducted for the first time by Ikai and Afrin in
2002 [45]. The extraction force lay most frequently in the range of 400–600 pN,
with little dependency on the loading rate. However, it should be borne in mind that
to extract a protein from the plasmalemma of a living cell, first it is necessary to
disrupt the hydrophobic bonds between the intramembranous portion of the protein
and the surrounding phospholipids, and then to pull out its intracytoplasmic
domain, which usually has a larger diameter than the intramembranous segment.
Finally, it is necessary to rupture the noncovalent interactions between the cyto-
plasmic domain of the protein and submembranous components, such as the
cytoskeleton as depicted on Fig. 2.12b.
2.9 Mapping of Surface-Membrane Molecules in Living Cells
If the AFM is programmed in such a way that the tip (or sample) is moved in the xy-plane after the acquisition of each set of FD curves, then it is possible to scan the
surface of the sample and to map the distribution of individual receptors with
a nanometric-scale resolution. The topography of the sample is resolved by
Force
Distance
Force
a b
Distance
Fig. 2.12 Extraction of a plasmalemmal protein from a living cell, using the AFM (adapted
from [53])
2 Nano-scale Force Spectroscopy Applied to Biological Samples 39
displaying the position of the tip as it contacts the sample (viz., by recording the
point at which the cantilever begins the upward deflection that follows the tip-
sample contact): such an image is depicted for a nerve cell in Fig. 2.13. During the
retraction part of the FD curve, specific unbinding events can be topographically
located. Typically, 16� 16 or 32� 32 FD curves are recorded for an area of a given
size, and are then analyzed to extract information relating to parameters such as the
tip-sample contact position and the location of binding–unbinding events between
the functionalized tip and the surface receptors in the sample. This recognition
imaging mode of the AFM has been successfully applied to erythrocytes and
osteoblasts, as well as to vascular endothelial, ovary, and yeast cells. A comprehen-
sive review of this topic has been published by Muller et al. [46].
Single-molecule mapping has been applied to reveal the distribution of fibro-
nectin-attachment proteins (FAPs) on the surface of mycobacteria [47]. These
proteins play an important role in the adhesion of bacteria and promote their
binding to fibronectin within the extracellular matrix of the host. If FAPs were
found to be homogenously distributed over the surface of the bacterium under
“physiological” conditions, then a dramatic change in this situation could be
induced by the application of an antibiotic.
A similar methodology has also been used to localize glycosylphosphatidylino-
sitol (GPI)-anchored proteins within the neurolemma of hippocampal neurons [48].
Although GPI-proteins are known to partition preferentially into cholesterol-rich
micro domains, their mechanical properties and sizes are still under debate. By
analyzing the in-contact region of FD curves, Roduit et al. were able to evaluate the
mechanical properties of the cell membrane as well as the sizes and the stiffnesses
of the microdomains. The image found in Fig. 2.13 simultaneously displays the
topography of an axon, its variations in surface stiffness (coded in false colors), and
the locations of GPI-anchored proteins.
Fig. 2.13 AFM image of an axon, revealing its surface topography, variations in its
surface stiffness (coded in false colors), and the locations of GPI-anchored neurolemmal proteins
(red arrows)
40 S. Kasas et al.
2.10 Conclusion
In this article, the applications of the AFM to biologically relevant questions are
briefly described. Biologically relevant systems that have been studied range from
the single-molecule level to the cellular scale. The tool permits the investigation of
the mechanical and elastic properties of proteins and of the kinetics of their
interactions with ligands. By these means, it is now becoming possible to gain a
truer insight into the relationships existing between biological activity and the
physical properties of living matter.
References
1. Ashkin, A. (1980) Applications of laser-radiation pressure. Science 210: 1081–1088.
2. Amblard, F., B. Yurke, A. Pargellis, et al. (1996) A magnetic manipulator for studying local
rheology and micromechanical properties of biological systems. Review of Scientific
Instruments 67: 818–827.
3. Smith, S. B., L. Finzi and C. Bustamante (1992) Direct mechanical measurements of the
elasticity of single DNA-molecules by using magnetic-beads. Science 258: 1122–1126.
4. Ishijima, A., T. Doi, K. Sakurada, et al. (1991) Sub-piconewton force fluctuations of
actomyosin in vitro. Nature 352: 301–306.
5. Florin, E. L., V. T. Moy and H. E. Gaub (1994) Adhesion forces between individual ligand-
receptorpairs. Science 264: 415–417.
6. Binnig, G., C. F. Quate and C. Gerber (1986) Atomic force microscopy. Physical Review
Letters 56: 930–933.
7. Kasas, S., L. Alonso, P. Jacquet, et al. (2010) Microcontroller-driven fluid-injection system
for atomic force microscopy. Review of Scientific Instruments 81.
8. Cappella, B. and G. Dietler (1999) Force-distance curves by atomic force microscopy. Surface
Science Reports 34: 1–104.
9. EssevazRoulet, B., U. Bockelmann and F. Heslot (1997) Mechanical separation of the
complementary strands of DNA. Proceedings of the National Academy of Sciences of the
United States of America 94: 11935–11940.
10. Yan, H., S. H. Park, G. Finkelstein, et al. (2003) DNA-templated self-assembly of protein
arrays and highly conductive nanowires. Science 301: 1882–1884.
11. Liu, Q. H., L. M. Wang, A. G. Frutos, et al. (2000) DNA computing on surfaces. Nature 403:
175–179.
12. Rief, M., H. Clausen-Schaumann and H. E. Gaub (1999) Sequence-dependent mechanics of
single DNA molecules. Nature Structural Biology 6: 346–349.
13. Krautbauer, R., M. Rief and H. E. Gaub (2003) Unzipping DNA oligomers. Nano Letters 3:
493–496.
14. Cluzel, P., A. Lebrun, C. Heller, et al. (1996) DNA: an extensible molecule. Science 271:
792–794.
15. Smith, S.B., Y. Cui, and C. Bustamante (1996) Overstretching B-DNA: the elastic response of
individual double-stranded and single-stranded DNA molecules. Science 271: 795-799.
16. Cocco, S., J. Yan, J. Leger, D. Chatenay and J.F. Marko (2004) Overstretching and force-
driven strand separation of double-helix DNA. Phys. Rev. E 70: 011910.
17. Sulkowska, J. I. and M. Cieplak (2007) Mechanical stretching of proteins – a theoretical
survey of the Protein Data Bank. Journal of Physics-Condensed Matter 19.
2 Nano-scale Force Spectroscopy Applied to Biological Samples 41
18. Bizzarri, A. R. and S. Cannistraro (2009) Atomic force spectroscopy in biological complex
formation: strategies and perspectives. Journal of Physical Chemistry B 113: 16449–16464.
19. Livadaru, L., R. R. Netz and H. J. Kreuzer (2003) Stretching response of discrete semiflexible
polymers. Macromolecules 36: 3732–3744.
20. Bustamante, C., J. F. Marko, E. D. Siggia, et al. (1994) Entropic elasticity of lambda-phage
DNA. Science 265: 1599–1600.
21. West, D. K., D. J. Brockwell, P. D. Olmsted, et al. (2006) Mechanical resistance of proteins
explained using simple molecular models. Biophysical Journal 90: 287–297.
22. Schlierf, M. and M. Rief (2005) Temperature softening of a protein in single-molecule
experiments. Journal of Molecular Biology 354: 497–503.
23. Dougan, L., G. Feng, H. Lu, et al. (2008) Solvent molecules bridge the mechanical unfolding
transition state of a protein. Proceedings of the National Academy of Sciences of the United
States of America 105: 3185–3190.
24. Evans, E. and K. Ritchie (1997) Dynamic strength of molecular adhesion bonds. Biophysical
Journal 72: 1541–1555.
25. Carrion-Vazquez, M., P. E. Marszalek, A. F. Oberhauser, et al. (1999) Atomic force micros-
copy captures length phenotypes in single proteins. Proceedings of the National Academy of
Sciences of the United States of America 96: 11288–11292.
26. Brockwell, D. J., E. Paci, R. C. Zinober, et al. (2003) Pulling geometry defines the mechanical
resistance of a beta-sheet protein. Nature Structural Biology 10: 731–737.
27. Marszalek, P. E., H. B. Li, A. F. Oberhauser, et al. (2002) Chair-boat transitions in single
polysaccharide molecules observed with force-ramp AFM. Proceedings of the National
Academy of Sciences of the United States of America 99: 4278–4283.
28. Oberhauser, A. F., P. K. Hansma, M. Carrion-Vazquez, et al. (2001) Stepwise unfolding of
titin under force-clamp atomic force microscopy. Proceedings of the National Academy of
Sciences of the United States of America 98: 468–472.
29. Fernandez, J. M. and H. B. Li (2004) Force-clamp spectroscopy monitors the folding
trajectory of a single protein. Science 303: 1674–1678.
30. Garcia-Manyes, S., J. Brujic, C. L. Badilla, et al. (2007) Force-clamp spectroscopy of single-
protein monomers reveals the individual unfolding and folding pathways of I27 and ubiquitin.
Biophysical Journal 93: 2436–2446.
31. Bullard, B., T. Garcia, V. Benes, et al. (2006) The molecular elasticity of the insect flight
muscle proteins projectin and kettin. Proceedings of the National Academy of Sciences of the
United States of America 103: 4451–4456.
32. Cao, Y. and H. B. Li (2006) Single molecule force spectroscopy reveals a weakly populated
microstate of the FnIII domains of tenascin. Journal of Molecular Biology 361: 372–381.
33. Rief, M., J. Pascual, M. Saraste, et al. (1999) Single molecule force spectroscopy of spectrin
repeats: low unfolding forces in helix bundles. Journal of Molecular Biology 286: 553–561.
34. Brujic, J., R. I. Z. Hermans, S. Garcia-Manyes, et al. (2007) Dwell-time distribution analysis
of polyprotein unfolding using force-clamp spectroscopy. Biophysical Journal 92:
2896–2903.
35. Brown, A. E. X., R. I. Litvinov, D. E. Discher, et al. (2007) Forced unfolding of coiled-coils in
fibrinogen by single-molecule AFM. Biophysical Journal 92: L39–L41.
36. Rief, M., M. Gautel, F. Oesterhelt, et al. (1997) Reversible unfolding of individual titin
immunoglobulin domains by AFM. Science 276: 1109–1112.
37. Linke, W. A. and A. Grutzner (2008) Pulling single molecules of titin by AFM – recent
advances and physiological implications. Pflugers Archiv-European Journal of Physiology
456: 101–115.
38. Schwesinger, F., R. Ros, T. Strunz, et al. (2000) Unbinding forces of single antibody-antigen
complexes correlate with their thermal dissociation rates. Proceedings of the National
Academy of Sciences of the United States of America 97: 9972–9977.
39. Lee, C. K., Y. M.Wang, L. S. Huang, et al. (2007) Atomic force microscopy: determination of
unbinding force, off rate and energy barrier for protein-ligand interaction.Micron 38: 446–461.
42 S. Kasas et al.
40. Yersin, A., H. Hirling, P. Steiner, et al. (2003) Interactions between synaptic vesicle fusion
proteins explored by atomic force microscopy. Proceedings of the National Academy of
Sciences of the United States of America 100: 8736–8741.
41. Rief, M., F. Oesterhelt, B. Heymann, et al. (1997) Single molecule force spectroscopy on
polysaccharides by atomic force microscopy. Science 275: 1295–1297.
42. Marszalek, P. E., H. B. Li and J. M. Fernandez (2001) Fingerprinting polysaccharides with
single-molecule atomic force microscopy. Nature Biotechnology 19: 258–262.
43. Sletmoen, M., G. Maurstad, P. Sikorski, et al. (2003) Characterisation of bacterial
polysaccharides: steps towards single-molecular studies. Carbohydrate Research 338:
2459–2475.
44. Abu-Lail, N. I. and T. A. Camesano (2003) Polysaccharide properties probed with atomic
force microscopy. Journal of Microscopy-Oxford 212: 217–238.
45. Ikai, A., R. Afrin, A. Itoh, et al. (2002) Force measurements for membrane protein manipula-
tion. Colloids and Surfaces B-Biointerfaces 23: 165–171.
46. Muller, D. J., M. Krieg, D. Alsteens, et al. (2009) New frontiers in atomic force microscopy:
analyzing interactions from single-molecules to cells. Current Opinion in Biotechnology 20:
4–13.
47. Verbelen, C. and Y. F. Dufrene (2009) Direct measurement of Mycobacterium–fibronectin
interactions. Integrative Biology 1: 296–300.
48. Roduit, C., G. van der Goot, P. de Los Rios, et al. (2008) Elastic Membrane Heterogeneity of
Living Cells Revealed by Stiff Nanoscale Membrane Domains. Biophysical Journal 94:
1521–1532.
49. Carrion-Vazquez, M., A. F. Oberhauser, T. E. Fisher, et al. (2000) Mechanical design of
proteins-studied by single-molecule force spectroscopy and protein engineering. Progress in
Biophysics and Molecular Biology 74: 63–91.
50. Greenleaf, W. J., M. T. Woodside and S. M. Block (2007) High-resolution, single-molecule
measurements of biomolecular motion. Annual Review of Biophysics and Biomolecular
Structure 36: 171–190.
51. Ikai, A. and R. Afrin (2003) Toward mechanical manipulations of cell membranes and
membrane proteins using an atomic force microscope – an invited review. Cell Biochemistry
and Biophysics 39: 257–277.
52. Puchner, E. M. and H. E. Gaub (2009) Force and function: probing proteins with AFM-based
force spectroscopy. Current Opinion in Structural Biology 19: 605–614.
53. Afrin, R. and A. Ikai (2006) Force profiles of protein pulling with or without cytoskeletal links
studied by AFM. Biochemical and Biophysical Research Communications 348: 238–244.
2 Nano-scale Force Spectroscopy Applied to Biological Samples 43