Revised 7/20 TM603 TECHNICAL MANUAL NanoBRET™ Target Engagement Intracellular Kinase Assay, Nonbinding Surface Format Instructions for use of Products N2500, N2501, N2520, N2521, N2530 and N2540
Transcript
Revised 7/20 TM603
T E C H N I C A L M A N U A L
NanoBRET™ Target Engagement Intracellular Kinase Assay, Nonbinding Surface FormatInstructions for use of Products N2500, N2501, N2520, N2521, N2530 and N2540
Promega Corporation · 2800 Woods Hollow Road · Madison, WI 53711-5399 USA · Toll Free in USA 800-356-9526 · 608-274-4330 · Fax 608-277-2516 1www.promega.com TM603 · Revised 7/20
2. Product Components and Storage Conditions .......................................................................................5
3. Before You Begin .................................................................................................................................73.A. Preparing NanoBRET™ Expression Vectors ..................................................................................73.B. Instrument Requirements and Setup ............................................................................................8
4. NanoBRET™ TE Intracellular Kinase Assay Protocols ............................................................................94.A. General Protocol for NBS format Assays without Regulator Co-Expression .....................................94.B. Transient Transfection of HEK293 Cells with Kinase-NanoLuc® Fusion Vector DNA ..................... 104.C. Preparing Cells with NanoBRET™ Tracer Reagent ...................................................................... 114.D. Adding Test Compounds ............................................................................................................ 124.E. NanoBRET™ Assay Protocol ..................................................................................................... 124.F. Determining BRET Ratio ........................................................................................................... 134.G. BRET Data Generated for Control Kinases Using NBS Format Assay Protocol ............................... 144.H. General Protocol for NBS Assays that Require Regulator Protein Co-Expression............................ 154.I. BRET Data for a Kinase-NanoLuc® Fusion Using a Regulatory Expression Vector with Tracer K-3 .. 17
5. Achieving Quantitative Analysis of Test Compound Affinity ................................................................... 19
7. Appendix .......................................................................................................................................... 237.A. Representative Target Engagement Data for Kinase-NanoLuc® Fusions and Assay Capabilities ....... 237.B. Comparable Compound Pharmacology with Different Tracers ...................................................... 267.C. Modifications to Tracer Preparation Workflow to Increase the Dispense Volume ........................... 277.D. Achieving Adequate Plate Mixing for 96-Well and 384-Well Formats ............................................ 277.E. Performing NanoBRET™ TE Assays in Alternative Plate Formats (ADH vs. NBS) .......................... 287.F. Preparing Stable Cell Lines Expressing NanoLuc® Fusion Proteins ............................................... 307.G. Extinction Coefficient of NanoBRET™ Tracers ............................................................................ 307.H. References ............................................................................................................................... 307.I. Related Products ...................................................................................................................... 31
8. Summary of Changes ......................................................................................................................... 32
All technical literature is available at: www.promega.com/protocols/ Visit the web site to verify that you are using the most current version of this Technical Manual.
E-mail Promega Technical Services if you have questions on use of this system: [email protected]
NanoBRET™ Target Engagement Intracellular Kinase Assay, Nonbinding Surface Format
2 Promega Corporation · 2800 Woods Hollow Road · Madison, WI 53711-5399 USA · Toll Free in USA 800-356-9526 · 608-274-4330 · Fax 608-277-2516TM603 · Revised 7/20 www.promega.com
1. Description
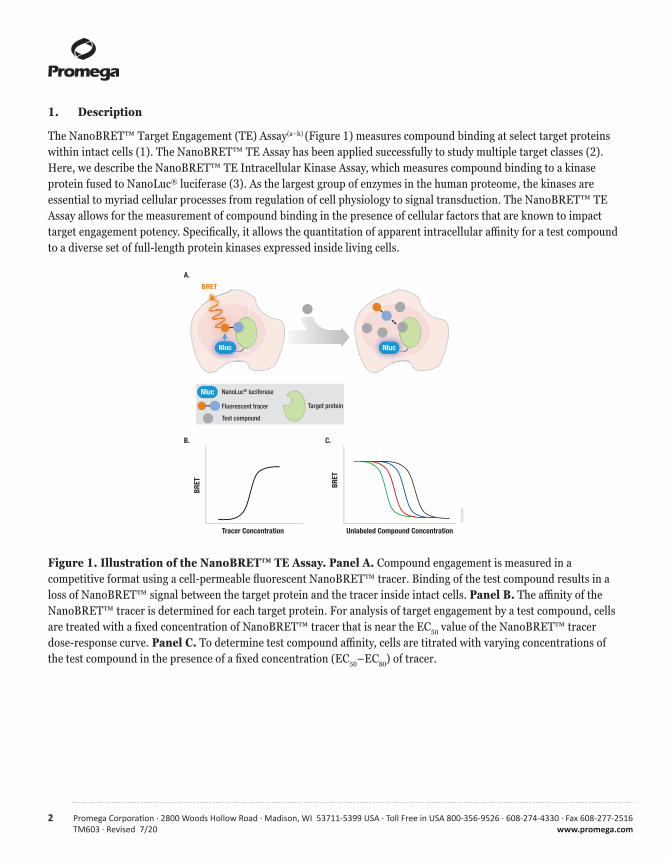
The NanoBRET™ Target Engagement (TE) Assay(a–h) (Figure 1) measures compound binding at select target proteins within intact cells (1). The NanoBRET™ TE Assay has been applied successfully to study multiple target classes (2). Here, we describe the NanoBRET™ TE Intracellular Kinase Assay, which measures compound binding to a kinase protein fused to NanoLuc® luciferase (3). As the largest group of enzymes in the human proteome, the kinases are essential to myriad cellular processes from regulation of cell physiology to signal transduction. The NanoBRET™ TE Assay allows for the measurement of compound binding in the presence of cellular factors that are known to impact target engagement potency. Specifically, it allows the quantitation of apparent intracellular affinity for a test compound to a diverse set of full-length protein kinases expressed inside living cells.
Figure 1. Illustration of the NanoBRET™ TE Assay. Panel A. Compound engagement is measured in a competitive format using a cell-permeable fluorescent NanoBRET™ tracer. Binding of the test compound results in a loss of NanoBRET™ signal between the target protein and the tracer inside intact cells. Panel B. The affinity of the NanoBRET™ tracer is determined for each target protein. For analysis of target engagement by a test compound, cells are treated with a fixed concentration of NanoBRET™ tracer that is near the EC50 value of the NanoBRET™ tracer dose-response curve. Panel C. To determine test compound affinity, cells are titrated with varying concentrations of the test compound in the presence of a fixed concentration (EC50–EC80) of tracer.
Promega Corporation · 2800 Woods Hollow Road · Madison, WI 53711-5399 USA · Toll Free in USA 800-356-9526 · 608-274-4330 · Fax 608-277-2516 3www.promega.com TM603 · Revised 7/20
This target engagement assay is based on the NanoBRET™ System, an energy transfer technique designed to measure molecular proximity in living cells (1). The NanoBRET™ TE Assay uses four key components: an expressed cellular target protein that is fused to the bright NanoLuc® luciferase; a cell-permeable fluorescent NanoBRET™ tracer that specifically binds to the target protein; a substrate for NanoLuc® luciferase; and an extracellular inhibitor for NanoLuc® luciferase. Bioluminescence resonance energy transfer (BRET) is achieved through a nonradiative transfer of the luminescent energy from NanoLuc® luciferase to the fluorescent tracer that is bound to the target protein- NanoLuc® fusion (Figure 1, Panels A and B). Compounds that are applied to the cells and specifically engage the intracellular target protein-NanoLuc® fusion will result in a dose-dependent decrease in BRET (Figure 1, Panels A and C) by competition with a fixed concentration of NanoBRET™ tracer. To ensure accurate assessment of intracellular target engagement, an extracellular NanoLuc® inhibitor is used to mitigate any NanoLuc® signal that may arise from cells compromised during handling, while not adversely affecting NanoLuc® luciferase expressed within healthy living cells.
The NanoBRET™ TE Assays have been optimized to use a blue-shifted NanoLuc® donor and a red-shifted fluorescent tracer acceptor (NanoBRET™ 590) that have minimal spectral overlap within the assay (Figure 2). This results in an optimized signal:background ratio and hence an optimized NanoBRET™ ratio.
Figure 2. Spectral separation of the NanoLuc® emission (460nm) and fluorescent tracer emission (618nm), and calculation of the NanoBRET™ ratio.
4000
0.1
0.2
0.3
0.4
0.5
0.6
0.7
0.8
0.9
1.0
450 500 550 600 650 700
Wavelength (nm)
Rela
tive
Inte
nsity
Acceptor signal
Donorsignal
Acceptor emissionDonor emission = BRET Ratio
1274
9TC
NanoBRET™ emission
BRET energy transferNanoLuc® luciferase
4 Promega Corporation · 2800 Woods Hollow Road · Madison, WI 53711-5399 USA · Toll Free in USA 800-356-9526 · 608-274-4330 · Fax 608-277-2516TM603 · Revised 7/20 www.promega.com
1. Description (continued)
This technical manual describes the legacy nonbinding surface (NBS) format of the NanoBRET™ TE Intracellular Kinase Assay (Figure 3). This assay format uses freshly harvested or suspended cells in an NBS assay plate that provides optimal performance for many tracers. Though the NBS workflow is slightly less efficient compared to the new preferred adherent (ADH) format of the assay (see Figure 3 for a comparison), it provides quality data using many tracers that are incompatible with conventional polystyrene or tissue-culture treated plates. This assay format is compatible with legacy tracers K-4 and K-5, providing validated assays for 126 kinases. Moreover, the NBS format may be compatible with many of the new NanoBRET™ tracers (K-3, K-8, K-9, K-10 and K-11) with revalidation of the assay. Lastly, this assay format is a strong option to consider for those interested in developing their own NanoBRET™ tracers, particularly if these custom tracers do not perform well in the preferred ADH format.
Figure 3. Overview of the NanoBRET™ Target Engagement Intracellular Assay. This technical manual describes the legacy Nonbinding Surface (NBS) format, compared to the adherent (ADH) format of the assay.
Storage Conditions: Store all NanoBRET™ TE Intracellular Kinase Assay components below −65°C. Alternatively, store the NanoBRET™ tracers below −65°C and all other components at –30°C to −10°C. Avoid multiple freeze-thaw cycles of the vector. We recommend aliquoting NanoBRET™ tracer components and avoiding more than 5 freeze-thaw cycles. Store all NanoBRET™ tracers, NanoBRET™ Nano-Glo® Substrate and Extracellular NanoLuc® Inhibitor protected from light.
Available Separately
NanoBRET™ Substrate/Inhibitor Reagents
P R O D U C T S I Z E C AT. #
Intracellular TE Nano-Glo® Substrate/Inhibitor 100 assays N2162
Intracellular TE Nano-Glo® Substrate/Inhibitor 1,000 assays N2160
Intracellular TE Nano-Glo® Substrate/Inhibitor 10,000 assays N2161
NanoBRET™ Tracers
P R O D U C T S I Z E C AT. #
NanoBRET™ TE Tracer K-4, 400µM 300µl N2492
NanoBRET™ TE Tracer K-5, 400µM 550µl N2482
Promega Corporation · 2800 Woods Hollow Road · Madison, WI 53711-5399 USA · Toll Free in USA 800-356-9526 · 608-274-4330 · Fax 608-277-2516 7www.promega.com TM603 · Revised 7/20
NanoBRET™ Kinase Target Engagement Assay Reagents
P R O D U C T S I Z E C AT. #
Tracer Dilution Buffer 50ml N2191
Transfection Carrier DNA 5 × 20µg E4881
Transfection Carrier DNA 2 × 100µg E4882
CC1 pan-Kinase Inhibitor 100µl N2661
3. Before You Begin
3.A. Preparing NanoBRET™ Expression Vectors
The amount of each vector DNA provided with the system is sufficient for a limited number of experiments. We strongly recommend that each vector is further propagated as transfection-ready (i.e., low-endotoxin) DNA. Due to the apparent toxicity of some kinase gene sequences, we recommend the use of E. coli strain JM109 for propagation of kinase-NanoLuc® fusion vectors. Follow standard protocols for plasmid transformation into E. coli for archival storage, vector propagation and tissue-culture-grade DNA preparation.
For each vector, the kinase-NanoLuc® fusion protein or regulatory protein is constitutively expressed by a CMV promoter and includes a kanamycin expression cassette to select for the plasmid during bacterial propagation. We recommend resequencing the coding region after propagation to ensure fidelity of the kinase-NanoLuc® fusion. For vector sequence information, visit: www.promega.com/kinasevectors/
Some kinase ORF sequences may be toxic to E. coli, and in these cases, vector propagation may be more challenging than expected. We have attempted to mitigate this problem by using low copy vectors, which frequently improves propagation efficiency. Even in low copy vectors, some kinase ORF sequences still may present a challenge. In these cases, scale up of the E. coli culture is advised to increase the plasmid yield. In our experience, one specific kinase vector in which propagation may be challenging is the NanoLuc®-DYRK1A Fusion Vector.
If challenges are encountered during vector propagation, contact Promega Technical Services scientists for assistance.
8 Promega Corporation · 2800 Woods Hollow Road · Madison, WI 53711-5399 USA · Toll Free in USA 800-356-9526 · 608-274-4330 · Fax 608-277-2516TM603 · Revised 7/20 www.promega.com
3.B. Instrument Requirements and Setup
To perform NanoBRET™ TE Assays, a luminometer capable of sequentially measuring dual-wavelength windows is required. This is accomplished using filters; we recommend using a band pass (BP) filter for the donor signal and a long pass filter (LP) for the acceptor signal to maximize sensitivity.
• The NanoBRET™ bioluminescent donor emission occurs at 460nm. To measure this donor signal, we recommend a band pass (BP) filter that covers close to 460nm with a band pass range of 8–80nm. For example, a 450nm/BP80 will capture the 410nm to 490nm range. Note: A BP filter is preferred for the donor signal measurement to selectively capture the signal peak and avoid measuring any acceptor peak bleedthrough. However, a short pass (SP) filter that covers the 460nm area also can be used. This may result in an artificially large value for the donor signal and measuring the bleedthrough into the acceptor peak, which could compress the ratio calculation and reduce the assay window.
• The NanoBRET™ acceptor peak emission occurs at approximately 590–610nm. To measure the acceptor signal, we recommend a long pass filter starting at 600–610nm.
Instruments capable of dual-luminescence measurements are either equipped with a filter selection or the filters can be purchased and added separately. For instruments using mirrors, select the luminescence mirror. An integration time of 0.2–1 second is typically sufficient. Ensure that the gain on the PMT is optimized to capture the highest donor signal without reaching instrument saturation.
Consult with your instrument manufacturer to determine if the proper filters are installed or for the steps needed to add filters to the luminometer. For example, a special holder or cube might be required for the filters to be mounted, and the shape and thickness may vary among instruments. We have experience with the following instruments and configurations:
• The GloMax® Discover System (Cat.# GM3000) with preloaded filters for donor 450nm/8nm BP and acceptor 600nm LP. Select the preloaded BRET:NanoBRET™ 618 protocol from the protocol menu.
• BMG Labtech CLARIOstar® with preloaded filters for donor 450nm/80nm BP and acceptor 610nm LP
• Thermo Varioskan® with filters obtained from Edmunds Optics, using donor 450nm CWL, 25mm diameter, 80nm FWHM, interference filter and acceptor 1 inch diameter, RG-610 long pass filter.
Another instrument capable of measuring dual luminescence is the PerkinElmer Envision® Multilabel Reader with the following recommended setup:
• Mirror: Luminescence - Slot4
• Emission filter: Chroma Cat.# AT600LP- EmSlot4
• Second emission filter: Chroma Cat.# AT460/50m - EmSlot1
• Measurement height (mm): 6.5
• Measurement time (seconds): 1
Promega Corporation · 2800 Woods Hollow Road · Madison, WI 53711-5399 USA · Toll Free in USA 800-356-9526 · 608-274-4330 · Fax 608-277-2516 9www.promega.com TM603 · Revised 7/20
4. NanoBRET™ TE Intracellular Kinase Assay Protocols
4.A. General Protocol for NBS format Assays without Regulator Co-Expression
This general protocol applies to all kinases where co-expression of a regulatory protein is not required for the assay. In these cases, Transfection Carrier DNA is used in conjunction with the Kinase-NanoLuc® fusion vector to prepare the transfection complexes. Visit: www.promega.com/kinasevectors to find the application note(s) for your target of interest, to determine if co-expression of a regulatory protein is required. These application note(s) can also be found on the kinase-NanoLuc® fusion vector product web page for your kinase of interest.
Materials to be Supplied by the User
• HEK293 or similar cultured mammalian cells• Dulbecco’s Modified Eagle Medium (DMEM; Thermo Fisher Cat.# 11995-065)• fetal bovine serum (HyClone Cat.# SH30070.03, Seradigm Cat.# 1500-050)• Opti-MEM™ I Reduced Serum Medium, without phenol red (Life Technologies Cat.# 11058-021)• white, nonbinding surface 96-well plates (Corning® Cat.# 3600) or 384-well plates (Corning® Cat.# 3574)• tissue-culture equipment and reagents• polypropylene plasticware (Note: Do not use polystyrene plasticware for this assay.)• 0.05% Trypsin/EDTA (Thermo Fisher Cat.# 25300)• FuGENE® HD Transfection Reagent (Cat.# E2311)• DMSO (Sigma Cat.# 2650)• detection instrument capable of measuring NanoBRET™ wavelengths (e.g., GloMax® Discover System,
Cat.# GM3000)
The volumes specified for the NanoBRET™ Target Engagement Protocol are for 96-well plates. Table 1 lists the assay volumes used for both 96- and 384-well plates. Modify the reagent volumes in Sections 4.B–E as listed in Table 1 if 384-well plates are used.
Table 1. Volumes of NanoBRET™ TE Assay Reagents Used for Multiwell Plates.
Volume Per Well
Add Tracer and Test Compound 384-Well Plate 96-Well Plate
Opti-MEM™ I reduced serum medium, without phenol red with transfected cells
34µl 85µl
Complete 20X NanoBRET™ Tracer Reagent 2µl 5µl
10X Test Compound 4µl 10µl
Assay volume 40µl 100µl
Add NanoBRET™ Assay Reagents
3X Complete Substrate plus Inhibitor Solution (Section 4.D) 20µl 50µl
Final assay volume 60µl 150µl
10 Promega Corporation · 2800 Woods Hollow Road · Madison, WI 53711-5399 USA · Toll Free in USA 800-356-9526 · 608-274-4330 · Fax 608-277-2516TM603 · Revised 7/20 www.promega.com
4.B. Transient Transfection of HEK293 Cells with Kinase-NanoLuc® Fusion Vector DNA
This protocol has been optimized for HEK293 cells. If other cell types are used, optimize the transfection conditions and revalidate the assay to determine an appropriate concentration of NanoBRET™ tracer (4). For optimal performance, use cells that have been freshly passaged, ideally within 1–2 days.
2. Remove medium from cell flask by aspiration, trypsinize and allow cells to dissociate from the flask.
3. Neutralize trypsin using cell culture medium (90% DMEM, 10% fetal bovine serum) and centrifuge at 200 × g for 5 minutes to pellet the cells.
4. Aspirate medium and resuspend cells in cell culture medium.
5. Adjust density to 2 × 10⁵ cells/ml using cell culture medium.
6. If HEK293 cells are used, prepare lipid:DNA complexes as follows:
a. Prepare a 10µg/ml solution of DNA in Opti-MEM™ I reduced serum medium without phenol red, that consists of the following: 9.0µg/ml of Transfection Carrier DNA, 1.0µg/ml of NanoLuc® fusion DNA and 1ml of Opti-MEM™ I reduced serum medium without phenol red. To accurately dilute the NanoLuc® fusion DNA, serially dilute the fusion vector with Transfection Carrier DNA to maintain the same amount of DNA (e.g., 10µg).
b. Mix thoroughly.
c. Add 30µl of FuGENE® HD Transfection Reagent into each milliliter of DNA mixture to form a lipid:DNA complex. Ensure that the FuGENE® HD Transfection Reagent does not touch the plastic side of the tube; pipet directly into the liquid in the tube.
d. Mix by inversion 5–10 times.
e. Incubate at ambient temperature for 20 minutes to allow complexes to form.
7. In a sterile, conical tube, mix 1 part of the lipid:DNA complex (e.g., 1ml) with 20 parts of HEK293 cells (e.g., 20ml) in suspension at 2 × 10⁵ cells/ml. Mix gently by inversion 5 times.
Note: Larger or smaller bulk transfections should be scaled accordingly, using this 20:1 cells to lipid:DNA complex ratio.
8. Dispense cells + lipid:DNA complex into a sterile tissue culture flask and incubate 20–30 hours in a 37°C, 5% CO2 incubator. We recommend a cell density of approximately 55,000–80,000 cells/cm2 during transfection. For example, use approximately 4–6 × 10⁶ cells for a T75 flask.
Promega Corporation · 2800 Woods Hollow Road · Madison, WI 53711-5399 USA · Toll Free in USA 800-356-9526 · 608-274-4330 · Fax 608-277-2516 11www.promega.com TM603 · Revised 7/20
4.C. Preparing Cells with NanoBRET™ Tracer Reagent
1. Remove medium from flask with transfected HEK293 cells via aspiration, trypsinize and allow cells to dissociate from the flask.
2. Neutralize trypsin using medium containing serum (90% DMEM with 10% fetal bovine serum) and centrifuge at 200 × g for 5 minutes to pellet the cells.
3. Aspirate medium and resuspend cells using prewarmed Opti-MEM™ I reduced serum medium, without phenol red.
4. Adjust the density to 2 × 10⁵ cells/ml in Opti-MEM™ I reduced serum medium, without phenol red.
5. Dispense 85µl per well of cell suspension into white, 96-well NBS plates. Periodically mix cells to avoid settling in the tube.
Optional: Dispense 90µl of cell suspension per well in triplicate as no-tracer control samples for background correction.
6. Prepare Complete 20X NanoBRET™ Tracer Reagent.
a. Prepare a 100X solution of NanoBRET™ Tracer in 100% DMSO. For each individual target, we provide a recommended 100X tracer concentration as a starting point. The recommended tracer concentration for a particular kinase can be found in the application note for the kinase. Higher tracer concentrations may increase assay window but reduce sensitivity. Therefore, you may need to optimize the tracer concentration. See Figures 4 and 5 for example data for each of the control assays.
b. Prepare Complete 20X NanoBRET™ Tracer Reagent by adding 4 parts of Tracer Dilution Buffer to 1 part of 100X NanoBRET™ tracer.
Note: Because the Tracer Dilution Buffer is viscous, slowly dispense both the Tracer Dilution Buffer and the Complete 20X NanoBRET™ Tracer Reagent. For alternate tracer preparation protocols, see Section 7.C.
7. Dispense 5µl of Complete 20X NanoBRET™ Tracer Reagent per well to cells. Mix the 96-well plate on an orbital shaker for 15 seconds at 900rpm. Note: Plate mixing may need to be optimized on different orbital shakers and for 384-well experiments, using an alternative plate mixing apparatus. See Section 7.D for more details.
Optional: Prepare a separate set of samples without tracer for optional background correction steps.
12 Promega Corporation · 2800 Woods Hollow Road · Madison, WI 53711-5399 USA · Toll Free in USA 800-356-9526 · 608-274-4330 · Fax 608-277-2516TM603 · Revised 7/20 www.promega.com
4.D. Adding Test Compounds
1. Prepare serially diluted test compound at 1,000X final concentration in 100% DMSO. Then dilute 1,000X test compound to 10X final concentration in Opti-MEM™ I reduced serum medium without phenol red.
2. Add 10µl of 10X serially diluted test compound per well of 96-well plates containing cells with 1X NanoBRET™ Tracer Reagent. Thoroughly mix plate on an orbital shaker for 15 seconds at 900rpm.
Note: Plate mixing may need to be optimized on different orbital shakers.
3. Incubate the plate at 37°C, 5% CO2 for 2 hours.
Note: Depending on the permeability and binding characteristics of the test compound, incubation times with test compound may require optimization by the end user.
4.E. NanoBRET™ Assay Protocol
1. Remove the plate from the incubator and equilibrate to room temperature for 15 minutes.
2. Prepare 3X Complete Substrate plus Inhibitor Solution in Opti-MEM® I reduced serum medium, no phenol red, just before measuring BRET as described in Table 2. Mix gently by inversion 5–10 times in a conical tube. (The final concentration of Extracellular NanoLuc® Inhibitor in the 3X solution is 60µM, for a working concentration of 20µM.)
Table 2. Volumes of NanoBRET™ TE Reagents Used for Preparing 3X Complete Substrate Plus Inhibitor Solution.
Component 96-Well Plate 384-Well Plate
NanoBRET™ Nano-Glo® Substrate 30µl 48µl
Extracellular NanoLuc® Inhibitor 10µl 16µl
Opti-MEM™ reduced serum medium, without phenol red
4,960µl 7,936µl
Total Volume 5,000µl 8,000µl
3. Add 50µl of 3X Complete Substrate plus Inhibitor Solution to each well of the 96-well plate. Incubate for 2–3 minutes at room temperature.
Note: Use 3X Complete Substrate plus Inhibitor Solution within 1.5 hours. Discard any unused solution.
4. Measure donor emission wavelength (e.g., 450nm) and acceptor emission wavelength (e.g., 610nm) using the GloMax® Discover System or other NanoBRET™ Assay-compatible luminometer (see Section 3.B).
Note: We recommend measuring BRET within 10 minutes of adding NanoBRET™ Nano-Glo® Substrate plus Extracellular NanoLuc® Inhibitor Solution. You can measure BRET for up to 2 hours, but there will be some loss of luminescent signal and re-equilibration of the sample into the larger volume.
Promega Corporation · 2800 Woods Hollow Road · Madison, WI 53711-5399 USA · Toll Free in USA 800-356-9526 · 608-274-4330 · Fax 608-277-2516 13www.promega.com TM603 · Revised 7/20
4.F. Determining BRET Ratio
1. To generate raw BRET ratio values, divide the acceptor emission value (e.g., 610nm) by the donor emission value (e.g., 450nm) for each sample.
Optional: To correct for background, subtract the BRET ratio in the absence of tracer (average of no-tracer control samples) from the BRET ratio of each sample.
2. NanoBRET™ ratio equation: Convert raw BRET units to milliBRET units (mBU) by multiplying each raw BRET value by 1,000.
BRET ratio =
Acceptorsample
Donorsample
× 1,000
NanoBRET™ ratio equation, including optional background correction:
BRET ratio = [ Acceptorsample
Donorsample
—Acceptorno-tracer control
Donorno-tracer control] × 1,000
14 Promega Corporation · 2800 Woods Hollow Road · Madison, WI 53711-5399 USA · Toll Free in USA 800-356-9526 · 608-274-4330 · Fax 608-277-2516TM603 · Revised 7/20 www.promega.com
4.G. BRET Data Generated for Control Kinases Using NBS Format Assay Protocol
Figure 4. Apparent intracellular NanoBRET™ tracer affinity for control Kinase-NanoLuc® Fusion Proteins in the NBS format. Tracer affinity is shown using BTK-NanoLuc® Fusion Vector in Panel A, and using DDR1-NanoLuc® Fusion Vector in Panel B. HEK293 cells expressing control Kinase-NanoLuc® fusion proteins were seeded into a 96-well nonbinding surface plate and mixed with increasing concentrations of NanoBRET™ tracer. Cells were treated with an excess of unlabeled compound as a competitive inhibitor for 2 hours before adding 3X Complete Substrate plus Inhibitor Solution. BRET measurements were made on a GloMax® Discover System equipped with NanoBRET™ 618 filters (donor 450nm/8nm BP and acceptor 600nm LP). Raw BRET ratios were then converted to milliBRET units (mBU) and plotted vs. NanoBRET™ tracer concentration to determine apparent intracellular potency (EC50) of the tracer.
1654
9MA
[NanoBRET™ Tracer K-5] (µM)
A. B. BR
ET R
atio
(mBu
)
10–3
30
20
10
010–2 10–1 100 101
Tracer OnlyTracer + 20µMCTx-0294885
EC50=0.53µM
[NanoBRET™ Tracer K-4] (µM)
BRET
Rat
io (m
Bu)
10–3
60
40
20
010–2 10–1 100
Tracer OnlyTracer + 10µMDasatinib
EC50=0.029µM
Promega Corporation · 2800 Woods Hollow Road · Madison, WI 53711-5399 USA · Toll Free in USA 800-356-9526 · 608-274-4330 · Fax 608-277-2516 15www.promega.com TM603 · Revised 7/20
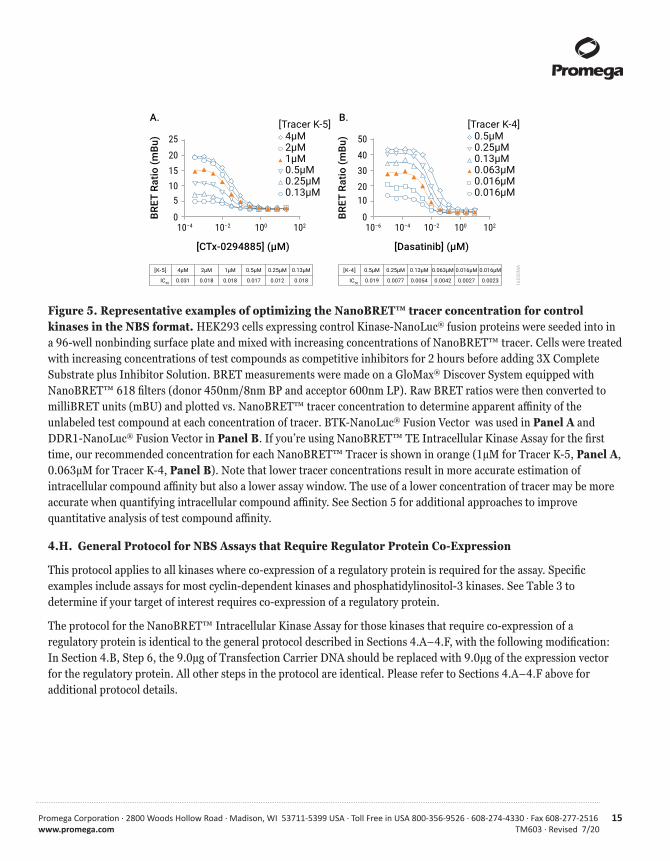
Figure 5. Representative examples of optimizing the NanoBRET™ tracer concentration for control kinases in the NBS format. HEK293 cells expressing control Kinase-NanoLuc® fusion proteins were seeded into in a 96-well nonbinding surface plate and mixed with increasing concentrations of NanoBRET™ tracer. Cells were treated with increasing concentrations of test compounds as competitive inhibitors for 2 hours before adding 3X Complete Substrate plus Inhibitor Solution. BRET measurements were made on a GloMax® Discover System equipped with NanoBRET™ 618 filters (donor 450nm/8nm BP and acceptor 600nm LP). Raw BRET ratios were then converted to milliBRET units (mBU) and plotted vs. NanoBRET™ tracer concentration to determine apparent affinity of the unlabeled test compound at each concentration of tracer. BTK-NanoLuc® Fusion Vector was used in Panel A and DDR1-NanoLuc® Fusion Vector in Panel B. If you’re using NanoBRET™ TE Intracellular Kinase Assay for the first time, our recommended concentration for each NanoBRET™ Tracer is shown in orange (1µM for Tracer K-5, Panel A, 0.063µM for Tracer K-4, Panel B). Note that lower tracer concentrations result in more accurate estimation of intracellular compound affinity but also a lower assay window. The use of a lower concentration of tracer may be more accurate when quantifying intracellular compound affinity. See Section 5 for additional approaches to improve quantitative analysis of test compound affinity.
4.H. General Protocol for NBS Assays that Require Regulator Protein Co-Expression
This protocol applies to all kinases where co-expression of a regulatory protein is required for the assay. Specific examples include assays for most cyclin-dependent kinases and phosphatidylinositol-3 kinases. See Table 3 to determine if your target of interest requires co-expression of a regulatory protein.
The protocol for the NanoBRET™ Intracellular Kinase Assay for those kinases that require co-expression of a regulatory protein is identical to the general protocol described in Sections 4.A−4.F, with the following modification: In Section 4.B, Step 6, the 9.0µg of Transfection Carrier DNA should be replaced with 9.0µg of the expression vector for the regulatory protein. All other steps in the protocol are identical. Please refer to Sections 4.A−4.F above for additional protocol details.
1655
0MA
[CTx-0294885] (µM)
A.
BR
ET
Ra
tio
(m
Bu
)
10–4
25
2015105
010–2 100 102
4µM2µM1µM0.5µM0.25µM0.13µM
[Tracer K-5]
4µM[K-5]
IC50
2µM 1µM 0.5µM 0.25µM 0.13µM
0.031 0.018 0.018 0.017 0.012 0.018
[Dasatinib] (µM)
B.
BR
ET
Ra
tio
(m
Bu
)
10–6
50
4030
2010
010–4 10–2 100 102
0.5µM0.25µM0.13µM0.063µM0.016µM0.016µM
[Tracer K-4]
0.5µM[K-4]
IC50
0.25µM 0.13µM 0.063µM 0.016µM 0.016µM
0.019 0.0077 0.0054 0.0042 0.0027 0.0023
16 Promega Corporation · 2800 Woods Hollow Road · Madison, WI 53711-5399 USA · Toll Free in USA 800-356-9526 · 608-274-4330 · Fax 608-277-2516TM603 · Revised 7/20 www.promega.com
4.H. General Protocol for NBS Assays that Require Regulator Protein Co-Expression (continued)
Table 3. Kinases that Require Co-Expression of a Regulator.
Kinase Assay Kinase Plasmid Name Regulator Regulator Plasmid Name
Promega Corporation · 2800 Woods Hollow Road · Madison, WI 53711-5399 USA · Toll Free in USA 800-356-9526 · 608-274-4330 · Fax 608-277-2516 17www.promega.com TM603 · Revised 7/20
4.I. BRET Data for a Kinase-NanoLuc® Fusion Using a Regulatory Expression Vector with Tracer K-3
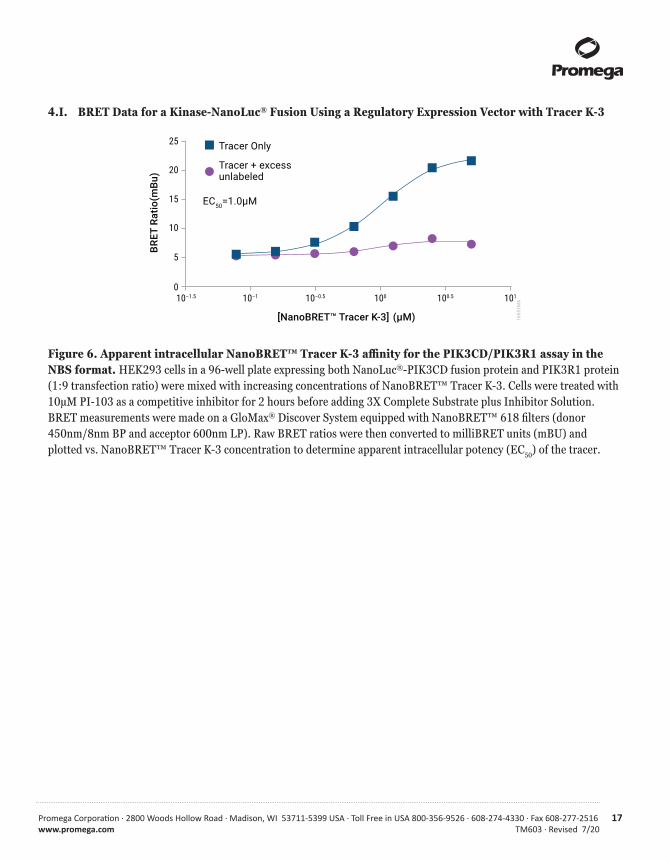
Figure 6. Apparent intracellular NanoBRET™ Tracer K-3 affinity for the PIK3CD/PIK3R1 assay in the NBS format. HEK293 cells in a 96-well plate expressing both NanoLuc®-PIK3CD fusion protein and PIK3R1 protein (1:9 transfection ratio) were mixed with increasing concentrations of NanoBRET™ Tracer K-3. Cells were treated with 10µM PI-103 as a competitive inhibitor for 2 hours before adding 3X Complete Substrate plus Inhibitor Solution. BRET measurements were made on a GloMax® Discover System equipped with NanoBRET™ 618 filters (donor 450nm/8nm BP and acceptor 600nm LP). Raw BRET ratios were then converted to milliBRET units (mBU) and plotted vs. NanoBRET™ Tracer K-3 concentration to determine apparent intracellular potency (EC50) of the tracer.
1655
1MA
Tracer Only
Tracer + excessunlabeled
EC50=1.0µM
10–1.50
5
10
15
20
25
10–1 10–0.5 100 100.5 101
[NanoBRET™ Tracer K-3] (µM)
BR
ET
Ra
tio
(mB
u)
18 Promega Corporation · 2800 Woods Hollow Road · Madison, WI 53711-5399 USA · Toll Free in USA 800-356-9526 · 608-274-4330 · Fax 608-277-2516TM603 · Revised 7/20 www.promega.com
4.I. BRET Data for a Kinase-NanoLuc® Fusion Using a Regulatory Expression Vector with Tracer K-3 (continued)
Figure 7. Optimizing the NanoBRET™ Tracer K-3 concentration for PIK3CD/PIK3R1 assay protein in NBS format. HEK293 cells in a 96-well plate expressing both NanoLuc®-PIK3CD fusion protein and PIK3R1 protein (1:9 transfection ratio) were mixed with increasing concentrations of NanoBRET™ Tracer K-3. Cells were treated with increasing concentrations of PI-103 as a competitive inhibitor for 2 hours before adding 3X Complete Substrate plus Inhibitor Solution. BRET measurements were made on a GloMax® Discover System equipped with NanoBRET™ 618 filters (donor 450nm/8nm BP and acceptor 600nm LP). Raw BRET ratios were then converted to milliBRET units (mBU) and plotted vs. NanoBRET™ Tracer K-3 concentration to determine apparent affinity of PI-103 at each concentration of tracer. If you are using NanoBRET™ TE Intracellular Kinase Assay with NanoLuc-PIK3CD for the first time, our recommended concentration of 1.25µM NanoBRET™ Tracer K-3 is shown in orange. Note that lower tracer concentrations result in more accurate estimation of intracellular compound affinity but also a lower assay window. The use of a lower concentration of tracer may be more accurate when quantifying intracellular compound affinity. See Section 5 for additional approaches to achieve quantitative analysis of test compound affinity.
1655
2MA
[Tracer]
2.5µM
1.25µM
0.063µM
0.031µM
10–4
5
10
15
20
25
10–2 100 102
[PI-103] (µM)
BR
ET
Ra
tio
(mB
u)
2.5µM
IC50
1.25µM 0.063µM 0.031µM
0.12 0.055 0.045 0.074
Promega Corporation · 2800 Woods Hollow Road · Madison, WI 53711-5399 USA · Toll Free in USA 800-356-9526 · 608-274-4330 · Fax 608-277-2516 19www.promega.com TM603 · Revised 7/20
5. Achieving Quantitative Analysis of Test Compound Affinity
The NanoBRET™ TE Assay allows you to evaluate the affinity of a test compound for a target of interest inside living cells. However, like other competitive binding assays, the apparent affinity of a test compound can be affected by the amount of the NanoBRET™ tracer that is used in the assay. Because the tracer and test compound both compete for binding to the target NanoLuc® fusion, increasing concentrations of NanoBRET™ tracer can shift the apparent IC50 value of the test drug to higher concentrations. This relationship, termed the “Cheng-Prusoff relationship” becomes most significant when the concentration of tracer is in excess of its apparent intracellular affinity for the target NanoLuc® fusion.
If you are a new user of the NanoBRET™ TE Assay, we suggest that you measure the affinity of test compounds at the recommended concentration of tracer, which is usually a subsaturating dose between the EC50 and EC80 of the tracer. This provides a good starting point for the rank-ordering of test compound affinity for the kinase-NanoLuc® fusion. The recommended tracer concentration for each kinase can be found in an application note, available on the product page for the kinase-NanoLuc® fusion vector.
Once familiar with the NanoBRET™ TE Assay, you may choose to further optimize the tracer concentration to achieve a more quantitative analysis of test compound affinity. With careful choice of the NanoBRET™ tracer concentration, the NanoBRET™ TE Assay allows you to achieve a more quantitative determination of test compound affinity that approaches the apparent intracellular affinity constant (intracellular Ki) for the target NanoLuc® fusion.
To improve quantitation of test compound affinity, choose a tracer concentration that is at or below the EC50 of the tracer for the target NanoLuc® fusion. An example of this approach is provided in Figure 8, Panel A, for a target that can be saturated when titrated with NanoBRET™ tracer, as shown in the NanoBRET™ dose-response curve. Provided that the assay window is still adequate (ideally assay window >2), this approach will produce an IC50 for the test compound that is independent of the concentration of NanoBRET™ tracer used in the experiment. Due to assay window constraints when choosing a tracer concentration, this more quantitative approach is reserved only for the High Window and some Medium Window assays (see Table 4 and Section 7.A), where the use of tracer concentrations at or below the EC50 still provides an adequate assay window.
Due to the functional solubility limits of the tracers (typically 1µM), some targets cannot be saturated by the tracer under live-cell assay conditions. In these cases (for an example, see Figure 8, Panel B), the apparent IC50 value of the test compound may appear insensitive to tracer concentration. Thus, the recommended tracer concentration is already a good choice for approaching quantitative analysis.
For users interested in more advanced approaches that directly measure the intracellular Ki, the Cheng-Prusoff relationship can be utilized to perform linear regression analysis for kinases in which the tracer binding is saturable. For details on the linearized Cheng-Prusoff analysis, consult references 3 and 4 (Section 7.H).
20 Promega Corporation · 2800 Woods Hollow Road · Madison, WI 53711-5399 USA · Toll Free in USA 800-356-9526 · 608-274-4330 · Fax 608-277-2516TM603 · Revised 7/20 www.promega.com
Figure 8. Approaches to achieving quantitation of intracellular compound affinity using NanoBRET™ TE. Examples of tracer affinity and apparent intracellular compound affinity for a target with strong tracer affinity (Panel A) and a target with weak tracer affinity (Panel B) are shown. HEK293 cells expressing individual kinase-NanoLuc® fusions were resuspended in Opti-MEM™ I reduced serum medium without phenol red and seeded into 96-well plates. Cells were treated with various concentrations of NanoBRET™ Tracer K-5 and unlabeled compound as a competitive inhibitor and incubated for 2 hours before adding 3X Complete Substrate plus Inhibitor Solution. BRET was measured using a GloMax® Discover System equipped with NanoBRET™ 618 filters (donor 450nm/8nm BP and acceptor 600nm LP). Raw BRET ratios were then converted to milliBRET units (mBU) and plotted vs. NanoBRET™ Tracer K-5 concentration to determine apparent intracellular affinity of the tracer or unlabeled compound.
Promega Corporation · 2800 Woods Hollow Road · Madison, WI 53711-5399 USA · Toll Free in USA 800-356-9526 · 608-274-4330 · Fax 608-277-2516 21www.promega.com TM603 · Revised 7/20
6. Troubleshooting
For questions not addressed here, please contact your local Promega Branch Office or Distributor. Contact information available at: www.promega.com E-mail: [email protected]
Symptoms Possible Causes and CommentsNanoBRET™ signal without test compound Tracer was adsorbed to plasticware surface. Use polypropylene is weak or close to instrument background materials and avoid polystyrene materials during transfer of tracer working reagents to minimize tracer adsorption.
Incorrect plate type was used. For the NBS protocol described in this manual, we recommend using the Corning nonbinding surface assay plates (Cat. #3600 or #3574). Alternative plates may require assay revalidation (consult reference 4 for assay validation details).
Suboptimal tracer concentration. Consider optimizing the concentration of tracer for your experiment. Only dilute NanoBRET™ tracers to 20X in Tracer Dilution Buffer prior to adding the tracer to the culture medium. Performance of NanoBRET™ tracers K-4 and K-5 will not improve above 4µM in the NBS format. See Section 7.C for alternative tracer preparation options.
Instrument was set up improperly. Use the correct filters for donor wavelength (450nm) and acceptor wavelength (590nm) on your instrument to accurately measure NanoBRET™ signals.
Poor expression levels of the NanoLuc® fusion protein. Not all fusion proteins express identically in HEK293 cells, though the majority express adequately using the transfection conditions described in section 4. If poor expression is suspected, determine the luminescence (RLU) from the donor (450nm) and acceptor (610nm) channels for cells expressing the NanoLuc® fusion (the signal) and compare that to the donor and acceptor RLU in the absence of cells expressing NanoLuc® (the background). If the signal-to-background ratio is less than 100, consider optimizing transfection conditions. Transfection optimization could involve increasing the ratio of the NanoLuc® fusion vector to the transfection carrier DNA while keeping the total DNA in the transfection mixture fixed. Moreover, cell density at time of harvest can affect transfectability. Newly passaged HEK293 cells (ideally within 1–2 days) should be harvested at 80−95% confluency for optimal transfectability. HEK293 cells approach- ing confluency do not transfect as efficiently.
22 Promega Corporation · 2800 Woods Hollow Road · Madison, WI 53711-5399 USA · Toll Free in USA 800-356-9526 · 608-274-4330 · Fax 608-277-2516TM603 · Revised 7/20 www.promega.com
6. Troubleshooting (continued)Symptoms Possible Causes and CommentsObserved IC50 value is right-shifted During correct execution of the assay, cell-based analyses of compared to expected value target engagement may result in right-shifted pharmacology relative to that observed in a biochemical assay due to myriad cellular factors. These include permeability, the presence of endogenous metabolites, target activation state, or the presence of intracellular complexes. Moreover, target engagement parameters for full-length targets in a cellular context may differ from that of truncated domains commonly used in biochemical assays.
The concentration of the NanoBRET™ tracer may affect the observed IC50 value. Carefully select tracer concentration (see Section 5). Determine a more accurate compound IC50 by optimizing the tracer concentration.
Donor or acceptor luminescence This phenomenon is common but generally does not affect the increases or decreases when tracer assay. Figure 9A demonstrates representative data showing raw is added luminescence from donor (450nm) and acceptor (610nm) channels when NanoBRET™ Tracer K-5 is titrated. BRET that occurs between the NanoLuc® fusion protein and fluorescent tracer may result in a dose-dependent increase in acceptor luminescence with a corresponding decrease in donor luminescence. The effect of BRET on donor and acceptor luminescence may vary depending on the target and tracer used. Ratiometric BRET analysis mitigates the influence of fluctuations in raw luminescence from NanoLuc® luciferase.
Noisy data Poor expression levels of the NanoLuc® fusion protein. Not all fusion proteins express identically in HEK293 cells, though the majority express adequately using the transfection conditions described in Section 4. If poor expression is suspected, determine the luminescence (RLU) from the donor (450nm) and acceptor (610nm) channels for cells expressing the NanoLuc® fusion (the signal) and compare that to the donor and acceptor RLU in the absence of cells expressing NanoLuc® (the background). If the signal-to-background ratio is less than 100, consider optimizing transfection conditions, including increasing the ratio of the NanoLuc® fusion vector to the transfection carrier DNA while keeping the total DNA in the transfection mixture fixed. More- over, cell density at time of harvest can affect transfectability. Freshly passaged HEK293 cells (ideally within 1–2 days) should be harvested at 80−95% confluency for optimal transfectability. HEK293 cells approaching confluency do not transfect as efficiently.
Promega Corporation · 2800 Woods Hollow Road · Madison, WI 53711-5399 USA · Toll Free in USA 800-356-9526 · 608-274-4330 · Fax 608-277-2516 23www.promega.com TM603 · Revised 7/20
Figure 9. Potential effects of raw luminescence on donor and acceptor emission in the NanoBRET™ TE Assay in a tracer dose-response experiment or compound dose-response experiment. Panel A. The tracer dose-response experiment for the BTK-NanoLuc® fusion protein was carried out as described in Figure 4, using a dilution series of tracer in the presence or absence of 20µM unlabeled compound as competitor. Panel B. The compound dose-response experiment for the BTK-NanoLuc® fusion protein was carried out as described in Figure 5, using a fixed tracer concentration of 1µM tracer and a dilution series of the unlabeled compound.
7. Appendix
7.A. Representative Target Engagement Data for Kinase-NanoLuc® Fusions and Assay Capabilities
The NanoBRET™ TE Intracellular Kinase Assay is compatible with a diverse set of intracellular kinases. The affinity of each tracer varies among these compatible kinases and the tracer concentration should be adjusted accordingly for optimal assay performance. For each kinase-NanoLuc® fusion vector we demonstrate the tracer dose response and provide a recommended tracer concentration in an application note, available from the kinase-NanoLuc® fusion vector web page. Application notes are also listed in the Kinase Target Engagement Assay Selection table: promega.com/kinasevectors
When using this NanoBRET™ TE Intracellular Kinase Assay protocol with a compatible kinase other than the control kinases depicted above in section 4, there are two changes you need to make to the protocol: 1) In Section 4.C., Step 6, prepare the lipid:DNA complexes using your kinase NanoLuc® fusion vector of interest, instead of the control target vector; 2) In Section 4.D., Step 6, prepare 100X tracer using the 100X recommended tracer concentration listed in the application note. Follow the remaining protocol steps as written.
For a more accurate estimate of intracellular compound affinity, it may also be possible to use a lower tracer concentration than recommended. Approaches to achieve a more quantitative measurement of compound affinity are provided in Section 5 of this technical manual, as well as in the Application Note.
One other difference that may be observed when using the NanoBRET™ TE Kinase Assay to query different compatible kinase fusions is the assay window. Assay window is the raw fold change in the BRET ratio observed at the recommended concentration of tracer compared to the BRET ratio in the presence of a saturating dose of unlabeled compound. Due to the distance and geometry components of BRET, the assay window may not be the same as observed with the control target vector, which can influence the potential assay quality (Z´; Figure 10). Since the NanoBRET™ Assay window may vary among compatible kinases, we’ve organized the assays into groupings groupings for a particular kinase target given the assay window (Table 4). Example data sets for a kinase in each assay category are provided in Figure 11.
24 Promega Corporation · 2800 Woods Hollow Road · Madison, WI 53711-5399 USA · Toll Free in USA 800-356-9526 · 608-274-4330 · Fax 608-277-2516TM603 · Revised 7/20 www.promega.com
Figure 10. Correlating assay quality with assay window in the NBS format. Assay quality (Z´) was determined for over 166 target-NanoBRET™ tracer combinations tested in the NBS format by comparing BRET values (n = 4) in the presence and absence of a saturating dose of test compound. The Z´ scores were plotted versus the corresponding assay window, and the resultant data points were grouped into three different assay categories based upon the likelihood that a good quality assay was achieved (Z´ >0.5). High window assays (depicted in blue) in which the assay window is above threefold have an excellent probability of achieving a good Z´ score. Medium window assays (depicted in green) in which the assay window is above twofold, but below threefold, have a good probability of achieving a good Z´ score. Low window assays (depicted in purple) in which the assay window is below twofold have a moderate probability of achieving a good Z´ score. Descriptions of the expected assay capabilities for each of the above assay categories is provided in Table 4.
High Window AW ≥ 3.0 • Multiple-dose compound profiling to determine IC50 at a fixed concentration of tracer in 96- or 384-well format.
• Low- to high-throughput single-dose profiling at fixed tracer concentration.
• Excellent candidate for further miniaturization with optimization.
Medium Window 3.0 > AW ≥ 2.0 • Multiple-dose compound profiling to determine IC50 at fixed concentration of tracer in 96-well format.
• Possible candidate for medium throughput single-dose profiling at a fixed tracer concentration with optimization.
• Possible candidate for scale-down to 384-well format with optimization by the end user.
Low Window 2.0 > AW ≥ 1.6 • Multiple-dose compound profiling to determine IC50 at fixed concentration of tracer in 96-well format.
1Assay window is the raw fold change in the BRET ratio observed at the recommended concentration of tracer compared to the BRET ratio in the presence of a saturating dose of unlabeled compound.
1655
3MA0 2 3
0.0
0.5
1.0
5 10 15
Assay Window
Z' HighMediumLow
Promega Corporation · 2800 Woods Hollow Road · Madison, WI 53711-5399 USA · Toll Free in USA 800-356-9526 · 608-274-4330 · Fax 608-277-2516 25www.promega.com TM603 · Revised 7/20
Figure 11. Representative examples of high, medium, and low window assays using NanoBRET™ Tracer K-5. Examples of High Window (Panel A), Medium Window (Panel B) and Low Window (Panel C) assays are provided. Discussions of each assay category are provided in Table 4. HEK293 cells expressing individual kinase- NanoLuc® fusions were resuspended in Opti-MEM™ I reduced serum medium without phenol red and seeded into 96-well plates. Cells were treated with various concentrations of NanoBRET™ Tracer K-5 and unlabeled test com-pound as a competitive inhibitor and incubated for 2 hours before adding 3X Complete Substrate plus Inhibitor Solution. BRET was measured using a GloMax® Discover System equipped with NanoBRET™ 618 filters (donor 450nm/8nm BP and acceptor 600nm LP). Raw BRET ratios were then converted to milliBRET units (mBU) and plotted vs. tracer concentration to determine apparent intracellular affinity of the tracer or unlabeled test compound. The IC50 value generated using the recommended concentration of tracer for each target is shown in bold.
26 Promega Corporation · 2800 Woods Hollow Road · Madison, WI 53711-5399 USA · Toll Free in USA 800-356-9526 · 608-274-4330 · Fax 608-277-2516TM603 · Revised 7/20 www.promega.com
7.B. Comparable Compound Pharmacology with Different Tracers
In living cells, kinase targets of interest can potentially exist in multiple conformations, for example, the active and inactive phosphorylation states or in complex with different regulatory partners. When designing NanoBRET™ tracers, we choose parent compounds with minimal conformation bias in their binding behavior. This strategy produces tracers that should allow unbiased query of as many conformations of the target kinase as possible. Thus, if designed and used appropriately, different tracers that bind to the same kinase target will report comparable pharmacology for a given test compound. As long as the tracers have the same binding mechanism and are being used at optimized concentrations relative to their intrinsic affinity for the target, the use of different tracers to query the same kinase will produce comparable pharmacology for test compounds (see Figure 12 for an example collected in the ADH format).
Figure 12. Compound pharmacology for RIPK1 as measured using three different NanoBRET™ tracers. Tracers K-8 (Panel A), K-9 (Panel B) and K-10 (Panel C) designed from three different parent compounds were used to query the binding affinity of test compound KW-2449 to NanoLuc-RIPK1 in HEK293 cells using the ADH format. Tracer concentrations used for comparison are depicted with solid symbols (0.13µM for K-8, 0.17µM for K-9, and 1µM for K-10). Panel D. Dose-response behavior for each tracer against NanoLuc®-RIPK1 shows differential potency for each tracer. Panel E. Normalized dose-response curves for KW-2449 collected for each of the three tracers at the optimized concentrations depicted in solid symbols in Panels A−C. Comparable potency for KW-2449 was observed using each of the three tracers at appropriate concentrations.
1655
4MA
[KW-2449] (µM)
A.
BRET
Rat
io (m
Bu)
10–4
20
15
10
5
10–2 100 102
IC50
[KW-2449] (µM)
B.
BRET
Rat
io (m
Bu)
10–4
20
15
10
5
10–2 100 102
IC50 IC50
[KW-2449] (µM)
C.
BRET
Rat
io (m
Bu)
10–4
20
15
10
50
10–2 100 102
0.25µM0.13µM0.063µM0.031µM
0.17µM0.083µM0.041µM
0.25µM 0.013µM 0.063µM
1µM 0.5µM 0.25µM 0.13µM 0.063µM 0.031µM
0.68 0.87 0.53 0.36 0.29 0.22
0.66µM 0.33µM 0.17µM 0.083µM
0.32 0.26 0.17 0.11 0.17
1µM 0.5µM 0.25µM 0.13µM 0.063µM
0.24 0.23 0.25 0.22 0.33
[Tracer K-8]1µM 0.5µM
[Tracer K-9]0.66µM0.33µM
[Tracer K-10] 1µM 0.5µM
0.041µM
[Tracer] (µM)
D.
BRET
Rat
io (m
Bu) 20
15
10
5
010–210–3 10–1 100
[KW-2449] (µM)
E.
Nor
mal
ized
BRE
T (%
)
10–4
100
10
010–2 100 102
IC50EC50
Tracer K-9Tracer K-8
Tracer K-9Tracer K-8Tracer K-10Tracer K-10
0.66µM 0.33µM 0.17µM 0.083µM
0.32 0.26 0.17 0.11 0.17
Tracer K-9 Tracer K-8 Tracer K-10
0.17 0.36 0.24
0.041µM
Promega Corporation · 2800 Woods Hollow Road · Madison, WI 53711-5399 USA · Toll Free in USA 800-356-9526 · 608-274-4330 · Fax 608-277-2516 27www.promega.com TM603 · Revised 7/20
7.C. Modifications to Tracer Preparation Workflow to Increase the Dispense Volume
Historically, we have had good success using the Complete 20X NanoBRET™ Tracer Reagent with 5µl dispense volumes in 96-well format for all NanoBRET™ tracers. For customers that would like to dispense the tracer in a larger volume, we recommend evaluating dispensing the NanoBRET™ Tracer Reagent as a 10X working solution (10µl dispense volume) instead of the conventional 20X reagent. See Table 5 for example preparation procedures for the 10X vs. 20X NanoBRET™ Tracer Reagents.
Note: This approach using a 10X NanoBRET™ Tracer Reagent works well for NanoBRET™ Tracer K-10, but it has not been broadly evaluated with other NanoBRET™ tracers. Thus, assay revalidation may be required to re-optimize the tracer concentration for quantitative determination of test compound IC50. Consult Section 4.F for example validation data, as well as reference 4 for additional details pertaining to the principles of assay validation.
Standard 20X 100X in DMSO 20X in TDB1 1 part concentrated + 4 parts TDB1
5µl 2µl
Alternate 10X 100X in DMSO 10X in TDB1 1 part concentrated + 9 parts TDB1
10µl 4µl
1TDB = Tracer Dilution Buffer
7.D. Achieving Adequate Plate Mixing for 96-Well and 384-Well Formats
Due to the viscosity of the tracer dilution buffer, special attention must be given to plate mixing to ensure that the Complete NanoBRET™ Tracer Reagent is adequately dispersed in the assay. Creation of a sufficient mixing vortex requires that the orbit of the mixer is smaller in diameter than the inside diameter of each well. For 96-well formats, most commercially available orbital shakers will be capable of dispersing the tracer reagent, though optimization of the shaking force may be required (typically by visual inspection). For the 384-well assay format, we recommend using specific equipment that will facilitate creation of a mixing vortex in the wells of 384-well plates. We have experience with horizontal shakers such as the VibraTranslator™ line of products from Union Scientific. Consult your mixing apparatus manufacturer to determine the suitability of your plate mixer for 384-well applications that use viscous reagents.
28 Promega Corporation · 2800 Woods Hollow Road · Madison, WI 53711-5399 USA · Toll Free in USA 800-356-9526 · 608-274-4330 · Fax 608-277-2516TM603 · Revised 7/20 www.promega.com
7.E. Performing NanoBRET™ TE Assays in Alternative Plate Formats (ADH vs. NBS)
As depicted in Figure 3, the NanoBRET™ TE Assay can be performed in two primary plate formats, ADH and NBS, where ADH uses adhered cells in a tissue-culture treated assay plate (TC plates) and NBS uses freshly harvested cells suspended in a nonbinding surface (NBS) plate. While the ADH format (described in Technical Manual #TM598) is the preferred format, each of the two formats offer potential advantages and disadvantages depending on the nature of the work being performed. The ADH format has the advantage in that it uses adhered cells and tissue-culture treated plates, which may be more comparable to other cell-based assays performed using adhered cells. Moreover, the ADH format creates workflow efficiencies that minimize cell handling steps and shorten the total execution time. Lastly, some tracers actually perform better in the ADH format in terms of tracer potency. In contrast, some test compounds or NanoBRET™ tracer behave unfavorably in TC treated plates and require assays to be performed in NBS plates for optimal performance.
For the NanoBRET™ TE Intracellular kinase assay, the ADH format is preferred and all new NanoBRET™ tracers including K-3, K-8, K-9, K-10, and K-11 have been tested and validated in the ADH format. Legacy NanoBRET™ tracers K-4 and K-5 have been revalidated in the ADH format for convenience. Importantly, both ADH and NBS formats can yield comparable compound potency information when the compound itself does not demonstrate a plate-type bias. For an example, see Figure 13, where compound potency for the BTK-NanoLuc® assay measured using tracer K-5 is equivalent in both ADH and NBS formats provided that the assays are revalidated and an optimized tracer concentration is selected for each format.
For users who would like to perform NanoBRET™ TE assays in the NBS format with a tracer that has not been validated in that format, or in an alternative plate type other than the plates we recommend above, we suggest that the user revalidate the assay. Assay validation requires remeasuring the tracer dose response and the effect of tracer concentration on test compound potency, as depicted above in Figures 4−8, and Figure 11. For additional details regarding assay validation, consult reference 4.
Promega Corporation · 2800 Woods Hollow Road · Madison, WI 53711-5399 USA · Toll Free in USA 800-356-9526 · 608-274-4330 · Fax 608-277-2516 29www.promega.com TM603 · Revised 7/20
Figure 13. Comparison of NanoBRET™ assay validation for BTK-NanoLuc® fusion protein in NBS (nonbinding surface) versus ADH (adherent) format. HEK293 cells expressing BTK-NanoLuc® fusion protein were assayed in either NBS format by the recommended protocol or in ADH format (see NanoBRET™ Target Engagement Intracellular Kinase Assay, Adherent Format Technical Manual, #TM598). Cells were treated with increasing concentrations of NanoBRET™ Tracer K-5 with an excess of unlabeled compound (20µM) as a competitive inhibitor for 2 hours before adding 3X Complete Substrate plus Inhibitor Solution. BRET measurements were made on a GloMax® Discover System equipped with NanoBRET™ 618 filters (donor 450nm/8nm BP and acceptor 600nm LP). Raw BRET ratios were then converted to milliBRET units (mBU) and plotted vs. tracer concentration to determine apparent intracellular affinity of the tracer in either NBS format (Panel A) or ADH format (Panel B). Recommended tracer concentrations for compound IC50 determination are highlighted in green (NBS format) or orange (ADH format), respectively. Panel C shows affinity of test drug dasatinib, determined in both NBS and ADH formats at the recommended tracer concentrations, with both formats yielding comparable IC50 values.
Some users may prefer to use stable cell lines for the NanoBRET™ assay as opposed to cells that have been transiently transfected. This approach can help to shorten the assay workflow and improve day-to-day assay variability. However, the NanoLuc® expression vectors are designed for transient transfection and use relatively strong constitutive promoters (CMV). To avoid overexpression in stable cell lines, we recommend the use of attenuated promoters (i.e., CMV deletion promoters, the PGK promoter or the TK promoter) for appropriate expression of the NanoLuc® fusion protein.
An alternative option to stable cell lines is the use of assay-ready cells that have been pretransfected with the NanoLuc® fusion protein of interest. Assay-ready cells can be prepared in advance in bulk, aliquoted and cryopreserved, after which individual tubes can be thawed on demand and used immediately in the NanoBRET™ TE assay. This approach can also help to shorten the assay workflow and improve day-to-day assay variability.
7.G. Extinction Coefficient of NanoBRET™ Tracers
NanoBRET™ Tracers K-3, K-4, K-5, K-8, K-9, K-10 and K-11 use the NanoBRET™ 590 fluorophore. The concentration of each NanoBRET™ tracer was determined using an extinction coefficient of 83,000 M–1 cm–1 at 590nm. See Table 10.1 in reference for details (5).
7.H. References
1. Machleidt, T. et al. (2015) NanoBRET-A novel BRET platform for the analysis of protein-protein interactions. ACS Chem. Bio. 10, 1797–1804.
2. Robers, M.B. et al. (2015) Target engagement and drug residence time can be observed in living cells with BRET. Nat. Comm. 6, 10091.
3. Vasta, J.D. et al. (2018) Quantitative, wide-spectrum kinase profiling in live cells for assessing the effect of cellular ATP on target engagement. Cell Chem. Biol. 25, 206–14.
4. Robers, M.B. et al. (2019) Quantitative, real-time measurements of intracellular target engagement using energy transfer. Syst. Chem. Biol. pp 45–71.
5. Anthropological Genetics: Theory, Methods and Applications, Michael H. Crawford, ed. (2006) University of Cambridge Press. Table 10.1, Chapter 10.
Promega Corporation · 2800 Woods Hollow Road · Madison, WI 53711-5399 USA · Toll Free in USA 800-356-9526 · 608-274-4330 · Fax 608-277-2516 31www.promega.com TM603 · Revised 7/20
NanoBRET™ Target Engagement Intracellular BET BRD Assays 100 assays N2130
1,000 assays N2131
10,000 assays N2140
Transfection Reagents
Products Size Cat. #FuGENE® HD Transfection Reagent 1ml E2311
5 × 1ml E2312
ViaFect™ Transfection Reagent 0.75ml E4981
2 × 0.75ml E4982
32 Promega Corporation · 2800 Woods Hollow Road · Madison, WI 53711-5399 USA · Toll Free in USA 800-356-9526 · 608-274-4330 · Fax 608-277-2516TM603 · Revised 7/20 www.promega.com
Luminometers
Product Size Cat.#GloMax® Discover System 1 each GM3000
For Research Use Only. Not For Use in Diagnostic Procedures
8. Summary of Changes
The following change was made to the 7/20 revision of this document:
A url was added to Section 3.A.
Promega Corporation · 2800 Woods Hollow Road · Madison, WI 53711-5399 USA · Toll Free in USA 800-356-9526 · 608-274-4330 · Fax 608-277-2516 33www.promega.com TM603 · Revised 7/20
(a)BY USE OF THIS PRODUCT, RESEARCHER AGREES TO BE BOUND BY THE TERMS OF THIS LIMITED USE LABEL LICENSE. If researcher is not willing to accept the terms of this label license, and the product is unused, Promega will accept return of the unused product and provide researcher with a full refund.
Researcher may use this product for research use only; no commercial use is allowed. Commercial use means any and all uses of this product by a party in exchange for consideration, including, but not limited to (1) use in further product manufacture; (2) use in provision of services, information or data; and (3) resale of the product, whether or not such product is resold for use in research. Researcher shall have no right to modify or otherwise create variations of the product. No other use or transfer of this product is authorized without the prior express written consent of Promega.
For uses of this product intended for energy transfer (such as bioluminescence resonance energy transfer) to acceptors other than genetically encoded autofluorescent protein, researcher must:
(a) use NanoBRET™-branded energy acceptors (e.g., NanoBRET™ tracers, NanoBRET™ dyes, BRET-optimized HaloTag® ligands) for all determinations of energy transfer activity; (b) contact Promega to obtain a license for use of the product for energy transfer assays using energy acceptors not manufactured by Promega.
With respect to any uses outside this label license, including any diagnostic, therapeutic, prophylactic or commercial uses, please contact Promega for supply and licensing information. PROMEGA MAKES NO REPRESENTATIONS OR WARRANTIES OF ANY KIND, EITHER EXPRESSED OR IMPLIED, INCLUDING FOR MERCHANTABILITY OR FITNESS FOR A PARTICULAR PURPOSE, WITH REGARD TO THE PRODUCT. The terms of this label license shall be governed under the laws of the State of Wisconsin, USA.(b)BY USE OF THIS PRODUCT, RESEARCHER AGREES TO BE BOUND BY THE TERMS OF THIS LIMITED USE LABEL LICENSE. If researcher is not willing to accept the terms of this label license, and the product is unused, Promega will accept return of the unused product and provide researcher with a full refund.
Researcher may use this product for research use only; no commercial use is allowed. Commercial use means any and all uses of this product by a party in exchange for consideration, including, but not limited to (1) use in further product manufacture; (2) use in provision of services, information or data; and (3) resale of the product, whether or not such product is resold for use in research. Researcher shall have no right to modify or otherwise create variations of the product. No other use or transfer of this product is authorized without the prior express written consent of Promega.
For uses of this product for energy transfer (such as bioluminescence resonance energy transfer), researcher must:
(a) use NanoLuc®-branded luciferase or derivatives for all energy transfer determinations conducted with this product; and (b) use NanoBRET™-branded luminescent assay reagents (LARs; e.g. NanoBRET™ Nano-Glo® Substrate), Intracellular TE Nano-Glo® Substrate/Inhibitor, or Intracellular TE Nano-Glo® Vivazine/Inhibitor for all determinations of luminescent activity; or (c) contact Promega to obtain a license for use of the product with LARs not listed above or manufactured by Promega.
In addition, researcher must:
Contact Promega to obtain a license for use of the product in assays not involving bioluminescence resonance energy transfer (BRET).
With respect to any uses outside this label license, including any diagnostic, therapeutic, prophylactic or commercial uses, please contact Promega for supply and licensing information. PROMEGA MAKES NO REPRESENTATIONS OR WARRANTIES OF ANY KIND, EITHER EXPRESSED OR IMPLIED, INCLUDING FOR MERCHANTABILITY OR FITNESS FOR A PARTICULAR PURPOSE, WITH REGARD TO THE PRODUCT. The terms of this label license shall be governed under the laws of the State of Wisconsin, USA.
34 Promega Corporation · 2800 Woods Hollow Road · Madison, WI 53711-5399 USA · Toll Free in USA 800-356-9526 · 608-274-4330 · Fax 608-277-2516TM603 · Revised 7/20 www.promega.com
(c)BY USE OF THIS PRODUCT, RESEARCHER AGREES TO BE BOUND BY THE TERMS OF THIS LIMITED USE LABEL LICENSE. If researcher is not willing to accept the terms of this label license, and the product is unused, Promega will accept return of the unused product and provide researcher with a full refund.
Researcher may use this product for research use only; no transfer or commercial use of this product is allowed. Commercial use means any and all uses of this product by a party in exchange for consideration, including, but not limited to (1) use in further product manufacture; (2) use in provision of services, information or data; and (3) resale of the product, whether or not such product is resold for use in research. Researcher shall have no right to modify or otherwise create variations of the nucleotide sequence of the luciferase gene. No other use of this product is authorized without the prior express written consent of Promega.
In addition, researcher must:
(1a) use Nano-Glo®-branded luminescent assay reagents (LARs) for all determinations of luminescence activity of this product; or (1b) contact Promega to obtain a license for use of the product with LARs not manufactured by Promega.
For uses of this product (NanoLuc® ORF Vector) for energy transfer (such as bioluminescence resonance energy transfer), researcher must:
(2a) use NanoBRET™-branded luminescent assay reagents (LARs; e.g. NanoBRET™ Nano-Glo® Substrate), Intracellular TE Nano-Glo® Substrate/Inhibitor, or Intracellular TE Nano-Glo® VivazineTM/Inhibitor for all determinations of luminescent activity; and (2b) use NanoBRET™-branded energy acceptors (e.g., NanoBRET™ tracers, NanoBRET™ dyes, BRET-optimized HaloTag® ligands) for all determinations of energy transfer activity; or (2c) contact Promega to obtain a license for use of the product for energy transfer assays using energy acceptors not manufactured by Promega. No license is needed if the energy transfer acceptor is a genetically encoded autofluorescent protein.
With respect to any uses outside this label license, including any diagnostic, therapeutic, prophylactic or commercial uses, please contact Promega for supply and licensing information. PROMEGA MAKES NO REPRESENTATIONS OR WARRANTIES OF ANY KIND, EITHER EXPRESSED OR IMPLIED, INCLUDING FOR MERCHANTABILITY OR FITNESS FOR A PARTICULAR PURPOSE, WITH REGARD TO THE PRODUCT. The terms of this label license shall be governed under the laws of the State of Wisconsin, USA.(d)Licensed under EP1295121 and EP1088233.(e)U.S. Pat. Nos. 8,557,970, 8,669,103, 9,777,311, 9,840,730 and 9,951,373 and other patents and patents pending.(f)U.S. Pat. No. 8,809,529 and other patents and patents pending.(g)U.S. Pat. Nos. 10,067,149 and 10,024,862 and other patents and patents pending. (h)Patent Pending.
FUGENE, GloMax, Nano-Glo and NanoLuc are registered trademarks of Promega Corporation. NanoBRET, Viafect and Vivazine are trademarks of Promega Corporation.
CLARIOstar is a registered trademark of BMG Labtech. Corning is a registered trademark of Corning, Inc. Envision is a registered trademark of PerkinElmer, Inc. Opti-MEM is a trademark and Varioskan is a registered trademark of Thermo Fisher Scientific. VibraTranslator is a trademark of Union Scientific Corporation.
Products may be covered by pending or issued patents or may have certain limitations. Please visit our Web site for more information.
All prices and specifications are subject to change without prior notice.
Product claims are subject to change. Please contact Promega Technical Services or access the Promega online catalog for the most up-to-date information on Promega products.


![Regulation of the intracellular Ca2+. Regulation of intracellular [H]:](https://static.documents.pub/doc/80x56/5a4d1b717f8b9ab0599b56a5/regulation-of-the-intracellular-ca2-regulation-of-intracellular-h.jpg)


