Diffuse sources Natural seeps Atmosphere on open seas Coastal urban runoff Marine transport operations Recreational boating
NationalResearchCouncilof the National Academies Report 2003
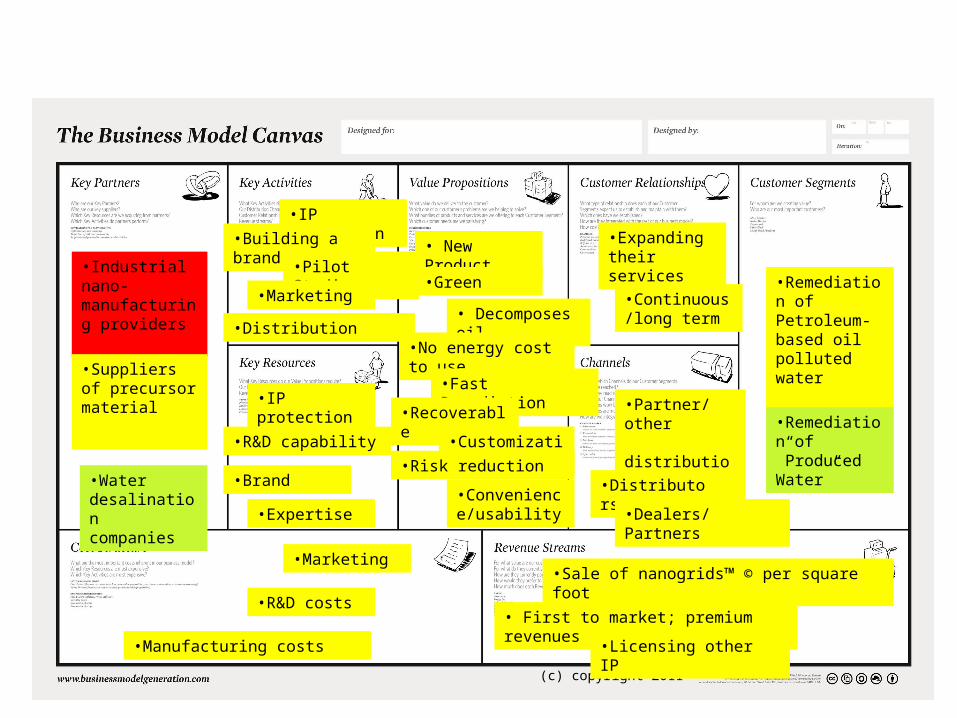
Key Customer Segment
“Produced water”: Discharged in off-shore oil-producing areas
Fracking creates large amounts of wastewater
Current energy exploration and extraction in US creates 15-20 billion barrels of produced water / year
Worldwide, estimates top 50 billion barrels
Energy companies pay between $3 – $12 to dispose of each barrel of produced water
Produced water is usually treated to remove most free oil
Need to treat the remaining amount of soluble and volatile petroleum hydrocarbons
BTEX average concentration remaining about 5mg/L Allowable limit of BTEX in drinking water 1mg/L
WHAT IS BTEX? BTEX is the abbreviation used for four compounds found in petroleum products. The compounds are benzene, toluene, ethylbenzene, and xylenes.
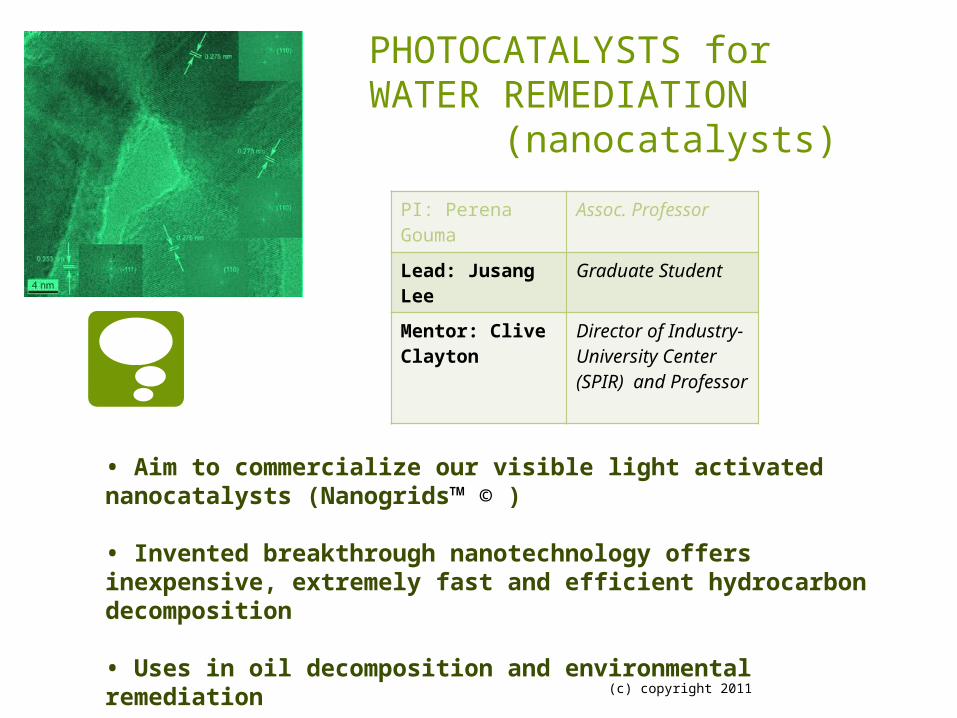
Produced Water
What is the Problem We Solve?
• Our product contains the volatile petroleum hydrocarbons (e.g. benzene) and subsequently decomposes them either in-situ or off-site
• It can be used as the final remediation step in the “produced water” clean up
• It can, in principle, turn “produced water” from wastewater to drinkable water while treated on-site
• New laws are expected to cancel the Energy Industry’s exception from the Clean Water Act, thus favoring “new, self-contained, on-site water treatment”
• The current market for treating produced water is estimated to exceed $4.3 billion for next 5 years
–We need them to secure government contracts (AES)
–We need them to get access to the international marketplace (Ultratech)
• Distributors: YES
–We need them to bring our first products to market (Spilltech)
• Co-developers: MAYBE
–NRC and/or NALCO as customers/co-developers of certain oil remediation solutions
• Collaborators: YES
–Partner with emerging businesses in the water remediation field with complementary interests (e.g. water desalination; frack wastewater cleaning /recycling companies, such as ALTELA)
What are the Risks
Dealers/distributors:
–They do not promote our product as needed
–They sabotage our product promoting other solutions that bring them higher profit
Co-Developers:
– They claim ownership of our ideas/prototypes
– They put our technology “on the shelf”
• Collaborators
– They might not appreciate that further clean-up with our product offers potable as opposed to just recyclable water;
–They might have conflicting interests due to other partnerships with landfills, etc
Why will they Partner with You?
We Offer Innovative and Green Products/Solutions
We Address a Niche rather than the Whole Market
We Meet the Need of Anticipated Environmental Regulations on the Energy Industry
We will Bring New Customers to Their Businesses
We will Grow Further Together
We will Help them Produce Truly Clean Water
We will Help Improve the Image of the Industry
Cost of Partnership
Dealer:
– We’ll need to sell the product to them at lower prices so our profit margin is low
Distributor:
–We’ll need to pay commission fee on exclusive contract
Co-developer:
– We’ll need to share our know-how with them
Collaborator:
–We’ll need to share the cost of processing facilities
Income Statement for Business Model*
Income Statement
Year 1 Year 2 Year 3
Net Sales $4M $7.25M $10M
Cost of Goods sold
$1.6M $3.2M $4M
Expenses: Salary
$1.2M $1.2M $1.5M
Expenses: Other $ 0.2M $0.3M $.5M
Total Expenses $1.4M $1.5M $2.0M
Net Income $1.0M $2.55M $4M
•This statement is based on very conservative estimates of introducing a new product in a niche market; the market segment is a multi-billion dollar one and it is growing fast; it is anticipated that our company will grow very fast after the 3rd year sales
Revenue Chart
Year 1 Year 2 Year 3 Year 40
10
20
30
40
50
60
($M)
First year revenues:20 SME of $100,000 sales/year= $2M2 LC of $1M /year =$2Mfirst year revenues : $4M
Second year revenues:75% retention of SME15 SME of $150,000 sales/year= $2.25M2 LC: $5M sales/yearsecond year revenues $7,25M
Third year revenues:maintain the domestic levels with existing customers but expand international sales to $3.5MThis will set us over $10M
Fourth year revenues:Add new line of products for existing market; expand into adjacent markets(off-site remediation; water purification; etc)Revenues to reach $50M