460
| TEXTE | 29/2013 Investigation of widely used nanomaterials (TiO 2 , Ag) and gold nanoparticles in standardised ecotoxicological tests

| TEXTE | 29/2013
Investigation of widely used nanomaterials (TiO2, Ag) and gold nanoparticles in standardised ecotoxicological tests


Investigation of widely used nanomaterials (TiO2, Ag) and gold nanoparticles in standardized ecotoxicological tests
by
Dr. Kerstin Hund-Rinke Dr. Thorsten Klawonn Fraunhofer Institute for Molecular Biology and Applied Ecology IME, Schmallenberg, Germany
UMWELTBUNDESAMT
| TEXTE | 29/2013
ENVIRONMENTAL RESEARCH OF THE FEDERAL MINISTRY OF THE ENVIRONMENT, NATURE CONSERVATION AND NUCLEAR SAFETY
Project No. (FKZ) 3709 65 416 Report No. (UBA-FB) 001715/E
This publication is only available online. It can be downloaded from http://www.uba.de/uba-info-medien-e/4462.html
The contents of this publication do not necessarily reflect the official opinions.
ISSN 1862-4804
Study performed by: Fraunhofer Institute for Molecular Biology and Applied Ecology IME Auf dem Aberg 1 57392 Schmallenberg, Germany
Study completed in: December 2012
Publisher: Federal Environment Agency (Umweltbundesamt) Wörlitzer Platz 1 06844 Dessau-Roßlau Germany Phone: +49-340-2103-0 Fax: +49-340-2103 2285 Email: [email protected] Internet: http://www.umweltbundesamt.de
http://fuer-mensch-und-umwelt.de/
Edited by: Section IV 2.2 Pharmaceuticals, Washing and Cleaning Agents Dr. Doris Völker
Dessau-Roßlau, April 2013

Index of Content, Index of Tables, Index of Figures
I
Index of Content
1 Preliminary remark ................................................................................................... 1
2 Introduction .............................................................................................................. 2
3 Structure of the report .............................................................................................. 4
4 Methods for chemical analyses ................................................................................ 6
4.1 Digestion of Titanium in aqueous samples and soils/sediment ................................. 6
4.1.1 Procedure ........................................................................................................ 6
4.1.2 Analytical measurement ................................................................................... 6
4.2 Digestion and quantification of TiO2 in earthworms .................................................. 8
4.2.1 Procedure ........................................................................................................ 8
4.2.2 Analytical measurement ................................................................................... 8
4.3 Digestion and quantification of silver and silver nanoparticles in soil (01A) .............11
4.3.1 Preliminary remarks ........................................................................................11
4.3.2 Procedure .......................................................................................................12
4.3.3 Analytical measurement ..................................................................................12
4.4 Digestion and quantification of silver and silver nanoparticles in aqueous and sediment samples (OECD 219, test with chironomids) ...........................................14
4.4.1 Procedure .......................................................................................................14
4.4.2 Analytical measurement ..................................................................................15
4.5 Quantification of silver in the extracts of DGTs, diffusive gradients in thin films ......19
4.5.1 DGTs in general ..............................................................................................19
4.5.2 Procedure .......................................................................................................19
4.5.3 Analytical measurement ..................................................................................20
4.6 Quantification of silver in earthworms .....................................................................22
4.6.1 Procedure .......................................................................................................22
4.6.2 Analytical measurement ..................................................................................23
4.7 Dissolution and quantification of nano-Au in aqueous and sediment samples .........25
4.7.1 Procedure .......................................................................................................25
4.7.2 Analytical measurement ..................................................................................25
5 Pre-tests - spiking of soil .........................................................................................28
5.1 Materials and methods ...........................................................................................29
5.1.1 Nanomaterial ...................................................................................................29
5.1.2 Test soil ...........................................................................................................30

Index of Content, Index of Tables, Index of Figures
II
5.1.3 Application of the nanoparticles .......................................................................30
5.1.4 Ecotoxicological tests with earthworms ...........................................................32
5.1.5 Ecotoxicological tests with soil microflora ........................................................32
5.1.6 Chemical analyses ..........................................................................................33
5.2 Results ...................................................................................................................33
5.2.1 Reproduction test with earthworms .................................................................33
5.2.2 Soil microflora - nitrification activity ..................................................................36
5.2.3 Chemical analyses ..........................................................................................39
5.2.4 Conclusions ....................................................................................................43
6 Pre-tests - dispersion in aquatic tests .....................................................................44
6.1 Basic procedure ......................................................................................................44
6.2 Filtration ..................................................................................................................44
6.3 Stabilisers ...............................................................................................................46
7 Reproduction Test with Earthworms (OECD TG 222) – TiO2 ..................................48
7.1 Test principle ..........................................................................................................48
7.2 Materials and methods ...........................................................................................48
7.2.1 Test guideline ..................................................................................................48
7.2.2 GLP .................................................................................................................48
7.2.3 Test material ...................................................................................................48
7.2.4 Analytical monitoring .......................................................................................48
7.2.5 Test item – preparation protocol ......................................................................49
7.2.6 Test species ....................................................................................................50
7.3 Study design ...........................................................................................................50
7.3.1 Study type .......................................................................................................50
7.3.2 Test duration type and exposure period ..........................................................50
7.3.3 Test substrate .................................................................................................51
7.3.4 Total exposure period ......................................................................................51
7.3.5 Post exposure period ......................................................................................51
7.4 Test conditions .......................................................................................................51
7.4.1 Environmental conditions ................................................................................51
7.4.2 Test concentrations .........................................................................................52
7.4.3 Other information on materials and methods ...................................................52
7.5 Results ...................................................................................................................53

Index of Content, Index of Tables, Index of Figures
III
7.5.1 P25 - first experiment ......................................................................................53
7.5.2 P25 - second experiment ................................................................................56
7.5.3 P25 - third experiment .....................................................................................58
7.5.4 NM-101 – first experiment ...............................................................................60
7.5.5 NM 101 - second experiment ..........................................................................62
7.5.6 NM -103 - first test ...........................................................................................64
7.5.7 NM 103 - second experiment ..........................................................................66
7.5.8 Considerations concerning the reproduction behaviour of earthworms in the presence of TiO2 nanoparticles ......................................................................68
7.5.9 Concentration of Ti in earthworms ...................................................................69
7.6 Validity ....................................................................................................................71
7.7 Data with the reference substance ..........................................................................72
7.8 Conclusion ..............................................................................................................73
7.9 Executive summary ................................................................................................73
8 Reproduction Test with Earthworms (OECD TG 222) – Ag .....................................75
8.1 Test principle ..........................................................................................................75
8.2 Materials and methods ...........................................................................................75
8.2.1 Test guideline ..................................................................................................75
8.2.2 GLP .................................................................................................................75
8.2.3 Test material ...................................................................................................75
8.2.4 Analytical monitoring .......................................................................................75
8.2.5 Test item – preparation protocol ......................................................................76
8.2.6 Test species ....................................................................................................77
8.3 Study design ...........................................................................................................77
8.3.1 Study type .......................................................................................................77
8.3.2 Test duration type and exposure period ..........................................................77
8.3.3 Test substrate .................................................................................................77
8.3.4 Total exposure period ......................................................................................77
8.3.5 Post exposure period ......................................................................................77
8.4 Test conditions .......................................................................................................78
8.4.1 Environmental conditions ................................................................................78
8.4.2 Test concentrations .........................................................................................78
8.4.3 Other information on materials and methods ...................................................78
8.5 Results ...................................................................................................................80

Index of Content, Index of Tables, Index of Figures
IV
8.5.1 NM-300K .........................................................................................................80
8.5.2 Concentrations of silver in earthworms ............................................................90
8.6 Validity ....................................................................................................................92
8.7 Data with the reference substance ..........................................................................92
8.8 Conclusion ..............................................................................................................92
8.9 Executive summary ................................................................................................93
9 Microorganisms - Nitrogen Transformation Test (OECD TG 216) ...........................95
9.1 Test principle ..........................................................................................................95
9.2 Materials and methods ...........................................................................................95
9.2.1 Test guideline ..................................................................................................95
9.2.2 GLP .................................................................................................................95
9.2.3 Test material ...................................................................................................95
9.2.4 Analytical monitoring .......................................................................................95
9.2.5 Test item – preparation protocol ......................................................................96
9.2.6 Test organism .................................................................................................96
9.3 Study design ...........................................................................................................97
9.3.1 Total exposure period ......................................................................................97
9.4 Test conditions .......................................................................................................97
9.4.1 Environmental conditions ................................................................................97
9.4.2 Test soil ...........................................................................................................97
9.4.3 Concentration levels ........................................................................................98
9.4.4 Other information on materials and methods ...................................................99
9.5 Results ................................................................................................................. 100
9.5.1 Zeta potential ................................................................................................ 100
9.5.2 Nitrogen transformation ................................................................................. 100
9.6 Validity .................................................................................................................. 103
9.7 Reference substance ............................................................................................ 103
9.8 Conclusion ............................................................................................................ 103
9.9 Executive summary .............................................................................................. 103
10 Microorganisms - Carbon Transformation Test (OECD TG 217) – TiO2 ................ 105
10.1 Test principle ........................................................................................................ 105
10.2 Materials and methods ......................................................................................... 105
10.2.1 Test guideline ................................................................................................ 105

Index of Content, Index of Tables, Index of Figures
V
10.2.2 GLP ............................................................................................................... 105
10.2.3 Test material ................................................................................................. 105
10.2.4 Test type ....................................................................................................... 105
10.2.5 Analytical monitoring ..................................................................................... 105
10.2.6 Test item – preparation protocol .................................................................... 106
10.2.7 Test organism ............................................................................................... 107
10.3 Study design ......................................................................................................... 107
10.3.1 Total exposure period .................................................................................... 107
10.4 Test conditions ..................................................................................................... 107
10.4.1 Environmental conditions .............................................................................. 107
10.4.2 Test soil ......................................................................................................... 107
10.4.3 Concentration levels ...................................................................................... 108
10.4.4 Other information on materials and methods ................................................. 108
10.5 Results ................................................................................................................. 110
10.5.1 Zeta potential ................................................................................................ 110
10.5.2 Carbon transformation ................................................................................... 110
10.5.3 Further information ........................................................................................ 112
10.6 Validity .................................................................................................................. 114
10.7 Reference substance ............................................................................................ 114
10.8 Conclusion ............................................................................................................ 114
10.9 Executive Summary .............................................................................................. 115
11 Growth Tests with Plants (OECD TG 208) – TiO2 ................................................. 116
11.1 Test principle ........................................................................................................ 116
11.2 Materials and methods ......................................................................................... 116
11.2.1 Test guideline ................................................................................................ 116
11.2.2 GLP ............................................................................................................... 116
11.2.3 Test material ................................................................................................. 116
11.2.4 Analytical monitoring ..................................................................................... 116
11.2.5 Test species .................................................................................................. 117
11.3 Study design ......................................................................................................... 117
11.3.1 Study type ..................................................................................................... 117
11.3.2 Test duration type ......................................................................................... 117
11.3.3 Test type ....................................................................................................... 117

Index of Content, Index of Tables, Index of Figures
VI
11.3.4 Substrate type ............................................................................................... 118
11.3.5 Exposure period ............................................................................................ 118
11.3.6 Post exposure period .................................................................................... 118
11.4 Test conditions ..................................................................................................... 118
11.4.1 Environmental conditions .............................................................................. 118
11.4.2 Concentration levels ...................................................................................... 118
11.4.3 Other information on materials and methods ................................................. 119
11.5 Results ................................................................................................................. 121
11.5.1 Zeta potential ................................................................................................ 121
11.5.2 Effects ........................................................................................................... 121
11.5.3 Results with reference substance .................................................................. 126
11.6 Validity .................................................................................................................. 127
11.7 Conclusion ............................................................................................................ 127
11.8 Executive summary .............................................................................................. 128
12 Emergence Test with Chironomids (OECD TG 219) – TiO2 .................................. 130
12.1 Test principle ........................................................................................................ 130
12.2 Materials and methods ......................................................................................... 130
12.2.1 Test guideline ................................................................................................ 130
12.2.2 GLP ............................................................................................................... 130
12.2.3 Test substances ............................................................................................ 130
12.3 Analytical monitoring ............................................................................................. 131
12.3.1 Details of sediment and water ....................................................................... 131
12.3.2 Details of application ..................................................................................... 132
12.4 Test organism ....................................................................................................... 132
12.5 Study design ......................................................................................................... 132
12.5.1 Study type ..................................................................................................... 132
12.5.2 Test duration type ......................................................................................... 133
12.5.3 Test type ....................................................................................................... 133
12.5.4 Water media type .......................................................................................... 133
12.5.5 Type of sediment ........................................................................................... 133
12.5.6 Total exposure duration ................................................................................. 133
12.5.7 Test conditions .............................................................................................. 133
12.5.8 Other information on materials and methods ................................................. 135

Index of Content, Index of Tables, Index of Figures
VII
12.6 Results ................................................................................................................. 136
12.6.1 P25 ............................................................................................................... 136
12.6.2 NM-101 ......................................................................................................... 140
12.7 Validity .................................................................................................................. 143
12.7.1 P25 ............................................................................................................... 143
12.7.2 NM-101 ......................................................................................................... 143
12.8 Additional experiments ......................................................................................... 143
12.9 Conclusion ............................................................................................................ 144
12.10 Executive summary .............................................................................................. 144
13 Emergence Test with Chironomids (OECD TG 219) - Ag ...................................... 145
13.1 Test principle ........................................................................................................ 145
13.2 Materials and methods ......................................................................................... 145
13.2.1 Test guideline ................................................................................................ 145
13.2.2 GLP ............................................................................................................... 145
13.2.3 Test substances ............................................................................................ 145
13.3 Analytical monitoring ............................................................................................. 145
13.3.1 Details of sediment and water ....................................................................... 146
13.3.2 Details of application ..................................................................................... 146
13.4 Test organism ....................................................................................................... 147
13.5 Study design ......................................................................................................... 147
13.5.1 Study type ..................................................................................................... 147
13.5.2 Test duration type ......................................................................................... 147
13.5.3 Test type ....................................................................................................... 147
13.5.4 Water media type .......................................................................................... 147
13.5.5 Type of sediment ........................................................................................... 148
13.5.6 Total exposure duration ................................................................................. 148
13.5.7 Test conditions .............................................................................................. 148
13.5.8 Other information on materials and methods ................................................. 149
13.6 Results ................................................................................................................. 150
13.7 Validity .................................................................................................................. 158
13.8 Additional experiments ......................................................................................... 159
13.9 Conclusion ............................................................................................................ 159
13.10 Executive summary .............................................................................................. 159
Index of Content, Index of Tables, Index of Figures
VIII
14 Emergence Test with Chironomids (OECD TG 219) - Au ...................................... 161
14.1 Test principle ........................................................................................................ 161
14.2 Materials and methods ......................................................................................... 161
14.2.1 Test guideline ................................................................................................ 161
14.2.2 GLP ............................................................................................................... 161
14.3 Test substances ................................................................................................... 161
14.4 Analytical monitoring ............................................................................................. 161
14.4.1 Details on sediment and water ...................................................................... 162
14.4.2 Details on application .................................................................................... 162
14.5 Test organism ....................................................................................................... 163
14.6 Study design ......................................................................................................... 163
14.6.1 Study type ..................................................................................................... 163
14.6.2 Test duration type ......................................................................................... 163
14.6.3 Test type ....................................................................................................... 163
14.6.4 Water media type .......................................................................................... 163
14.6.5 Type of sediment ........................................................................................... 164
14.6.6 Total exposure duration ................................................................................. 164
14.6.7 Test conditions .............................................................................................. 164
14.6.8 Other information on materials and methods ................................................. 165
14.7 Results ................................................................................................................. 166
14.8 Validity .................................................................................................................. 173
14.9 Conclusion ............................................................................................................ 173
14.10 Executive summary .............................................................................................. 174
15 Reproduction Tests with Daphnids (OECD TG 211) – TiO2 .................................. 176
15.1 Test principle ........................................................................................................ 176
15.2 Materials and methods ......................................................................................... 176
15.2.1 Test guideline ................................................................................................ 176
15.2.2 GLP ............................................................................................................... 176
15.2.3 Test substances ............................................................................................ 176
15.3 Analytical monitoring ............................................................................................. 176
15.3.1 Details on sampling ....................................................................................... 177
15.3.2 Details on analytical methods ........................................................................ 177
15.3.3 Details on test suspensions ........................................................................... 178

Index of Content, Index of Tables, Index of Figures
IX
15.4 Test organism ....................................................................................................... 178
15.5 Study design ......................................................................................................... 179
15.5.1 Study type ..................................................................................................... 179
15.5.2 Water medium type ....................................................................................... 179
15.5.3 Total exposure duration ................................................................................. 179
15.5.4 Test conditions .............................................................................................. 179
15.5.5 Other information on materials and methods ................................................. 183
15.6 Results ................................................................................................................. 185
15.6.1 P25 - First test ............................................................................................... 185
15.6.2 P25 - Second test .......................................................................................... 192
15.6.3 P25 – Third test ............................................................................................. 201
15.7 Validity .................................................................................................................. 210
15.8 Conclusion ............................................................................................................ 210
15.9 Executive summary .............................................................................................. 210
16 Acute Immobilisation Tests with Daphnids (OECD TG 202) - Au .......................... 212
16.1 Test principle ........................................................................................................ 212
16.2 Materials and methods ......................................................................................... 212
16.2.1 Test guideline ................................................................................................ 212
16.2.2 GLP ............................................................................................................... 212
16.3 Test substances ................................................................................................... 212
16.4 Analytical monitoring ............................................................................................. 212
16.4.1 Details on sampling ....................................................................................... 212
16.4.2 Details on analytical methods ........................................................................ 212
16.4.3 Details on test suspensions ........................................................................... 213
16.5 Test organism ....................................................................................................... 213
16.6 Study design ......................................................................................................... 214
16.6.1 Study type ..................................................................................................... 214
16.6.2 Water medium type ....................................................................................... 214
16.6.3 Total exposure duration ................................................................................. 214
16.6.4 Test conditions .............................................................................................. 214
16.6.5 Other information on materials and methods ................................................. 217
16.7 Results ................................................................................................................. 217
16.7.1 Pre-test ......................................................................................................... 217
Index of Content, Index of Tables, Index of Figures
X
16.7.2 Main test ....................................................................................................... 219
16.8 Validity .................................................................................................................. 223
16.9 Conclusion ............................................................................................................ 223
16.10 Executive summary .............................................................................................. 224
17 Growth Inhibition Tests with Algae (OECD TG 201) - Au ...................................... 225
17.1 Test principle ........................................................................................................ 225
17.2 Materials and methods ......................................................................................... 225
17.2.1 Test guideline ................................................................................................ 225
17.2.2 GLP ............................................................................................................... 225
17.3 Test substances ................................................................................................... 225
17.4 Analytical monitoring ............................................................................................. 225
17.4.1 Details on sampling ....................................................................................... 225
17.4.2 Details on analytical methods ........................................................................ 225
17.4.3 Details on test suspensions ........................................................................... 226
17.5 Test organism ....................................................................................................... 227
17.6 Study design ......................................................................................................... 227
17.6.1 Study type ..................................................................................................... 227
17.6.2 Water medium type ....................................................................................... 227
17.6.3 Total exposure duration ................................................................................. 227
17.6.4 Test conditions .............................................................................................. 227
17.6.5 Other information on materials and methods ................................................. 228
17.7 Results ................................................................................................................. 229
17.7.1 Particle size distribution ................................................................................. 229
17.7.2 Test concentrations ....................................................................................... 229
17.7.3 Test 1 ............................................................................................................ 229
17.7.4 Test 2 ............................................................................................................ 237
17.7.5 Test 3 ............................................................................................................ 240
17.8 Validity .................................................................................................................. 242
17.9 Conclusion ............................................................................................................ 244
17.10 Executive summary .............................................................................................. 245
18 Tests with Fish Embryos (OECD draft proposal) - Au ........................................... 247
18.1 Test principle ........................................................................................................ 247
18.2 Materials and methods ......................................................................................... 247
Index of Content, Index of Tables, Index of Figures
XI
18.2.1 Test guideline ................................................................................................ 247
18.2.2 GLP ............................................................................................................... 247
18.3 Test substances ................................................................................................... 247
18.4 Analytical monitoring ............................................................................................. 247
18.4.1 Details on test suspensions ........................................................................... 247
18.5 Test organism ....................................................................................................... 248
18.6 Study design ......................................................................................................... 249
18.6.1 Study type ..................................................................................................... 249
18.6.2 Water medium type ....................................................................................... 249
18.6.3 Total exposure duration ................................................................................. 249
18.6.4 Test conditions .............................................................................................. 249
18.7 Results ................................................................................................................. 251
18.8 Validity .................................................................................................................. 255
18.9 Conclusion ............................................................................................................ 255
18.10 Executive summary .............................................................................................. 255
19 Extended summary ............................................................................................... 257
19.1 Introduction ........................................................................................................... 257
19.2 Pre-tests ............................................................................................................... 259
19.3 Main tests ............................................................................................................. 260
19.3.1 Tests with earthworms (OECD TG 222) – TiO2, Ag ....................................... 262
19.3.2 Tests with microorganisms – nitrogen transformation test (OECD TG 216) – TiO2 ................................................................................ 263
19.3.3 Tests with microorganisms – carbon transformation test (OECD TG 217) – TiO2 ................................................................................ 264
19.3.4 Tests with plants (OECD TG 208) – TiO2 ...................................................... 265
19.3.5 Tests with chironomids (OECD TG 219) – TiO2, Ag, Au ................................ 266
19.3.6 Tests with daphnids – reproduction (OECD TG 211) – TiO2 .......................... 269
19.3.7 Tests with daphnids – immobilisation (OECD TG 202) - Au ........................... 269
19.3.8 Tests with algae (OECD TG 201) - Au .......................................................... 270
19.3.9 Tests with fish embryos (OECD draft) - Au .................................................... 271
19.4 Recommendations for the test performance ......................................................... 272
19.4.1 Suitability of test guidelines ........................................................................... 272
19.4.2 Application of nanoparticles to solid test media (soil) ..................................... 273
19.4.3 Spiking of soil versus spiking of feed ............................................................. 273

Index of Content, Index of Tables, Index of Figures
XII
19.4.4 Application of insoluble nanoparticles in powder form to aquatic test media .. 273
19.4.5 Sensitivity of the applied test systems ........................................................... 274
19.4.6 Toxicity of dispersants ................................................................................... 274
19.4.7 Total concentration vs. ion concentration ...................................................... 274
20 Literature .............................................................................................................. 275
21 Annex ................................................................................................................... 276
21.1 Raw data – methods for chemical analyses (chapter 4) ........................................ 276
21.1.1 Raw data examples: Ti .................................................................................. 276
21.1.2 Raw data examples: total Ag ......................................................................... 278
21.1.3 Raw data examples: Ag+ (DGTs) ................................................................... 281
21.1.4 Raw data examples: total Au ......................................................................... 285
21.1.5 Certificates of reference material and standard: Ti ........................................ 287
21.1.6 Certificates of reference material and standard: Ag ....................................... 290
21.1.7 Certificates of reference material and standard: Au ....................................... 294
21.2 Raw data – Reproduction test with earthworms – TiO2 (chapter 7) ....................... 297
21.2.1 P25 - First test ............................................................................................... 297
21.2.2 P25 - Second test .......................................................................................... 300
21.2.3 P25 - Third test .............................................................................................. 302
21.2.4 NM-101 - First test ........................................................................................ 304
21.2.5 NM-101 - Second test ................................................................................... 307
21.2.6 NM-103 - First test ........................................................................................ 309
21.2.7 NM-103 - Second test ................................................................................... 311
21.2.8 Ti concentration in earthworms ..................................................................... 314
21.3 Raw data – Reproduction test with earthworms – Ag (chapter 8) .......................... 327
21.3.1 Chemical analysis ......................................................................................... 327
21.3.2 Ecotoxicological test ...................................................................................... 334
21.4 Raw data - Test with plants (chapter 11) ............................................................... 337
21.5 Raw data – Emergence test with chironomids – TiO2 (chapter 12) ........................ 342
21.5.1 P25 ............................................................................................................... 342
21.5.2 NM-101 ......................................................................................................... 353
21.6 Raw data – Emergence test with chironomids – Ag (chapter 13) .......................... 363
21.6.1 Chemical analysis ......................................................................................... 363
21.6.2 Ecotoxicological test ...................................................................................... 367

Index of Content, Index of Tables, Index of Figures
XIII
21.7 Raw data – Emergence test with chironomids (Au nanoparticles) ......................... 374
21.7.1 Chemical analysis ......................................................................................... 374
21.7.2 Ecotoxicological test ...................................................................................... 379
Temp°C .......................................................................................................................... 388
21.8 Raw data – Reproduction test with daphnids (chapter 15) .................................... 395
21.8.1 P25 - first test ................................................................................................ 395
21.8.2 P25 - second test .......................................................................................... 403
21.8.3 P25 – third test .............................................................................................. 416
21.9 Raw data – Immobilisation test with daphnids (chapter 16) ................................... 423
21.9.1 NM-330 – pre-test (range finder) ................................................................... 423
21.9.2 NM-330 - main test ........................................................................................ 424
21.10 Raw data – growth test with algae – Au (chapter 17): ........................................... 426
21.10.1 NM-330 – first test ......................................................................................... 426
21.10.2 NM-330 – second test ................................................................................... 429
21.10.3 NM-330 – third test ........................................................................................ 431

Index of Content, Index of Tables, Index of Figures
XIV
Index of Tables
Table 1: Nanoparticles and test guidelines selected for investigation within the project. 3
Table 2: Properties of the applied TiO2 nanoparticles. 4Table 3: Properties of the applied Ag nanomaterial. 4Table 4: TiO2 in earthworms: LODs/LOQs, correlation. 10Table 5: Silver in soil: LODs/LOQs, correlation. 13Table 6: Silver in aqueous and sediment samples: LODs/LOQs, correlation. 16Table 7: Silver in aqueous and sediment samples: method validation information. 18Table 8: Determination of silver ions: LODs/LOQs, correlation. 21Table 9: Determination of silver ions: information on method validation. 22Table 10: Silver in earthworms: LODs/LOQs, correlation. 24Table 11: Au in daphnids and chironomids: LODs/LOQs. 27Table 12: Physico-chemical properties of the applied soil. 30Table 13: Pre-tests: earthworm reproduction test with P25 and Ag
(weight, test start). 34Table 14: Pre-tests: earthworm reproduction test with P25 and Ag
(weight, test end). 34Table 15: Pre-tests: earthworm reproduction test with P25 and Ag
(weight increase, test end). 35Table 16: Pre-tests: earthworm reproduction test with P25 and Ag
(number of offspring). 35Table 17: Homogeneity of spiking: recovery of NM-300K in soil (earthworm test). 40Table 18: Homogeneity of spiking: recovery of silver in soil (nitrification test). 42Table 19: Ti concentration in the filtrate of a TiO2 dispersion after diverse filtration
processes. 46Table 20: TiO2: Incubation conditions in the reproduction test with earthworms. 51Table 21: P25 – Test with earthworms (1st test): NOEC values. 54Table 22: P25 – Test with earthworms (1st test): Mean weight at test start and
weight change at test end 55Table 23: P25 – Test with earthworms (1st test): juveniles at test end. 56Table 24: P25 – Test with earthworms (2nd test): NOEC values. 56Table 25: P25 – Test with earthworms (2nd test): mean weight at test start and
weight change at test end 57Table 26: P25 – Test with earthworms (2nd test): juveniles at test end. 58Table 27: P25 – Test with earthworms (3rd test): NOEC-values 58Table 28: P25 – Test with earthworms (3rd test): mean weight at test start and
weight change at test end. 59Table 29: P25 – Test with earthworms (3rd test): juveniles at test end. 59Table 30: NM-101 – Test with earthworms (1st test): NOEC values. 60Table 31: NM-101 – Test with earthworms (1st test): mean weight at test start and
weight change at test end. 61Table 32: NM-101 – Test with earthworms (1st test): juveniles at test end. 62Table 33: NM-101 – Test with earthworms (2nd test): NOEC values. 62

Index of Content, Index of Tables, Index of Figures
XV
Table 34: NM-101 – Test with earthworms (2nd test): mean weight at test start and weight change at test end. 63
Table 35: NM-101 – Test with earthworms (2nd test): juveniles at test end. 63Table 36: NM-103 – Test with earthworms (1st test): NOEC-values. 64Table 37: NM-103 – Test with earthworms (1st test): mean weight at test start and
weight change at test end. 65Table 38: NM-103 – Test with earthworms (1st test): juveniles at test end. 66Table 39: NM-103 – Test with earthworms (2nd test): NOEC-values. 66Table 40: NM-103 – Test with earthworms (2nd test): mean weight at test start and
weight change at test end. 67Table 41: NM-103 – Test with earthworms (2nd test): juveniles at test end. 67Table 42: P25 - Ti concentration in earthworms (1st test). 70Table 43: P25 - Ti concentration in earthworms (2nd test). 70Table 44: NM-101 - Ti concentration in earthworms (1st test). 70Table 45: NM-103: Ti concentration in earthworms (1st test). 71Table 46: NM-300K – Test with earthworms, incubation conditions. 78Table 47: NM-300K – Test with earthworms: Ag concentrations in spiked soil. 81Table 48: NM-300K – Test with earthworms: concentration of Ag ions measured by
DGTs in soil. 82Table 49: NM-300K – Test with earthworms: summary of effects on number of
offspring [mg/kg]. 83Table 50: NM-300K – Test with earthworms: mean weight at test start and weight
change at test end. 86Table 51: NM-300K – Test with earthworms: mean weight of the offspring
presented in Figure 17. 89Table 52: NM-300K – Test with earthworms: number of juveniles at test end. 90Table 53: NM-300K – Test with earthworms: Ag concentration in earthworms. 91Table 54: NM-300K - earthworm reproduction: summary of the effect values. 93Table 55: Test soil for microbial tests: soil parameters. 98Table 56: Test soil for microbial tests: storage information. 98Table 57: P25 - N-transformation: zeta potential in the stock dispersion used for
application via dispersion. 100Table 58: P25 - N-transformation: summary of the effects. 101Table 59: P25 - N-transformation: mean nitrate content [mg/kg]. 101Table 60: P25 - N-transformation: mean nitrate content, [%] of control. 101Table 61: P25 - N-transformation: N-transformation rate [mg/(kg*28 d)]. 102Table 62: P25 - N-transformation: content of nitrate [mg/kg dry mass soil]. 102Table 63: P25 - N-transformation: summary of effects. 104Table 64: Test soil for microbial tests: soil parameters. 108Table 65: Test soil for microbial tests: storage information. 108Table 66: P25 - C-transformation: zeta potential of the stock dispersion for
application via dispersion. 110Table 67: P25 - C-transformation: mean short-term respiration rate [mg O2/(kg*h)]. 111Table 68: P25 - C-transformation: mean short-term respiration rate; [%] of control. 111Table 69: P25 - C-transformation: short-term respiration rate (SIR) [mg O2/(kg*h)]. 112Table 70: P25 - C-transformation: mean short-term respiration rate [mg O2/(kg*h)]. 113Table 71: P25 - C-transformation: mean short-term respiration rate, [%] of control. 113

Index of Content, Index of Tables, Index of Figures
XVI
Table 72: P25 – Test with plants: zeta potential of the stock dispersion for application via dispersion. 121
Table 73: P25 – Plant test: summary of the effects. 122Table 74: P25 – Plant test: pathological symptoms [% plants]. 122Table 75: P25 – Plant test: emergence rate at test end [%]. 123Table 76: P25 – Plant test: emergence rate at test end compared to control [%]. 124Table 77: P25 – Plant test: fresh weight of the shoots; mean values ± SD [g]. 124Table 78: P25 – Plant test: growth inhibition related to control at test end [% FW]. 124Table 79: P25 – Plant test: mean root length of main root biomass [cm]. 124Table 80: P25 – Plant test: inhibition of mean root length of main root biomass [%]. 125Table 81: P25 – test with plants: summary of the effect values. 129Table 82: P25 - Test with chironomids: zeta potential. 136Table 83: P25 - Test with chironomids: particle size distribution (spiked water). 137Table 84: P25 - Test with chironomids: Ti concentration. 138Table 85: P25 - Test with chironomids: emergence. 139Table 86: P25 - Test with chironomids: development time [d] and rate [1/d]. 139Table 87: Test with chironomids - NM-101: zeta potential. 140Table 88: NM-101 - Test with chironomids: Ti concentrations. 140Table 89: NM-101 - Test with chironomids: emergence. 142Table 90: NM-101 - Test with chironomids: development time [d] and rate [1/d]. 142Table 91: Comparison of emergence of chironomids in the presence of
NM-300KDIS (dispersant of NM-300K) and the control. 150Table 92: NM-300K - Test with chironomids: zeta potential in test medium. 151Table 93: NM-300K - Test with chironomids: particle size distribution (spiked water). 152Table 94: NM-300K - Test with chironomids: Ag concentration of stock suspensions. 153Table 95: NM-300K - Test with chironomids: Ag concentration in test. 154Table 96: NM-300K - Test with chironomids: Ag concentration in dried sediment
samples after 28 days. 155Table 97: NM-300K - Test with chironomids: concentration of Ag ions measured
by DGTs in the sediment at test end. 156Table 98: NM-300K - Test with chironomids: summary of the effects. 157Table 99: NM-300K - Test with chironomids: emergence. 157Table 100: NM-300K - Test with chironomids: development time [d] and rate [1/d]. 158Table 101: NM-300K – test with chironomids: summary of effect values. 160Table 102: NM-330 – Test with chironomids: zeta potential. 167Table 103: Particle size distribution in the chironomid test (spiked water) with
NM-330 (gold nanoparticles in dispersant). 167Table 104: Concentration of Au in the test vessels with NM-330 (overlaying water). 169Table 105: Concentration of Au in the test vessels with NM-330 (sediment). 170Table 106: Emergence at test end. Emerged midges [Ind.] and emergence rate
[% of introduced larvae]; concentrations given as nominal values. 172Table 107: Development time [d] and rate [1/d] of midges. 173Table 108: NM-330, NM-330DIS – test with chironomids: summary of the effects. 175Table 109: Chemical parameter of the holding- and dilution-water in the first test 180Table 110: Chemical parameter of the holding- and dilution-water in the second test 181Table 111: Chemical parameter of the holding- and dilution-water in the third test 182

Index of Content, Index of Tables, Index of Figures
XVII
Table 112: P25 – test with daphnids: concentration of TiO2 determined in the supernatant of the test vessels. 184
Table 113: P25 – 1st test with daphnids: zeta potential. 185Table 114: P25 – 1st test with daphnids: particle size distribution. 186Table 115: P25 – 1st test with daphnids: Ti recovery [%] 187Table 116: P25 – 1st test with daphnids: survival and reproduction data. 187Table 117: P25 – 1st test with daphnids: body length of the adult daphnids at day 21. 190Table 118: P25 – 2nd test with daphnids: zeta potential. 192Table 119: P25 – 2nd test with daphnids: particle size distribution. 192Table 120: P25 – 2nd test with daphnids: Ti recovery [%]. 194Table 121: P25 – 2nd test with daphnids: survival and reproduction data. 195Table 122: P25 – 2nd test with daphnids: percent survival and reproduction. 195Table 123: P25 – 2nd test with daphnids: body length of the adult daphnids at day 21. 199Table 124: P25 – 3rd test with daphnids: zeta potential. 201Table 125: P25 – 3rd test with daphnids: particle size distribution. 202Table 126: P25 – 3rd test with daphnids: survival and reproduction data. 204Table 127: P25 – 3rd test with daphnids: percentage survival and reproduction. 204Table 128: P25 – 3rd test with daphnids: body length of the adult daphnids at day 21. 208Table 129: P25 – 3rd test with daphnids: summary of the NOEC values. 210Table 130: P25 – Compilation of the tests with daphnids: summary of the NOEC
values. 211Table 131: Chemical parameter of the holding- and dilution-water in the pre-test 215Table 132: Chemical parameter of the holding- and dilution-water in the main test 216Table 133: Immobilisation effects at 24 and 48 h. 218Table 134: Oxygen concentration and pH values during the test. 218Table 135: Zeta potential. 219Table 136: Concentration of Au in the test vessels with NM-330. 220Table 137: Summarised effects for NM-330 and NM-330DIS. 220Table 138: Immobilisation of Daphnia magna in the presence of NM-330 and
NM-330DIS. 221Table 139: Oxygen concentration and pH values during the test. 223Table 140: Summarised effects for NM-330 and NM-330DIS. 224Table 141: Particle size distribution of the NM-330 (gold nanoparticles in dispersant)
(mean value of 10 measurements; SD = standard deviation) 229Table 142: NM-330 – 1st test with algae: summary of the effects. 232Table 143: NM-330 – 2nd test with algae: summary of the effects. 237Table 144: Summarised percentage inhibition of algae growth by the concentrations
of NM-330 applied in all tests (evaluation period: 24 – 72 h). 240Table 145: NM-330 and NM-330DIS – test with algae: summary of the effects. 246Table 146: Summarised percentage inhibition of algal growth for the concentrations
of NM-330 applied in all tests (evaluation period: 24 – 72 h). 246Table 147: Letter code for observed effects. 250Table 148: Letter code for observed effects on hatching behaviour. 250Table 149: Zeta potential in ISO water (1/5 strength) 251Table 150: pH-values and oxygen saturation at test start. 251Table 151: Effect concentrations of NM-330 and NM-330DIS. 252

Index of Content, Index of Tables, Index of Figures
XVIII
Table 152: Overview on effects of embryos (number of individuals) observed during the study. 253
Table 153: Overview of hatching behaviour (number of individuals) observed during the study. 254
Table 154: Coagulated embryos [%]. 254Table 155: Hatched organisms [%]. 255Table 156: Effect concentrations of NM-330 and NM-330DIS. 256Table 157: Nanoparticles and test guidelines to be studied in the project. 258Table 158: Properties of the applied TiO2 nanoparticles. 258Table 159: Properties of the applied silver nanomaterial. 259Table 160: Summary of the effect values of the applied nanoparticles. 260Table 161: NM-300K - earthworm reproduction: summary of the effect values. 263Table 162: P25 - Summary of the effect values for nitrogen transformation. 264Table 163: P25 – test with plants: summary of the effect values. 266Table 164: NM-300K – test with chironomids: summary of effect values. 267Table 165: NM-330, NM-330DIS – test with chironomids: summary of the effects. 268Table 166: P25 – test with daphnids: summary of the NOEC values. 269Table 167: NM-330 and NM-330DIS – test with algae: summary of the effects. 271Table 168: Summarised percentage inhibition of algal growth for the concentrations
of NM-330 applied in all tests (evaluation period: 24 – 72 h). 271Table 169: Effect concentrations of NM-330 and NM-330DIS. 272Table 170: P25 (1st test) – earthworm test: living worms after 28 days [Individuals]. 297Table 171: P25 (1st test) – earthworm test: biomass of worm batches at
test start [g]. 297Table 172: P25 (1st test) – earthworm test: biomass of worm batches after
28 days [g]. 298Table 173: P25 (1st test) – earthworm test: number of offspring at day 56. 298Table 174: P25 (1st test) – earthworm test: soil dry mass [%]. 299Table 175: P25 (1st test) – earthworm test: soil moisture [% WHC]. 299Table 176: P25 (1st test) – earthworm test: soil pH. 299Table 177: P25 (2nd test) – earthworm test: living worms after 28 days. 300Table 178: P25 (2nd test) – earthworm test: biomass of worm batches at
test start [g]. 300Table 179: P25 (2nd test) – earthworm test: biomass of worm batches after
28 days [g]. 300Table 180: P25 (2nd test) – earthworm test: number of offspring at day 56. 301Table 181: P25 (2nd test) – earthworm test: soil dry mass [%]. 301Table 182: P25 (2nd test) – earthworm test: Soil moisture [% WHC] 301Table 183: P25 (2nd test) – earthworm test: soil pH. 301Table 184: P25 (3rd test) – earthworm test: living worms after 28 days. 302Table 185: P25 (3rd test) – earthworm test: biomass of worm batches at
test start [g]. 302Table 186: P25 (3rd test) – earthworm test: biomass of worm batches after
28 days [g]. 302Table 187: P25 (3rd test) – earthworm test: number of offspring at day 56. 303Table 188: P25 (3rd test) – earthworm test: soil dry mass [%]. 303Table 189: P25 (3rd test) – earthworm test: soil moisture [% WHC]. 303

Index of Content, Index of Tables, Index of Figures
XIX
Table 190: P25 (3rd test) – earthworm test: soil pH. 303Table 191: NM-101 (1st test) – earthworm test: living worms after 28 days. 304Table 192: NM-101 (1st test) – earthworm test: biomass of worm batches at
test start [g]. 304Table 193: NM-101 (1st test) – earthworm test: biomass of worm batches after
28 days [g]. 305Table 194: NM-101 (1st test) – earthworm test: .umber of offspring at day 56. 306Table 195: NM-101 (1st test) – earthworm test: soil dry mass [%]. 306Table 196: NM-101 (1st test) – earthworm test: soil moisture [% WHC]. 306Table 197: NM-101 (1st test): – earthworm test: soil pH. 306Table 198: NM-101 (2nd test) – earthworm test: living worms after 28 days. 307Table 199: NM-101 (2nd test) – earthworm test: biomass of the worm batches at
test start [g]. 307Table 200: NM-101 (2nd test) – earthworm test: biomass of the worm batches after
28 days [g]. 307Table 201: NM-101 (2nd test) – earthworm test: number of offspring at day 56. 307Table 202: NM-101 (2nd test) – earthworm test: soil dry mass [%]. 308Table 203: NM-101 (2nd test) – earthworm test: soil moisture as [% WHC]. 308Table 204: NM-101 (2nd test) – earthworm test: soil pH. 308Table 205: NM-103 (1st test) – earthworm test: living worms after 28 days. 309Table 206: NM-103 (1st test) – earthworm test: biomass of the worm batches at
test start [g]. 309Table 207: NM-103 (1st test) – earthworm test: biomass of the worm batches after
28 days [g]. 310Table 208: NM-103 (1st test) – earthworm test: number of offspring at day 56. 310Table 209: NM-103 (1st test) – earthworm test: soil dry mass content [%]. 311Table 210: NM-103 (1st test) – earthworm test: soil moisture as [% WHC]. 311Table 211: NM-103 (1st test) – earthworm test: soil pH. 311Table 212: NM-103 (2nd test) – earthworm test: living worms after 28 days. 311Table 213: NM-103 (2nd test) – earthworm test: biomass of the worm batches at
test start [g]. 312Table 214: NM-103 (2nd test) – earthworm test: biomass of the worm batches after
28 days [g]. 312Table 215: NM-103 (2nd test) – earthworm test: number of offspring at day 56. 312Table 216: NM-103 (2nd test) – earthworm test: soil dry mass [%]. 312Table 217: NM-103 (2nd test) – earthworm test: Soil moisture [% WHC]. 312Table 218: NM-103 (2nd test) – earthworm test: soil pH. 313Table 219: P25 (1st test) – Ti concentration in earthworms: LODs/LOQs, correlation. 314Table 220: P25 (1st test): Ti concentration in earthworms. 315Table 221: P25 (2nd test): Ti concentration in earthworms. 316Table 222: NM-101 - Ti concentration in earthworms: LODs/LOQs, correlation. 319Table 223: NM-101: Ti concentration in earthworms. 320Table 224: NM-103 - Ti concentration in earthworms: LODs/LOQs, correlation. 323Table 225: NM-103: Ti concentration in earthworms. 324Table 226: NM-300K - Ag concentration in earthworms: LODs/LOQs, correlation. 327Table 227: NM-300K: Ag concentration in earthworms. 328

Index of Content, Index of Tables, Index of Figures
XX
Table 228: NM-300K: measured silver concentration in DGT extracts and calculated estimated average Ag concentration in matrix - day 0. 331
Table 229: NM-300K: measured silver concentration in DGT extracts and calculated estimated average Ag concentration in matrix – day 28. 332
Table 230: NM-300K: measured silver concentration in DGT extracts and calculated estimated average Ag concentration in matrix - day 56. 333
Table 231: NM-300K – earthworm test: living worms after 28 days. 334Table 232: NM-300K – earthworm test: biomass of the worm batches at test start. 334Table 233: NM-300K – earthworm test: biomass of the worm batches after 28 days. 335Table 234: NM-300K – earthworm test: number of offspring at day 56. 335Table 235: NM-300K – earthworm test: soil dry mass content [%]. 336Table 236: NM-300K – earthworm test: soil moisture [% WHC]. 336Table 237: NM-300K – earthworm test: soil pH. 336Table 238: P25 – Test with plants: pathological symptoms [plants]. 337Table 239: P25 – Test with plants: emergence at test end [number of plants]. 337Table 240: P25 – Test with plants: fresh mass per plant [g]. 338Table 241: P25 – Test with plants: root length - Avena sativa [cm]. 339Table 242: P25 – Test with plants: root length - Sinapis alba [cm]. 340Table 243: P25 – Test with plants: root length - Phaseolus aureus [cm]. 341Table 244: P25 – Chironomid test: quality control/validation of chemical analyses. 342Table 245: P25 – Chironomid test: physico-chemical test parameters. 344Table 246: P25 – Chironomid test: addition of food (TetraMin grinded). 345Table 247: P25 – Chironomid test: number of hatched midges and sex. 347Table 248: P25 – Chironomid test: number of hatched midges and sex. 349Table 249: P25 – Chironomid test: oxygen concentration [%]. 351Table 250: P25 – Chironomid test: temperature (°C) and pH value. 352Table 251: NM-101 – Chironomid test: quality control / validation of chemical
analyses. 353Table 252: NM-101 – Chironomid test: physico-chemical test parameters. 355Table 253: NM-101 – Chironomid test: addition of Food (TetraMin grinded). 356Table 254: NM-101 – Chironomid test: oxygen concentration [%]. 359Table 255: NM-101 – Chironomid test: temperature (°C) and pH value. 360Table 256: NM-101 – Chironomid test: number of hatched midges and sex. 361Table 257: NM-300K – Chironomid test: quality control / validation of chemical
analyses. 363Table 258: NM-300K – Chironomid test: measured silver concentrations in DGT extracts
and calculated estimated average Ag concentration in matrix. 364Table 259: NM-300K – Chironomid test: mean estimated average Ag concentration
in matrix ± SD [µg/L]. 365Table 260: Physico-chemical test parameters. 367Table 261: NM-300K – Chironomid test: addition of Food (TetraMin grinded). 368Table 262: NM-300K – Chironomid test: oxygen concentration [%]. 370Table 263: NM-300K – Chironomid test: temperature (°C) and pH value. 371Table 264: NM-300K – Chironomid test: number of hatched midges and sex. 372Table 265: Physico-chemical test parameters: control, NM-330DIS (dispersant). 379Table 266: Addition of Food (TetraMin grinded): control, NM-330DIS (dispersant). 381

Index of Content, Index of Tables, Index of Figures
XXI
Table 267: Oxygen concentration [%]: control, NM-330DIS (dispersant). 385Table 268: Oxygen concentration [%]: NM-330 (gold nanoparticles in dispersant). 386Table 269: Temperature (°C) and pH value: control, NM-330DIS (dispersant). 387Table 270: Temperature (°C) and pH value: NM-330 (gold nanoparticles in
dispersant). 388Table 271: Number of hatched midges and sex: control, NM-330DIS (dispersant). 389Table 272: Number of hatched midges and sex: NM-330 (gold nanoparticles in
dispersant). 392Table 273: P25 (1st test) – Test with daphnids: Ti concentrations. 395Table 274: P25 (1st test) – Test with daphnids: oxygen saturation of the overlaying
water. 398Table 275: P25 (1st test) – Test with daphnids: pH of the overlaying water. 398Table 276: P25 (1st test) – Test with daphnids: temperature of the overlaying water [°C].
398Table 277: P25 (1st test) – Test with daphnids: light intensity [lux]. 399Table 278: P25 (1st test) – Test with daphnids: extinction (585 nm) as measure for
the density of algae used as feed. 399Table 279: P25 (1st test) – Test with daphnids: offspring per replicate and day. 399Table 280: P25 (2nd test) - Test with daphnids: Ti concentration. 403Table 281: P25 (2nd test) – Test with daphnids: oxygen saturation of the overlaying
water. 406Table 282: P25 (2nd test) – Test with daphnids: pH of the overlaying water. 407Table 283: P25 (2nd test) – Test with daphnids: temperature of the overlaying
water [°C] in the climatic chamber. 407Table 284: P25 (2nd test) – Test with daphnids: light intensity [lux] in the climatic
chamber. 407Table 285: P25 (2nd test) – Test with daphnids: extinction (585 nm) as measure for
the density of algae used as feed. 408Table 286: P25 (2nd test) – Test with daphnids: offspring per replicate and day. 408Table 287: P25 (3rd test) – Test with daphnids: oxygen saturation of the overlaying
water. 416Table 288: P25 (3rd test) – Test with daphnids: pH of the overlaying water. 416Table 289: P25 (3rd test) – Test with daphnids: temperature of the overlaying
water [°C] in the climatic chamber. 417Table 290: P25 (3rd test) – Test with daphnids: light intensity [lux] in the climatic
chamber. 417Table 291: P25 (3rd test) – Test with daphnids: extinction (585 nm) as measure for
the density of algae used as feed. 417Table 292: P25 (3rd test) – Test with daphnids: offspring per replicate and day. 418Table 293: NM-330 – Acute test with daphnids: number of immobilized daphnids in
the pre-test (range finder). 423Table 294: NM-330 – Acut test with daphnids: chemical analysis. 424Table 295: NM-330 – Acut test with daphnids: calibration. 424Table 296: NM-330 – Acute test with daphnids: number of immobilized daphnids in
the main test. 425Table 297: NM-330 – Test with algae: number of algae (test concentrations
achieved by dilution with ultrapure water). 426

Index of Content, Index of Tables, Index of Figures
XXII
Table 298: NM-330 – Test with algae: number of algae (test concentrations achieved by dilution with dispersant). 427
Table 299: NM-330DIS – Test with algae: number of algae. 428Table 300: NM-330 – Test with algae: number of algae (test concentrations
achieved by dilution with ultrapure water). 429Table 301: NM-330DIS – Test with algae: number of algae. 430Table 302: NM-330 and NM-330DIS – Test with algae: number of algae (test
concentrations achieved by dilution with ultrapure water). 431

Index of Content, Index of Tables, Index of Figures
XXIII
Index of Figures Figure 1: Structure of the pre-tests. 29Figure 2: Pre-tests: earthworm reproduction test with P25 and Ag. 36Figure 3: Pre-tests: effects of different application forms for Ag nanoparticles on
nitrification activity. 38Figure 4: Pre-tests: standard deviation of nitrification activity in the nitrification tests
with Ag resulting in ~50% inhibition. 38Figure 5: Pre-tests: effect of different application forms of P25 on nitrification
activity. 39Figure 6: Effect of stabilisers (sodium hexametaphosphate, 0.01%) and P25 in the
growth test with algae. 47Figure 7: E. fetida - Number of juveniles in natural soil (RefeSol 01-A) during the
year. 68Figure 8: E. fetida - Number of juveniles in natural soil spiked with P25 (200 mg/kg)
(RefeSol 01-A) during the year. 68Figure 9: P25 – 1st test with earthworms: Ti concentration in earthworms
(purged gut). 71Figure 10: P25 – 2nd test with earthworms: Ti concentration in earthworms
(purged gut). 71Figure 11: NM-101 – 1st test with earthworms: Ti concentration in earthworms
(purged gut). 71Figure 12: NM-103 – 1st test with earthworms: Ti concentration in earthworms
(purged gut). 71Figure 13: NM-300K – Test with earthworms: spiked feed, weight change -
concentration-effect curve. 84Figure 14: NM-300K – Test with earthworms: spiked soil, weight change -
concentration-effect curve. 85Figure 15: NM-300K – Test with earthworms: spiked feed, reproduction -
concentration-effect curve. 87Figure 16: NM-300K – Test with earthworms: spiked soil, reproduction -
concentration-effect curve. 88Figure 17: NM-300K - Representative sizes of earthworms after 56 days. 89Figure 18: NM-300K – Test with earthworms: Ag concentration in earthworms. 91Figure 19: P25 – C-Tranformation: mean short-term respiration rate [(mg O2/(kg*h)]. 112Figure 20: P25 – C-Transformation: mean short-term respiration rate [mg O2/(kg*h)]
(test repetition). 114Figure 21: P25 - Plants after the exposure period of 14 days. 123Figure 22: P25 – Test with plants: shoot fresh weight response curve (results for
application via powder). 126Figure 23: NM-300K – Test with chironomids: days versus recoveries in aqueous
samples. 155Figure 24: NM-300K – Test with chironomids: Colour of the test vessels at day 1 170Figure 25: NM-300K – Test with chironomids: Colour of the test vessels at day 12 170Figure 26: P25 – 1st test with daphnids: mean cumulative offspring per survivor of
Daphnia magna after 21 d. 188Figure 27: P25 – 1st test with daphnids: concentration-effect curve on mean
cumulative offspring per survivor of Daphnia magna after 21 d. 188Figure 28: P25 – 1st test with daphnids: age at first reproduction of Daphnia magna. 189

Index of Content, Index of Tables, Index of Figures
XXIV
Figure 29: P25 – 1st test with daphnids: intrinsic rate of population increase r of Daphnia magna after 21 d. 189
Figure 30: P25 – 1st test with daphnids: length response curve after 21 days. 191Figure 31: P25 – 2nd test with daphnids: mean cumulative offspring per survivor of
Daphnia magna after 21 d. 196Figure 32: P25 – 2nd test with daphnids: age at first reproduction of Daphnia magna. 197Figure 33: P25 – 2nd test with daphnids: intrinsic rate of population increase r of
Daphnia magna after 21 days. 198Figure 34: P25 – 2nd test with daphnids: response curve of the body length after
21 days. 200Figure 35: P25 – 3rd test with daphnids: mean cumulative offspring per survivor of
Daphnia magna in presence of P25 after 21 d. 205Figure 36: P25 – 3rd test with daphnids: age at first reproduction of Daphnia magna
in presence of P25. 206Figure 37: P25 – 3rd test with daphnids: intrinsic rate of population increase r of
Daphnia magna after 21 days. 207Figure 38: P25 – 3rd test with daphnids: response curve of the body length after
21 days. 209Figure 39: NM-330DIS – effect on mobility of Daphnia magna. 221Figure 40: NM-330DIS –effect on mobility of Daphnia magna. 222Figure 41: NM-330 - effect on cell number of Pseudokirchneriella subcapitata. 230Figure 42: NM-330 - effect on cell number of Pseudokirchneriella subcapitata. 231Figure 43: NM-330DIS - effect on cell number of Pseudokirchneriella subcapitata. 231Figure 44: NM-330 - effect on yield of Pseudokirchneriella subcapitata. 233Figure 45: NM-330 - effect on growth rate of Pseudokirchneriella subcapitata. 233Figure 46: NM-330 - effect on yield of Pseudokirchneriella subcapitata . 234Figure 47: NM-330 - effect on growth rate of Pseudokirchneriella subcapitata. 234Figure 48: NM-330DIS –effect on yield of Pseudokirchneriella subcapitata. 235Figure 49: NM-330DIS – effect on growth rate of Pseudokirchneriella subcapitata. 235Figure 50: NM-330DIS – effect on yield of Pseudokirchneriella subcapitata. 236Figure 51: NM-330DIS – effect on growth rate of Pseudokirchneriella subcapitata. 236Figure 52: NM-330 – effect on yield of Pseudokirchneriella subcapitata. 238Figure 53: NM-330 – effect on growth rate of Pseudokirchneriella subcapitata. 238Figure 54: NM-330DIS – effect on yield of Pseudokirchneriella subcapitata. 239Figure 55: NM-330DIS - effect on growth rate of Pseudokirchneriella subcapitata. 239Figure 56: Concentration-effect curve showing the influence of NM-330on yield of
the introduced Pseudokirchneriella subcapitata. 241Figure 57: Concentration-effect curve showing the influence of NM-330 on growth rate of
the introduced Pseudokirchneriella subcapitata. 241Figure 58: NM-300K - Test with chironomids: weighed concentration vs. estimated
average Ag concentration in matrix obtained from the DGT extracts. 366Figure 59: P25 - Calibration curve - extinction of algae density and organic carbon
concentration. 397Figure 60: P25 - Calibration curve - extinction of algae density and cell number. 397

Index of Content, Index of Tables, Index of Figures
XXV
Index of Abbreviations
CV: coefficient of variation
DGT: Diffusive gradients in thin films
dm: Dry matter
ECx: effect concentration (x %)
FW: Fresh weight
GLP: Good laboratory practice
LOEC: No observed effect concentration
LOD: Limit of detection
LOQ: Limit of quantification
lux: Lux
n.d. not determined due to mathematical reasons or inappropriate data
NOEC: No observed effect concentration
SD: Standard deviation
TG: Test guideline
WHCmax: Maximum water holding capacity

Preliminary remark 1
1 Preliminary remark
Primarily, the research project aimed to extend the property data available for titanium dioxide (TiO2) and silver (Ag). In a second approach, gold (Au) nanoparticles were investigated.
The results are presented separately for each type of nanoparticle.
Basic procedures were investigated in pre-tests. For these studies titanium dioxide and silver nanoparticles were applied. Due to the different modes of action and differing ecotoxicity, not every procedure was investigated with both types of materials. For a comprehensive conclusion results obtained for both types of materials are necessary. Therefore, all results of the pre-tests are presented together.
The responsibilities were as follows:
• Kerstin Hund-Rinke: ecotoxicological tests
• Thorsten Klawonn: chemical analyses
Introduction 2
2 Introduction
At the nanoscale level, the physical, chemical, and biological properties of materials differ in fundamental, and often valuable, ways from the properties of individual atoms and molecules, or bulk matter. Research and development in nanotechnology is directed towards creating im-proved materials, devices, and systems that exploit the new properties. The specific properties of nanoparticles proved to be very useful for an increasing number of commercial applications, such as protective coatings, light-weight materials or self-cleaning clothing, for example.
As a consequence of their specific properties, nanoparticles differ from conventional chemicals with respect to their impact on human health and the environment. Therefore, traditional testing and assessment methods typically used to determine the safety of conventional chemicals are not necessarily (fully) applicable to nanoparticles.
In November 2007, OECD’s Working Party on Manufactured Nanomaterials (WPMN) launched a Sponsorship Programme involving OECD member countries as well as non-member econo-mies and other stakeholders to pool available expertise and to fund the safety testing of specific Manufactured Nanomaterials (MNs). In launching the Sponsorship Programme, the WPMN agreed on a priority list of 13 MNs selected for testing from a pool of nanomaterials that are in, or close to, commerce. The WPMN also agreed upon a list of endpoints for which the selected materials should be tested. Much valuable information on the safety of MNs can be derived by testing this representative set of nanomaterials with respect to human health and environmental safety.
As a sponsor country supporting research into TiO2 and a co-sponsor for Ag research, Germany, among others, is involved in assessing the potential effects of TiO2 and Ag nanoparticles with respect to human health and the environment. Several months after starting the present project, the work programme was extended to include the nanomaterial gold. Since ecotoxicological data based on standardised test methods, as requested for risk assessment, are not available for these substances, and information on modifications to standardised procedures for testing nanoparticles is lacking, the aim of the present project was to contribute to the following topics:
• Recommendations concerning the improvement of existing OECD Test Guidelines for the testing of nanoparticles
• Recommendations on the application of the investigated nanoparticles to the test me-dium
• Ecotoxicity of TiO2 and Ag nanoparticles with respect to:
o Earthworm reproduction
o Respiration rate of soil microflora
o Nitrification of soil microflora
o Growth of plants
o Reproduction of chironomids
o Reproduction of daphnids
• Ecotoxicity of gold with respect to:
o Growth of algae

Introduction 3
o Immobilisation of daphnids
o Development of fish embryos
o Reproduction of chironomids
As a first step in the present project the German Federal Environment Agency selected several nanoparticles from the priority list of the OECD Sponsorship Programme, and the tests that should be performed with these nanoparticles were selected on the basis of available informa-tion and priority (Table 1).
Table 1: Nanoparticles and test guidelines selected for investigation within the project.
Titanium dioxide Silver Gold Name of the product / code 1 / producer / OECD Test Guideline
Aeroxid® P252): Evonik
PC105 (NM-102):
Crystal Global
Hombikat UV 100 (NM-101): Sachtleben
UV TITAN M212 (NM-104): Sachtleben
UV TITAN M262 (NM-103): Sachtleben
Ag Pure W10 (NM-300K)
Gold (NM 330): South Africa - MINTEK
201 (algae – growth) x
202 (daphnids - immobilisation) x
211 (daphnids - reproduction) x
219 (chironomids - emergence) x x x x
Draft – fish em-bryo test x
222 (earthworms - reproduction) x x x x
208 (plants - emergence, growth)
x
216/217 (soil microflora – N-/C-transformation)
x
1 Terms in brackets: code of the materials according to the OECD Sponsorship Programme; 2 P25 was distributed by Evonik; the OECD batch NM-105 is also the product AEROXIDE® TiO2 P25, but stems from a different batch
Table 2 and Table 3 show the characteristics of the applied TiO2 and Ag-nanoparticles. Gold nanoparticles were available as suspension. No further information was available.

Introduction 4
Table 2: Properties of the applied TiO2 nanoparticles. Data from the Joint Research Centre, European Commission
Nanoparticles NM-101 NM-103 NM-105 1 Crystal structure Anatase Rutile Rutile - Anatase
Purpose active component for photo catalytic reactions
UV screening agent in sunscreen
active component for photo catalytic reactions
Primary particle size (according to Scherrer) 8 nm 20 nm 21 nm
Composition TiO2: 91.7% TiO2: 89.0% Al2O3: 6.2%
TiO2: > 99%
BET > 250 m²/g 60 m²/g 60 m²/g Coating none hydrophobic none Condition solid, powder solid, powder solid, powder
1 Data elaborated for NM-105 and not for the batch distributed by Evonik and used in this study
Table 3: Properties of the applied Ag nanomaterial. Data from the Joint Research Centre, European Commission
Nanoparticles NM-300K NM-300KDIS Condition in dispersion dispersion Primary particle size (according to Scherrer) 15 nm ---
3 Structure of the report
One essential step in ecotoxicity testing is the application of the test substance into the test sys-tems, as bioavailability and consequently toxicity can be influenced by the method of application. As recommendations for the application of nanoparticles were not available preliminary studies were performed. These experiments and conclusions on the performance of the main tests are presented in chapters 5 (terrestrial tests) and 6 (aquatic tests). In the following chapters the re-sults obtained with the tests are presented. For the individual tests the structure of the IUCLID database is applied. The results are sorted with respect to the different test organisms, i.e. for every test organism the results obtained with the applied test substances are presented. This structure allows an easy transfer of the results into databases such as NanoHub, which is the adapted form of the IUCLID data base for nanomaterials. Repetitions, such as the description of the applied test procedure, are limited.
Some peculiarities of nanoparticle testing become obvious only when the total of the results ob-tained for all nanoparticles or test systems were considered. Such an approach is not consid-ered in the IUCLID structure. Where a discussion of specific observations was necessary for a correct interpretation of the results, a subchapter "special considerations" was included in the respective results chapter (e.g. earthworm reproduction data for TiO2 nanoparticles). A separate discussion chapter, which follows the presentation of all main tests, contains all discussions and conclusions of common relevance (e.g. proposal of spiking technique).
An example of the structure of the main tests is provided below.

Introduction 5
Section: Main tests with the selected nanoparticles
Test organism 1 (example: earthworms) • Test principle • Materials and methods
o Test guideline o GLP o Test material
- Nanoparticle 1 - Nanoparticle 2 - x (if more than one material is tested)
o Analytical monitoring o Test item – Preparation protocol o Test species
• Study design o Study type o Test duration type and exposure period o Test substrate o Total exposure period o Post exposure period
• Test conditions o Environmental conditions o Test concentrations
- Nanoparticle 1 - Nanoparticle 2 - x (if more than one material is tested)
• Any other information on materials and methods • Results
o Nanoparticle 1 o Nanoparticle 2 -x (if more than one material is tested) o Special considerations (presentation and discussion of special observations)
• Validity of the results o Nanoparticle 1 o Nanoparticle 2 – x (if more than one material is tested)
• Data for the reference substance • Conclusion
o Nanoparticle 1 o Nanoparticle 2 -x (if more than one material is tested)
• Executive summary o Nanoparticle 1 o Nanoparticle 2 - x (if more than one material is tested)
Test organism 2
…

Methods for chemical analyses 6
4 Methods for chemical analyses
For raw data examples, see chapters 21.1.2 (total Ag), 21.1.3 (Ag+), 21.1.4 (Au)
For certificates of reference material and standards, see chapters 21.1.5 (Ti), 21.1.6 (Ag), 21.1.7 (Au)
4.1 Digestion of Titanium in aqueous samples and soils/sediment
4.1.1 Procedure
Approx. 200 mg of dried soil/sediment was weighed into a quartz digestion vessel and 5 mL of concentrated sulphuric acid was added. The subsequent digestion was performed by an Ultra Clave II Microwave (MLS GmbH, Leutkirch im Allgäu, Germany) using the following conditions:
Soil/sediment samples
Step 1: ramp 60 min to 250 °C
Step 2: 250 °C for 30 min
After cooling, the resulting solution was slowly and carefully brought to a volume of 20 mL with ultrapure water. For safety reasons the volumetric flask was put into an ice bath before adding water.
Prior to digestion, the aqueous sample containing TiO2 was vigorously shaken (e. g. by a vor-texer) for at least 1 min. Directly afterwards 4 mL were taken and 1 mL of a mixture of hydro-chloric-, nitric-, and hydrofluoric acid in a ratio of 3:1:1 were carefully added. Of course, safety precautions for handling of chemicals and the risks of hydrofluoric acid were regarded.
Aqueous samples
The resulting sample was again placed on a vortex for at least 1 min followed by digestion in a standard laboratory ultrasonic bath (room temperature) for 30 minutes. Prior to the analytical measurement by ICP-OES the fluoride anions were complexed by addition of aqueous boronic acid.
4.1.2 Analytical measurement
All materials used for sample treatment were suitable for working with titanium at trace levels. The applied glassware (beakers and volumetric flasks) was cleaned with a Miele washer “Auto-matic Disinfector” combined with a water de-ioniser “Aquapurificator”, steamed with HNO3 and rinsed three times with ultrapure water. The glassware was dried at approximately 60 °C. Addi-tionally, digestions with quartz vessels filled only with concentrated nitric acid were performed in order to have thoroughly cleaned vessels available for the digestion of soil/sediment samples.
The pipettes used in variable volumes (50 – 250 µL, 200 – 1000 µL, 1000 – 5000 µL) were pur-chased from Gilson (Abimed, Langenfeld, Germany) and Eppendorf (Wesseling, Germany).

Methods for chemical analyses 7
The water used for the analytical investigation was purified with a Pure Lab Ultra water purifica-tion system from ELGA LabWater, Celle, Germany. The purified water has a resistivity greater than 18 MΩ∙cm. The applied acids were:
Nitric acid - “Supra” quality (ROTIPURAN® supplied by Roth, Karlsruhe, Germany) Hydrochloric acid – “Instra-Analyzed” (supplied by Mallinckrodt Baker, Griesheim, Germany) Hydrofluoric acid – “Suprapur” quality (supplied by Merck, Darmstadt, Germany) Sulphuric acid – “Supra” quality (ROTIPURAN® supplied by Roth, Karlsruhe, Germany).
For ICP-OES measurements commercially available titanium standards containing 1000 mg/L Ti in ammonium hexafluorotitanate in water (CertiPUR, Merck, Darmstadt, Germany) were applied. With this standard solution appropriate stock solutions and subsequently calibration solutions were prepared.
To further determine the accuracy of the applied analytical method recalibration samples con-taining concentrations in the range of actual samples were also analysed.
(Certified) Reference materials (chapter 21.1.5) and verifying the method
Unfortunately, soil and/or sediment with certified values for Ti were not available. To verify the digestion as well as the analytical method the certified reference material BCR 142R with a not certified reference value for TiO2 (4.5 g/kg) was digested and analysed along with the soil/sediment samples.
To further verify the used methods ultrapure water as well as sediment/soil was spiked with an exactly weighted amount of the nanoparticles. These mixtures also underwent the digestion pro-cedures as well as the analytical measurements, and the recoveries were determined.
The supernatant was analysed by ICP-OES (Iris Intrepid II, Thermo Scientific, Dreieich, Ger-many) with a calibration adjusted to the sulphuric acid matrix. A raw data example is presented in chapter
Soil/sediment samples
21.1.1.
The ICP-OES calibration (Iris Intrepid II, Thermo Scientific, Dreieich, Germany) was adjusted to the HCl, HNO3, and complexed F- matrix. A raw data example is presented in chapter
Aqueous samples
21.1.1.
To quantify the amount of added TiO2-nanoparticles within the soils, sediments and aqueous test systems, additional control systems (same procedure, not spiked with nanoparticles) were analysed for their environmental titanium background. This background can then be straightfor-wardly subtracted from the measured Ti concentrations in test item-loaded samples. However, this approach will only provide reliable results if the added amount of nano-titanium dioxide clearly exceeds 25% of the previously determined natural background.
Quantification of nanoparticles added to the systems during the tests

Methods for chemical analyses 8
4.2 Digestion and quantification of TiO2 in earthworms
4.2.1 Procedure
To ensure a complete digestion of Eisenia fetida, it was necessary to perform cryogenic homog-enisation. To avoid contamination, homogenisation was performed under a laminar-flow hood. All materials used as well as the worms were cooled in liquid nitrogen. The samples were ho-mogenised using a pestle and mortar. First a larger pestle was used for a coarser grinding fol-lowed by a smaller one. The resulting powder was transferred into cryo-proofed vials and stored directly above liquid nitrogen at approx. -150°C until lyophilisation.
Cryogenic homogenisation
The frozen samples were transferred into a Christ Alpha 1-2 freeze dryer (Martin Christ GmbH, Osterode am Harz, Germany) for lyophilisation. Freeze-drying was performed until samples reached constant weights.
Lyophilisation
Approx. 200 mg of homogenised and dried substance from each sample was weighed into a Teflon digestion vessel, and 5 mL of concentrated nitric acid (69%) was added followed by the microwave digestion.
Microwave digestion
The program was: heat for 60 min. to maximum temperature of 250°C, hold at 250°C for 30 min, initial pressure 40 bar.
After digestion 0.5 mL of hydrofluoric acid (40%) was added to the vessels and sonificated for 60 min. Prior to measurement the samples were filled up to an exact volume of 15 mL with 4% boronic acid; additionally, boronic acid was added to complex the fluoride ions.
Unfortunately a commercially available animal matrix reference material with a certified value for titanium dioxide is not available. Therefore, for quality assurance samples were spiked with an exactly weighed amount of TiO2 nanoparticles prior to digestion.
4.2.2 Analytical measurement
Nitric acid (69%) was of “Rotipuran®” quality (supplied by Carl Roth, Karlsruhe).
Reagents for titanium analysis
The water used was purified using an ELGA Pure Lab Ultra water purification system (purified water resistivity >18 MΩ∙cm).
Hydrofluoric acid (40%) was of Suprapur®” quality (supplied by VWR International, Darmstadt)
Boronic acid was of Suprapur®” quality (supplied by VWR International, Darmstadt)
For ICP-OES measurements a commercially available titanium standard containing 1000 mg/L Ti in ammonium hexafluorotitanate in water (CertiPUR, Merck, Darmstadt, Germany) was ap-plied. With this standard solution appropriate stock solutions and subsequently calibration solu-tions were prepared.

Methods for chemical analyses 9
Unfortunately a commercially available animal matrix reference material with a certified value for titanium dioxide is not available. Therefore a few Eisenia fetida control samples were spiked with an exact amount of TiO2 nanoparticles prior to digestion.
Certified reference materials (chapter 21.1.5) and verifying the method
To additionally verify the analytical method a multi element CPI Standard (appropriately diluted to fit in the range of samples, purchased from CPI International, Amsterdam, The Netherlands) was analysed along with the samples to verify the measured results.
Furthermore, recalibration standards were analysed along with the samples.

Methods for chemical analyses 10
All materials used for sample treatment were suitable for analyses of titanium at trace levels. The glassware (beakers and volumetric flasks) was cleaned using a Miele washer “Automatic Disinfector” combined with a water de-ioniser “Aquapurificator”, steamed out with HNO3, rinsed with ultrapure water and dried at approximately 60°C. The pipettes used were adjustable to vari-able volumes (50 - 250 µL, 200 - 1000 µL, 1000 - 5000 µL) and were purchased from Gilson (Abimed, Langenfeld, Germany) and Eppendorf (Wesseling, Germany).
Laboratory equipment
Titanium concentrations of aqueous samples were measured using an IRIS Intrepid II ICP-OES (Thermo Electron, Dreieich, Germany). Titanium was detected at the wavelengths 334.941, 336.121,and 337.280 nm. Matrix adjusted calibrations were performed before each measure-ment. Depending on concentration range in samples the following calibration solutions were used: blank, 50, 100, 250, 500, 1000, and 2500 µg/L.
ICP-OES (raw data example : chapter 21.1.1)
The calibration formula was calculated using the linear regression algorithm of the ICP-OES instrument software and was specific for the corresponding samples. The wavelength with the best correlation and recoveries for standards (337.280 nm) were used for calculating concentra-tions. Correlation coefficients (r) were at least 0.99941. For each sample, at least three internal measurements were performed and the mean was calculated and printed by the instrument software.
The applied LOD/LOQ (Limit of detection / Limit of quantification) calculations are: LOD: 3 * method standard deviation from calibration line; LOQ: 10 * method standard deviation from calibration line.
The information about the LOD/LOQ and correlation coefficient is compiled in Table 6.
A representative calibration line is shown in the raw data chapter 21.1.2
Coefficient of determination (r) for respective calibration functions were taken from ICP-OES instrument outputs.
The resulting values are reported in Table 4.
Table 4: TiO2 in earthworms: LODs/LOQs, correlation.
Measurement date, descrip-tion
LOD [µg/L]
LOQ [µg/L]
Correlation coefficient r
July 28, 2011 measurements of samples from May 19th 18 60 1 0.99990
July 14, 2011 measurements of samples from January25th and February 18th
65 218 1 0.99975
June 09, 2011 measure-ments of control worms for fortification
18 54 1 0.99941
1 Internal LOQ calculation was performed with more digits

Methods for chemical analyses 11
Instrumental and analytical set-up of the ICP-OES: Thermo IRIS Intrepid II Thermo Electron Corporation, Germany Analytical conditions -Nebuliser: Concentric glass nebuliser, Thermo Electron Corporation, Dreieich, Germany -Spray chamber: Glass cyclonic spray chamber, Thermo Electron Corporation, Dreieich, Ger-many -Nebuliser gas flow: 0.68 L/min -Make-up gas flow: 0.5 L/min -RF power: 1150 W -Wavelengths: 334.941 nm, 336.121 nm, 337.280 nm (used for evaluation)
The mean recovery for CPI multi element solution (appropriately diluted) samples containing 500 µg Ti/L was 104 ± 7% (n = 6).
For further quality assurance, recalibration samples were analysed along with the samples and the mean accuracy was determined to 103 ± 3% (n = 6) for a Ti concentration of 500 µg/L.
For collecting validation information of the digestion procedure of samples as well as the analyti-cal method several control worms were pooled and spiked with a weighed amount of TiO2 nanoparticles.
Exactly 2698 µg TiO2 nanoparticles (P25, 1617 µg Ti) were given to exactly 2164.0 mg of ho-mogenised and dried worms resulting in a titanium amount of 747 µg/g. Without spiking, the Eisenia fetida material exhibited a mean titanium concentration of 44.9 ± 2.8 µg/g (n = 2). In conclusion the nominal value is calculated as 792 µg/L.
Spiked samples were digested and analysed along with actual samples, exhibiting a mean value of 659 ± 57 µg/L (n = 6), representing a mean recovery of 83.1 ± 7.2%. The quality requirements for the digestion and analysis of titanium in Eisenia fetida were set to 100 ± 25%, and were therefore fulfilled.
4.3 Digestion and quantification of silver and silver nanoparticles in soil (01A)
4.3.1 Preliminary remarks
The method for extraction/digestion of soil followed by analytical measurement of total Ag was developed by using silver nano powder (< 100 nm, Sigma-Aldrich, Schnelldorf, Germany) in the context of a nitrification test with Eisenia fetida.
An exact amount of the silver test item was introduced into the soil and samples were taken for analysis. The obtained recoveries in the measurement series verified the method.
The digestion and analytical methods are the same as for the determination of silver in sediment samples from the test with chironomids. In the latter, the nanosilver NM300K was applied and CRM026-050 sandy Loam (RT Corporation, Laramie, USA, reference value for Ag is 0.57 mg/kg) was successfully digested and analysed for its silver amount. Therefore, the developed method for the above mentioned silver nano powder can also be applied for NM-330K which was available as dispersion.

Methods for chemical analyses 12
4.3.2 Procedure
The digestion procedure was performed according to DIN ISO 11466 and DIN EN 13346/DEV S7a. Therefore, prior to digestion the soil was dried at 105°C until constant weight for at least 12 h. Thereafter, approximately 3 g of the homogenised material was weighed and 28 g of Aqua regia was added. After 16 h at room temperature without agitation the mixture was heated under reflux for two hours. To avoid over-heating glass chips were added and foaming was avoided by adding a few drops of 1-octanole. The mixture was cooled to room temperature and then care-fully brought to an exact volume of 100 mL. This Aqua regia extract was filtered (0.45 µm, Sy-ringe Filter, Supor membrane, Pall Corporation, New York) and the silver concentration was determined by ICP-OES with a matrix-adjusted calibration.
Soil samples
4.3.3 Analytical measurement
Nitric acid was of “Suprapur®” (supplied by Carl Roth, Karlsruhe) and hydrochloric acid of “in-stra-analysed” quality for trace metal analysis (supplied by Mallinckrodt Baker, Griesheim, Ger-many). The water used was purified using a Pure Lab Ultra water purification system (purified water resistivity >18 MΩ∙cm).
Reagents for silver analysis
A commercially available, multi element ICP-standard containing 1000 mg/L Ag in nitric acid 2-3% (lot no. HC957274, ICP Multi Element Standard Solution IV, CertiPUR®, Merck, Darmstadt, Germany) was used to prepare the appropriate stock solutions and respective calibration solu-tions. All prepared standard solutions had a final HNO3 concentration of 3%.
The analysed certified aqueous reference material was purchased from Environment Canada (TMDA-70, lot 0809, certified with 10.9 µg/L Ag, purchased from Environment Canada).
(Certified) Reference materials and verifying of the method (certificate of reference material: chapter 21.1.6)
An exact amount of the nanosilver test item was introduced into the soil, and samples were taken for analysis. The obtained recoveries in the measurement series verified the method. It also confirmed the achieved homogeneity (except vessel 6- deviation may be due to homogene-ity problems of the silver stock solution) for applying the nano silver in the soil for the Eisenia fetida test.
Additionally, recalibration samples were analysed along with actual samples and the recoveries were determined.
The silver concentrations in reagent blanks were always below the limit of detection.
All materials used for sample treatment were suitable for the analysis of silver at trace levels. The glassware (beakers and volumetric flasks) was cleaned using a Miele washer “Automatic Disinfector” combined with a water de-ioniser “Aquapurificator”, steamed out with HNO3, rinsed
Laboratory equipment
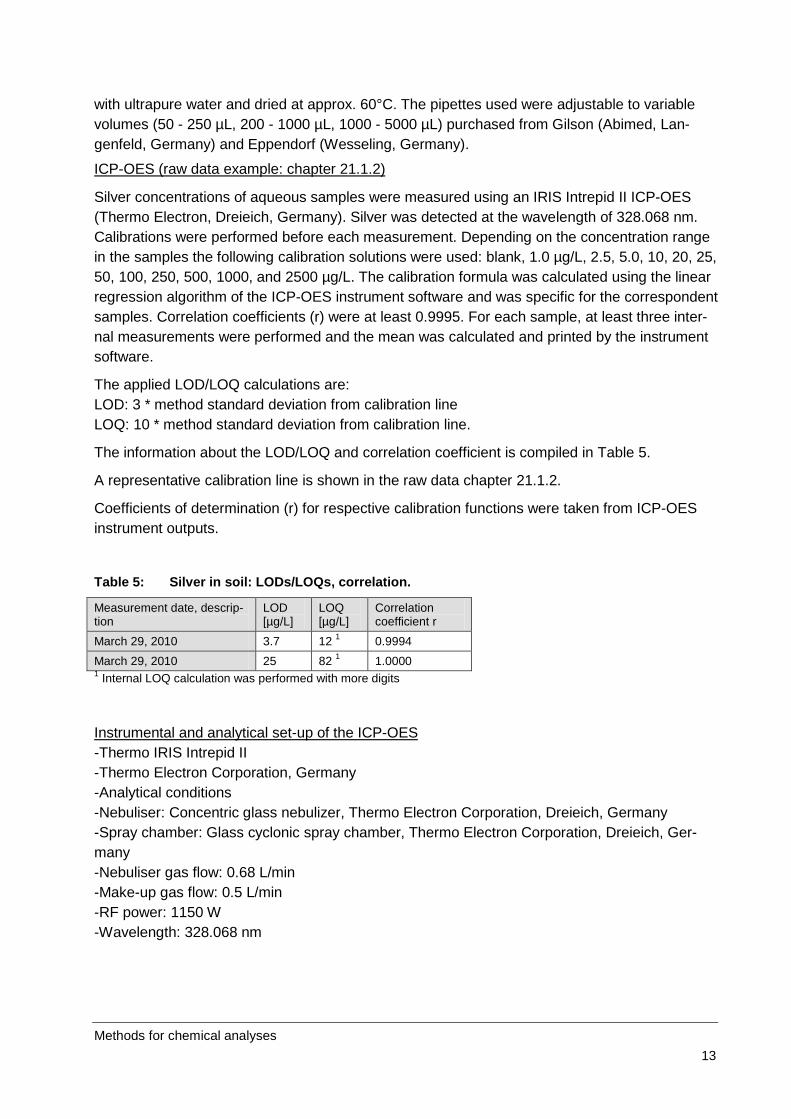
Methods for chemical analyses 13
with ultrapure water and dried at approx. 60°C. The pipettes used were adjustable to variable volumes (50 - 250 µL, 200 - 1000 µL, 1000 - 5000 µL) purchased from Gilson (Abimed, Lan-genfeld, Germany) and Eppendorf (Wesseling, Germany).
Silver concentrations of aqueous samples were measured using an IRIS Intrepid II ICP-OES (Thermo Electron, Dreieich, Germany). Silver was detected at the wavelength of 328.068 nm. Calibrations were performed before each measurement. Depending on the concentration range in the samples the following calibration solutions were used: blank, 1.0 µg/L, 2.5, 5.0, 10, 20, 25, 50, 100, 250, 500, 1000, and 2500 µg/L. The calibration formula was calculated using the linear regression algorithm of the ICP-OES instrument software and was specific for the correspondent samples. Correlation coefficients (r) were at least 0.9995. For each sample, at least three inter-nal measurements were performed and the mean was calculated and printed by the instrument software.
ICP-OES (raw data example: chapter 21.1.2)
The applied LOD/LOQ calculations are: LOD: 3 * method standard deviation from calibration line LOQ: 10 * method standard deviation from calibration line.
The information about the LOD/LOQ and correlation coefficient is compiled in Table 5.
A representative calibration line is shown in the raw data chapter 21.1.2.
Coefficients of determination (r) for respective calibration functions were taken from ICP-OES instrument outputs.
Table 5: Silver in soil: LODs/LOQs, correlation.
Measurement date, descrip-tion
LOD [µg/L]
LOQ [µg/L]
Correlation coefficient r
March 29, 2010 3.7 12 1 0.9994 March 29, 2010 25 82 1 1.0000 1 Internal LOQ calculation was performed with more digits
Instrumental and analytical set-up of the ICP-OES -Thermo IRIS Intrepid II -Thermo Electron Corporation, Germany -Analytical conditions -Nebuliser: Concentric glass nebulizer, Thermo Electron Corporation, Dreieich, Germany -Spray chamber: Glass cyclonic spray chamber, Thermo Electron Corporation, Dreieich, Ger-many -Nebuliser gas flow: 0.68 L/min -Make-up gas flow: 0.5 L/min -RF power: 1150 W -Wavelength: 328.068 nm

Methods for chemical analyses 14
The certified reference material TMDA-70 (certified with 10.9 µg Ag/L) was analysed as a quality assurance sample with solution samples from the test. In accordance with the quality assurance requirement, the silver recovery was in the range of ± 15% of the certified value. However, re-garding Ag concentrations measured by ICP-OES, the mean recovery (accuracy) and precision of the non-digested CRM TMDA-70 measurements were 101 ± 2.9% (n = 4).
Quality assurance measurements
The recovery for Merck IV standard solution samples containing 50 µg/L was 101 ± 2.7%(n = 4) and 94.7 ± 0.7% for 500 µg/L. Analysis reagent blanks were always below the limit of detection of the respective measurement series.
An exact amount of the nano-silver test item was introduced into the soil and samples were taken for analysis. Samples from three test vessels were taken. According to the quality assur-ance requirement, the silver recovery was in the range of ± 25% for the silver in the soil from the respective vessels (10 mg/kg: 76.2 ± 8.8%; 100 mg/kg: 80.8 ± 1.7%; 100 mg/kg: 80.4 ± 3.1%).
4.4 Digestion and quantification of silver and silver nanoparticles in aqueous and sediment samples (OECD 219, test with chironomids)
4.4.1 Procedure
After thoroughly shaking the samples (vortex) 1 mL of the aqueous mixture was transferred into quartz digestion vessels and 2 mL of conc. nitric acid as well as 4 mL of Ultra-Pure water were added. The subsequent digestion was performed using an Ultra Clave II microwave (MLS GmbH, Leutkirch im Allgäu, Germany).
Aqueous samples
The following microwave program was applied:
Step 1: 25 min heating up to 220 °C
Step 2: 30 min at 220 °C
Thereafter, the digested samples were poured into volumetric flasks and filled up with ultrapure water to an exact volume of 15 mL. This final solution was analysed by ICP-OES for its amount of silver.
The digestion procedure was performed according to DIN ISO 11466 and DIN EN 13346/DEV S7a. Therefore, prior to digestion the sediment was dried at 105 °C until constant weight for at least 12 h. Then approximately 3 g of the homogenised material was weighed and 28 g of aqua regia were added. After 16 h without agitation at room temperature this mixture was heated un-der reflux for two hours. To avoid over-boiling glass chips were added and foaming was avoided by adding a few drops of 1-octanole. The mixture was cooled to room temperature and then carefully brought to an exact volume of 100 mL. This aqua regia extract was filtered (0.45 µm, Syringe Filter, Supor membrane, Pall Corporation, New York) and the silver concentration was determined by ICP-OES with a matrix-adjusted calibration.
Sediment samples

Methods for chemical analyses 15
4.4.2 Analytical measurement
Nitric acid was of “Suprapur®” (supplied by Carl Roth, Karlsruhe) and hydrochloric acid of “in-stra-analysed” quality (supplied by Mallinckrodt Baker, Griesheim, Germany). The water used was purified using a Pure Lab Ultra water purification system (purified water resistiv-ity >18 MΩ∙cm).
Reagents for silver analysis
A commercially available silver ICP-standard containing 1000 mg/L Ag in nitric acid 2-3% (lot no. HC936000, CertiPUR®, Merck, Darmstadt, Germany) was used to prepare appropriate stock solutions and respective calibration solutions. All prepared standard solutions had a final HNO3 concentration of 3%.
The analysed certified aqueous reference material was purchased from Environment Canada (TMDA-70, lot 310). Unfortunately, the certified value is 10.9 µg Ag/L. For higher calibration ranges this certified value is above the limit of quantification because the LOD (limit of detection) and LOQ (limit of quantification) are strongly dependent on calibration. Therefore the measured silver concentrations in TMDA-70 could not be quantified reliably. Furthermore, a multi element Merck IV Standard (appropriately diluted to fit in the range of samples, lot HC957274, purchased from Merck, Darmstadt, Germany) was analysed along with the samples to verify the measured results. To verify the microwave procedure, Merck IV solution was also digested along with the aqueous test samples.
Certified reference materials (chapter 21.1.6) and verifying the method
For sediment samples the certified reference material CRM026-050 Sandy Loam (RT Corpora-tion, Laramie, USA, reference value for Ag is 0.57 mg/kg) was digested along with the sediment samples to additionally verify the microwave procedure.
The silver concentrations in digested and non-digested reagent blanks were always below the limit of quantification.
All materials used for sample treatment were suitable for the analysis of silver at trace levels. The glassware (beakers and volumetric flasks) was cleaned using a Miele washer “Automatic Disinfector” combined with a water de-ioniser “Aquapurificator”, steamed out with HNO3, rinsed with ultrapure water and dried at approximately 60°C. The pipettes used were adjustable to vari-able volumes (50 - 250 µL, 200 - 1000 µL, 1000 - 5000 µL) and were purchased from Gilson (Abimed, Langenfeld, Germany) and Eppendorf (Wesseling, Germany).
Laboratory equipment
Silver concentrations of aqueous samples were measured using an IRIS Intrepid II ICP-OES (Thermo Electron, Dreieich, Germany). Silver was detected at the wavelengths 328.068 nm, and 338.289 nm. Calibrations were performed before each measurement. Depending on the concen-tration range in the samples the following calibration solutions were used: blank, 2.5 µg/L, 5.0 10, 25 50, 100, 250, 500, 1000, and 2000 µg/L. The calibration formula was calculated using the linear regression algorithm of the ICP-OES instrument software. Due to spectral interferences at the wavelength of 338.289 nm, especially in the sediment samples the obtained data from 328.068 were used for calculating concentrations. Correlation coefficients (r) were at least
ICP-OES (raw data example: chapter 21.1.2)
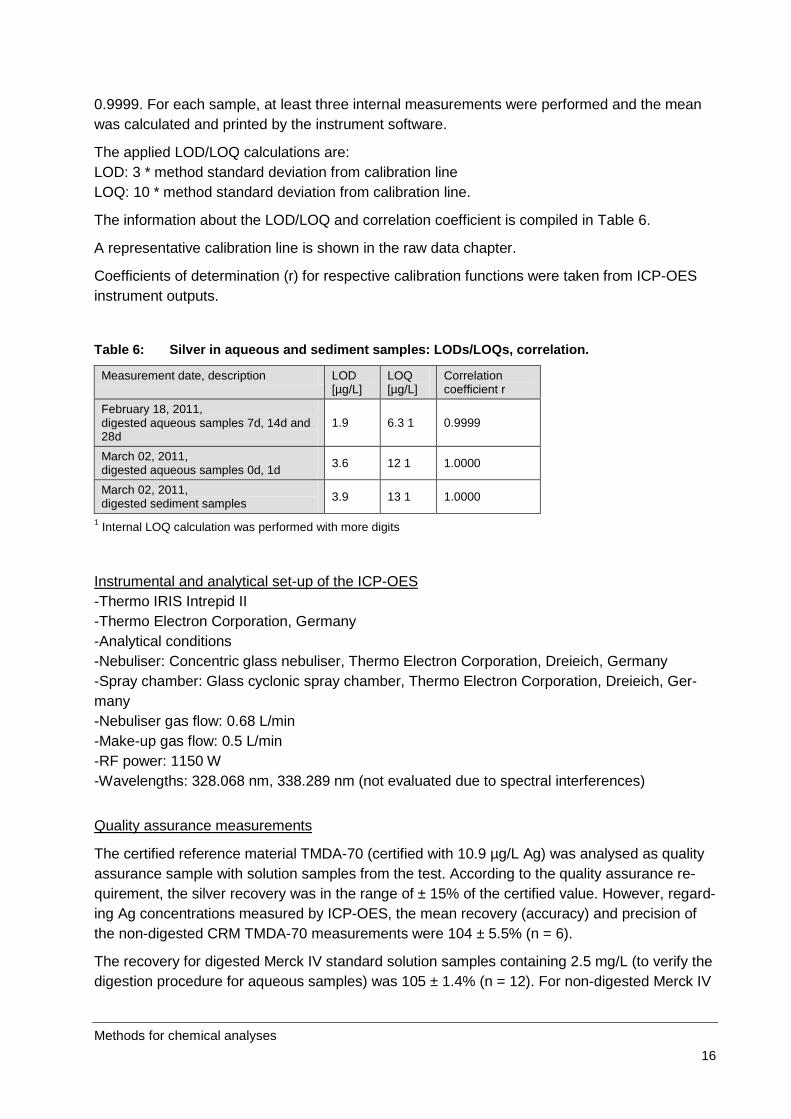
Methods for chemical analyses 16
0.9999. For each sample, at least three internal measurements were performed and the mean was calculated and printed by the instrument software.
The applied LOD/LOQ calculations are: LOD: 3 * method standard deviation from calibration line LOQ: 10 * method standard deviation from calibration line.
The information about the LOD/LOQ and correlation coefficient is compiled in Table 6.
A representative calibration line is shown in the raw data chapter.
Coefficients of determination (r) for respective calibration functions were taken from ICP-OES instrument outputs.
Table 6: Silver in aqueous and sediment samples: LODs/LOQs, correlation.
Measurement date, description LOD [µg/L]
LOQ [µg/L]
Correlation coefficient r
February 18, 2011, digested aqueous samples 7d, 14d and 28d
1.9 6.3 1 0.9999
March 02, 2011, digested aqueous samples 0d, 1d 3.6 12 1 1.0000
March 02, 2011, digested sediment samples 3.9 13 1 1.0000
1 Internal LOQ calculation was performed with more digits
Instrumental and analytical set-up of the ICP-OES -Thermo IRIS Intrepid II -Thermo Electron Corporation, Germany -Analytical conditions -Nebuliser: Concentric glass nebuliser, Thermo Electron Corporation, Dreieich, Germany -Spray chamber: Glass cyclonic spray chamber, Thermo Electron Corporation, Dreieich, Ger-many -Nebuliser gas flow: 0.68 L/min -Make-up gas flow: 0.5 L/min -RF power: 1150 W -Wavelengths: 328.068 nm, 338.289 nm (not evaluated due to spectral interferences)
The certified reference material TMDA-70 (certified with 10.9 µg/L Ag) was analysed as quality assurance sample with solution samples from the test. According to the quality assurance re-quirement, the silver recovery was in the range of ± 15% of the certified value. However, regard-ing Ag concentrations measured by ICP-OES, the mean recovery (accuracy) and precision of the non-digested CRM TMDA-70 measurements were 104 ± 5.5% (n = 6).
Quality assurance measurements
The recovery for digested Merck IV standard solution samples containing 2.5 mg/L (to verify the digestion procedure for aqueous samples) was 105 ± 1.4% (n = 12). For non-digested Merck IV

Methods for chemical analyses 17
samples the accuracy was determined to 106 ± 0.4% (n =2) for 500 µg/L and 101 ± 0.8% (n = 2) for 250 µg/L.
Analysis of acidified ultrapure water as reagent blanks as well as digestion and analysis of SiO2 as blanks for sediment samples revealed silver concentrations which were always at least below the limit of quantification of the respective measurement series.
For further quality assurance, recalibration samples were analysed along with the samples and the mean accuracy was determined to 98.4 ± 1.2% (n = 3) for an Ag concentration of 100 µg/L and 99.2 ± 0.6% (n = 2) for 200 µg/L.
For collecting validation information on the digestion procedure of sediment samples as well as the analytical method, the mean recovery of silver in the certified reference material “026-050 Sandy loam” was determined to 114 ± 3.4% (n =3). Regarding the quality requirements the re-coveries of metals in soils and sediments must be in the range of 100 ± 25%.
The validation information is summarised in Table 7.

Methods for chemical analyses 18
Table 7: Silver in aqueous and sediment samples: method validation information.
Validation pa-rameter
Results Comment
Selectivity two different wavelengths for ICP-OES method interferences only observed at 338.289 nm Linearity applied calibration functions were linear see Table 6 correlation coefficient (r) at
least 0.9999 Limits of detec-tion (LOD)
1.9 – 3.9 µg/L see Table 6
Limits of quanti-fication (LOQ)
6.3 – 13 µg/L see Table 6
Reagent and sediment blanks
below < LOD = < 1.9 - < 3.9 µg/L; one UHQ sample from measurement series of March 02, 2011 < LOQ = < 11.9 µg/L
-
Accuracy and precision
mean recovery for TMDA-70: 104 ± 5.5% (n = 6)
for low concentration range of samples (10.9 µg/L)
Accuracy and precision
mean recovery for non digested Merck IV (500 µg/L): 106 ± 0.4% (n = 2)
corresponds to concentration range of samples (500 µg/L)
Accuracy and precision
mean recovery for non digested Merck IV (250 µg/L): 101 ± 0.8% (n = 2)
corresponds to concentration range of samples (250 µg/L)
Accuracy and precision
mean recovery for recalibration (100 µg/L): 97.2± 1.1% (n = 2)
corresponds to concentration range of samples (100 µg/L)
Accuracy and precision
mean recovery for recalibration (200 µg/L): 98.2 ± 1.0% (n = 2)
corresponds to concentration range of samples (200 µg/L)
accuracy and precision
mean recovery for digested Merck IV (2.5 mg/L): 105 ± 1.4% (n = 12)
corresponds to concentrations of applied loadings
Accuracy and precision
mean recovery for recalibration samples of 100 µg/L: 98.4 ± 1.2 (n = 3)
corresponds to concentration range of samples (100 µg/L)
Accuracy and precision
mean recovery for recalibration samples of 200 µg/L: 99.2 ± 0.6 (n = 2)
corresponds to concentration range of samples (200 µg/L)
Accuracy and precision
mean recovery for silver in digested CRM026-050: 114 ± 3.4 (n = 3)
Certified with 0.570 mg/kg
Reproducibility mean recovery for TMDA-70: 104 ± 5.5% (n = 6)
for low concentration range of samples (10.9 µg/L)
Reproducibility mean recovery for non digested Merck IV (500 µg/L): 106 ± 0.4% (n = 2)
corresponds to concentration range of samples (500 µg/L)
Reproducibility mean recovery for non digested Merck IV (250 µg/L): 101 ± 0.8% (n = 2)
corresponds to concentration range of samples (250 µg/L)
Reproducibility mean recovery for recalibration (100 µg/L): 97.2± 1.1% (n = 2)
corresponds to concentration range of samples (100 µg/L)
Reproducibility mean recovery for recalibration (200 µg/L): 98.2 ± 1.0% (n = 2)
corresponds to concentration range of samples (200 µg/L)
Reproducibility mean recovery for digested Merck IV (2.5 mg/L): 105 ± 1.4% (n = 12)
corresponds to concentrations of applied loadings
Reproducibility mean recovery for recalibration samples of 100 µg/L: 98.4 ± 1.2 (n = 3)
corresponds to concentration range of samples (100 µg/L)
Reproducibility mean recovery for recalibration samples of 200 µg/L: 99.2 ± 0.6 (n = 2)
corresponds to concentration range of samples (200 µg/L)
Reproducibility mean recovery for silver in digested CRM026-050: 114 ± 3.4 (n = 3)
certified with 0.570 mg/kg

Methods for chemical analyses 19
One millilitre of the samples were digested and to filled to 15 mL with ultrapure water (dilution factor 15). Prior to measurements the stock solution samples were additionally diluted 1:10 be-cause of their higher concentration (dilution factor for stock solution samples is 150). When the measured value by ICP-OES without dilution factor was below the limit of detection (LOD) or quantification (LOQ) this is denoted in the tables. To obtain the measured silver concentrations of the instrument the values have to be divided by 15, and the data for the stock solutions by 150.
Presentation of the results
The amount of silver in dispersion was determined by UV-VIS measurements without preceding digestion. As a certified standard solution containing nano-Ag is not yet available, the calibration used for this method is performed with a silver standard. The quantification of total silver carried out after total digestion differs from the amount reported by the producer as the measurement performed by the producer was performed without matrix-adjusted calibration.
4.5 Quantification of silver in the extracts of DGTs, diffusive gradients in thin films
4.5.1 DGTs in general
DGT means diffusive gradients in thin films. DGT devices can collect the dissolved ions. The concentrations can then be determined by instrumental analysis.
“The simple device uses a layer of Chelex resin impregnated in a hydrogel to accumulate the metals. The resin-layer is overlain by a diffusive layer of hydrogel and a filter. Ions have to dif-fuse through the filter and diffusive layer to reach the resin layer. It is the establishment of a constant concentration gradient in the diffusive layer that forms the basis for measuring metal concentrations in solution quantitatively without the need for separate calibration” [Technical documentation], http://www.dgtresearch.com].
For detailed information please see the above mentioned technical documentation and refer-ences cited within.
4.5.2 Procedure
For preparation, the DGT devices were placed into a 0.01 mol/L NaCl solution. Argon was intro-duced into the solution for one hour. Afterwards the vessel containing the DGTs and the NaCl solution was tightly closed and remained for 24 h under inert gas. Thereafter the DGT devices were carefully introduced into the test setup with chironomids by pushing them on the sediment.
Preparation and application of DGTs
The devices remained in the test vessels for 48 h. After their removal they were thoroughly rinsed with ultrapure water and wrapped into polyethylene bags for storage at 4 °C for no longer than 4 days. The DGTs were broken up and the resin layer was extracted and directly trans-ferred into 1.5 mL 1 mol/L nitric acid for elution of silver ions for at least 24 h. An exact volume of 1 mol/L nitric acid was added and the solution was sampled and analysed for its amount of silver by ICP-MS.

Methods for chemical analyses 20
4.5.3 Analytical measurement
Nitric acid was of “Suprapur®” (supplied by Carl Roth, Karlsruhe) and hydrochloric acid of “in-stra-analysed” quality (supplied by Mallinckrodt Baker, Griesheim, Germany). The water used was purified using a Pure Lab Ultra water purification system (purified water resistiv-ity >18 MΩ∙cm).
Reagents for silver analysis
A commercially available multi element ICP-standard containing 1000 mg/L Ag in nitric acid 2-3% (lot no. HC957274, ICP Multi Element Standard Solution IV, CertiPUR®, Merck, Darmstadt, Germany; chapter 21.1.6) was used to prepare appropriate stock solutions and respective cali-bration solutions. All prepared standard solutions had a final HNO3 concentration of 3%.
The analysed certified aqueous reference materials – appropriately diluted to fit in the concen-tration range of samples - were purchased from Environment Canada (TMDA-70, lot 310, certi-fied with 10.9 µg/L Ag and TMDWS2, certified with 9.97 µg/L; chapter
Certified reference materials (chapter 21.1.6) and verifying the method
21.1.6).
All materials used for sample treatment were suitable for the analysis of silver at trace levels. The glassware (beakers and volumetric flasks) was cleaned using a Miele washer “Automatic Disinfector” combined with a water de-ioniser “Aquapurificator”, steamed out with HNO3, rinsed with ultrapure water and dried at approx. 60 °C. The pipettes used were adjustable to variable volumes (50 - 250 µL, 200 - 1000 µL, 1000 - 5000 µL) and were purchased from Gilson (Abi-med, Langenfeld, Germany) and Eppendorf (Wesseling, Germany).
Laboratory equipment
Silver concentrations of aqueous samples were measured using an Agilent 7500ce ICP-MS in-strument (Agilent Technologies, Waldbronn, Germany). Silver was detected at the isotope 109 in the no-gas mode of the machine. Calibrations were performed prior to the measurement se-ries. Depending on the concentration range in samples the following calibration solutions were used: 0.25, 0.50, 1.0, 2.5, 5.0, 10, and 25 µg/L. The calibration formula was calculated using the linear regression algorithm of the ICP-MS instrument software. Correlation coefficient (r) is 0.9999. For each sample, at least three internal measurements were performed and the mean was calculated and printed by the instrument software.
ICP-MS (raw data example: chapter 21.1.3)
The applied LOD/LOQ calculations are: LOD: 3 * method standard deviation from calibration line LOQ: 10 * method standard deviation from calibration line.
The information about the LOD/LOQ and correlation coefficient is compiled in Table 8.
A representative calibration line is shown in the raw data chapter 21.1.2.
Coefficient of determination (r) for respective calibration function was taken from ICP-MS in-strument outputs.

Methods for chemical analyses 21
Table 8: Determination of silver ions: LODs/LOQs, correlation.
Measurement date, descrip-tion
LOD [µg/L]
LOQ [µg/L]
Correlation coefficient r
March 4, 2011 0.0013 0.0039 0.9999
Instrumental and analytical set-up of the ICP-MS -Agilent 7500i (Agilent Technologies, Germany) -Analytical conditions -Nebuliser: Micro Mist, Agilent Technologies, Germany -Spray chamber: Scott Type, Agilent Technologies, Germany -Nebuliser gas flow: 0.95 L/min -Make-up gas flow: 0.12L/min -RF power: 1500 W -No-gas mode I-sotope: 109Ag
The certified reference materials TMDA-70 (certified with 10.9 µg/L Ag) and TMDWS2 were ana-lysed as quality assurance sample with solution samples from the test. According to the quality assurance requirement, the silver recovery was in the range of ± 15% of the certified value. However, regarding Ag concentrations measured by ICP-MS, the mean recovery (accuracy) and precision of CRM TMDA-70 (dilution factor 10) measurements were 95.8 ± 4.0% (n = 5) and 97.5 ± 5.5% (n = 6) for CRM TMDWS2 (dilution factor 5).
Quality assurance measurements (certificate of reference material chapter 21.1.6)
The silver concentration in reagent blanks analysed along with the actual samples were mostly at least below the limit of quantification (LOQ = 0.039 µg/L, n = 10). Because of the low LOQ the measured values of three additional reagent blanks exhibited higher concentrations (0.004 µg/L, 0.020 µg/L and 0.005 µg/L). However, the latter concentrations were far below the measured amounts in actual samples and therefore did not influence the analytical measurement series.
The validation information is summarised in Table 9.
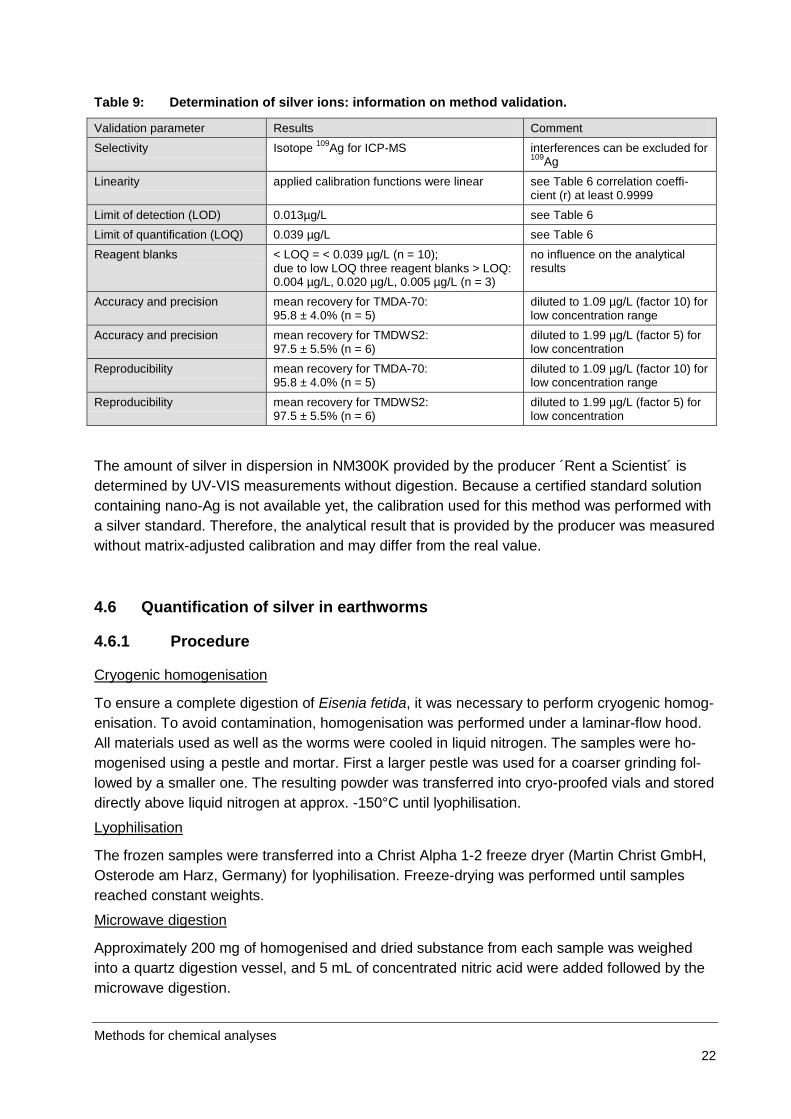
Methods for chemical analyses 22
Table 9: Determination of silver ions: information on method validation.
Validation parameter Results Comment Selectivity Isotope 109Ag for ICP-MS interferences can be excluded for
109Ag Linearity applied calibration functions were linear see Table 6 correlation coeffi-
cient (r) at least 0.9999 Limit of detection (LOD) 0.013µg/L see Table 6 Limit of quantification (LOQ) 0.039 µg/L see Table 6 Reagent blanks < LOQ = < 0.039 µg/L (n = 10);
due to low LOQ three reagent blanks > LOQ: 0.004 µg/L, 0.020 µg/L, 0.005 µg/L (n = 3)
no influence on the analytical results
Accuracy and precision mean recovery for TMDA-70: 95.8 ± 4.0% (n = 5)
diluted to 1.09 µg/L (factor 10) for low concentration range
Accuracy and precision mean recovery for TMDWS2: 97.5 ± 5.5% (n = 6)
diluted to 1.99 µg/L (factor 5) for low concentration
Reproducibility mean recovery for TMDA-70: 95.8 ± 4.0% (n = 5)
diluted to 1.09 µg/L (factor 10) for low concentration range
Reproducibility mean recovery for TMDWS2: 97.5 ± 5.5% (n = 6)
diluted to 1.99 µg/L (factor 5) for low concentration
The amount of silver in dispersion in NM300K provided by the producer ´Rent a Scientist´ is determined by UV-VIS measurements without digestion. Because a certified standard solution containing nano-Ag is not available yet, the calibration used for this method was performed with a silver standard. Therefore, the analytical result that is provided by the producer was measured without matrix-adjusted calibration and may differ from the real value.
4.6 Quantification of silver in earthworms
4.6.1 Procedure
To ensure a complete digestion of Eisenia fetida, it was necessary to perform cryogenic homog-enisation. To avoid contamination, homogenisation was performed under a laminar-flow hood. All materials used as well as the worms were cooled in liquid nitrogen. The samples were ho-mogenised using a pestle and mortar. First a larger pestle was used for a coarser grinding fol-lowed by a smaller one. The resulting powder was transferred into cryo-proofed vials and stored directly above liquid nitrogen at approx. -150°C until lyophilisation.
Cryogenic homogenisation
The frozen samples were transferred into a Christ Alpha 1-2 freeze dryer (Martin Christ GmbH, Osterode am Harz, Germany) for lyophilisation. Freeze-drying was performed until samples reached constant weights.
Lyophilisation
Approximately 200 mg of homogenised and dried substance from each sample was weighed into a quartz digestion vessel, and 5 mL of concentrated nitric acid were added followed by the microwave digestion.
Microwave digestion

Methods for chemical analyses 23
Program: heat for 25 min to maximum temperature of 220°C; hold at 220°C for 30 min; allow to cool for approx. 60 min; initial pressure 40 bar.
After digestion the vessels were filled up to an exact volume of 20 mL with ultrapure water.
A reference material (NIST 2977 Mussel Tissue) was digested along with the samples.
The digestion procedure is in accordance to the document ‘Guidelines for Chemical Analysis, Digestion of Environmental Samples’ from http://www.umweltprobenbank.de.
4.6.2 Analytical measurement
Nitric acid was of “Suprapur®” (supplied by Carl Roth, Karlsruhe). The water used was purified using an ELGA Pure Lab Ultra water purification system (purified water resistivity >18 MΩ∙cm).
Reagents for silver analysis
A commercially available silver ICP-standard containing 1000 mg/L Ag in nitric acid 2-3% was used to prepare appropriate stock solutions and respective calibration solutions. All prepared standard solutions had a final HNO3 concentration of 3%.
The reference material NIST 2977 Mussel Tissue was digested and analysed along with the samples to verify the procedures (purchased from LGC Standards, Wesel, Germany). Unfortu-nately, only a non-certified reference value of 4.58 mg Ag / kg is provided for this material.
Certified reference materials (chapter 21.1.6) and verifying the method
Furthermore, aqueous certified reference material TMDA-70 (purchased from Environment Canada, certified Ag conc. of 10.9 µg/L) was analysed along with the samples.
To additionally verify the analytical method a multi element Merck IV Standard (appropriately diluted to fit in the range of samples, lot HC957274, purchased from Merck, Darmstadt, Ger-many) was analysed along with the samples to verify the measured results.
The silver concentration in reagent blanks (n = 10) were below the limit of detection (< 2.6 µg/L), except one which was below the limit of quantification (< 8.8 µg/L)
All materials used for sample treatment were suitable for analyses of silver at trace levels. The glassware (beakers and volumetric flasks) was cleaned using a Miele washer “Automatic Disin-fector” combined with a water de-ioniser “Aquapurificator”, steamed out with HNO3, rinsed with ultrapure water and dried at approx. 60°C. The pipettes used were adjustable to variable vol-umes (50 - 250 µL, 200 - 1000 µL, 1000 - 5000 µL) and were purchased from Gilson (Abimed, Langenfeld, Germany) and Eppendorf (Wesseling, Germany).
Laboratory equipment
ICP-OES ( 21.1.2raw data example: chapter )
Silver concentrations of aqueous samples were measured using an IRIS Intrepid II ICP-OES (Thermo Electron, Dreieich, Germany). Silver was detected at the wavelengths 328.068 nm, and 338.289 nm. Calibrations were performed before each measurement. Depending on concentra-tion range in samples the following calibration solutions were used: blank, 1.0, 2.5, 5.0, 10, 25, 50, 100, and 250 µg/L.

Methods for chemical analyses 24
The calibration formula was calculated using the linear regression algorithm of the ICP-OES instrument software. Due to spectral interferences at the wavelength of 338.289 nm, the ob-tained data from 328.068 were used for calculating concentrations. Correlation coefficient (r) was 0.99995. For each sample, at least three internal measurements were performed and the mean was calculated and printed by the instrument software.
The applied LOD/LOQ (Limit of detection / Limit of Quantification) calculations are: LOD: 3 * method standard deviation from calibration line; LOQ: 10 * method standard deviation from calibration line.
The information about the LOD/LOQ and correlation coefficient is compiled in Table 6.
The calibration line is shown in the raw data chapter 21.1.
Coefficient of determination (r) for respective calibration functions were taken from ICP-OES instrument outputs.
The resulting values are reported in Table 10.
Table 10: Silver in earthworms: LODs/LOQs, correlation.
Measurement date, descrip-tion
LOD [µg/L]
LOQ [µg/L]
Correlation coefficient r
August 26, 2011 2.6 8.8* 0.99995
* Internal LOQ calculation was performed with more digits
Instrumental and analytical set-up of the ICP-OES: -Thermo IRIS Intrepid II -Thermo Electron Corporation, Germany -Analytical conditions -Nebuliser: Concentric glass nebulizer, Thermo Electron Corporation, Dreieich, Germany -Spray chamber: Glass cyclonic spray chamber, Thermo Electron Corporation, Dreieich, Ger-many -Nebuliser gas flow: 0.68 L/min -Make-up gas flow: 0.5 L/min -RF power: 1150 W -Wavelengths: 328.068 nm, 338.289 nm (not evaluated due to spectral interferences)
The certified reference material TMDA-70 (certified as 10.9 µg Ag/L) was analysed as quality assurance sample with solution samples from the test. According to the quality assurance re-quirement, the silver recovery was in the range of ± 15% of the certified value. However, regard-ing Ag concentrations measured by ICP-OES, the mean recovery (accuracy) and precision of the non digested CRM TMDA-70 measurements were 109 ± 10% (n = 4).
Quality assurance measurements
The recovery for Merck IV solution samples containing 50 µg Ag / L was 104 ± 5% (n = 2).
For further quality assurance, recalibration samples were analysed along with the samples and the mean accuracy was determined to 101 ± 2% (n = 2) for an Ag concentration of 50 µg/L.

Methods for chemical analyses 25
For collecting validation information of the digestion procedure of samples as well as the analyti-cal method, the mean recovery of silver in the reference material NIST 2977 Mussel Tissue was determined as 73.5 ± 6.4% (n =3), although only a non-certified reference value was given in the certificate.
4.7 Dissolution and quantification of nano-Au in aqueous and sediment sam-ples
4.7.1 Procedure
In order to dissolve gold nanoparticles within aqueous samples Aqua regia was applied. There-fore 1 mL of Aqua regia was added to 1 mL of the aqueous test sample. The mixture was care-fully vortexed or shaken (for 5 min) and remained for at least for additional 24 h without agitation at room temperature prior to analytical determination.
Dissolution of gold nanoparticles in aqueous samples
The digestion procedure was performed according to DIN ISO 11466 and DIN EN 13346/DEV S7a. Therefore, prior to digestion the sediment was dried at 105°C until constant weight for at least 12 h. Thereafter, approx. 3 g of the homogenised material were weighed and 28 g of Aqua regia were added. After 16 h at room temperature - without agitation - this mixture was heated under reflux for two hours. To avoid foaming and overboiling a few drops of 1-octanole and glass chips were added. The mixture was cooled to room temperature and then carefully brought to an exact volume of 100 mL. This Aqua regia extract was filtered (0.45 µm, Syringe Filter, Supor membrane, VWR, Darmstadt) and the gold concentration was determined by ICP-OES with a matrix-adjusted calibration.
Dissolution of gold nanoparticles in sediment samples
4.7.2 Analytical measurement
All materials used for sample treatment were suitable for working with gold at trace levels. The applied glassware (beakers and volumetric flasks) was cleaned with a Miele washer “Automatic Disinfector” combined with a water de-ioniser “Aquapurificator”, afterwards washed three times with aqua regia (mixture of conc. hydchloric and conc. nitric acid in a ratio of 3 : 1) and rinsed three times with ultrapure water. The glassware was dried at approx. 60 °C.
Laboratory equipment and chemicals
The pipettes used in variable volumes (50 – 250 µL, 200 – 1000 µL, 1000 – 5000 µL) were pur-chased from Gilson (Abimed, Langenfeld, Germany) and Eppendorf (Wesseling, Germany).
The water used for the analytical investigation was purified with a Pure Lab Ultra water purifica-tion system from ELGA LabWater, Celle, Germany. The purified water has a resistivity greater than 18 MΩ∙cm.
The applied acids were: -Nitric acid - “Supra” quality (ROTIPURAN® supplied by Roth, Karlsruhe, Germany)

Methods for chemical analyses 26
-Hydrochloric acid – “Instra-Analyzed®” (supplied by Mallinckrodt Baker, Griesheim, Germany) -Aqua regia is not commercially available and was freshly prepared prior to usage. Therefore, concentrated hydrochloric and concentrated nitric acid were mixed in a ratio of 3:1.
For ICP-OES measurements a commercially available gold standard containing 1000 mg/L Au in tetrachloroaurat acid in 7% hydrochloric acid (CertiPUR®, Merck, Darmstadt, Germany) was applied. With this standard solution appropriate stock solutions and subsequently calibration solutions were prepared.
To determine the accuracy of the applied analytical method the NIST reference material 8011 (gold nanoparticles, nominal diameter 10 nm) was analysed along with aqueous samples of the test and the recovery was determined. For this material only an informative value of 51.56 ± 0.23 µg nano-gold /g was given. However, to verify the dissolution of nano-gold and the subse-quent analytical investigation this reference material turned out to be very feasible. The amount of nano-gold corresponded to 51.56 mg/L and was therefore appropriately diluted with ultrapure water to fit in the concentration range of test samples.
(Certified) Reference materials (chapter 21.1.7)
In order to further verify the analytical method, recalibration samples were analysed along with test item samples and recoveries were determined.
Gold concentrations of aqueous samples were measured using an IRIS Intrepid II ICP-OES (Thermo Electron, Dreieich, Germany). Gold was detected at wavelengths of 197.819, 208.209, and 242.795 nm. Calibrations were performed before each measurement. Depending on the concentration range in samples the following calibration solutions (matrix adjusted) were used: blank, 1.0, 2.5, 5.0, 10, 20L, 25, 50L, 100, and 250 µg/L. The calibration formula was calculated using the linear regression algorithm of the ICP-OES instrument software. The wavelength hav-ing the best correlation and recoveries for reference materials and recalibration samples were used for evaluation (197.819 nm). Correlation coefficients (r) were at least 0.9992. For each sample, at least three internal measurements were performed and the mean was calculated and printed by the instrument software.
ICP-OES (raw data example: chapter 21.1.4)
The applied LOD/LOQ calculations are: LOD: 3 * method standard deviation from calibration line LOQ: 10 * method standard deviation from calibration line.
The information about the LOD/LOQ and correlation coefficient is compiled in Table 5.
A representative calibration line is shown in the raw data chapter 21.1.
Coefficients of determination (r) for respective calibration functions were taken from ICP-OES instrument outputs.
The resulting values are reported in Table 11.

Methods for chemical analyses 27
Table 11: Au in daphnids and chironomids: LODs/LOQs.
Measurement date, description LOD [µg/L]
LOQ [µg/L] 1
Correlation coefficient r
Januar 19, 2012 sediment samples from chironomids test
2.7 9.0 0.999997
January 04, 2012 aqueous samples from chironomids test after 28 days
2.6 8.7 0.999168
December 19, 2012 aqueous samples from Daphnia test after 0 and 48 h and aqueous samples from chironomids test after 7 days
1.4 4.3 0.999922
November 30, 2011 aqueous samples from chironomids test after 0 and 1 days
1.6 5.4 0.999983
1 internal LOQ calculation was performed with more digits
Instrumental and analytical set-up of the ICP-OES: -Thermo IRIS Intrepid II -Thermo Electron Corporation, Germany -Analytical conditions -Nebuliser: Concentric glass nebuliser, Thermo Electron Corporation, Dreieich, Germany -Spray chamber: Glass cyclonic spray chamber, Thermo Electron Corporation, Dreieich, Ger-many -Nebuliser gas flow: 0.68 L/min -Make-up gas flow: 0.5 L/min -RF power: 1150 W -Wavelengths: 197.819 nm (used for evaluation), 208.209 nm and 242.795 nm.
The NIST reference material 8011 (gold nanoparticles, nominal diameter 10 nm, informative value of 51.56 mg/L, appropriately diluted to fit in concentration range of samples) was digested and analysed as quality assurance sample with samples from the test. According to the quality assurance requirement, the gold recoveries (accuracy and precision) were in the range of ± 15% of the certified value. However, regarding Au concentrations measured by ICP-OES, the mean recoveries (accuracy and precision) of NIST 8011 measurements were 97.4 ± 12.9% (n = 2, dilution factor 3750), 98.1 ± 2.6% (n = 2, dilution factor 750) and 97.8 ± 1.4 (n = 12).
Quality assurance measurements
To further verify the analytical determination the recoveries of recalibration standards were de-termined to 99.0 ± < 0.1% (n = 2) for 250 µg/L, 97.0 ± 2.6% (n = 6) for 50 µg/L and 107% (n = 1) for 12.5 µg/L.
Preliminary experiments 28
5 Pre-tests - spiking of soil
So far, documents referring specifically to the application of nanoparticles for ecotoxicological tests are not available. Normally, the test substance is applied using a carrier. For test sub-stances soluble in water; aqueous stock solutions are prepared for aquatic and terrestrial tests. For test substances insoluble in water several options exist. The guidelines ISO 14442 (2006) and OECD no. 23 (2000) provide guidance for aquatic tests including methods such as stirring (from several hours up to 6 weeks), ultrasonication, high-shear mixing, addition of solvents or emulsifying agents or the removal of non-dissolved test substances by filtration or centrifugation. The test guidelines dealing with side-effects on the soil microflora propose a mixture of silica sand and test substance. Organic solvents should be avoided as they can damage the soil microflora. In tests with organisms other than the soil microflora (e.g. plants or earthworms) the use of organic solvents is allowed.
As recommendations for the application of nanoparticles were not available preliminary stud-ies had to be carried out with emphasis on terrestrial tests. The application form and the ho-mogeneity of spiking were investigated. The tests were performed with earthworms and the soil microflora.
To obtain information on the influence of the application form
• Application by dispersion
several forms of spiking were investigated:
• Application by dry powder
• Application in soil
• Application in food
Application in soil is an option for all terrestrial tests, whereas the application in food may be a suitable procedure for tests where the test organisms are fed, such as the earthworm re-production test. For a homogenous distribution a solid carrier material such as dry soil or silica sand is recommended.
Homogeneity was documented by chemical analyses. Further information on homogeneity was obtained by microbial analyses. For nitrate analyses only a small amount (20 g) of test soil is required. The nitrate content was determined in several replicates sampled at different spots of the test soil. In addition to the chemical analyses the standard deviation of the val-ues can be used as a further indicator for homogeneity.

Preliminary experiments 29
The structure of the pre-tests is presented in the following graph (Figure 1).
Figure 1: Structure of the pre-tests. Carried out to elucidate the influence of the application form and the homogeneity of spiking
Spiking experiments were performed with P25 and silver. For silver no OECD-material was available at the time the pre-tests were started. Therefore, a commercially available silver nano-powder was used.
All tests were performed in a sandy field soil (described in 5.1.2).
5.1 Materials and methods
5.1.1 Nanomaterial
• P25 - distributed by Evonik for the OECD Sponsorship Programme. The properties should correspond to the properties of NM-105.
• Silver: Sigma-Aldrich, silver nano-powder, < 100 nm, 99.5% metals basis, order num-ber 576832.
The test substances were stored in the dark at room temperature.
Spiked soil samples - different application forms: • Application as
o suspension o powder
• Application in soil using differ-ent carrier materials
• Application in food
Chemical analysis Earthworms: • reproduction test
(application as solid and suspen-sion in food and soil)
Soil microflora: • Nitrification
(application as solid and suspension; application as solid with soil and silica sand as carrier)
Information on homogeneity of
spiking
Information on homoge-neity of spiking (small samples for analysis - standard deviation of
replicates as indicator for homogeneity)
Influence of applica-tion method on bioavailability
Influence of appli-cation method on
bioavailability
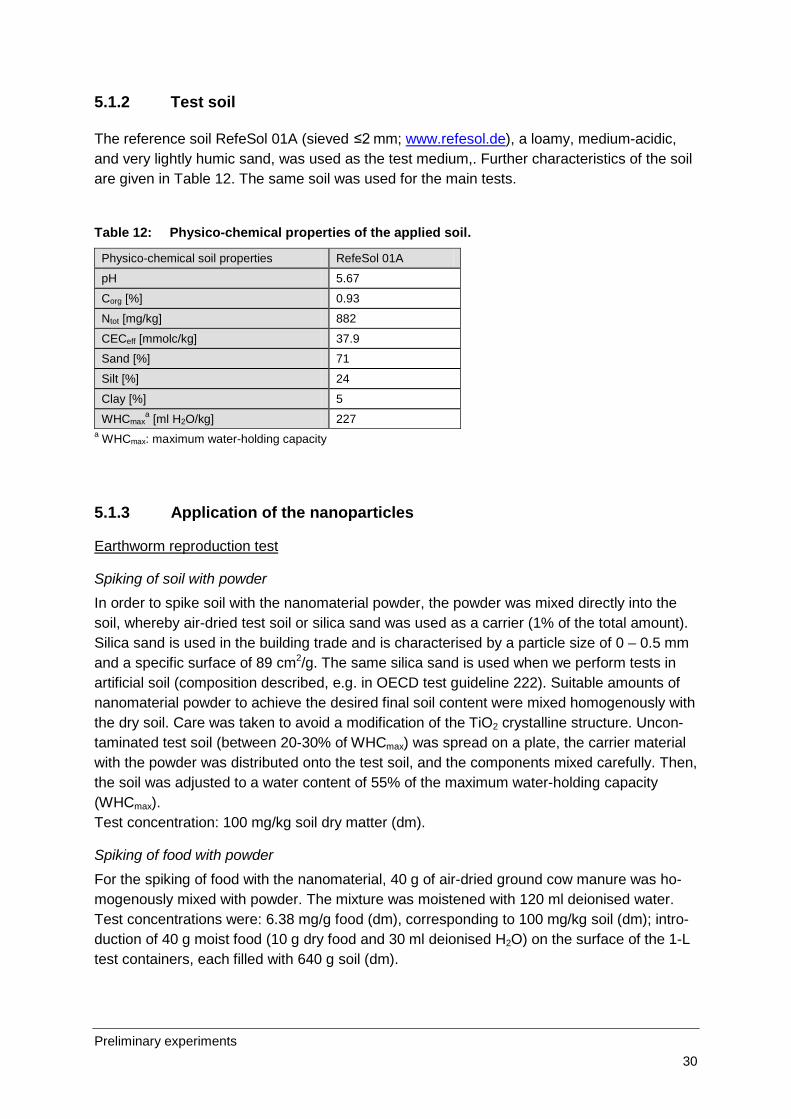
Preliminary experiments 30
5.1.2 Test soil
The reference soil RefeSol 01A (sieved ≤2 mm; www.refesol.de), a loamy, medium-acidic, and very lightly humic sand, was used as the test medium,. Further characteristics of the soil are given in Table 12. The same soil was used for the main tests.
Table 12: Physico-chemical properties of the applied soil.
Physico-chemical soil properties RefeSol 01A
pH 5.67
Corg [%] 0.93
Ntot [mg/kg] 882
CECeff [mmolc/kg] 37.9
Sand [%] 71
Silt [%] 24
Clay [%] 5
WHCmaxa [ml H2O/kg] 227
a WHCmax: maximum water-holding capacity
5.1.3 Application of the nanoparticles
Spiking of soil with powder
Earthworm reproduction test
In order to spike soil with the nanomaterial powder, the powder was mixed directly into the soil, whereby air-dried test soil or silica sand was used as a carrier (1% of the total amount). Silica sand is used in the building trade and is characterised by a particle size of 0 – 0.5 mm and a specific surface of 89 cm2/g. The same silica sand is used when we perform tests in artificial soil (composition described, e.g. in OECD test guideline 222). Suitable amounts of nanomaterial powder to achieve the desired final soil content were mixed homogenously with the dry soil. Care was taken to avoid a modification of the TiO2 crystalline structure. Uncon-taminated test soil (between 20-30% of WHCmax) was spread on a plate, the carrier material with the powder was distributed onto the test soil, and the components mixed carefully. Then, the soil was adjusted to a water content of 55% of the maximum water-holding capacity (WHCmax). Test concentration: 100 mg/kg soil dry matter (dm).
Spiking of food with powder For the spiking of food with the nanomaterial, 40 g of air-dried ground cow manure was ho-mogenously mixed with powder. The mixture was moistened with 120 ml deionised water. Test concentrations were: 6.38 mg/g food (dm), corresponding to 100 mg/kg soil (dm); intro-duction of 40 g moist food (10 g dry food and 30 ml deionised H2O) on the surface of the 1-L test containers, each filled with 640 g soil (dm).

Preliminary experiments 31
Spiking of soil with aqueous suspension For the application of an aqueous suspension, a suspension was prepared with a magnetic flea (900 rpm; 1 min) and ultrasonication (3 min) in a bath sonicator (Hund-Rinke et al., 2010). Test soil was dried to about 10% of WHCmax and spread on a plate. Immediately after preparation, TiO2 nanoparticle suspension was sprayed onto the soil by means of a syringe coupled with a cannula, and thoroughly mixed. Finally, the test soil was adjusted to a water content of 55% of the maximum water-holding capacity (WHCmax).
Test concentration: suspension with 100 mg/L deionised water; application of 250 ml test dispersion to 2.5 kg test soil (dm), corresponding to 10 mg/kg soil (dm).
Spiking of food with aqueous suspension For spiking of food with suspension, a mixture of suspension and earthworm food was pre-pared, whereby 40 g of cow manure was mixed with 120 ml concentrated suspension.
Test concentration: suspension with 212 mg/L deionised water; application of 120 ml test suspension, corresponding to 10 mg/kg soil (dm).
Spiking of soil with nanomaterial powder
Soil microflora - nitrification test
For the first application, the nanomaterial powder was mixed directly into the soil, whereby air-dried test soil or silica sand (1% of the total amount) were used as carriers. Suitable amounts of powder to achieve the desired final soil content were mixed homogenously with the dry soil or the silica sand. Care was taken to avoid a modification of the crystalline struc-ture of the nanoparticles. Uncontaminated test soil (between 20-30% of WHCmax) was spread on a plate, the carrier material with the powder distributed on the test soil, and all compo-nents mixed carefully. In the same way, 5 g/kg dm ground lucerne was mixed into the soil. Then, the soil was adjusted to a water-holding capacity of 55% of the maximum water-holding capacity (WHCmax). Test concentrations: 9.3, 21, 45 and 100 mg/kg soil dry matter (dm)
Spiking of soil with aqueous nanomaterial dispersion
The method of the second trial was to spray a nanomaterial suspension (nanomaterial in deion. water) that had been prepared with a magnetic flea (900 rpm; 1 min) and ultrasonica-tion (3 min) in a bath sonicator. Test soil was dried to about 10% of WHCmax, spread on a plate and 5 g/kg dm of ground lucerne was mixed into the soil. Immediately after preparation, TiO2 nanoparticle suspension was sprayed onto the soil by means of a syringe coupled with a cannula and thoroughly mixed. Finally, the test soil was adjusted to a water-holding capac-ity of 50% of the maximum water-holding capacity. A maximum concentration of 260 mg/L application suspension was considered adequate for the tests. Higher concentrations would have sedimented rapidly which would have prevented a homogenous distribution of the nanomaterial in the soil. The maximum water content in the test soil should be about 50% of the maximum water-holding capacity. Due to these limitations, only soil contents of 9.3 and 21 mg/kg were tested. Higher concentrations achieved by several spiking – drying cycles were not studied since modification of the bioavailability of the nanomaterial by this process

Preliminary experiments 32
could not be excluded. Test concentrations: dispersion with 116.3 and 226.5 mg/L deionised water; application of 120 ml test dispersion to 1.5 kg test soil (dm), corresponding to 9.3 and 21 mg/kg soil (dm)
5.1.4 Ecotoxicological tests with earthworms
All tests were performed as described in the OECD Guideline 222 “Earthworm reproduction test with Eisenia fetida.” The earthworms were acclimatised to the test soil for 7 d prior to test start.
Adjusted to 55% of the maximum water-holding capacity, 640 g soil (dm) was added to con-tainers at a depth of about 5 cm. All tests were performed in polypropylene containers (Bel-laplast GmbH, Alf). The test was performed with four replicates for the control and four repli-cates for each test concentration.
For the experiments with spiked soil the contaminated soil was weighed in the test containers and 40 g (wet weight) of uncontaminated food was spread on the surface.
For the experiments with spiked food, the test containers were filled with uncontaminated soil and 40 g of contaminated food was spread on the surface.
The next day, 10 earthworms weighing between 250 mg and 600 mg were added to each container. The tests started with the introduction of Eisenia fetida. The containers were then incubated at 20°C ± 2°C, at a light/dark cycle of 16/8 h. Light intensity was 700 lux.
Once per week the water content was checked gravimetrically and evaporated water was replaced. Every 7 days 20 g (wet weight) of uncontaminated food per test container was spread on the soil surface. The adult earthworms were removed after 28 days. After 56 days (test end) the number of juveniles in each test container was counted.
5.1.5 Ecotoxicological tests with soil microflora
Three incubation containers (as described in 5.1.4) per treatment were filled with 658 g of spiked and lucerne meal-amended soil. A further three incubation containers were filled with 658 g of control soil. This soil was also amended with lucerne (5 g plant material per kilogram of soil (dry mass)).
The test was carried out in the dark at 20 ± 2°C for 28 days. The moisture content of the soil was maintained during the test at 40 - 60% of the WHCmax with a range at maximum of 5%. The mass in the test vessels was measured weekly. Evaporated water was supplemented by adding deionised water.
Two samples of each treated and control replicate were analysed for nitrate at the beginning (day 0) and at the end of the exposure period (28 days).

Preliminary experiments 33
Nitrate was extracted from soil by mixing samples (20 g dry mass) with 0.1 M KCl solution at a ratio of 5 mL of KCl solution per gram dry weight and shaking for 60 minutes at 150 rpm. The mixtures were filtered and the liquid phases photometrically analysed for nitrate (Spec-troquant® NOVA 400). Analyses were performed immediately after extract preparation.
Nitrate analysis of soil samples:
5.1.6 Chemical analyses
Particle size distribution was not determined in the dispersion, as the current methods are insufficient and the outcome does not provide information on the size distribution in soil or food. The state of the art methods are included in the publications of Fareé et al. (2011) and von der Kammer et al. (2012).
For information on homogeneity, the concentration of Ag nanoparticles in soil was deter-mined. The only procedure for determining the TiO2 nanoparticle concentration in soil was to use sulphuric acid which gave a combined result for Ti added as nanoparticles and Ti al-ready present in soil. Due to high background values of Ti, added Ti was insufficiently de-tected. Therefore, only the results of Ag are presented. It is expected that the results of Ag can be transferred to the behaviour of TiO2 nanoparticles. Although the chemical composition differs, the application procedure is the same: first, a suspension or a solid mixture of the is evenly distributed on a thin soil layer. Secondly,, soil and nanomaterial mixture (dispersion or solid mixture) are thoroughly mixed. Even if one nanomaterial sticks more to the soil than the other (e.g. by a different zeta potential), both materials should be distributed to a comparable extent due to the thoroughly mixing.
5.2 Results
5.2.1 Reproduction test with earthworms
The weight of the worms and the number of offspring are presented in Table 13 - Table 16.
The inhibition of reproduction and the inhibition of increase in weight affected by the test concentrations of P25 and Ag compared to the control are shown in Figure 2.
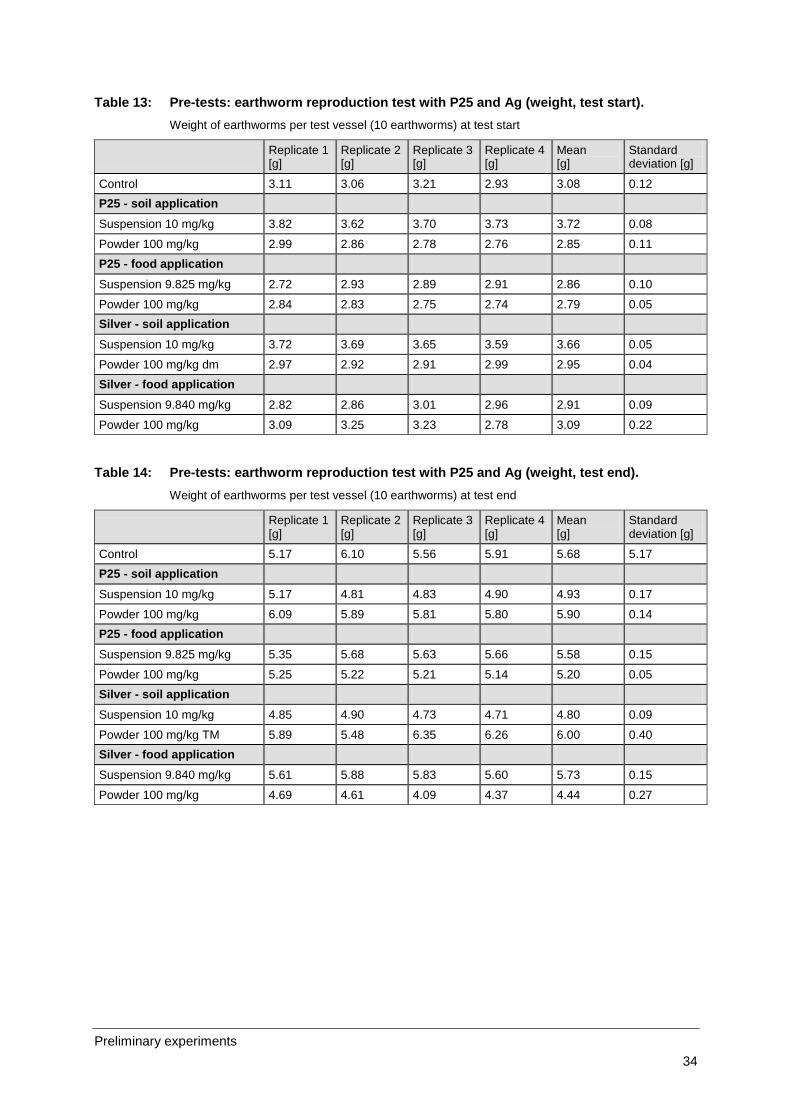
Preliminary experiments 34
Table 13: Pre-tests: earthworm reproduction test with P25 and Ag (weight, test start). Weight of earthworms per test vessel (10 earthworms) at test start
Replicate 1 [g]
Replicate 2 [g]
Replicate 3 [g]
Replicate 4 [g]
Mean [g]
Standard deviation [g]
Control 3.11 3.06 3.21 2.93 3.08 0.12 P25 - soil application
Suspension 10 mg/kg 3.82 3.62 3.70 3.73 3.72 0.08
Powder 100 mg/kg 2.99 2.86 2.78 2.76 2.85 0.11 P25 - food application
Suspension 9.825 mg/kg 2.72 2.93 2.89 2.91 2.86 0.10
Powder 100 mg/kg 2.84 2.83 2.75 2.74 2.79 0.05 Silver - soil application
Suspension 10 mg/kg 3.72 3.69 3.65 3.59 3.66 0.05
Powder 100 mg/kg dm 2.97 2.92 2.91 2.99 2.95 0.04 Silver - food application
Suspension 9.840 mg/kg 2.82 2.86 3.01 2.96 2.91 0.09
Powder 100 mg/kg 3.09 3.25 3.23 2.78 3.09 0.22
Table 14: Pre-tests: earthworm reproduction test with P25 and Ag (weight, test end). Weight of earthworms per test vessel (10 earthworms) at test end
Replicate 1 [g]
Replicate 2 [g]
Replicate 3 [g]
Replicate 4 [g]
Mean [g]
Standard deviation [g]
Control 5.17 6.10 5.56 5.91 5.68 5.17 P25 - soil application
Suspension 10 mg/kg 5.17 4.81 4.83 4.90 4.93 0.17
Powder 100 mg/kg 6.09 5.89 5.81 5.80 5.90 0.14 P25 - food application
Suspension 9.825 mg/kg 5.35 5.68 5.63 5.66 5.58 0.15
Powder 100 mg/kg 5.25 5.22 5.21 5.14 5.20 0.05 Silver - soil application
Suspension 10 mg/kg 4.85 4.90 4.73 4.71 4.80 0.09
Powder 100 mg/kg TM 5.89 5.48 6.35 6.26 6.00 0.40 Silver - food application
Suspension 9.840 mg/kg 5.61 5.88 5.83 5.60 5.73 0.15
Powder 100 mg/kg 4.69 4.61 4.09 4.37 4.44 0.27

Preliminary experiments 35
Table 15: Pre-tests: earthworm reproduction test with P25 and Ag (weight increase, test end). Weight increase of earthworms per test vessel (10 earthworms) at test end
Replicate 1 [g]
Replicate 2 [g]
Replicate 3 [g]
Replicate 4 [g]
Mean [g]
Standard deviation [g]
Statistical signifi-cance 1
Control 2.06 3.04 2.35 2.98 2.61 0.48 P25 - soil application
Suspension 10 mg/kg 1.35 1.18 1.13 1.17 1.21 0.10 *
Powder 100 mg/kg 3.10 3.02 3.03 3.04 3.05 0.04 n.s. P25 - food application
Suspension 9.825 mg/kg 2.63 2.75 2.74 2.75 2.72 0.06 n.s.
Powder 100 mg/kg 2.40 2.39 2.46 2.40 2.41 0.03 n.s. Silver - soil applica-tion
Suspension 10 mg/kg 1.13 1.21 1.09 1.11 1.13 0.05 *
Powder 100 mg/kg dm 2.92 2.56 3.44 3.28 3.05 0.39 n.s. Silver - food applica-tion
Suspension 9.840 mg/kg 2.79 3.02 2.82 2.64 2.82 0.16 n.s.
Powder 100 mg/kg 1.61 1.36 0.87 1.60 1.36 0.35 *
1 statistical significance: * 0.05 ≥ p > 0.01; ** 0.01 ≥ p > 0.001; * p ≤ 0.001; n.s. = not significant
Table 16: Pre-tests: earthworm reproduction test with P25 and Ag (number of offspring). Number of offspring per test vessel (10 adult earthworms) at test end
Replicate 1 [g]
Replicate 2 [g]
Replicate 3 [g]
Replicate 4 [g]
Mean [g]
Standard deviation [g]
Statistical signifi-cance 1
Control 243 295 307 323 292.0 34.6 P25 - soil application
Suspension 10 mg/kg 264 270 283 221 259.5 26.9 n.s.
Powder 100 mg/kg 212 291 248 222 243.3 35.3 n.s. P25 - food application
Suspension 9.825 mg/kg 259 214 229 299 250.3 37.5 n.s.
Powder 100 mg/kg 208 242 229 204 220.8 17.9 * Silver - soil applica-tion
Suspension 10 mg/kg 291 292 224 246 263.3 33.8 n.s.
Powder 100 mg/kg dm 290 197 249 282 254.5 42.2 n.s. Silver - food applica-tion
Suspension 9.840 mg/kg 269 296 209 235 252.3 38.1 n.s.
Powder 100 mg/kg 161 172 178 179 172.5 8.3 *
1 statistical significance: * 0.05 ≥ p > 0.01; ** 0.01 ≥ p > 0.001; * p ≤ 0.001; n.s. = not significant

Preliminary experiments 36
Figure 2: Pre-tests: earthworm reproduction test with P25 and Ag. Percent inhibition of biomass increase and percent inhibition of reproduction compared to control (negative values indicate stimulation)
Effects on biomass and reproduction differ. Reproduction was inhibited at higher test concen-trations, the increase in biomass showed no concentration dependency. Generally, the pa-rameter biomass is difficult to assess. According to the guideline biomass has to be meas-ured but it is no parameter for which ECx or NOEC values have to be reported.
No clear differences in effect were observed between the application in dung or soil and ap-plication via dispersion or powder.According to the guideline OECD 222 the relevant end-point is reproduction. Inhibition of reproduction was only observed for the 100 mg/kg powder application (Ag and TiO2 nanoparticles) in dung.
5.2.2 Soil microflora - nitrification activity
Three experiments differing in application forms (in silica sand, in soil, via suspension) and tested concentrations of nanoparticles were conducted.
Experiments with silver nanoparticles
1st experiment: Comparison of three spiking forms
• Spiking via soil and silica sand as solid carrier; two test concentrations (10 and 100 mg/kg)
• Spiking via dispersion; one test concentration resulting in a concentration of 10 mg/kg in soil; a concentration in soil of 100 mg/kg was not considered suitable; the concen-tration in the test suspension was considered to be too high and large agglomerates were expected.
-20
0
20
40
60
80
100
Incr
ease
of b
iom
ass
[%]
-20
0
20
40
60
80
100
Inhi
btio
n of
repr
oduc
tion
[%]
Inhibition of in biomass increase [%] Inhibiton of reproduction [%]
AgP25
Soil Dung
10 mg/kg
100 mg/kg
9.8 mg/kg
100 mg/kg
Application of:via:
Concentration:
Susp. Susp.Powder PowderSoil Dung
10 mg/kg
100 mg/kg
9.8 mg/kg
100 mg/kg
Susp. Susp.Powder Powder
Inhi
bitio
n of
bio
mas
s in
crea
se [%
]
Inhi
bitio
n of
repr
oduc
tion
[%]

Preliminary experiments 37
2nd experiment: Comparison of two spiking forms – valdidation of the results for the most promising procedures of the 1st experiment
• Spiking via soil as solid carrier; two test concentrations (10 and 100 mg/kg); based on the results of the first experiment spiking using silica sand was considered less suit-able.
• Spiking via dispersion (10 mg/kg)
3rd experiment: Comparison of two spiking forms – three test concentrations
• Spiking via soil as solid carrier; two test concentrations (10, 50, 100 mg/kg); based on the results of the first experiment spiking using silica sand was considered less suit-able.
• Spiking via dispersion (10, 50, 100 mg/kg)
The microbial nitrification activity was used as indicator for ecotoxicity. A compilation of the results is shown in Figure 3. A comparison of the results obtained for the soil contents of 10 and 100 mg/kg indicates lowest effects for the application via silica sand, followed by the application via soil. At 10 mg/kg the highest effects are obtained with the application via sus-pension. A slightly increased toxicity is obtained at 50 mg/kg for the application via suspen-sion. At 100 mg/kg no difference between an application via soil and suspension is obtained. Both application forms almost completely inhibit the nitrification activity. From these results it can be concluded that the bioavailability of the nanoparticles is reduced in the presence of silica sand. Therefore, this application form was not considered in the main experiments. Due to the comparable results for spiking via soil and dispersion in the 3rd experiment for the low-est test concentration (10 mg/kg) which did not correspond to the results of the 2nd experi-ment no information on the most suitable application form was achieved.
The standard deviation of the nitrification activity in the replicates was used as an indicator for the homogeneity of spiking. To determine the nitrification activity four soil samples (20 g each) were analysed. A high standard deviation of the activity values indicated a non-homogeneous distribution of the test substance. For this assessment only activity values that were in a medium inhibition range compared to the control were suitable as high inhibition results in low activity values. Even small differences in the activity values result in a compa-rable high percent standard deviation. Activity values which are only slightly reduced com-pared to the control are not applicable. In Figure 4 the standard deviation of suitable soil samples is presented. It is obvious that the application of dry powder as well as the applica-tion of suspensions can result in standard deviations which are in the range of the standard deviations of the control. However, for every application form outliers were observed (e.g.: experiment 1, application via silica sand results in a soil content of 100 mg/kg; experiment 3, application via suspension results in a soil content of 50 mg/kg). Therefore, both application techniques (application of dry powder and suspensions) are theoretically suitable. The rea-son for the outliers, however, is not yet understood.

Preliminary experiments 38
0
20
40
60
80
100
sand soil suspension100 mgAg/L
sand soil suspension940 mg/L
soil suspension470 mg/L
Inhi
bitio
n of
nitr
ifica
tion
[%]
Experiment 1 Experiment 2 Experiment 3
Application via:
Concentration in soil: 10 mg/kg 100 mg/kg 50 mg/kg
Figure 3: Pre-tests: effects of different application forms for Ag nanoparticles on nitrification activity.
0
10
20
30
40
50
60
70
80
Stan
dard
dev
iatio
n [%
]
Experiment 1 Experiment 2 Experiment 3
Soil---
10 mg/kg
Application via:
Concentration in soil:
0 mg/kg 100 mg/kg 50 mg/kg
Suspension 100 mg Ag/L Sand
Suspension 50 mg Ag/L
Figure 4: Pre-tests: standard deviation of nitrification activity in the nitrification tests with Ag resulting in ~50% inhibition.
The toxicity of P25 is much lower compared to the toxicity of silver (
Experiments with P25
Figure 3 and 5). There-fore, information concerning suitable application techniques of P25 is limited. Nevertheless, it was observed that P25 application via soil achieved higher bioavailability compared to appli-cation via silica sand (Figure 5). Application via suspension resulted in no inhibition effect at all. It is assumed that the high concentration in the dispersions used for spiking showed a high agglomeration rate. The dispersions were very polydisperse and the particle size could

Preliminary experiments 39
not be determined. From the results it is concluded that high test concentrations can be achieved by dry application whereas by wet application the maximum test concentration can be limited by the agglomeration behaviour of the nanoparticles in the dispersion.
0
5
10
15
20
25
30
sand soil suspension100 mg/L
sand soil suspension940 mg/L
Inhi
bitio
n of
nitr
ifica
tion
[%]
Experiment 1 Experiment 2
Application via:
Concentration in soil: 10 mg/kg 100 mg/kg
no inhibition no inhibitionno inhibition
Figure 5: Pre-tests: effect of different application forms of P25 on nitrification activity.
5.2.3 Chemical analyses
The pre-tests presented above were performed with material purchased from Sigma Aldrich and distributed as powder. This material was selectedas the OECD nanomaterial was not yet available. It had been expected that the OECD material would be available in solid form (powder). However, the NM-300K was received as a stabilised dispersion. To get information about the homogenous distribution of the NM-300K material soil samples from the earthworm test (see main test presented below) were used for chemical analyses. Soil spiked with NM-300K using a small amount of soil as carrier was investigated.
Silver analyses NM-300K in the earthworm test
The results for the application via soil are presented in Table 17.

Preliminary experiments 40
Table 17: Homogeneity of spiking: recovery of NM-300K in soil (earthworm test). Five replicate samples, each measured twice
Application / sample weighed for digestion [g]
measured Ag conc [µg/L]
dilution factor
calculated Ag conc. [mg/kg]
nominal Ag conc. [mg/kg]
recovery [%]
mean recovery ± SD 2
Control
1 3.13 3.24 - < LOD - -
-
2 3.13 3.14 - < LOD - -
3 3.08 3.28 - < LOD - -
4 3.16 2.44 - < LOD - -
5 3.16 3.04 - < LOD - -
Application via soil: 120 mg/kg
1-1 3.10 307 10 99.03 120 82.5
89.6 ± 4.4
1-2 3.11 332 10 106.78 120 89.0 2-1 3.13 321 10 102.54 120 85.4 2-2 3.10 359 10 115.77 120 96.5 3-1 3.06 321 10 105.01 120 87.5 3-2 3.17 356 10 112.27 120 93.6
4-1 3.13 349 10 111.57 120 93.0
4-2 3.12 338 10 108.63 120 90.5
5-1 3.12 319 10 102.35 120 85.3
5-2 3.11 347 10 111.63 120 93.0
Application via soil: 15 mg/kg
1-1 3.07 93.6 5 15.25 15 102
90.0 ± 14.5
1-2 3.12 74.0 5 11.86 15 79.0 2-1 3.11 69.5 5 11.16 15 74.4 2-2 3.04 85.1 5 14.01 15 93.4 3-1 3.04 84.5 5 13.89 15 92.6 3-2 3.12 77.1 5 12.35 15 82.3 4-1 3.05 91.9 5 15.06 15 100 4-2 3.05 78.8 5 12.91 15 86.1 5-1 3.13 110 5 17.56 15 117 5-2 2.63 54.2 5 10.29 15 68.6
1 LOD = limit of detection (11.5 µg/L); 2 SD = standard deviation
With 90% each for the low and high test concentrations, recovery was satisfactory. Powder in the concentration of 120 mg/kg was more homogenously distributed than in concentrations of 15 mg/kg despite the same amount of carrier soil used for both concentrations. Nevertheless, 15% standard deviation was considered to be in an acceptable range.
After elaboration of the results of the main tests, we could also include biological variability in the considerations concerning the acceptance of the homogeneity of spiking. We selected 68 results (mean values and standard deviations) with either TiO2 or Ag nanoparticles from ran-domly-selected tests of this project with different test organisms and test parameters, includ-ing earthworm reproduction, plant growth and microbial nitrogen and carbon transformation. The same criteria were applied to tests with conventional chemicals performed at the Fraun-hofer-Institute (60 test results, mean values and standard deviations). Each standard devia-tion was expressed as a percentage of the respective mean value. The 90% percentile of the standard deviations for both sets of tests (nanoparticles and conventional chemicals) was

Preliminary experiments 41
calculated. Ninety percent of the standard deviations in the nanomaterial tests were in the range 2–17% compared to 3–24% in the conventional chemical tests. The variability of the chemical analysis results was comparable to the variability of the ecotoxicological test results with nanoparticles. Furthermore, the variability of the nanomaterial tests based on dry spiking using soil as the carrier was comparable to the variability of the conventional substance tests spiked with aqueous solutions. We therefore concluded that the dry spiking procedure using soil as the carrier achieves adequate spiking homogeneity.
Due to the high background values of titanium in the applied soil only silver analyses of the soil samples are presented. Due to high concentration levels the samples had to be diluted prior to analysis to fit with the working and calibration range of the instrument (ICP-OES). The silver concentrations measured after digestion in the control soil samples were below the limit of detection (< 0.122 - < 0.819 mg/kg).
Silver analyses (Sigma Aldrich) in soil samples of the nitrification test
Table 18 summarizes the measured silver con-centrations in soil.

Preliminary experiments 42
Table 18: Homogeneity of spiking: recovery of silver in soil (nitrification test). Silver: Sigma Aldrich; six replicate samples
Application / sample Weighed for digestion [g]
Measured Ag conc [µg/L]
Dilution factor
Calculated Ag conc. [mg/kg]
Nominal Ag conc. [mg/kg]
Recovery [%]
Mean recovery ± SD 2 [%]
Control 3.024 < LOD 2 < LOD 1 - - - Control 3.008 < LOD 2 < LOD 1 - - -
Application via soil: 100 mg/kg
1 3.024 45.9 50 75.9 100 75.9
80.4 ± 3.1
2 3.025 49.9 50 81.7 100 81.7 3 3.030 50.8 50 83.9 100 83.9 4 3.007 49.3 50 81.9 100 81.9 5 3.007 1184 2 78.7 100 78.7 6 3.043 1172 2 77.0 100 77.0
Application via disper-sion: 100 mg/kg
1 3.010 1229 2 81.7 100 81.7
80.6 ± 1.6
2 3.035 1106 2 72.9 100 72.9 3 3.012 1206 2 80.1 100 80.1 4 3.002 1236 2 82.3 100 82.3 5 3.002 1230 2 81.9 100 81.9 6 2.999 1181 2 78.8 100 78.8
Application via soil: 10 mg/kg
1 3.031 119 2 7.85 10 78.5
76.2 ± 8.8
2 3.023 99.5 2 6.58 10 65.8 3 3.026 101 2 6.66 10 66.6 4 3.019 117 2 7.76 10 77.6 5 3.015 132 2 8.74 10 87.4 6 2.998 109 2 7.30 10 73.0
Application via disper-sion: 10 mg/kg
1 2.999 73.8 2 4.92 10 49.2
47.2 ± 1.6
2 3.013 79.0 2 5.24 10 52.4
3 3.043 68.9 2 4.53 10 45.3
4 3.008 73.9 2 4.91 10 49.1
5 3.014 70.8 2 4.69 10 46.9
6 3.004 71.3 2 4.74 10 47.4
1 LOD = limit of detection (< 0.122 - < 0.819 mg/kg); 2 SD = standard deviation
The recovery determined for application via dispersion (10 mg/kg) was low. As the experi-ments focused on the characterisation of the homogeneity of spiking, no further sourcing concerning the low recovery was performed. Six replicates sampled at different spots of the soil were analysed. The standard deviation of the recovery was between 1.6 and 8.8 %. To receive information on the homogeneity, the recovery was considered to be 100 % and the standard deviation was calculated as percent of the recovery. Values between 2.0 and 11.5% were calculated (e.g.: 80.6 % was considered to be 100 %; 1.6 of 80.6 amounts to 2.0 %). A variability between 2.0 and 11.5 % is considered to be acceptable for biological analy-ses. The observed outliers in the nitrification test resulting in high standard deviation (Figure 4) cannot be explained by non-homogeneous spiking.

Preliminary experiments 43
5.2.4 Conclusions
As the toxicity for silver was higher than that for P25, the following conclusions drawn for the most suitable application technique are based on the results obtained for silver:
• Based on the lower effects - indicating lower bioavailability – obtained upon the appli-cation via silica sand compared to the application via soil and suspension, the appli-cation via silica sand is considered less suitable.
• Application via powder allows a high variability of the test concentrations.
• Application via liquid suspension may cause a higher bioavailability of the elements.
• For earthworms, spiking of dung may result in a higher toxicity for earthworms com-pared to the spiking of soil. However, spiking of soil is the method described in the respective guidelines.
To obtain further results the following procedure was applied in the main tests:
• TiO2 nanoparticles: application via suspension and via solid carrier (soil) in soil as well as via suspension (all tests) and directly in the form of powder in dung (tests with earthworms; due to the high amount of nanomaterial added to dung, no carrier was considered to be necessary)
• Ag nanoparticles: application via solid carrier (soil) in soil and directly in dung
Preliminary experiments 44
6 Pre-tests - dispersion in aquatic tests
As mentioned in chapter 5 documents referring specifically to the application of nanoparticles for ecotoxicological tests are not available. For tests with daphnids and chironomids the method described by Hund-Rinke et al. (2010) was used, and supplementing studies con-cerning filtration and the use of stabilisers were performed.
6.1 Basic procedure
The method described by Hund-Rinke et al. (2010) was applied. For insoluble nanoparticles in powder form the required amounts were weighed in brown glass vessels (600 mL) using a suitable balance. Test medium was added, the mixture was stirred (magnetic stirrer, 900 rpm) and ultrasonified (3 min, 500 W) in a bath sonicator (Bandelin Sonorex RK 514 BH; 35 kHz; 215/860 W) filled with water to one third of the dispersion height in the bottles. For con-centrations in the range of 5 - 100 mg/L every concentration was prepared individually. For concentrations below 5 mg/L concentrated stock suspensions were prepared in most cases. For the test with daphnids, a 20 mg/L stock dispersion was used.
For silver (NM-300K) stabilised in an aqueous medium suitable stock dispersions were pre-pared in the test medium. A homogenous distribution was achieved via stirring.
6.2 Filtration
The method to be applied for the exposure of daphnia was elaborated in pre-tests. According to the guideline, the test substance is dissolved in the exposure medium, the daphnia are added and the incubation is performed without any movement of the vessels or the exposure medium. This is a suitable procedure for soluble test substances. Nanoparticles, however, will sediment in tests without movement and the exposure concentration in the test media will decrease. Stirring or shaking during the incubation period is not advisable as daphnids and their reproduction rate are sensitive towards such procedures. Therefore, it was investigated whether a stabile dispersion can be achieved by elimination of the large agglomerates via filtration.
The following procedure was applied:

Preliminary experiments 45
Two different filter types and two different filter devices were tested.
Filters: Mixed cellulose esters combined with filters of the disposal type
Polycarbonate membrane filter combined with a filtration device using vacuum
In a first step the dispersion of TiO2 nanoparticles (P25; 10 mg/L) was filtered using a filter with a pore size of 0.45 µm (mixed cellulose esters). In a second step the filtrate was filtered again using a filter with a pore size of 0.2 (polycarbonate membrane filter) or 0.22 µm (mixed cellulose filter). In every fraction the Ti concentration was analysed.
In contrast, with mixed cellulose filters, almost no filtrate was obtained using polycarbonate membrane filters even when the filters were changed several times during the filtration proc-ess.
In Table 19, representative results from several filtration experiments with both filter types and filter devices are presented. In the first experiment different pore sizes were used for the two filtration processes in accordance with the scheme above. Although the primary particle diameter of P25 was 21 nm, almost no Ti was detected in the filtrate. Particles and agglom-erates mainly remained above the filter. The maximum recovery in the filtrate of step 1 was 0.01%. Using the filtration device with vacuum, in step 2 a slightly higher Ti concentration was measured than in the filtrate of step 1. It is assumed that some agglomerates of the first filtration process remained in the filter device although the device was carefully cleaned be-fore the second filtration process started. During the second filtration process the remaining agglomerates were rinsed in the new filtrate resulting in the increased Ti concentrations. For justification a second experiment was performed. In this experiment the dispersion was fil-tered twice with a filter of the same pore size. Again, a higher concentration of Ti was meas-ured in the second filtrate when using vacuum filtration.
Between replicate samples the results can differ by a factor of 2 - 4. For ecotoxicological ex-periments with concentration-effect curves, concentrations differing by a factor of 2 - 3 have to be investigated. As the concentrations of the replicate samples differed by a factor of 2 - 4 no clear dose-response curves were expected by investigating the filtrates. Furthermore, filtration is very time consuming and does not seem to be suitable for routine testing. There-
0.45 µm 0.22 µm
0.2 µm
Filters of mixed cellulose esters
Polycarbonate mem-brane filter
Analysis of Ti concentration in every fraction
TiO2 dispersion
Step 1
Step 2
Filter devices: • Filters of dis-
posal type • Filtration de-
vice using vacuum

Preliminary experiments 46
fore, the testing of filtrates was cancelled for the test with daphnids and original dispersions were tested.
Table 19: Ti concentration in the filtrate of a TiO2 dispersion after diverse filtration proc-esses. TiO2 nanoparticles: 10 mg/L; Ti: 6 mg/L; filter material: mixed cellulose ester
Filtration - Step 1 Filtration - Step 2 First experiment: step 1 and step 2: different pore sizes Filter 0.45 µm cellulose mixed ester 0.22 µm cellulose mixed ester
Filtration device using vacuum Sample 1: 0.62 µg/L Sample 2: 0.33 µg/L
Sample 1: 1.27 µg/L Sample 2: 1.43 µg/L
Filter 0.45 µm cellulose mixed ester 0.2 µm polycarbonate membrane filter
Filters of the disposal type Sample 1: 0.17 µg/L Sample 2: 0.17 µg/L
Sample 1: 0.26 µg/L Sample 2: 0.13 µg/L
Second experiment: step 1 and step 2: same pore sizes Filter 0.22 µm cellulose mixed ester 0.22 µm cellulose mixed ester
Filtration device using vacuum Sample 1: 0.34 µg/L Sample 2: 1.39 µg/L
Sample 1: 2.87 µg/L Sample 2: 2.24 µg/L
Filter 0.2 µm polycarbonate membrane filter
0.2 µm polycarbonate membrane filter
Filters of the disposal type Sample 1: 0.55 µg/L Sample 2: 0.22 µg/L
Sample 1: 0.17 µg/L Sample 2: 0.26 µg/L
6.3 Stabilisers
The investigation of stabilisers was not within the scope of this project as stabilisers are as-sumed toxic. However, due to many discussions in the scientific community, and especially the recommendations of scientists dealing with the preparation of homogenous test sub-stances, the effect of the stabiliser sodium hexametaphosphate (0.01 %) was investigated. To give a complete overview on the experiments dealing with application methods for nanoparticles performed at Fraunhofer IME, the results are presented in the following. Ex-periments focusing on the preparation of homogenous test suspensions used concentrations of about 1 % (10 g/L). In the test guidelines for aquatic ecotoxicological tests a maximum concentration of 0.01 % is fixed for the use of solubilisers for organic chemicals insoluble in water. In our project, the same limit was applied for the stabilisers used for nanoparticles. The test was performed in Erlenmeyer flasks with TiO2 nanoparticles and algae as a growth test according to the OECD test guideline 201 (Hund-Rinke et al., 2010). The addition of the stabiliser resulted in stable suspensions. No sedimentation of the test substance occurred. Although the stabilizer was applied in the maximum tolerable concentration mentioned for stabilizers in the test guidelines a toxic effect was still observed and growth of algae was significantly reduced . However, in the presence of the stabiliser, TiO2 nanoparticles (P25) affected the growth of algae less than without stabiliser (Figure 6). Bioavailability of P25 to algae is reduced in the presence of a stabiliser although the test suspension has a better homogeneity.
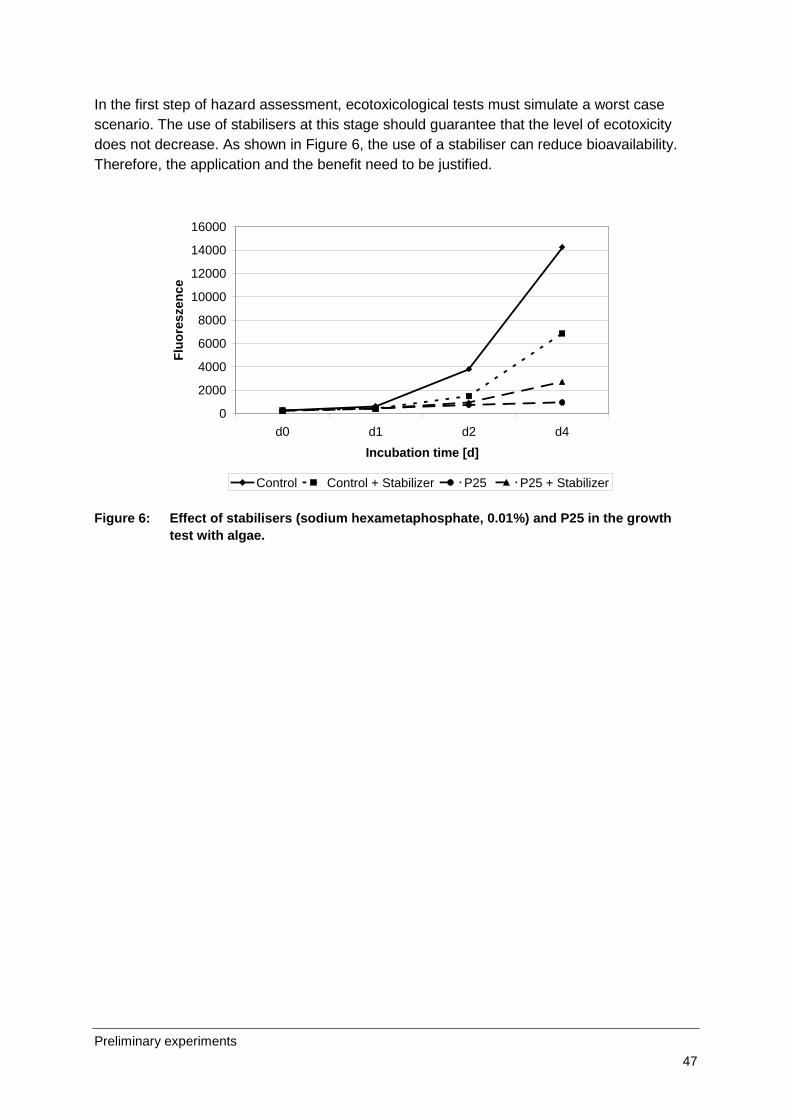
Preliminary experiments 47
In the first step of hazard assessment, ecotoxicological tests must simulate a worst case scenario. The use of stabilisers at this stage should guarantee that the level of ecotoxicity does not decrease. As shown in Figure 6, the use of a stabiliser can reduce bioavailability. Therefore, the application and the benefit need to be justified.
0
2000
4000
6000
8000
10000
12000
14000
16000
d0 d1 d2 d4Incubation time [d]
Fluo
resz
ence
Control Control + Stabilizer P25 P25 + Stabilizer
Figure 6: Effect of stabilisers (sodium hexametaphosphate, 0.01%) and P25 in the growth test with algae.

Reproduction test with earthworms – TiO2
48
7 Reproduction Test with Earthworms (OECD TG 222) – TiO2
7.1 Test principle
Adult earthworms of the species Eisenia fetida were placed in a defined soil containing dif-ferent concentrations of the test item. The test item was applied once and the effects on bio-mass and mortality of the adult worms were determined after 28 days. After 56 days effects on reproduction were determined by counting the offspring.
In addition to the test guideline, accumulation in the adults was tested after the exposure period of 28 days.
7.2 Materials and methods
7.2.1 Test guideline
The test was performed according to:
OECD Guidelines for the Testing of Chemicals Test No. 222: Earthworm Reproduction Test (Eisenia fetida, Eisenia andrei) (2004).
7.2.2 GLP
The test was performed following the principles of GLP (OECD, 1998). In deviation to GLP no archiving of the raw data was performed and the quality assurance unit was not involved with respect to the inspection of the test, of the raw data, and the report. All laboratory equipment (e.g. balances, thermometers, pH-meters) was controlled and documented ac-cording to GLP.
7.2.3 Test material
• P25 - distributed by Evonik for the OECD Sponsorship Programme The properties should correspond to the properties of NM-105.
• NM-101
• NM-103
The test substances were stored in the dark at room temperature.
7.2.4 Analytical monitoring
Due to the high natural concentration of TiO2 in the test soil no specific chemical analyses were performed for this medium.
Zeta potential was measured in the test dispersions using a Zetasizer Nano ZS. Following instrument settings were applied: (I) refractive index: 2.55; (II) adsorption: 0.073. The particle

Reproduction test with earthworms – TiO2
49
size distribution was not determined due to: (i) the high concentrations of TiO2 nanoparticles precluded a determination of the particle size distribution, (ii) size distribution in the disper-sion would give no information on the size distribution in soil or feed. At present, measure-ment of the Zeta potential or particle size distribution in soil is not possible.
Ti was determined in the earthworms. Earthworms were incubated for 24 h on wet filter pa-per to purge their guts. Afterwards they were frozen (-20°C) until analysis.
7.2.5 Test item – preparation protocol
Four different modes of application were tested.
Spiking of soil with TiO2 powder For the first application the TiO2 powder was mixed directly into the soil, whereby air-dried test soil (1% of the total amount) was used as a carrier. Suitable amounts of TiO2 powder to achieve the desired final soil content were mixed homogenously with the dry soil. Care was taken to avoid a modification of the TiO2 crystalline structure. Uncontaminated test soil (be-tween 20 and 30% of WHCmax) was spread on a plate, the carrier material with the TiO2 pow-der was distributed on the test soil, and all was mixed carefully. For the test with contami-nated soil, the soil was adjusted to a water-holding capacity of 55% of the maximum water-holding capacity (WHCmax).
Test concentrations were: 50, 100 and 200 mg/kg soil dry matter (dm).
Spiking of feed with TiO2 powder The second application was the direct introduction of TiO2 nanoparticles into the earthworm feed, which consisted of antibiotics-free cow manure. In all four replicates, 40 g of air-dried ground cow manure were homogenously mixed with TiO2 powder. The mixture was mois-tened with 120 ml deionised water.
Test concentrations were: 3.19, 6.38 and 12.76 mg/g feed (dm) corresponding to 50, 100 and 200 mg/kg soil (dm); 40 g moist feed (10 g dry feed and 30 ml deionised H2O) were ap-plied on the surface of the 1-L test containers, each of which was filled with 640 g soil (dm).
Spiking of soil with aqueous TiO2 dispersion The third application trial was to spray a TiO2 dispersion in deionised water onto the soil. The TiO2 dispersion was prepared with a magnetic flea (900 rpm; 1 min) and ultrasonication (3 min) in a bath sonicator. Test soil was dried to about 10% of WHCmax and spread on a plate. Immediately after preparation, the TiO2 dispersion was sprayed onto the soil by means of a syringe coupled with a cannula and then thoroughly mixed with the soil. Finally, the test soil was adjusted to a water-holding capacity of 55% of WHCmax. A maximum concentration of about 200 mg/L application dispersion of TiO2 nanoparticles was considered as adequate for the tests. Higher concentrations would have sedimented rapidly preventing a homogenous distribution of the nanomaterial in the soil. Furthermore, it was assumed that higher concen-

Reproduction test with earthworms – TiO2
50
trations in the application dispersion would result in larger agglomerates. The maximum wa-ter content in the test soil should be about 55% of the maximum water-holding capacity. Based on the present water content of the soil, 212 mg/L application dispersion had to be used. The suspension was continuously stirred to achieve homogeneity during spiking. Due to these limitations, only soil contents of 10 and 20 mg/kg were tested.
Test concentrations were: dispersion with 100 and 200 mg/L deionised water; application of 250 ml test dispersion to 2.5 kg test soil (dm) corresponding to 10 and 20 mg/kg soil (dm).
Spiking of feed with aqueous TiO2 dispersion The fourth and final type of application was a mixture of TiO2 dispersion and earthworm feed, whereby 40 g of cow manure was mixed with 120 ml concentrated TiO2 dispersion.
Test concentrations were: dispersion with 212 and 424 mg/L deionised water; application of 120 ml test dispersion corresponding to 10 and 20 mg/kg soil (dm)
7.2.6 Test species
The test organisms were synchronised adult earthworms of the species Eisenia andrei (An-nelida, Oligochaeta), which were 2 - 12 months old, with a clitellum, and a wet mass between 250 mg and 600 mg.
Origin of the worms: Regenwurmfarm Tacke, Klosterdiek 61, 46325 Borken. Specimens used in the test were bred in the laboratory of the Fraunhofer IME.
Breeding conditions: Worms were bred in 1:1 mixtures of cow manure and sphagnum peat (dry mass basis) at 20°C ± 2°C.
Pre-treatment: The worms were conditioned in the artificial soil for 7 days before use. The same feed as used in the test (see 9.3) was given in a sufficient amount.
7.3 Study design
7.3.1 Study type
Laboratory test
7.3.2 Test duration type and exposure period
Long-term test
The exposure period was 56 days.
• P25: 28 January – 25 March 2010; 19 May – 14 July 2010; 28 January – 25 March 2011

Reproduction test with earthworms – TiO2
51
• NM-101: 18 February – 14 April 2010; 21 January - 18 March 2011
• NM-103: 7 April – 2 June 2010; 21 January – 18 March 2011
7.3.3 Test substrate
The soil used in the test was a natural sandy soil (certified RefeSol 01-A, batch IME-01: sand 71%, silt: 24%, clay: 5%, Org C: 0.93%, pH 5.7, clay: 5%). The soil was sieved to ≤ 2 mm. The soil was not sterilised and had been stored outdoors in high-grade stainless steel basins with drainage and ground contact at the test facility.
7.3.4 Total exposure period
56 days
7.3.5 Post exposure period
There was no post exposure period.
7.4 Test conditions
7.4.1 Environmental conditions
The incubation temperature was measured continuously with a thermograph. According to the guideline the permitted range is 20 ± 2 °C. A controlled light/dark cycle of 16 h:8 h was applied. The light intensity was measured using an illuminance meter (MINOLTA) with photometric sensor in Lux. According to the guideline the permitted value is about 600 lux. The test conditions are presented in Table 20.
Table 20: TiO2: Incubation conditions in the reproduction test with earthworms.
P25 first test
P25 second test
P25 third test
NM 101 first test
NM 101 second test
NM 103 first test
NM 103 second test
Incubation temperature [°C] 18 – 20 20 – 22 19 – 21 19 – 21 19 – 21 19 – 21 19 – 21 Light intensity [lux] 600 –
800 600 – 800
600 – 800
600 – 750
600 – 800
600 – 750
600 – 800
Soil dry mass [%] 81 - 89 79 - 90 80 - 90 79 - 90 81 - 89 80 - 90 81 - 88 pH (1 mol/L KCl) – test start 4.9 5.1 5.1 –
5.4 4.8 - 4.9 5.0 4.9 - 5.0 5.0
pH (1 mol/L KCl) – test end 6.4 – 6.5
6.5 – 6.6
6.7 – 6.9
6.2 – 6.4
6.7 – 6.9
6.2 – 6.6.
6.8 – 6.9

Reproduction test with earthworms – TiO2
52
7.4.2 Test concentrations
The following nominal contents were applied in the test containers with TiO2 nanoparticles:
TiO2
50, 100, 200 mg/kg soil, dry mass (application via powder on soil)
50, 100, 200 mg/kg soil, dry mass (application via powder on feed)
10, 20 mg/kg soil, dry mass (application via dispersion on soil)
10, 20 mg/kg soil, dry mass (application via dispersion on feed)
Additionally, the following concentrations were investigated in the second and third test with P25:
50, 100, 200, 500, 750, 1000 mg/kg soil, dry mass (application via powder on soil)
The following concentrations were investigated in the second test with NM 101 and NM 103: 50, 100, 200, 400 mg/kg soil, dry mass (application via powder on soil).
7.4.3 Other information on materials and methods
Treatment was applied once at test start.
Frequency of treatment
The control consists of soil. Eight replicates per control were conducted.
Control group and treatment
Data evaluation
Statistical method
In this report numerical values are frequently rounded to a smaller degree of precision (num-ber of digits) than used in the actual calculation. Minor differences in the results obtained from calculations with rounded values compared to results obtained with higher precision values are possible. They are, however, well within the limits of the experimental accuracy and of no practical concern.
Statistical calculations For each concentration the percent mortality, the percent loss/increase in biomass of the adults, and the number of offspring produced in the test was determined.
Mortality, biomass and number of offspring were compared by a suitable test for multiple comparisons with a control after testing variance homogeneity. All statistical tests were per-formed with the computer software ToxRat Professional version 2.10.4.1 (ToxRat® Solutions GmbH).

Reproduction test with earthworms – TiO2
53
Air-dried, finely ground cow manure was used as feed.
Feed
All tests were performed in polypropylene containers (Bellaplast GmbH, Alf). Adjusted to 55% of the maximum water-holding capacity, 640 g soil (dm) was filled into containers to a depth of about 5 cm. The containers were covered with transparent plastic lids to prevent worms from escaping and to guarantee access of light. The lids had several small holes to permit gaseous exchange between the medium and the atmosphere.
Test container
Soil and food were spiked. Test soil was filled in the test containers and an amount of 10 g air dried, finely ground cow manure per test container was spread on the soil surface and moistened with water. The next day (start of the test) batches of ten conditioned worms were weighed and placed into each container. Spiking of soil and food, respectively, filling of the test vessels and addition of the earthworms could not be performed at the same day due to high number of test variables and test concentrations.
Test procedure
Once a week the worms were fed according to their feed consumption. Feeding behaviour and the quantity of feed applied over the test period was recorded for each test container. The water content of the soil substrate in the test containers was maintained during the test period by weighing the test containers periodically and replenishing loss of water, if neces-sary.
The adult worms were kept in the substrate over a period of 4 weeks. At the end of this pe-riod, the adults were removed. For each container the total number and mass of living adult worms was recorded.
To allow the offspring to develop, the test containers were kept in the test environment for another period of 4 weeks. After this period the number of offspring per test container hatched from the cocoons was counted by hand selection.
The test was carried out at 20°C ± 2°C and a controlled light/dark cycle of 16 h:8 h with a light intensity of 400 lux to 800 lux.
7.5 Results
7.5.1 P25 - first experiment
(Raw data, chapter 21.2.1)
Zeta potential of the stock dispersion (with deionised water) before application on feed and soil was -18 mV.
Zeta potential

Reproduction test with earthworms – TiO2
54
Effect concentrations
Effects
All earthworms survived. No effect on biomass increase was detected. Stimulated reproduc-tion was observed. For the following test variants, statistically significant differences com-pared to the control were observed:
Spiking of feed, application of dry powder: 100 and 200 mg/kg
Spiking of soil, application of dry powder: 50 and 200 mg/kg
Spiking of feed, dispersion application: 20 mg/kg
Spiking of soil, dispersion application: 10 and 20 mg/kg
The effect values are summarised in Table 21.
Table 21: P25 – Test with earthworms (1st test): NOEC values.
Application via powder on feed
Application via powder on soil
Application via dispersion on feed
Application via dispersion on soil
Mortality NOEC [mg/kg] ≥200 ≥200 ≥20 ≥20
Biomass NOEC [mg/kg] ≥200 ≥200 n.d. 1 n.d. 1
Reproduction NOEC [mg/kg] 50 < 50 10 <10
1 n.d. = not determinable due to inconsistent concentration-effect curves (only two concentrations available)
Physical/pathological symptoms and changes in behaviour No physical/pathological symptoms or changes in behaviour were observed. All specimens gave the impression of healthy condition.
Weight change The results of weight change are presented in Table 22. No effect on biomass increase was detected. For raw data of the biomass see chapter 21.2.1.

Reproduction test with earthworms – TiO2
55
Table 22: P25 – Test with earthworms (1st test): Mean weight at test start and weight change at test end Concentrations given as nominal values
Application via powder on feed [mg/kg]
Application via powder on soil [mg/kg]
Application via dispersion on feed [mg/kg]
Application via dispersion on soil [mg/kg]
Control 50 100 200 50 100 200 10 20 10 20 Mean weight at test start [g]
3.29 3.36 3.17 3.29 3.37 3.49 3.45 3.23 3.21 3.25 3.33
Standard deviation 0.24 0.25 0.26 0.27 0.43 0.13 0.14 0.09 0.16 0.12 0.25
CV 7.3 7.6 8.2 8.2 12.7 3.7 4.0 2.7 4.9 3.7 7.5
Mean weight change (increase) [%]
66.5 63.8 71.0 63.5 73.9 56.8 58.7 56.0* 64.0 58.3* 71.6
Standard deviation 7.0 12.5 8.3 6.7 19.2 7.7 4.7 3.2 5.5 4.6 14.0
CV 10.5 19.5 11.7 10.5 26.0 13.5 8.0 5.8 8.6 7.9 19.6
* Significant when compared with control: * p > 0.05
Mortality No mortality was observed.
Reproduction The results for reproduction are presented as mean values (Table 23). For single values of the replicates see chapter 21.2.1.
The test with powder-spiked soil showed concentration-dependant reproduction stimulation. The highest and lowest powder-spiked soil concentrations resulted in statistically significant differences in comparison to the control. Maximum reproduction stimulation was 49% (200 mg/kg), followed by 41% (100 mg/kg) and 39% (50 mg/kg).
The experiments with powder-spiked feed gave results comparable to the experiments with powder-spiked soil. Concentration-dependant stimulation of reproduction was observed in a range comparable to the experiments with powder-spiked soil.
The results from both soil tests with application via dispersion were comparable with regard to reproduction. We observed a significant difference (P < 0.05) of 54% (10 mg/kg) and 51% (20 mg/kg) compared to the control. The stimulation of reproduction was in a range compa-rable to the experiments with soil where the powder-spiked concentration was 10fold higher.
Experiments with aqueous dispersions added to feed gave results comparable to soil spiked with aqueous dispersions. No concentration-response relationships were observed.

Reproduction test with earthworms – TiO2
56
Table 23: P25 – Test with earthworms (1st test): juveniles at test end. Mean values and coefficient of variance (CV)
Application via powder on feed [mg/kg]
Application via powder on soil [mg/kg]
Application via dispersion on feed [mg/kg]
Application via dispersion on soil [mg/kg]
Control 50 100 200 50 100 200 10 20 10 20 Juveniles 212.3 280.0 308.8 332.5 294.5 298.8 315.00 279.5 278.8 325.5 320.5
Standard deviation 45.8 84.4 67.5 70.6 43.9 73.9 42.4 51.7 12.1 73.9 14.2
CV 21.6 30.1 21.9 21.2 14.9 24.7 13.4 18.5 4.3 22.7 4.4
Inhibition [%] --- -31.9 1 -45.51 -56.7 1 -38.8 1 -40.8 1 -48.4 1 -31.7 1 -31.3 1 -53.3 1 -51.0 1
Statistical signifi-cance
* 2 * 2 * 2 ** 2 * 2 * 2 * 2
1 negative values indicate stimulation 2 statistical difference (* 0.05 ≥ P ≥ 0.01; ** 0.01 ≥ P ≥ 0.001)
7.5.2 P25 - second experiment
(Raw data, chapter 21.2.2)
Zeta potential of the stock dispersion (with deionised water) before application on feed and soil was -18 mV.
Zeta potential
Effect concentrations
Effects
No mortality and no concentration-effect relationships for biomass increase and reproduction activity was observed. The NOEC and LOEC values are listed in Table 24.
Table 24: P25 – Test with earthworms (2nd test): NOEC values.
NOEC [mg(kg] LOEC [mg(kg] Mortality ≥1000 >1000 Biomass ≥1000 >1000 Reproduction ≥1000 >1000
Physical/pathological symptoms and changes in behaviour No physical/pathological symptoms or changes in behaviour were observed. All specimens gave the impression of healthy condition.
Weight change The results of weight change are presented in Table 25. For raw data of the biomass see chapter 21.2.2. No effect on biomass increase was detected.

Reproduction test with earthworms – TiO2
57
Table 25: P25 – Test with earthworms (2nd test): mean weight at test start and weight change at test end Concentrations given as nominal values
Control 50 mg/kg 100 mg/kg 200 mg/kg 500 mg/kg 1000 mg/kg Mean weight at test start [g]
3.81 3.62 3.66 3.58 3.54 3.63
Standard deviation 0.30 0.10 0.11 0.11 0.08 0.23
CV 8.0 2.8 3.1 3.2 2.2 6.4
Mean weight change (increase) [%]
41.5 40.8 54.8 * 44.2 47.8 54.0
Standard deviation 7.5 4.2 7.3 7.5 8.6 11.1
CV 18.1 10.2 13.4 17.0 18.1 20.6
Significant when compared with control: * 0.05 ≥ P ≥ 0.01; ** 0.01 ≥ P ≥ 0.001
Mortality No mortality was observed.
Reproduction The results for reproduction are presented as mean values (Table 26). For single values of the replicates see chapter 21.2.2.
In contrast to the first test, no stimulation of reproduction was observed in the second test with P25 (Table 5). The main difference between the two tests was the timing: The first test began in January, the second in May. In the repeated test, a mean of 340 juveniles was counted in the control (standard deviation: 39 earthworms, corresponding to 11%). A slight reduction in offspring was detected for soil contents of 200 mg/kg (15% reduction) and 500 mg/kg (26%). Differences compared to the control, however, were not statistically significant; with a soil content of 1000 mg P25/kg the number of offspring was almost identical to the control.

Reproduction test with earthworms – TiO2
58
Table 26: P25 – Test with earthworms (2nd test): juveniles at test end. Mean values and coefficient of variance (CV)
Control 50 mg/kg 100 mg/kg 200 mg/kg 500 mg/kg 1000 mg/kg Juveniles 340.4 341.0 342.8 290.3 253.0 319.3
Standard deviation 38.8 32.5 28.2 24.3 61.8 42.5
CV 11.4 9.5 8.2 8.4 24.4 13.3
Inhibition [%] 0 -0.1 -0.7 14.7 25.7 7.1
Statistical significance 2 - - - - * -
1 negative values indicate stimulation 2 statistical difference (* 0.05 ≥ P ≥ 0.01; ** 0.01 ≥ P ≥ 0.001)
7.5.3 P25 - third experiment
(Raw data, chapter 21.2.3)
Effect concentrations
Effects
No concentration-dependant mortality was observed. In one vessel with concentrations of 500 and 1000 mg/kg only 9 worms were detected at day 28. No effect on biomass was de-tected whereas reproduction was stimulated. Statistically significant differences in reproduc-tion were observed for test concentrations in the range of 50 – 1000 mg/kg. The NOEC and LOEC values are listed in Table 27.
Table 27: P25 – Test with earthworms (3rd test): NOEC-values
NOEC [mg(kg] LOEC [mg(kg] Mortality ≥1000 >1000 Biomass ≥1000 >1000 Reproduction <50 ≤50
Physical/pathological symptoms and changes in behaviour No physical/pathological symptoms or changes in behaviour were observed. All specimens gave the impression of healthy condition.
Weight change The results of weight change are presented in Table 28. For raw data of the biomass see 21.2.3. For 200 mg/kg a significant difference in biomass increase compared to the control was observed. As there was no concentration-dependant effect, the statistical difference was not considered to be caused by the test substance.

Reproduction test with earthworms – TiO2
59
Table 28: P25 – Test with earthworms (3rd test): mean weight at test start and weight change at test end. Concentrations given as nominal values
Control 50 mg/kg 100 mg/kg 200 mg/kg 500 mg/kg 750 mg/kg 1000 mg/kg
Mean weight at test start [g]
3.70 3.678 3.57 3.46 3.59 3.58 3.43
Standard deviation 0.26 0.16 0.20 0.09 0.22 0.12 0.18
CV 6.9 4.4 5.5 2.6 6.1 3.3 5.3
Mean weight change (increase) [%]
42.5 45.9 51.5 61.3 ** 49.6 51.6 54.0
Standard deviation 9.3 5.9 10.9 4.9 9.4 5.4 10.3
CV 22.0 12.8 21.2 8.0 18.9 10.4 19.0
Significant when compared with control: * 0.05 ≥ P ≥ 0.01; ** 0.01 ≥ P ≥ 0.001
Mortality No concentration-dependant mortality was observed. In one vessel with concentrations of 500 and 1000 mg/kg only 9 worms were detected at day 28. An influence on the number of offspring is not obvious. The standard deviations between the numbers of animals counted in the four replicates with the above concentrations are comparable to the other test concentra-tions.
Reproduction The results obtained for reproduction are presented as mean values (Table 29). The single values of the replicates are presented in chapter 21.2.3.
Comparable to the first test with P25 a concentration-dependant stimulation of reproduction was observed. The effect, however, was less pronounced. The test was performed exactly one year after the first test.
Table 29: P25 – Test with earthworms (3rd test): juveniles at test end. Mean values and coefficient of variance (CV)
Control 50 mg/kg 100 mg/kg 200 mg/kg 500 mg/kg 750 mg/kg 1000 mg/kg Juveniles 219.6 239.0 251.5 265.3 238.3 279.3 286.3
Standard deviation 33.3 22.3 15.5 31.3 11.5 27.0 21.3
CV 15.2 9.3 6.1 11.8 4.8 9.7 7.4
Inhibition [%] 0 -8,8 -14,5 -20,8 -8,5 -27,1 -30.3
Statistical significance 2 - * ** ** * ** **
1 negative values indicate stimulation 2 statistical difference (* 0.05 ≥ P ≥ 0.01; ** 0.01 ≥ P ≥ 0.001)

Reproduction test with earthworms – TiO2
60
7.5.4 NM-101 – first experiment
(Raw data, chapter 21.2.4)
Zeta potential of the stock dispersion (with deionised water) before application on feed and soil was -18 mV.
Zeta potential
Effect concentrations
Effects:
No mortality was detected. Statistically significant increased weight change was detected for variants with spiked soil via powder and via dispersion as well as for spiked feed with disper-sion. Regarding the individual spiking variants, the increased values showed a concentration-effect relationship with a higher weight increase at higher test concentrations. Stimulation in reproduction increased with increasing test concentrations in all spiking variants. However, only the highest test concentration (200 mg/kg) of the test variant with spiked soil showed a statistically significant increase in the number of offspring. A compilation of the various NOEC values is shown in Table 30.
Table 30: NM-101 – Test with earthworms (1st test): NOEC values.
Application via powder on feed
Application via powder on soil
Application via dispersion on feed
Application via dispersion on soil
Mortality NOEC [mg(kg] ≥200 ≥200 ≥20 ≥20
Biomass NOEC [mg(kg] ≥200 <50 10 <10
Reproduction NOEC [mg(kg] ≥200 100 ≥20 ≥20
Physical/pathological symptoms and changes in behaviour No physical/pathological symptoms or changes in behaviour were observed. All specimens gave the impression of healthy condition.
Weight change The results of weight change are presented in Table 31. For raw data of the biomass see chapter21.2.4. Statistically significant increased weight change was detected for variants with spiked soil via powder and via dispersion as well as for spiked feed with dispersion.
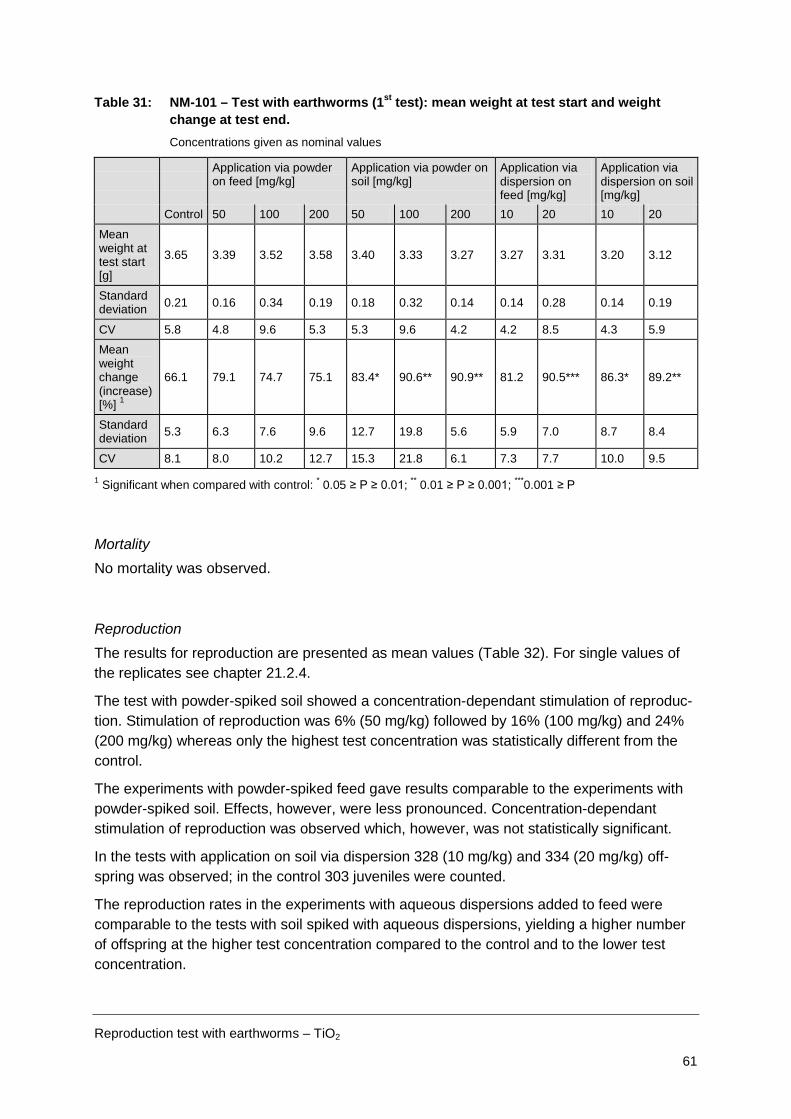
Reproduction test with earthworms – TiO2
61
Table 31: NM-101 – Test with earthworms (1st test): mean weight at test start and weight change at test end. Concentrations given as nominal values
Application via powder on feed [mg/kg]
Application via powder on soil [mg/kg]
Application via dispersion on feed [mg/kg]
Application via dispersion on soil [mg/kg]
Control 50 100 200 50 100 200 10 20 10 20
Mean weight at test start [g]
3.65 3.39 3.52 3.58 3.40 3.33 3.27 3.27 3.31 3.20 3.12
Standard deviation 0.21 0.16 0.34 0.19 0.18 0.32 0.14 0.14 0.28 0.14 0.19
CV 5.8 4.8 9.6 5.3 5.3 9.6 4.2 4.2 8.5 4.3 5.9
Mean weight change (increase) [%] 1
66.1 79.1 74.7 75.1 83.4* 90.6** 90.9** 81.2 90.5*** 86.3* 89.2**
Standard deviation 5.3 6.3 7.6 9.6 12.7 19.8 5.6 5.9 7.0 8.7 8.4
CV 8.1 8.0 10.2 12.7 15.3 21.8 6.1 7.3 7.7 10.0 9.5
1 Significant when compared with control: * 0.05 ≥ P ≥ 0.01; ** 0.01 ≥ P ≥ 0.001; ***0.001 ≥ P
Mortality No mortality was observed.
Reproduction The results for reproduction are presented as mean values (Table 32). For single values of the replicates see chapter 21.2.4.
The test with powder-spiked soil showed a concentration-dependant stimulation of reproduc-tion. Stimulation of reproduction was 6% (50 mg/kg) followed by 16% (100 mg/kg) and 24% (200 mg/kg) whereas only the highest test concentration was statistically different from the control.
The experiments with powder-spiked feed gave results comparable to the experiments with powder-spiked soil. Effects, however, were less pronounced. Concentration-dependant stimulation of reproduction was observed which, however, was not statistically significant.
In the tests with application on soil via dispersion 328 (10 mg/kg) and 334 (20 mg/kg) off-spring was observed; in the control 303 juveniles were counted.
The reproduction rates in the experiments with aqueous dispersions added to feed were comparable to the tests with soil spiked with aqueous dispersions, yielding a higher number of offspring at the higher test concentration compared to the control and to the lower test concentration.

Reproduction test with earthworms – TiO2
62
Table 32: NM-101 – Test with earthworms (1st test): juveniles at test end. Mean values and coefficient of variance (CV)
Application via powder on feed [mg/kg]
Application via powder on soil [mg/kg]
Application via dispersion on feed [mg/kg]
Application via dispersion on soil [mg/kg]
Control 50 100 200 50 100 200 10 20 10 20
Juveniles 302.8 296.8 319.8 336.75 321.5 352.5 374.8 327.8 333.8 307.8 337.8
Standard deviation 24.9 49.8 10.2 28.0 20.4 39.2 41.4 17.2 19.3 45.5 48.6
CV 8.2 16.8 3.2 8.3 6.3 11.1 11.0 5.2 5.8 14.8 14.4
Inhibition [%] --- 2.0 -5.6 1 -11.2 1 -6.2 1 -16.4 1 -23.8 1 -8.3 1 -10.2 1 -1.7 1 -11.6 1
Statistical signifi-cance
- - - - - * 2 - - - -
1 negative values indicate stimulation 2 statistical difference (* 0.05 ≥ P ≥ 0.01; ** 0.01 ≥ P ≥ 0.001)
7.5.5 NM 101 - second experiment
(Raw data, chapter 21.2.5)
Effect concentrations
Effects
No mortality was detected. Weight change increased mainly with increasing concentrations of NM 101; but only in the highest test concentration (400 mg/kg) the difference was statisti-cally significant. Concerning reproduction, no concentration-effect curves were obtained. The reproduction values obtained in the treated samples were not statistically different from the control. The LOEC for reproduction was above the highest test concentration (> 400mg/kg); the NOEC for reproduction was equal or above the highest test concentration (≥ 400mg/kg). All NOEC values are listed in Table 33.
Table 33: NM-101 – Test with earthworms (2nd test): NOEC values.
NOEC [mg/kg] LOEC [mg/kg] Mortality ≥400 >400 Biomass 200 400 Reproduction ≥400 >400
Physical/pathological symptoms and changes in behaviour No physical/pathological symptoms or changes in behaviour were obtained. All specimens gave the impression of healthy condition.

Reproduction test with earthworms – TiO2
63
Weight change The results of weight change are presented in Table 34. The raw data on biomass are pre-sented in chapter 21.2.5. Only for the highest test concentration (400 mg/kg) a statistically significant difference in biomass increase was detected compared to the control.
Table 34: NM-101 – Test with earthworms (2nd test): mean weight at test start and weight change at test end. Concentrations given as nominal values.
Control 50 mg/kg 100 mg/kg 200 mg/kg 400 mg/kg Mean weight at test start [g] 3.65 3.56 3.57 3.60 3.44
Standard devia-tion 0.22 0.28 0.22 0.24 0.15
CV 6.1 8.0 6.1 6.7 4.5
Mean weight change (in-crease) [%]
55.1 63.6 66.9 60.4 71.0 *
Standard devia-tion 7.2 3.1 11.7 4.7 8.9
CV 13.0 4.9 17.4 7.8 12.5
* Significant when compared with control: p ≥ 0.05
Mortality No mortality was observed.
Reproduction The results of reproduction are presented as mean values (Table 35). For single values of the replicates see chapter21.2.5.
No negative impact of NM 101 was observed in this test. In contrast to the first test no statis-tical difference was detected.
Table 35: NM-101 – Test with earthworms (2nd test): juveniles at test end. Mean values and coefficient of variance (CV)
Control 50 mg/kg 100 mg/kg 200 mg/kg 400 mg/kg Juveniles 223.3 212.5 209.8 212.8 234.0
Standard deviation 15.1 22.3 15.5 46.8 20.3
CV 6.7 10.5 7.4 22.0 8.7
Inhibition [%] 0 4.8 6.0 4.7 -4.8
Statistical significance 2 - - - - -
1 negative values indicate stimulation 2 “-“ = no statistical difference

Reproduction test with earthworms – TiO2
64
7.5.6 NM -103 - first test
(Raw data, chapter 21.2.6)
Zeta potential of the stock dispersion (with deionised water) before application on feed and soil was -18 mV.
Zeta potential
Effect concentrations
Effects
No mortality occurred and no concentration-effect curves were obtained for biomass increase and number of offspring. The reproduction values obtained in the treated samples were not statistically different from the control. The LOEC for reproduction and weight change were above the highest test concentration (> 200mg/kg); the NOEC for reproduction and weight change were equal or above the highest test concentration (≥ 200mg/kg). The NOEC values are presented in Table 36.
Table 36: NM-103 – Test with earthworms (1st test): NOEC-values.
Application via powder on feed
Application via powder on soil
Application via dispersion on feed
Application via dispersion on soil
Mortality NOEC [mg(kg] ≥200 ≥200 ≥20 ≥20
Biomass NOEC [mg(kg] ≥200 ≥200 ≥20 ≥20
Reproduction NOEC [mg(kg] ≥200 ≥200 ≥20 ≥20
Physical/pathological symptoms and changes in behaviour No physical/pathological symptoms or changes in behaviour were obtained. All specimens gave the impression of healthy condition.
Weight change The results for weight change are presented in Table 37. For raw data of the biomass see chapter 21.2.6. The weight change increases with increasing test concentrations (exception: application via dispersion on feed). However, no statistically significant difference was ob-served.

Reproduction test with earthworms – TiO2
65
Table 37: NM-103 – Test with earthworms (1st test): mean weight at test start and weight change at test end.
Application via powder on feed [mg/kg]
Application via powder on soil [mg/kg]
Application via dispersion on feed [mg/kg]
Application via dispersion on soil [mg/kg]
Con-trol
50 100 200 50 100 200 10 20 10 20
Mean weight at test start [g]
3.86 3.73 3.89 3.75 3.86 3.83 3.78 3.56 3.80 3.78 3.46
Standard deviation 0.22 0.17 0.23 0.21 0.22 0.27 0.38 0.19 0.30 0.24 0.19
CV 5.6 4.5 5.8 5.6 5.6 7.2 10.0 5.3 7.9 6.4 5.4
Mean weight change (increase) [%]
44.2 38.6 44.7 51.7 43.7 51.7 56.1 53.0 50.6 52.0 60.5
Standard deviation 7.6 14.6 3.3 6.7 3.6 5.4 10.6 10.8 9.4 4.5 10.9
CV 17.3 37.7 7.3 13.0 8.3 10.4 19.0 20.4 18.6 8.7 18.1
Mortality In one vessel (replicate 3, application of powder on soil, 100 mg/kg) one worm died. Apart from that, no mortality was observed.
Reproduction The results of reproduction are presented as mean values (Table 38). For single values of the replicates see chapter 21.2.6.
The number of offspring was comparable to the controls for all application forms and treat-ments. No statistical differences were observed.

Reproduction test with earthworms – TiO2
66
Table 38: NM-103 – Test with earthworms (1st test): juveniles at test end. Mean values and coefficient of variance (CV)
Application via powder on feed [mg/kg]
Application via powder on soil [mg/kg]
Application via dispersion on feed [mg/kg]
Application via dispersion on soil [mg/kg]
Control 50 100 200 50 100 200 10 20 10 20
Juveniles 365.1 332.3 345.3 365.0 337.5 371.8 342.8 341.5 325.5 340.5 365.1
Standard deviation 42.7 65.8 17.6 42.2 20.2 57.1 34.0 51.3 49.3 31.0 42.7
CV 11.7 19.8 5.1 11.5 6.0 15.3 9.9 15.0 15.1 9.1 11.7
Inhibition [%] --- 9.0 5.4 0.0 7.6 -1.8 1 6.1 6.5 10.9 6.7 7.6
Statisti-cal sig-nificance 2
- - - - - - - - - -
1 negative values indicate stimulation 2 “-“ = no statistical difference
7.5.7 NM 103 - second experiment
(Raw data, chapter 21.2.7)
Effect concentrations
Effects
No concentration-effect curves were obtained. Therefore, no EC values were calculated. The reproduction values obtained in the treated samples were not statistically different from the control. The LOEC values for reproduction and weight change were above the highest test concentration (> 400mg/kg); the NOEC values for reproduction and weight change were equal or above the highest test concentration (≥ 400mg/kg). The NOEC and LOEC values are listed in Table 39.
Table 39: NM-103 – Test with earthworms (2nd test): NOEC-values.
NOEC [mg(kg] LOEC [mg(kg] Mortality ≥400 >400 Biomass ≥400 >400 Reproduction ≥400 >400
Physical/pathological symptoms and changes in behaviour No physical / pathological symptoms or changes in behaviour were obtained. All specimens gave the impression of healthy condition.

Reproduction test with earthworms – TiO2
67
Weight change The results of weight change are presented in Table 40. For raw data of the biomass see chapter 21.2.7. No effect on biomass increase was detected.
Table 40: NM-103 – Test with earthworms (2nd test): mean weight at test start and weight change at test end. Concentrations given as nominal values
Control 50 mg/kg 100 mg/kg 200 mg/kg 400 mg/kg Mean weight at test start [g] 3.65 3.67 3.47 3.45 3.61
Standard devia-tion 0.22 0.33 0.27 0.13 0.22
CV 6.1 9.0 7.9 3.8 6.0
Mean weight change (in-crease) [%]
55.1 55.5 66.7 * 65.8 65.7
Standard devia-tion 7.2 13.3 7.5 13.7 9.7
CV 13.0 23.9 11.3 20.9 14.8 *Significant when compared with control: p ≥ 0.05
Mortality No mortality was observed.
Reproduction The results of reproduction are presented as mean values (Table 41). For single values of the replicates see chapter 21.2.7.
No negative impact of NM 103 was observed in this test.
Table 41: NM-103 – Test with earthworms (2nd test): juveniles at test end. Mean values and coefficient of variance (CV)
Control 50 mg/kg 100 mg/kg 200 mg/kg 400 mg/kg Juveniles 223.3 240.3 251.8 232.8 236.8
Standard deviation 15.1 30.6 42.1 39.7 37.6
CV 6.7 12.7 16.7 17.1 15.9
Inhibition [%] --- -7.6 -12.8 -4.3 -6.0
Statistical significance 2 - - - - -
1 negative values indicate stimulation 2 “-“ = no statistical difference

Reproduction test with earthworms – TiO2
68
7.5.8 Considerations concerning the reproduction behaviour of earthworms in the presence of TiO2 nanoparticles
Results from the control indicate that there is a circannual rhythm in the number of juveniles when the earthworms are incubated in natural soil. Figure 7 presents the number of juveniles in natural soil (RefeSol 01-A) obtained in control vessels (eight replicates). In winter the number of offspring (about 200) was lower than in summer (about 350 juveniles). The differ-ence between the minimum and maximum values is about 75%. For P25 such a difference was not observed. The number of juveniles in the presence of a concentration TiO2 nanopar-ticles of 200 mg/kg is presented in Figure 8. The difference between the maximum and minimum value is only 19%. For NM-103, in contrast, a circannual rhythm comparable to the control was observed resulting in stimulation in winter. Comparing the experiments per-formed in summer and winter, the difference between the maximum and minimum number of juveniles was about 60% (concentration of 200 mg/kg) for this material.
There is no clear effect-behaviour of NM-101. In the first experiment performed in winter 2010 a statistically significant stimulatory effect was observed for the highest test concentra-tion (200 mg/kg), whereas a statistically significant stimulation was not detected in the sec-ond experiment performed in winter 2011. However, in 2011 the stimulatory effect was less pronounced (200 mg/kg: 48% in 2010; 21% in 2011) for P25 as well. Therefore, the missing effect for NM-101 in 2011 may result from a generally smaller effect.
There is an indication that the observed effect in natural soil is material-specific: The coated material (NM-103) showed a circannual rhythm comparable to the control, whereas a behav-iour differing from the control was observed for the uncoated materials (NM-101 and P25). This may be explained by the fact that the coating prevents the direct contact of TiO2 nanoparticles with the organism, whereas the earthworms are in direct contact with TiO2 nanoparticles in the form of NM-101 and P25.
0
100
200
300
400
Janu
ary 20
10
Februa
ry 20
10
April 2
010
May 20
10
June
2010
Septem
ber 2
010
Janu
ary 20
11
Janu
ary 20
11
Februa
ry 20
11
Juve
nile
s pe
r ves
sel
Control
0
100
200
300
400
Jan2010
May2010
Jan2011
Juve
nile
s pe
r ves
sel
Figure 7: E. fetida - Number of juveniles in natural soil (RefeSol 01-A) during the year.
Figure 8: E. fetida - Number of juveniles in natural soil spiked with P25 (200 mg/kg) (RefeSol 01-A) during the year.
Circannual biological rhythms have been demonstrated for vertebrates and invertebrates, but the mechanisms generating them are still unclear (Nisimura and Numata, 2002). Rozen
Reproduction test with earthworms – TiO2
69
(2003, 2006) collected earthworms of the species Dendrobaena octaedra in the field and cultured them in the laboratory under constant conditions. Even under constant conditions the reproduction rate of the laboratory-cultured worms was highest in spring and summer, and lowest in winter, indicating the existence of an internal reproduction regulation. It was shown that neurosecretory hormones regulate cyclical functions in earthworms, such as re-production or secondary sex characteristics (Laverack, 1963 in Rozen, 2006). However, there is no information on whether these hormones are responsible for the circannual bio-logical rhythm and whether TiO2 nanoparticles potentially affects these hormones.
We assume that besides the metabolism of the earthworms substances occurring in the soil are involved in the biological rhythm of reproduction as observed in the control vessels. Soil collected in winter which was used for tests performed in summer resulted in a low reproduc-tion rate in the controls and a stimulatory effect in the presence of P25 (17% stimulation in the presence of 200 mg/kg, 27% stimulation in the presence of 500 mg/kg). A test performed at the same time with freshly collected soil resulted in no stimulation (detailed data of both tests not shown). Furthermore, we observed that the circannual rhythm is less pronounced when the tests are performed in artificial soil (14 tests performed within a period of 4 years with tests starting nearly every month).
7.5.9 Concentration of Ti in earthworms
(Raw data, chapter 21.2.8)
In some of the tests the Ti concentration in earthworms was determined.
The results are compiled in the following tables (Table 42 - Table 45) and figures (Figure 9- Figure 12). In chapter 21.2.8 the results are shown in more detail. There are strong indica-tions that Ti concentrations in the earthworms increase with increasing test concentrations. However, there seems to be a difference depending on whether the contamination is highly concentrated in food or distributed in soil. Contaminated food seems to result in higher con-centrations in the earthworms showing an increase already at concentrations of 100 or 200 mg/kg, whereas for contaminated soil an increase is obvious only for a concentration of 1000 mg/kg. Obvious differences between the three nanoparticles were not observed. As only two replicates were carried out, no calculation was performed concerning the statistical differ-ence. In none of the test designs the concentration in the earthworms exceeded the concen-tration in the test vessels. For P25-spiked soil the Ti concentration in the surrounding me-dium was calculated as 600 mg/kg (TiO2 nanoparticles: 1000 mg/kg) and compared to the control. In the worms 88.0 µg/g (= 88.0 mg/kg) was measured. The difference between the Ti concentration in the earthworms exposed to contaminated medium and the earthworms ex-posed to the control soil (55.2 µg/g) was 33 µ/g (33 mg/kg), which is far below the concentra-tion in the test medium (600 mg/kg). Therefore, it was concluded that accumulation in the worm tissue did not occur and that the measured Ti was still in the gut, possibly attached to remaining soil/food particles.

Reproduction test with earthworms – TiO2
70
Table 42: P25 - Ti concentration in earthworms (1st test).
Sample Mean Ti in dry weight ± SD [µg/g] Control 58.4 ± 9.8 TiO2 - 10 mg/kg; Ti – 6.0 mg/kg: spiked soil 54.2 ± 4.7 TiO2 - 10 mg/kg; Ti – 6.0 mg/kg: spiked food 58.6 ± 4.3 TiO2 - 20 mg/kg; Ti – 12 mg/kg: spiked soil 77.4 ± 2.9 TiO2 - 20 mg/kg; Ti – 12 mg/kg: spiked food 64.6 ± 4.1 TiO2 - 50 mg/kg; Ti – 30 mg/kg: spiked soil 76.4 ± 19.9 TiO2 - 50 mg/kg; Ti – 30 mg/kg: spiked food 75.3 ± 6.1 TiO2 - 100 mg/kg; Ti – 60 mg/kg: spiked soil 76.3 ± 12.7 TiO2 - 100 mg/kg; Ti – 60 mg/kg: spiked food 101 ± 7.0 TiO2 - 200 mg/kg; Ti – 120 mg/kg: spiked soil 72.4 ± 29.0 TiO2 - 200 mg/kg; Ti – 120 mg/kg: spiked food 121 ± 31.0
Table 43: P25 - Ti concentration in earthworms (2nd test).
Sample Mean Ti in dry weight ± SD [µg/g] Control 55.2 ± 2.2 TiO2 - 50 mg/kg; Ti – 30 mg/kg: spiked soil 49.2 ± 4.3 TiO2 - 100 mg/kg; Ti – 60 mg/kg: spiked soil 43.7 ± 1.5 TiO2 - 200 mg/kg; Ti – 120 mg/kg: spiked soil 50.1 ± 11.9 TiO2 - 500 mg/kg; Ti – 300 mg/kg: spiked soil 61.0 ± 1.4 TiO2 - 1000 mg/kg; Ti – 600 mg/kg: spiked soil 88.0 ± 21.7
Table 44: NM-101 - Ti concentration in earthworms (1st test).
Sample Mean Ti in dry weight ± SD [µg/g] Control 54.1 TiO2 - 10 mg/kg; Ti – 6.0 mg/kg: spiked soil 49.7 ± 5.0 TiO2 - 10 mg/kg; Ti – 6.0 mg/kg: spiked food 28.9 ± 4.9 TiO2 - 20 mg/kg; Ti – 12 mg/kg: spiked soil 45.1 ± 3.7 TiO2 - 20 mg/kg; Ti – 12 mg/kg: spiked food 38.1 ± 4.1 TiO2 - 50 mg/kg; Ti – 30 mg/kg: spiked soil 59.4 ± 10.4 TiO2 - 50 mg/kg; Ti – 30 mg/kg: spiked food 70.8 ± 7.5 TiO2 - 100 mg/kg; Ti – 60 mg/kg: spiked soil 66.2 ± 1.7 TiO2 - 100 mg/kg; Ti – 60 mg/kg: spiked food 53.1 ± 12.3 TiO2 - 200 mg/kg; Ti – 120 mg/kg: spiked soil 107 ± 40 TiO2 - 200 mg/kg; Ti – 120 mg/kg: spiked food 52.7 ± 8.6

Reproduction test with earthworms – TiO2
71
Table 45: NM-103: Ti concentration in earthworms (1st test).
Sample Mean Ti in dry weight ± SD [µg/g] TiO2 - 10 mg/kg; Ti – 6.0 mg/kg: spiked soil 22.6 ± 2.2 TiO2 - 10 mg/kg; Ti – 6.0 mg/kg: spiked food 55.3 ± 21.1 TiO2 - 20 mg/kg; Ti – 12 mg/kg: spiked soil 33.8 ± 6.3 TiO2 - 20 mg/kg; Ti – 12 mg/kg: spiked food 30.1 ± 1.5 TiO2 - 50 mg/kg; Ti – 30 mg/kg: spiked soil 43.6 ± 9.6 TiO2 - 50 mg/kg; Ti – 30 mg/kg: spiked food 30.8 ± 1.5 TiO2 - 100 mg/kg; Ti – 60 mg/kg: spiked soil 23.6 ± 3.0 TiO2 - 100 mg/kg; Ti – 60 mg/kg: spiked food 32.9 ± 32.9 TiO2 - 200 mg/kg; Ti – 120 mg/kg: spiked soil 56.1 ± 56.1 TiO2 - 200 mg/kg; Ti – 120 mg/kg: spiked food 31.1 ± 31.1 TiO2 - 10 mg/kg; Ti – 6.0 mg/kg: spiked soil 62.9 ± 62.9
Figure 9: P25 – 1st test with earthworms: Ti concentration in earthworms (purged gut).
Figure 10: P25 – 2nd test with earthworms: Ti concentration in earthworms (purged gut).
Figure 11: NM-101 – 1st test with earth-worms: Ti concentration in earthworms (purged gut).
Figure 12: NM-103 – 1st test with earth-worms: Ti concentration in earthworms (purged gut).
7.6 Validity
The three earthworm reproduction tests fulfil the validity criteria of the guideline:
P25

Reproduction test with earthworms – TiO2
72
• With 212, 340 and 220 individuals the rate of reproduction in the control was ≥ 30 ju-veniles per test vessel.
• With 21.6%, 11.4% and 22.0% the CV of reproduction in the control did not exceed 30%.
• With 0% in all tests the percent mortality of the adults observed in the controls over the initial 4 weeks was ≤ 10%.
Both earthworm reproduction tests fulfil the validity criteria of the guideline:
NM 101
• With 303 and 223 individuals the rate of reproduction in the control was ≥ 30 juveniles per test vessel.
• With 8.2% and 6.7% the CV of reproduction in the control did not exceed 30%.
• With 0% in both tests the percent mortality of the adults observed in the controls over the initial 4 weeks was ≤ 10%.
Both earthworm reproduction tests fulfil the validity criteria of the guideline:
NM 103
• With 372 and 223 individuals the rate of reproduction in the control was ≥ 30 juveniles per test vessel.
• With 11.1% and 6.7% the CV of reproduction in the control did not exceed 30%.
• With 0% in both tests the percent mortality of the adults observed in the controls over the initial 4 weeks was ≤ 10%.
7.7 Data with the reference substance
As reference substance carbendazim was tested over the period February 11, 2010 - April, 8, 2010.
The following values were calculated for reproduction [mg/kg]; values in brackets indicate the confidence interval:
EC10: 1.147 (1.118 -1.172)
EC20: 1.309 (1.289 -1.328)
EC50: 1.688 (1.670 -1.709)
LOEC: 1.500
NOEC: 0.750
All validity criteria mentioned in the guideline were fulfilled. According to the guideline signifi-cant effects should be observed between 1 and 5 mg/kg. This criterion was fulfilled.

Reproduction test with earthworms – TiO2
73
7.8 Conclusion
The control showed a reduced number of offspring in winter compared to experiments car-ried out in summer. This reduction of the number of juveniles was not observed for the un-coated nanoparticles P25 and NM-101. Therefore, stimulation was observed for P25 and NM-101 when the tests were performed in natural soil and in winter time. There are indica-tions that the stimulation observed for P25 and NM-101 (uncoated nanoparticles) is due to the disturbance of the biological clock.
For the coated NM-103 no difference compared to the control was observed.
7.9 Executive summary
TiO2 nanoparticles (NM-101, NM-103 and P25) were tested in the OECD earthworm repro-duction test. The particles were applied as powder and as aqueous dispersion in soil and in feed. The test substrate was a natural sandy soil. The experiments were performed several times.
The following test concentrations were investigated:
• Application via powder on feed: 50, 100, 200 mg/kg soil, dry matter
• Application via powder on soil: 50, 100, 200 mg/kg soil, dry matter
• Application via dispersion on feed: 10, 20 mg/kg soil, dry matter
• Application via dispersion on soil: 10, 20 mg/kg soil, dry matter.
In several tests performed only with powder-spiked soil a higher number of concentrations were investigated. The following approaches were studied:
• Application via powder on soil: 50, 100, 200, 400 mg/kg soil, dry matter (NM-101, NM-103)
• Application via powder on soil: 50, 100, 200, 500, 750, 1000 mg/kg soil, dry matter (P25).
The tested TiO2 nanoparticles did not cause a reduction in the number of offspring. A stimu-latory effect was observed, at least for the uncoated material P25, when the test was per-formed in winter. For the coated material NM-103 a stimulatory effect cannot be observed. The stimulatory effect is less pronounced for the second uncoated material (NM-101).
There are indications that the stimulation is due to a disturbance of the biological clock.
In some of the tests the Ti concentration was determined in the earthworms. There are strong indications that Ti concentrations in the worms increase with increasing test concen-trations. However, there seems to be a difference depending on whether the contamination is highly concentrated in food or distributed in soil. Contaminated food seems to cause higher concentrations in the earthworms than contaminated soil, showing an increase at 100 or 200 mg/kg, whereas for contaminated soil an increase is obvious only for a concentration of 1000 mg/kg. Differences between the three nanoparticles were not observed. In none of the test designs the concentration in the worms exceeded the soil concentration in the test substrate. Therefore, it is concluded that the nanoparticles did not accumulate in the tissue of the worms but remained in the gut, possibly adsorbed to remaining soil/food particles.

Reproduction test with earthworms – TiO2
74

Reproduction test with earthworms – Ag
75
8 Reproduction Test with Earthworms (OECD TG 222) – Ag
8.1 Test principle
Adult earthworms of the species Eisenia fetida were placed in a defined soil containing dif-ferent concentrations of the test item. The test item was applied once and the effects on bio-mass and mortality of the adult worms are determined after 28 days. After 56 days effects on reproduction was determined by counting the offspring. In addition to the test guideline, ac-cumulation in the adults was tested after the exposure period of 28 days.
According to the guideline, chemical effects are assessed based on the reproduction, al-though additionally biomass has to be measured. In the result sections below, biomass data and number of juveniles are presented, but ECx and NOEC values are only calculated for reproduction (number of juveniles).
8.2 Materials and methods
8.2.1 Test guideline
The test was performed according to:
OECD Guidelines for the Testing of Chemicals Test No. 222: Earthworm Reproduction Test (Eisenia fetida, Eisenia andrei) (2004)
8.2.2 GLP
The test was performed following the principles of GLP (OECD, 1998). In deviation to GLP no archiving of the raw data is performed and the quality assurance unit was not involved with respect to the inspection of the test, of the raw data and the report. All laboratory equip-ment (e.g. balances, thermometers, pH-meters) was controlled and documented according to GLP.
8.2.3 Test material
• NM-300K
• NM-300KDIS (Dispersant)
The test substances were stored in the dark at room temperature.
8.2.4 Analytical monitoring
The concentration of silver ions in the test soil was measured by incubation of DGTs in the vessels. Two DGTs per test vessel were incubated for two days. The incubation started on day 0, day 26 and day 54.

Reproduction test with earthworms – Ag
76
The total content of Ag was determined in the soil and in the earthworms. Earthworms were incubated for 24 h on wet filter paper to purge their gut and then frozen at -20°C until analy-sis.
8.2.5 Test item – preparation protocol
NM-300K consists of silver nanoparticles stabilised in a dispersant. The stock dispersion contained 10% of silver. In contrast to TiO2 nanoparticles we therefore tested only two differ-ent modes of application:
Spiking of soil NM-300K was sprayed on 152.5 g soil (dry matter; 5% of WHCmax), and thoroughly mixed. The amount of NM-300K was weighed since exact pipetting was not possible due to the con-sistency of the material.
Uncontaminated test soil (about 20 – 30% of WHCmax) was spread on a plate, the carrier soil with the NM-300K was distributed on the test soil, and all was mixed carefully. The contami-nated soil was adjusted to a water-holding capacity of 55% of WHCmax.
15 mg/kg: 0.430 g NM-300K in 3551.13 g soil (55% WHCmax)
30 mg/kg: 0.861 g NM-300K in 3551.13 g soil (55% WHCmax)
60 mg/kg: 1.721 g NM-300K in 3551.13 g soil (55% WHCmax)
120 mg/kg: 3.443 g NM-300K in 3551.13 g soil (55% WHCmax)
200 mg/kg: 5.738 g NM-300K in 3551.13 g soil (55% WHCmax)
Additionally, a dispersant control was tested. The control achieved the amount of dispersant of the highest test concentration.
Spiking of feed 40 g of finely ground cow manure was mixed with stock dispersion of NM-300K to achieve the desired test content. Additionally, deionised water was added to achieve a final volume of 120 mL.
15 mg/kg: 0.480 mL NM-300K
30 mg/kg: 0.960 mL NM-300K
60 mg/kg: 1.922 mL NM-300K
120 mg/kg: 3.843 mL NM-300K
200 mg/kg: 6.405 mL NM-300K
Moreover, a dispersant control was tested which achieved the amount of dispersant of the highest test concentration.

Reproduction test with earthworms – Ag
77
8.2.6 Test species
The test organisms were synchronised adult earthworms of the species Eisenia fetida andrei (Annelida, Oligochaeta), which were 2 - 12 months old, with a clitellum, and a wet mass be-tween 250 mg and 600 mg.
Origin of the worms: Regenwurmfarm Tacke, Klosterdiek 61, 46325 Borken. Specimens used in the test were bred in the laboratory of the Fraunhofer IME.
Breeding conditions: Worms were bred in 1:1 mixtures of cow manure and sphagnum peat (dry mass basis) at 20°C ± 2°C.
Pre-treatment: The worms were conditioned in the artificial soil for 7 days before use. The same feed as used in the test (see 9.3) was given in a sufficient amount.
8.3 Study design
8.3.1 Study type
Laboratory test
8.3.2 Test duration type and exposure period
The test was long-term with an exposure period of 56 days.
• NM-300K: 9 June – 4 August 2010
8.3.3 Test substrate
The soil used in the test was a natural sandy soil (certified RefeSol 01-A, batch IME-01: sand 71%, silt: 24%, clay: 5%, Org C: 0.93%, pH 5.7, clay: 5%). The soil was sieved to ≤ 2 mm. The soil was not sterilised and had been stored outdoors in high-grade stainless steel basins with drainage and ground contact at the test facility.
8.3.4 Total exposure period
The exposure period lasted 56 days.
8.3.5 Post exposure period
There was no post exposure period.
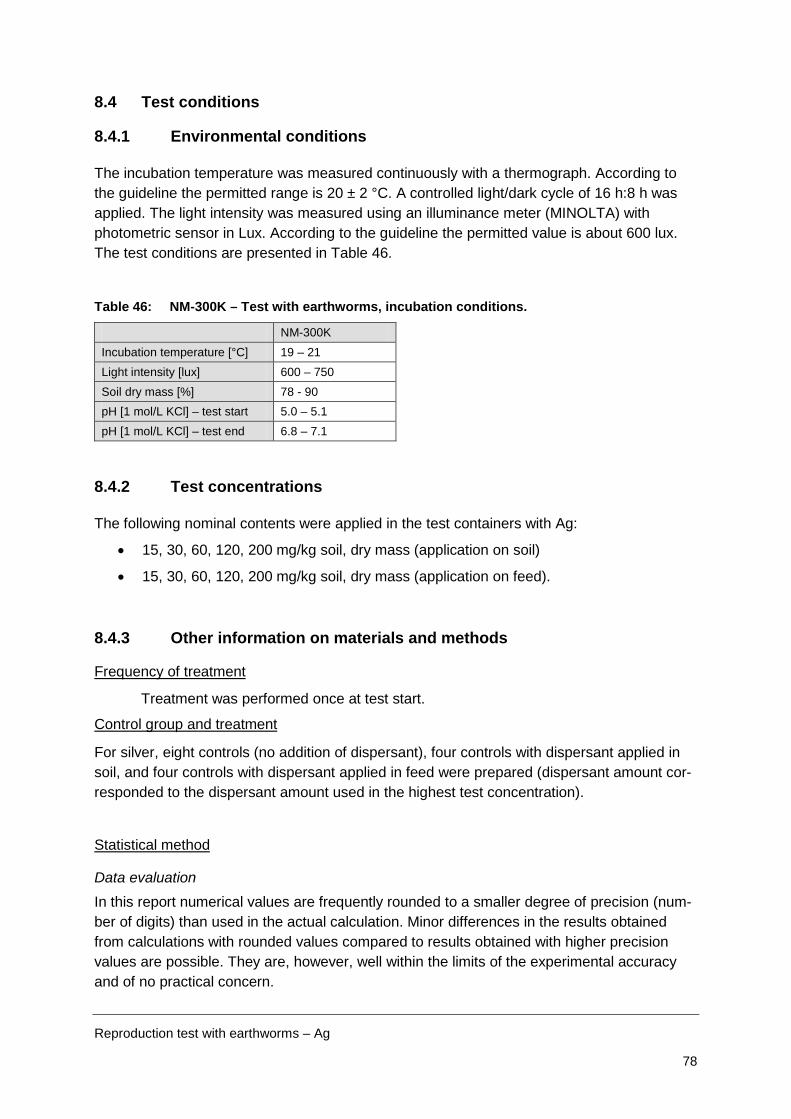
Reproduction test with earthworms – Ag
78
8.4 Test conditions
8.4.1 Environmental conditions
The incubation temperature was measured continuously with a thermograph. According to the guideline the permitted range is 20 ± 2 °C. A controlled light/dark cycle of 16 h:8 h was applied. The light intensity was measured using an illuminance meter (MINOLTA) with photometric sensor in Lux. According to the guideline the permitted value is about 600 lux. The test conditions are presented in Table 46.
Table 46: NM-300K – Test with earthworms, incubation conditions.
NM-300K Incubation temperature [°C] 19 – 21 Light intensity [lux] 600 – 750 Soil dry mass [%] 78 - 90 pH [1 mol/L KCl] – test start 5.0 – 5.1 pH [1 mol/L KCl] – test end 6.8 – 7.1
8.4.2 Test concentrations
The following nominal contents were applied in the test containers with Ag:
• 15, 30, 60, 120, 200 mg/kg soil, dry mass (application on soil)
• 15, 30, 60, 120, 200 mg/kg soil, dry mass (application on feed).
8.4.3 Other information on materials and methods
Treatment was performed once at test start.
Frequency of treatment
For silver, eight controls (no addition of dispersant), four controls with dispersant applied in soil, and four controls with dispersant applied in feed were prepared (dispersant amount cor-responded to the dispersant amount used in the highest test concentration).
Control group and treatment
Data evaluation
Statistical method
In this report numerical values are frequently rounded to a smaller degree of precision (num-ber of digits) than used in the actual calculation. Minor differences in the results obtained from calculations with rounded values compared to results obtained with higher precision values are possible. They are, however, well within the limits of the experimental accuracy and of no practical concern.

Reproduction test with earthworms – Ag
79
Statistical calculations For each concentration the percent mortality, the percent loss/increase in biomass of the adults, and the number of offspring produced in the test was determined.
Mortality, biomass and number of offspring were compared by a suitable test for multiple comparisons with a control after testing variance homogeneity. All statistical tests were per-formed with the computer software ToxRat Professional version 2.10.4.1 (ToxRat® Solutions GmbH).
Air-dried, finely ground cow manure was used as feed.
Feed
All tests were performed in polypropylene containers (Bellaplast GmbH, Alf). Adjusted to 55% of the maximum water-holding capacity, 640 g soil (dm) was filled into containers to a depth of about 5 cm. The containers were covered with transparent plastic lids to prevent worms from escaping and to guarantee access of light. The lids had several small holes to permit gaseous exchange between the medium and the atmosphere.
Test container
Soil and food were spiked. Test soil was added to the test containers and 10 g of air dried, finely ground cow manure per test container was spread onto the soil surface and moistened with water. The next day (start of the test) batches of ten conditioned worms were weighed and placed into each container. Spiking of soil and food, respectively, filling of the test ves-sels and addition of the earthworms could not be performed at the same day due to high number of test variables and test concentrations.
Test procedure
Once a week the worms were fed according to their feed consumption. Feeding behaviour and the quantity of feed applied over the test period was recorded for each test container. The water content of the soil substrate in the test containers was maintained during the test period by weighing the test containers periodically and replenishing lost water, if necessary.
The adult worms were kept in the substrate over a period of 4 weeks. At the end of this pe-riod, the adults were removed. For each container the total number and mass of living adult worms was recorded.
To allow the offspring to develop, the test containers were kept in the test environment for another period of 4 weeks. After this period the number of offspring per test container hatched from the cocoons was counted by hand.
The test was carried out at 20°C ± 2°C and a controlled light/dark cycle of 16 h:8 h with a light intensity of 400 - 800 lux.

Reproduction test with earthworms – Ag
80
8.5 Results
(Raw data, chapter 21.3)
8.5.1 NM-300K
Zeta potential in dispersion with deionised water (20 g/L; 100 mg/L) was -12 mV.
Zeta potential
Total Ag-concentrations and the Ag+-concentration (ion concentration of Ag) in soil were de-termined. Detailed results for the ion concentration are presented in chapter
Test item concentrations:
21.3.1.
Total Ag-concentration Two representative concentrations of total Ag in soil were determined. The results are pre-sented in Table 47.
Recovery was 90% (15 mg/kg and 120 mg/kg). Therefore, the use of nominal concentrations for reporting the effects was considered acceptable.
Concentration of Ag+ The results are presented in Table 48. In four concentrations (15 mg/kg, 60 mg/kg, 120 mg/kg, 200 mg/kg) the Ag+ ions were determined via DGT. There was a small increase from the concentration at day 0 to the concentration at day 56. The concentrations of ions were in the range of 0.2 - 2.3 * 10-4% of the nominal concentrations.

Reproduction test with earthworms – Ag
81
Table 47: NM-300K – Test with earthworms: Ag concentrations in spiked soil. Five replicate samples, each measured twice
Application / sample Weighed for diges-tion [g]
Measured Ag conc [µg/L]
Dilution factor
Calculated Ag conc. [mg/kg]
Nominal Ag conc. [mg/kg]
Recovery [%]
Mean recovery ± SD
Control
1 3.13 3.24 - < LOD - -
- 2 3.13 3.14 - < LOD - - 3 3.08 3.28 - < LOD - - 4 3.16 2.44 - < LOD - - 5 3.16 3.04 - < LOD - -
Application via soil: 120 mg/kg
1-1 3.10 307 10 99.03 120 82.5
89.6 ± 4.4
1-2 3.11 332 10 106.78 120 89.0 2-1 3.13 321 10 102.54 120 85.4 2-2 3.10 359 10 115.77 120 96.5 3-1 3.06 321 10 105.01 120 87.5 3-2 3.17 356 10 112.27 120 93.6 4-1 3.13 349 10 111.57 120 93.0 4-2 3.12 338 10 108.63 120 90.5 5-1 3.12 319 10 102.35 120 85.3 5-2 3.11 347 10 111.63 120 93.0
Application via soil: 15 mg/kg
1-1 3.07 93.6 5 15.25 15 102
90.0 ± 14.5
1-2 3.12 74.0 5 11.86 15 79.0 2-1 3.11 69.5 5 11.16 15 74.4 2-2 3.04 85.1 5 14.01 15 93.4 3-1 3.04 84.5 5 13.89 15 92.6 3-2 3.12 77.1 5 12.35 15 82.3 4-1 3.05 91.9 5 15.06 15 100 4-2 3.05 78.8 5 12.91 15 86.1 5-1 3.13 110 5 17.56 15 117 5-2 2.63 54.2 5 10.29 15 68.6
1 LOD = limit of detection (11.5 µg/L)

Reproduction test with earthworms – Ag
82
Table 48: NM-300K – Test with earthworms: concentration of Ag ions measured by DGTs in soil.
Control 15 mg/kg 60 mg/kg 120 mg/kg 200 mg/kg Day 0 Replicate 1 [µg/kg] 1 0.141 * 10-3 21.5 * 10-3 19.6 * 10-3 29.70 * 10-3 33.6 * 10-3 Replicate 2 [µg/kg] 1 0.287 * 10-3 36.1 * 10-3 22.3 * 10-3 technical defect 34.3 * 10-3 Mean value [µg/kg] 1 0.214 * 10-3 28.8 * 10-3 21.0 * 10-3 29.7 * 10-3 34.0 * 10-3 Percentage 2 [%] --- 1.92 * 10-4 0.35 * 10-4 0.25 * 10-4 0.17 * 10-4 Day 28 Replicate 1 [µg/kg] 1 1,16 * 10-3 41.9 * 10-3 46.1 * 10-3 56.7 * 10-3 76.0 * 10-3 Replicate 2 [µg/kg] 1 0.696 * 10-3 25.9 * 10-3 37.6 * 10-3 81.9 * 10-3 64.1 * 10-3 Mean value [µg/kg] 1 0.928 * 10-3 33.9 * 10-3 41.9 * 10-3 69.3 * 10-3 70.1 * 10-3 Percentage 2 [%] --- 2.26 * 10-4 0.70 * 10-4 0.58 * 10-4 0.35 * 10-4 Day 56 Replicate 1 [µg/kg] 1 1.23 * 10-3 35.9 * 10-3 75.5 * 10-3 162 * 10-3 86.2 * 10-3 Replicate 2 [µg/kg] 1 1.16 * 10-3 95.0 * 10-3 51.3 * 10-3 140 * 10-3 91.3 * 10-3 Mean value [µg/kg] 1 1.20 * 10-3 65.5 * 10-3 63.4 * 10-3 151 * 10-3 88.8 * 10-3 Percentage 2 [%] --- 4.37 * 10-4 1.06 * 10-4 1.26 * 10-4 0.44 * 10-4
1 Ag+ was measured in pore water as [µg/L]; for calculation in dry matter [µg/kg] a dry matter content of 88.9% was applied for the calculations at day 0 (mean value of the dry matter content of all test concentrations at day 0); at day 56 a dry matter con-tent of 79.5% was applied (mean value of the dry matter content of all test concentrations at day 56); for day 28 a dry matter content of 84.2% was used (mean value of the measured dry matter contents at day 0 and 56) 2 Recovery with respect to nominal concentration
Effect concentrations:
Effects:
No mortality was observed. Weight change of the adults varied, with both increases and de-creases, compared to the control. For reproduction, dose-response curves were obtained (Figure 16, Figure 14) and ECx, NOEC and LOEC-values were calculated (Table 49). Two controls were tested: one control without addition of the stabiliser, and a control with dispers-ant (concentration of dispersant corresponded to the amount applied in the highest test con-centration of NM 330-K). This concentration resulted in about 20% inhibition of reproduction. Inhibition of the dispersant was independent of the application via feed or via soil. Both con-trol values were considered for the calculation of ECx, NOEC and LOEC. Considering the confidence intervals, both concentration-effect curves overlap. In a second experiment the effect of the dispersant was investigated again. In this experiment no difference between control and dispersant control was observed (number of juveniles: control 347 ± 27; dispers-ant control 329 ± 4). Therefore it is recommended to use ECx, NOEC and LOEC values re-ferring to the control for the assessment of NM-300K.

Reproduction test with earthworms – Ag
83
Table 49: NM-300K – Test with earthworms: summary of effects on number of offspring [mg/kg].
Spiked feed, control: without further additions
Spiked feed, con-trol: dispersant control
Spiked soil, control: without further addi-tions
Spiked soil, control: dispersant control
EC50 1, 3 [mg/kg] 80.3 (58.5 - 113.4)
121.2 (85.3 - 183.8) 80.0 (33.6 - 413.3) 146.0 (85.8 - 741.4)
EC10 1, 3 [mg/kg] 14.6 (4.6 - 24.8) 39.4 (7.5 - 62.9) n.d. 2 24.2 (0.2 - 50.7)
LOEC 3, [mg/kg] ≤15.0 60.0 ≤15.0 30.0
NOEC 3 [mg/kg] <15.0 30.0 <15.0 15.0
LOEC 4 [µg/kg] ≤65.5 * 10-3 63.4 * 10-3 ≤65.5 * 10-3 --- 5
NOEC 4 [µg/kg] <65.5 * 10-3 --- 5 <65.5 * 10-3 65.5 * 10-3 1 values in brackets: confidence interval; 2 n.d. = not determined due to mathematical reasons or inappropriate data; 3 results refer to nominal values; 4 results refer to Ag ions measured at day 56; 5 ion concentration not measured in test vessels with 30 mg Ag/kg.
Physical/pathological symptoms and changes in behaviour At the beginning of the test a high tendency of the worms to escape from the soil was ob-served in the tests with Ag-contents ranging from 60 to 200 mg/kg dm. As the vessels were covered with lids, in some of the test vessels the earthworms were observed at the lids and at the walls of the vessels (200 mg/kg: 2 vessels; 120 mg/kg: 2 vessels; 60 mg/kg: 1 vessel). After two days, the earthworms had moved into the soil again. After 28 days, neither physical / pathological symptoms nor changes in behaviour were observed. All specimens gave the impression of healthy condition.
Weight change of the adults The results of weight change are presented in Figure 13, Figure 14 and Table 50. For raw data of the biomass see chapter 21.3.2. Due to feeding, the biomass of the worms increased in all test approaches during the incubation period. Compared to the control, the increases due to treatments were varied and ranged from a small change to large change in weight. Application in feed showed a concentration-effect relationship which did not occur for appli-cation in soil. The weight increase for application in soil exceeded the weight increase for the controls. Differences in weight between the three controls (control; control with dispersant on feed; control with dispersant on soil) during the incubation period were small. Therefore, the higher increase of the weight compared to the controls is assumed to be caused by the silver addition. The mode-of-action as well as the missing concentration-effect-relationship when soil was spiked cannot be explained so far.

Reproduction test with earthworms – Ag
84
Spiked feed, control: without further additions
Spiked feed, control: dispers-ant control
Figure 13: NM-300K – Test with earthworms: spiked feed, weight change - concentration-effect curve.

Reproduction test with earthworms – Ag
85
Spiked soil, control: without further additions
Spiked soil, control: dispersant control
Figure 14: NM-300K – Test with earthworms: spiked soil, weight change - concentration-effect curve.

Reproduction test with earthworms – Ag
86
Table 50: NM-300K – Test with earthworms: mean weight at test start and weight change at test end. Concentrations given as nominal values
Control
Control with dispers-ant on feed
Control with dis-persant on soil
Application on feed [mg/kg] Application on soil [mg/kg]
15 30 60 120 200 15 30 60 120 200
Mean weight at test start [g]
3.57 3.77 3.74 3.72 3.61 3.78 3.62 3.45 3.24 3.33 3.53 3.39 3.47
Standard deviation [g]
0.20 0.37 0.36 0.10 0.23 0.39 0.24 0.12 0.13 0.08 0.23 0.15 0.14
CV 5.5 9.8 9.7 2.7 6.3 10.5 6.7 3.5 3.9 2.3 6.5 4.3 4.0
Mean weight change [%]
40.1 42.0 35.8 51.6 *1 47.7 45.7 25.9 27.9
** 62.2 * 61.6 61.4 ** 66.9 ***
62.4 **
Standard deviation [%]
7.4 1.6 8.6 7.1 3.4 4.4 12.4 2.9 19.7 17.8 9.0 4.8 5.9
CV 18.5 3.9 24.0 13.7 7.0 9.6 48.0 10.3 31.7 28.9 14.6 7.1 9.4
1 Significant when compared with control (without dispersant): * 0.05 ≥ P ≥ 0.01; ** 0.01 ≥ P ≥ 0.001; ***0.001 ≥ P
Mortality: No mortality was observed.
Reproduction: The results for reproduction are presented as mean values (Table 52). For single values of the replicates see chapter 21.3.2. Independent of whether the soil or feed was spiked, the dispersant had a small impact on reproduction, i.e. there were fewer juveniles in the control with dispersant (e.g. for soil spiking: 268) than in the control (e.g. for soil spiking: 341), repre-senting a statistically significant 22% inhibition of reproduction. The small inhibitory effect was not reproducible. Therefore, it is concluded that the effect of the dispersant observed in this test reflects biological variability. Both control values were considered with respect to the effect of Ag-NPs and inhibition was calculated in comparison to both the control and the con-trol with dispersant.
We found a concentration-effect relationship and observed strong inhibition of earthworm reproduction (Figure 15, Figure 16, Table 49). For the experiment with spiked soil, in com-parison to the control, the inhibition of reproduction ranged from 26% at the lowest concen-tration to 72% at the highest concentration, yielding an EC50 of 80 mg/kg compared to the control and an EC50 of 146.0 mg/kg for the dispersant control. Soil spiking and feed spiking resulted in comparable effects and EC50 values.
The size of the worms in the different treatments differed considerably. In the control, the worms were much smaller than in the samples treated with 120 and 200 mg/kg. The juve-
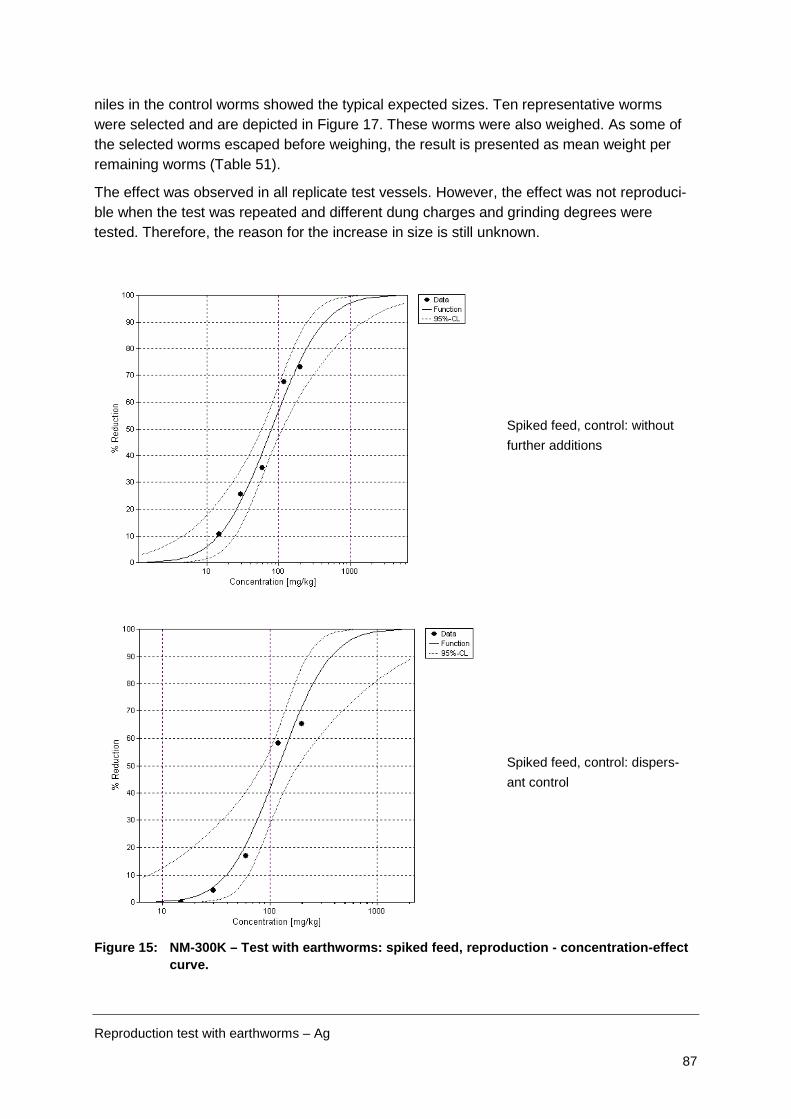
Reproduction test with earthworms – Ag
87
niles in the control worms showed the typical expected sizes. Ten representative worms were selected and are depicted in Figure 17. These worms were also weighed. As some of the selected worms escaped before weighing, the result is presented as mean weight per remaining worms (Table 51).
The effect was observed in all replicate test vessels. However, the effect was not reproduci-ble when the test was repeated and different dung charges and grinding degrees were tested. Therefore, the reason for the increase in size is still unknown.
Spiked feed, control: without further additions
Spiked feed, control: dispers-ant control
Figure 15: NM-300K – Test with earthworms: spiked feed, reproduction - concentration-effect curve.

Reproduction test with earthworms – Ag
88
Spiked soil, control: without further additions
Spiked soil, control: dispers-ant control
Figure 16: NM-300K – Test with earthworms: spiked soil, reproduction - concentration-effect curve.

Reproduction test with earthworms – Ag
89
Control 120 mg/kg soil applied via feed
200 mg/kg soil applied via feed
Control 120 mg/kg soil applied via soil
200 mg/kg soil applied via soil
Figure 17: NM-300K - Representative sizes of earthworms after 56 days. (Every photograph shows 10 worms; Ø of petri dishes: 100 mm; small black dots in petri dishes: gut content)
Table 51: NM-300K – Test with earthworms: mean weight of the offspring presented in Figure 17.
Content Calculated weight per worm [mg]
Control 11
120 mg / kg (soil) 69.3
200 mg / kg (soil) 53.7
120 mg / kg (feed) 108.6
200 mg / kg (feed) 72.0
Reproduction test with earthworms – Ag
90
Table 52: NM-300K – Test with earthworms: number of juveniles at test end. Mean values and coefficient of variance (CV)
Con-trol
Con-trol with disper-sant on feed
Con-trol with disper-sant on soil
Application on feed [mg/kg] Application on soil [mg/kg]
15 30 60 120 200 15 30 60 120 200
Juveniles 341.4 265.5 268.0 304.8 253.8 220.5 111.0 91.8 251.5 208.8 219.5 158.0 96.5
Standard deviation 26.1 11.5 45.5 27.4 26.4 18.1 50.8 8.5 30.8 46.4 30.2 18.1 26.1
CV 7.6 4.3 17.0 9.0 10.4 8.2 45.8 9.3 12.2 22.2 13.7 11.4 27.0
Inhibition to control [%]
--- 22 * 21 * 11 26 * 35 * 67 * 73 * 26 * 39 * 36 * 54 * 72 *
Inhibition to dis-persant control [%]
--- --- --- -15 4 17 58 * 65 * 6 22 17 41 * 64 *
* statistical difference: p > 0.05 (* 0.05 ≥ P ≥ 0.01; ** 0.01 ≥ P ≥ 0.001)
8.5.2 Concentrations of silver in earthworms
In some of the test approaches the Ag concentration in the earthworms was determined.
The results are compiled in Table 53 and Figure 18. Chapter 21.3.1 presents the results in more detail.
In the control worms, and in the worms treated with the dispersant, no silver was determined. In contrast, silver was detected in all treated worms. There was no obvious difference be-tween experiments with spiking of soil or spiking of food. A dependence on the concentration was not observed.
We observed a concentration-dependent effect on reproduction above the lowest test con-centrations (15 mg/kg), but although the lowest and highest test concentrations differed by a factor of 13, the silver concentrations in the earthworms were comparable. We therefore as-sume that a steady state of silver uptake is already achieved at 30 mg/kg dm. The concentra-tions in the worms were below the concentration in the test vessels. It is unclear whether the measured silver is located in the tissues or whether residues remain in the gut due to incom-plete purging. We also do not know whether the determined silver occurs in particle or ionic form. The comparable concentrations in earthworms exposed to soil concentrations greater than 30 mg/kg and the concentration-dependent inhibition of reproduction at concentrations of 30–200 mg/kg dm indicate that the silver content in the worms is not responsible for the observed effects. We assume that the fertility of adults is not affected but the development of cocoons and the juveniles in soil are Ag-sensitive life stages. Whether the cocoon or juvenile

Reproduction test with earthworms – Ag
91
worm life stage is more susceptible is still unknown. The number of cocoons is not an obliga-tory endpoint according to the guideline. Therefore, no special attention was placed on the remaining number of cocoons. Nevertheless, differences in the number of remaining cocoons at the various test concentrations were not obvious.
Table 53: NM-300K – Test with earthworms: Ag concentration in earthworms.
Sample Mean Ag in dry weight ± SD [µg/g] Control --- Vehicle soil --- Vehicle food --- 15 mg/kg; spiked soil 6.99 ± <0.01 15 mg/kg; spiked food 9.54 ± 0.50 30 mg/kg; spiked soil 10.5 ± 0.4 30 mg/kg; spiked food 10.6 ± 0.4 60 mg/kg; spiked soil 11.1 ± 0.2 60 mg/kg; spiked food 11.7 ± 0.9 120 mg/kg; spiked soil 11.3 ± 0.4 120 mg/kg; spiked food 11.3 ± 0.3 200 mg/kg; spiked soil 11.2 ± 0.1 200 mg/kg; spiked food 13.2 ± 0.2
Figure 18: NM-300K – Test with earthworms: Ag concentration in earthworms.
Reproduction test with earthworms – Ag
92
8.6 Validity
The earthworm reproduction test fulfils the validity criteria of the guideline:
NM-300K
• With 341 individuals the rate of reproduction in the control was ≥ 30 juveniles per test vessel.
• With 7.6% the CV of reproduction in the control does not exceed 30%.
• With 0% in both tests the percent mortality of the adults observed in the controls over the initial 4 weeks is ≤ 10%.
8.7 Data with the reference substance
As reference substance carbendazim was tested.
Test period: February 11, 2010 - April, 8, 2010
The following values were calculated for reproduction [mg/kg]; values in brackets indicate the confidence interval:
EC10: 1.147 (1.118 -1.172)
EC20: 1.309 (1.289 -1.328)
EC50: 1.688 (1.670 -1.709)
LOEC: 1.500
NOEC: 0.750
All validity criteria were fulfilled.
According to the guideline significant effects should be observed between 1 and 5 mg/kg. This criterion is fulfilled.
8.8 Conclusion
Silver nanoparticles (NM-300K) were tested in the earthworm reproduction test. The tested silver nanoparticles (NM-300K) caused a reduction of the reproduction rate.
Concerning reproduction, the ECx, NOEC and LOEC values presented in Table 54 were determined. The difference between application of the nanoparticles via feed and via soil seems to be negligible.
An obvious increase in weight of the juveniles was observed. However, the effect was not reproducible and comparable observations are not reported in the literature to the best of our knowledge.

Reproduction test with earthworms – Ag
93
8.9 Executive summary
Silver nanoparticles (NM-300K) and the dispersant in NM-300K (NM-300KDIS) were tested in the earthworm reproduction test. The particles were applied in soil and in feed. The test substrate was a natural sandy soil. The test concentrations were 15, 30, 60, 120, 200 mg/kg soil, dry matter.
No mortality was observed. For reproduction, dose-response curves were obtained. Two controls were considered: one control without addition of the dispersant, and a control with dispersant (concentration of dispersant corresponded to the amount applied in the highest test concentration of NM 330-K). This concentration resulted in about 20% inhibition of re-production. Inhibition of the dispersant was independent of the application via feed or via soil. Both control values were considered for the calculation of ECx, NOEC and LOEC (Table 54). Considering the confidence intervals, both concentration-effect curves overlap. In a second experiment the effect of the dispersant was investigated again. In this experiment no differ-ence between control and dispersant control was observed (number of juveniles: control 347 ± 27; dispersant control 329 ± 4). Therefore it is recommended to use ECx, NOEC and LOEC values referring to the control for the assessment of NM-300K.
Differences resulting from the exposure of the earthworms via feed and via soil seem to be negligible.
An increase in size and weight of the juveniles was observed. However, this observation was not reproducible.
The presented results are based on nominal concentrations. Based on the concentrations determined with DGTs in soil the effect values are lower by a factor about 10-4. This illus-trates that the basis of the calculation has to be clearly fixed for regulatory purposes.
Table 54: NM-300K - earthworm reproduction: summary of the effect values.
Spiked feed, control: without further additions
Spiked feed, control: dispersant control
Spiked soil, control: without further additions
Spiked soil, control: dispersant control
EC50 [mg/kg] 1 80.3 (58.5 - 113.4) 121.2 (85.3 - 183.8) 80.0 (33.6 - 413.3) 146.0 (85.8 - 741.4)
EC10 [mg/kg] 1 14.6 (4.6 - 24.8) 39.4 (7.5 - 62.9) n.d. 2 24.2 (0.2 - 50.7)
LOEC [mg/kg] ≤15.0 60.0 ≤15.0 30.0
NOEC [mg/kg] <15.0 30.0 <15.0 15.0 1 values in brackets: confidence interval; 2 n.d. = confidence interval not determined due to mathematical reasons or inappropriate data
Additionally, the Ag concentration in the earthworms was determined. In the control worms and in the worms treated with the dispersant (concentration of dispersant corresponded to the amount applied in the highest test concentration of NM 330-K) no silver was determined. In contrast, silver was detected in all worms incubated in soil containing NM-300K and in the worms fed with spiked food. There was no obvious difference between the two experiments (spiking of soil or spiking of food). A dependence on the concentration was not observed. It is therefore assumed that a steady state of silver uptake is achieved at the lowest test concen-tration. Concentration-dependent effects are observed above the lowest test concentration. Although

Reproduction test with earthworms – Ag
94
the applied test concentrations increased, the silver concentration in the worms remained the same. We assume that the fertility of adults is unaffected but that the development of co-coons and the juveniles in soil are sensitive life stages. We do not know yet whether which life stage (cocoons or juvenile worms) is the most susceptible.
In none of the test designs did the silver concentration in the worms exceed the concentra-tion in the test vessels. Therefore, it is concluded that silver did not accumulate in the tissue of the worms. It is unclear whether the measured silver was located in the tissue or whether residues remained in the gut due to incomplete purging. We also do not know whether the determined silver occurred in particle or ionic form.

Soil microorganisms: Nitrogen Transformation Test – TiO2 95
9 Microorganisms - Nitrogen Transformation Test (OECD TG 216)
9.1 Test principle
The effects of the test item on nitrogen transformation were determined in a natural soil. After mixing the test item into the soil, the soil was incubated in the dark at 20 ± 2°C for 28 days. Samples were taken at test start and after 28 days of incubation. The test item was applied once. To measure the nitrogen transformation the nitrate concentration in soil was deter-mined after the soil had been amended with powdered plant material as a natural nitrogen source.
9.2 Materials and methods
9.2.1 Test guideline
The test was performed according to:
OECD Guidelines for the Testing of Chemicals Test No. 216: "Soil Microorganisms: Nitrogen Transformation Test" (2000).
9.2.2 GLP
The test was performed following the principles of GLP (OECD, 1998). In deviation to GLP no archiving of the raw data was performed and the quality assurance unit was not involved with respect to the inspection of the test, of the raw data and of the report. All laboratory equipment (e.g. balances, thermometers, pH-meters) were calibrated and documented ac-cording to GLP.
9.2.3 Test material
• P25 - distributed by Evonik for the OECD Sponsorship Programme The properties should correspond to the properties of NM-105.
The nanoparticles were stored in the dark at room temperature until use.
9.2.4 Analytical monitoring
Due to the high natural concentration of TiO2 in the test soil no specific chemical analyses were performed in the soil.
The zeta potential was measured in the test dispersions using a Malvern Zetasizer Nano ZS. The particle size distribution in the dispersion was not determined. Doing so would give no information on the size distribution in soil. A measurement of the Zeta-potential or the particle size distribution in soil is not yet possible.

Soil microorganisms: Nitrogen Transformation Test – TiO2 96
9.2.5 Test item – preparation protocol
We tested two different modes of application: spiking via powder and via dispersion.
The nominal concentrations of the test item in the test containers were 9.3, 21, 45 and 100 mg P25/kg soil, dry mass (application via powder) and 9.3 and 21 mg/kg (application via dispersion). Three replicates per concentration were conducted.
For the first application the TiO2 powder was mixed directly into the soil, whereby air-dried test soil (1% of the total amount) was used as a carrier for the TiO2 powder. Amounts of TiO2 powder suitable to achieve the desired final soil content were mixed homogenously with the dry soil. Care was taken to avoid a modification of the TiO2 crystalline structure. Uncontami-nated test soil (between 20-30% of WHCmax) was spread on a plate, the carrier material with the TiO2 powder was distributed on the test soil, and all was mixed carefully. In the same way, 5 g/kg dm ground lucerne was mixed into the soil. For the test with contaminated soil the soil was adjusted to a water-holding capacity of 55% of (WHCmax).
Spiking of soil with TiO2 powder
Test concentrations were: 9.3, 21, 45 and 100 mg/kg soil dry matter (dm).
The second application trial was to spray a TiO2 dispersion (TiO2 nanoparticles in deion. wa-ter) that had been prepared with a magnetic flea (900 rpm; 1 min) and ultrasonication (3 min) in a bath sonicator. Test soil was dried to about 10% of WHCmax and spread on a plate. 5 g/kg dm of ground lucerne was mixed into the soil. Immediately after preparation TiO2 dis-persion was sprayed on the soil by means of a syringe coupled with a cannula and then mixed thoroughly. Finally, the test soil was adjusted to a water-holding capacity of 55% of WHCmax. A maximum concentration of about 200 mg/L application dispersion of TiO2 nanoparticles was considered as adequate for the tests. Higher concentrations would have sedimented rapidly preventing a homogenous distribution of the nanomaterial in the soil. Fur-thermore, it was assumed that higher concentrations in the application dispersion would re-sult in larger agglomerates. Based on the water content of the soil, no more than 212 mg/L application dispersion could be used. The suspension was continuously stirred to achieve homogeneity during spiking. Due to these limitations, only the soil contents of 9.3 and 21 mg/kg were tested.
Spiking of soil with aqueous TiO2 dispersion
The test concentrations were: dispersion with 88 and 212 mg/L deionised water; application of 193 ml test dispersion to 1.8 kg test soil (dm) corresponding to 9.3; and application of 179 ml test dispersion to 1.8 kg test soil (dm) corresponding to 21 mg/kg soil (dm).
9.2.6 Test organism
A sandy soil with the individual soil microflora was investigated.

Soil microorganisms: Nitrogen Transformation Test – TiO2 97
9.3 Study design
9.3.1 Total exposure period
The exposure period was 28 days:
June 17, 2010 - July 15, 2010
9.4 Test conditions
9.4.1 Environmental conditions
The incubation temperature was measured continuously with a thermograph. With 20 - 21°C the permitted range of 20 ± 2°C was kept. Incubation occurred in the dark. The soil dry mass was maintained during the whole test at 89.6% (controls), 89.6% (powder application: 9.3 mg/kg), 88.9% (powder application: 21 mg/kg), 89.7 % (powder application: 45 mg/kg), 89.2 % (powder application: 100 mg/kg), 89.4 % (dispersion application: 9.3 mg/kg) and 89.6% (dispersion application: 21 mg/kg).
Physicochemical data
9.4.2 Test soil
The test soil was a natural sandy soil (Certified RefeSol 01-A. batch IME-01: sand 71%, silt: 24%, clay: 5%, org C: 0.93%, pH 5.7, clay: 5%). Selected soil parameters are presented in Table 55. The soil was sieved to 2 mm. It was not sterilised and had been stored outdoors on the grounds of the test facility in high grade stainless steel basins with drainage, and ground contact.
For at least one year prior to soil sampling in the field, no plant protection products were ap-plied to the sampling site. No organic or mineral fertilisers were applied to the soil for six and three months, respectively, prior to soil sampling.
Dates of the soil handling for the test are presented in Table 56.

Soil microorganisms: Nitrogen Transformation Test – TiO2 98
Table 55: Test soil for microbial tests: soil parameters.
Soil name RefeSol 01-A Soil batch IME-01 Soil texture Loamy sand Clay [%] 5 Silt [%] 24 Sand [%] 71 WHC [g H2O/kg soil dry weight] 1 264 CECeff [mmol/kg] 2 37.9 pH 5.7 Total org. C [%] 0.93 Microbial biomass [mg C/kg dry mass soil], calculated from respiration activity 91 Microbial biomass [% of total org. C] 1.0 Total nitrogen [%] 0.09 NO3
- [mg/kg dry weight] 81.7 1 WHC = water holding capacity; 2 CECeff = effective cation exchange capacity
Table 56: Test soil for microbial tests: storage information.
Soil name RefeSol 01-A Soil batch IME-01 Date of field sampling 11.06.2010 Start of indoor storage at room temperature to reduce the water content and to allow sieving; the soil was distributed in a thin layer; surface drying was pre-vented by periodically turning the soil.
11.-13.09.2008
Date of sieving for the study 13.06.2010 Start of soil conditioning 1 13.06.2010 Date of application 17.06.2010
1 Soil conditioning was performed at room temperature in the dark.
9.4.3 Concentration levels
For the application via powder, the nominal contents in the test containers with TiO2 nanopar-ticles were 9.3, 21.0, 45.0, 100.0 mg/kg soil dry matter. For the application via dispersion, the nominal contents in the test containers with TiO2 nanoparticles were 9.3 and 21.0 mg/kg soil dry matter. The concentrations differed by a factor of 2.2. Three replicates per concentration were conducted.

Soil microorganisms: Nitrogen Transformation Test – TiO2 99
9.4.4 Other information on materials and methods
The treatments were applied once at test start.
Frequency of treatment
The control consisted of soil only without any nano-particle addition. Three replicates per control were conducted.
Control group and treatment
Data evaluation:
Statistical method
In this report numerical values were frequently rounded to a smaller degree of precision (number of digits) than used in the actual calculation. Minor differences in results obtained from calculations with rounded values in comparison to results obtained with higher precision values are possible. They are, however, well within the limits of the experimental accuracy and of no practical concern.
Statistical calculations: For each concentration, the quantity of nitrate was determined. According to the guidelines for non-agrochemicals, the quantities of nitrate found in the treated samples after 28 days were compared to those found in the controls. Furthermore, the percent deviation values for the test concentrations were calculated. Means were compared by means of the STUDENT-t test and the U-Test (Wilcoxon, Whitney and Mann) for significant differences between control and study groups. ECx,LOEC, and NOEC calculations were performed with the computer software ToxRat Professional version 2.10.4.1 (ToxRat® Solutions GmbH).
Sieved and spiked soil was amended with powdered plant material (lucerne-grass-green meal) at a plant/soil ratio of 5 g plant per kilogram of soil (dry mass). Three incubation con-tainers per treatment were filled with 658 g of spiked soil. A further three incubation contain-ers were filled with 658 g of control soil.
Test procedure
The test was carried out in the dark at 20 ± 2°C for 28 days. During the whole test the mois-ture content of the soil was maintained at 40 - 60% of WHCmax with a maximum of 5% out-side this range. The mass in the test vessels was measured weekly. Evaporated water was supplemented by adding deionised water.
Samples of each treated and control replicate were analysed for nitrate at the beginning (3 h after application, in the following designated as day 0) and at the end of the exposure period (28 days).
Nitrate was extracted from soil by shaking samples (20 g dry mass) with 0.1 M KCl solution at a ratio of 5 mL of KCl solution per gram dry weight for 60 minutes at 150 rpm. The mix-

Soil microorganisms: Nitrogen Transformation Test – TiO2 100
tures were filtered and the liquid phases analysed for nitrate photometrically (Spectroquant® NOVA 400). Analyses were performed immediately after preparing the extracts.
9.5 Results
9.5.1 Zeta potential
The zeta potential for P25 is presented in Table 57. A negative value of -18 mV was deter-mined in deionised water.
Table 57: P25 - N-transformation: zeta potential in the stock dispersion used for application via dispersion.
Sample Zeta potential [mV] 100 mg/L -18 mV
9.5.2 Nitrogen transformation
For the application via powder the following concentration-dependent effects were ob-served: concentration-dependent decreased nitrate values at day 0, increased nitrate values at day 28 and increased nitrogen transformation rates (difference of nitrate content between day 28 and day 0).
Effect concentrations:
The application via dispersions gave no clear effect. Differences to the control were small and statistically not significant. There was no obvious effect dependant on concentration.
In Table 58 the effect values are presented. A prerequisite for calculating ECx values is an inhibitory effect. Due to stimulation at day 28 an EC value could only be calculated at test start.
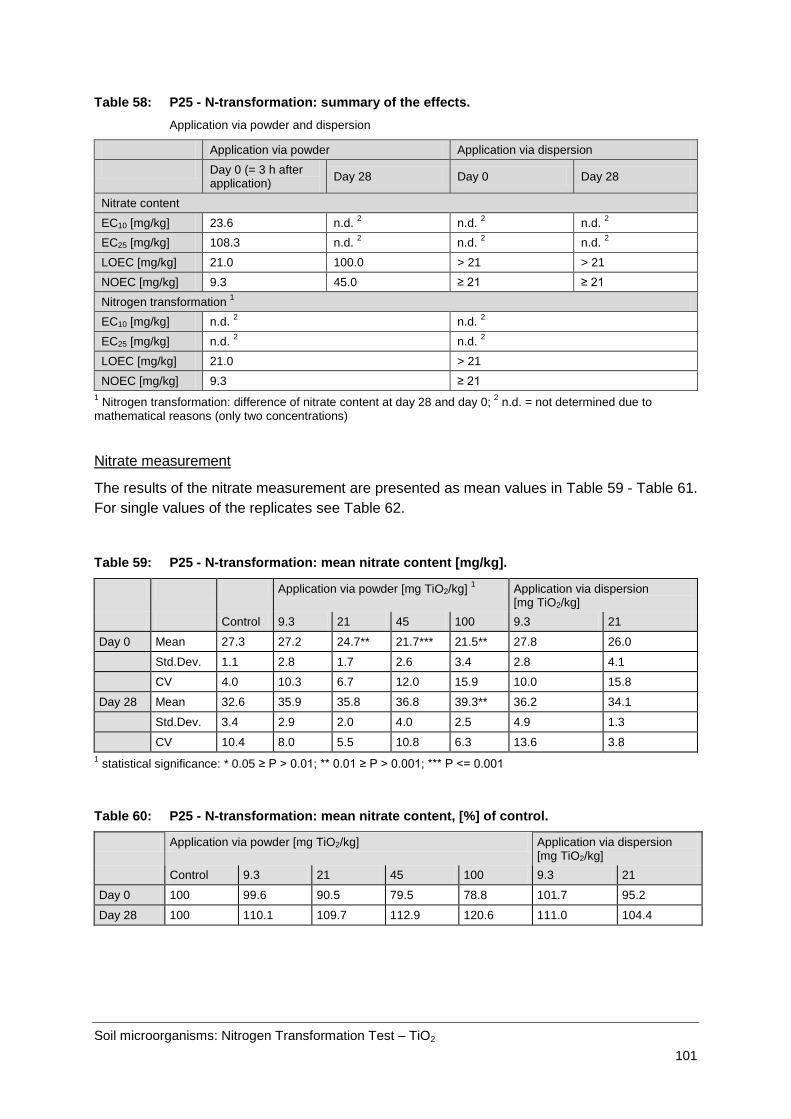
Soil microorganisms: Nitrogen Transformation Test – TiO2 101
Table 58: P25 - N-transformation: summary of the effects. Application via powder and dispersion
Application via powder Application via dispersion Day 0 (= 3 h after
application) Day 28 Day 0 Day 28
Nitrate content EC10 [mg/kg] 23.6 n.d. 2 n.d. 2 n.d. 2 EC25 [mg/kg] 108.3 n.d. 2 n.d. 2 n.d. 2 LOEC [mg/kg] 21.0 100.0 > 21 > 21 NOEC [mg/kg] 9.3 45.0 ≥ 21 ≥ 21 Nitrogen transformation 1 EC10 [mg/kg] n.d. 2 n.d. 2 EC25 [mg/kg] n.d. 2 n.d. 2 LOEC [mg/kg] 21.0 > 21 NOEC [mg/kg] 9.3 ≥ 21
1 Nitrogen transformation: difference of nitrate content at day 28 and day 0; 2 n.d. = not determined due to mathematical reasons (only two concentrations)
The results of the nitrate measurement are presented as mean values in
Nitrate measurement
Table 59 - Table 61. For single values of the replicates see Table 62.
Table 59: P25 - N-transformation: mean nitrate content [mg/kg].
Application via powder [mg TiO2/kg] 1 Application via dispersion [mg TiO2/kg]
Control 9.3 21 45 100 9.3 21
Day 0 Mean 27.3 27.2 24.7** 21.7*** 21.5** 27.8 26.0
Std.Dev. 1.1 2.8 1.7 2.6 3.4 2.8 4.1
CV 4.0 10.3 6.7 12.0 15.9 10.0 15.8
Day 28 Mean 32.6 35.9 35.8 36.8 39.3** 36.2 34.1
Std.Dev. 3.4 2.9 2.0 4.0 2.5 4.9 1.3
CV 10.4 8.0 5.5 10.8 6.3 13.6 3.8 1 statistical significance: * 0.05 ≥ P > 0.01; ** 0.01 ≥ P > 0.001; *** P <= 0.001
Table 60: P25 - N-transformation: mean nitrate content, [%] of control.
Application via powder [mg TiO2/kg] Application via dispersion [mg TiO2/kg]
Control 9.3 21 45 100 9.3 21
Day 0 100 99.6 90.5 79.5 78.8 101.7 95.2
Day 28 100 110.1 109.7 112.9 120.6 111.0 104.4

Soil microorganisms: Nitrogen Transformation Test – TiO2 102
Table 61: P25 - N-transformation: N-transformation rate [mg/(kg*28 d)].
Application via powder [mg TiO2/kg] Application via dispersion [mg TiO2/kg]
Control 9.3 21 45 100 9.3 21
Difference of 2 determinations (d28-d0)
2.3 7.3 11.3 11.3 18.3 6.9 8.8
6.7 9.0 12.5 14.2 11.9 7.3 11.5
7.1 12.5 9.5 19.8 23.3 11.1 3.9
Mean 5.4 9.6 11.1* 15.1* 17.8* 8.3 8.1
Std.Dev 2.7 2.7 1.5 4.3 5.7 2.3 3.9
Deviation from control [%] 77.8 105.5 179.6 229.6 53.7 50.0
* 0.05 ≥ P > 0.01; ** 0.01 ≥ P > 0.001; *** P <= 0.001
Table 62: P25 - N-transformation: content of nitrate [mg/kg dry mass soil]. Single values of the replicates
Date of sampling
Replicate Application via powder [mg TiO2/kg] Application via dispersion [mg TiO2/kg
Control 9.3 21 45 100 9.3 21
Test start 1.1 27.5 27.2 22.3 18.8 21.5 27.7 22.9
1.2 26.4 28.6 26.3 24.7 19.8 26.1 29.8
2.1 26.5 31.4 24.0 23.3 23.1 31.2 21.7
2.2 28.9 24.3 24.0 20.4 27.3 23.5 22.3
3.1 28.3 23.9 24.7 24.0 19.9 28.0 28.5
3.2 26.3 27.8 26.8 19.1 17.4 30.2 30.7
Day 28 1.1 26.2 35.4 36.5 33.5 37.4 31.3 36.7
1.2 32.0 35.0 34.7 32.5 40.5 36.3 33.6
2.1 33.3 35.9 35.9 37.2 38.0 33.7 33.5
2.2 35.4 37.7 37.0 34.9 36.1 35.6 33.5
3.1 35.3 31.4 38.0 39.9 41.9 45.6 33.4
3.2 33.4 40.0 32.4 42.8 41.9 34.7 33.6
At test start the nitrate content decreased with increasing soil contents of TiO2 nanoparticles. No clear difference between application forms was observed.
At day 28 the nitrate content increased with increasing soil contents of TiO2 nanoparticles.
The transformation rate calculated during the incubation time of 28 days showed an in-creased nitrogen transformation rate with increasing contents of TiO2 nanoparticles applied via powder. Application via dispersion did not cause an increased bioavailability of the nanomaterial compared to the application via dispersion. The transformation rates deter-mined after application via dispersion were slightly lower than the transformation rates after application via powder.

Soil microorganisms: Nitrogen Transformation Test – TiO2 103
9.6 Validity
A validity criterion has been formulated in the guideline for the testing of agrochemicals. The evaluation of the results with agrochemicals is based on relatively small differences (i.e. av-erage value ± 25%) between the carbon dioxide released or the oxygen consumed in the control and the treated soil samples so that large variations in the controls can lead to false results. Therefore, the variation between replicate control samples should be less than ± 15%.
For non-agrochemicals concentration-effect relationships are relevant. Therefore a variation of 15% is of less importance. In this test the validity criteria for agrochemicals are fulfilled as the. CV was 4.0% (day 0) and 10.4% (day 28).
9.7 Reference substance
The guideline does not demand the investigation of a reference substance. A reference sub-stance was not tested.
9.8 Conclusion
The effects of TiO2 nanoparticles on earthworms were tested by:
• application via powder in soil: 9.3, 21.0, 45.0 and 100.0 mg/kg soil
• application via dispersion in soil: 9.3 and 21.0 mg/kg soil.
The application via powder caused concentration-dependent effects, namely concentration-dependent decreased nitrate values at day 0 (sampling of the soil three hours after applica-tion), increased nitrate values at day 28 and increased nitrogen transformation rates (differ-ence of nitrate content between day 28 and day 0).
The application via dispersion gave no clear effect. The difference to the control was small and not statistically significant. It is assumed that an application via dispersion does not cause an increased bioavailability of TiO2 nanoparticles for the soil microflora.
9.9 Executive summary
TiO2 nanoparticles (P25) were tested in the nitrification assay (OECD TG No. 216). Soil was spiked with powder and with dispersion. As test substrate, a natural sandy soil was used. The following test concentrations were investigated:
• Application via powder in soil: 9.3, 21.0, 45.0, 100.0 mg/kg soil
• Application via dispersion in soil: 9.3, 21.0 mg/kg soil.
The nitrate content was determined photometrically at day 0 (sampling of the soil three hours after application) and at day 28.
The application via powder caused concentration-dependent effects, namely, decreased ni-trate values at day 0 (sampling of the soil three hours after application), increased nitrate

Soil microorganisms: Nitrogen Transformation Test – TiO2 104
values at day 28 and increased nitrogen transformation rates (difference in nitrate content between day 28 and day 0).
In Table 63 the NOEC and ECx values are summarised.
Table 63: P25 - N-transformation: summary of effects. Application via powder and dispersion)
Application via powder Application via dispersion Day 0 (= 3 h
after application) Day 28 Day 0 Day 28
Nitrate content EC10 [mg/kg] 2 23.6 n.d. n.d. n.d. EC25 [mg/kg] 2 108.3 n.d. n.d. n.d. LOEC [mg/kg] 21.0 100.0 > 21 > 21 NOEC [mg/kg] 9.3 45.0 ≥ 21 ≥ 21 Nitrogen transformation 1 EC10 [mg/kg] 2 n.d. n.d. EC25 [mg/kg] 2 n.d. n.d. LOEC [mg/kg] 21.0 > 21 NOEC [mg/kg] 9.3 ≥ 21
1 Nitrogen transformation: difference in nitrate content at day 28 and day 0; 2 n.d. = not determined due to mathematical reasons or inappropriate data
The application via dispersion gave no clear effect. The difference to the control was small and not statistically significant. It is assumed that an application via dispersion does not cause an increased bioavailability of TiO2 nanoparticles for the soil microflora.

Soil microorganisms: Carbon Transformation Test – TiO2 105
10 Microorganisms - Carbon Transformation Test (OECD TG 217) – TiO2
10.1 Test principle The effects of the test item on carbon transformation were determined in a natural soil. After mixing the test item into the soil, the soil was incubated at 20 ± 2°C for 28 days in the dark. Samples were taken at test start and after 28 days of incubation. The test item was applied once. For measurement of carbon transformation a short-term respiration test (glucose-induced respiration rates) in soil was performed.
10.2 Materials and methods
10.2.1 Test guideline
The test was performed according to:
OECD Guidelines for the Testing of Chemicals Test No. 217: "Soil Microorganisms: Carbon Transformation Test" (2000).
10.2.2 GLP
The test was performed following the principles of GLP (OECD, 1998). In deviation to GLP no archiving of the raw data was performed and the Quality Assurance Unit was not involved with respect to the inspection of the test, of the raw data and of the report. All laboratory equipment (e.g. balances, thermometers, pH-meters) were controlled and documented ac-cording to GLP.
10.2.3 Test material
• P25 - distributed by Evonik for the OECD Sponsorship Programme The properties should correspond to the properties of NM-105.
The nanoparticles were stored in the dark at room temperature until use.
10.2.4 Test type
Static. laboratory test.
10.2.5 Analytical monitoring
Due to the high natural concentration of TiO2 in the test soil no specific chemical analyses were performed in the soil.

Soil microorganisms: Carbon Transformation Test – TiO2 106
The zeta potential was measured in the test dispersions using a Malvern Zetasizer Nano ZS. The particle size distribution in the dispersion was not determined. It would give no informa-tion on the size distribution in soil. A measurement of the Zeta-potential or the particle size distribution in soil is not yet possible.
10.2.6 Test item – preparation protocol
We tested two different modes of application: spiking via powder and spiking via dispersion.
The nominal concentrations of the test item in the test containers were 9.3, 21, 45, and 100 mg P25/kg soil, dry mass (application via powder) and 9.3 and 21 mg/kg (application via dispersion). Three replicates per concentration were conducted.
For the first application the TiO2 powder was mixed directly into the soil using air-dried test soil (1% of the total amount) as a carrier for the powder. Amounts of TiO2 powder that were suitable to achieve the desired final soil content were mixed homogenously with the dry soil. Care was taken to avoid a modification of the TiO2 crystalline structure. Uncontaminated test soil (between 20 and 30% of WHCmax) was spread on a plate, the carrier material with the TiO2 powder was distributed onto the test soil, and all was mixed carefully. In the same way, 5 g/kg dm ground lucerne was mixed into the soil. For the test with contaminated soil, the soil was adjusted to a water-holding capacity of 55% of the maximum water-holding capacity (WHCmax). Test concentrations were: 9.3, 21, 45 and 100 mg/kg soil dry matter.
Spiking of soil with TiO2 powder
The second application trial was to spray a TiO2 dispersion (TiO2 nanoparticles in deionised water) that had been prepared with a magnetic flea (900 rpm; 1 min) and ultrasonication (3 min) in a bath sonicator. The test soil was dried to about 10% of WHCmax and spread on a plate. 5 g/kg dm of ground lucerne were mixed into the soil. Immediately after preparation, the TiO2 dispersion was sprayed onto the soil by means of a syringe coupled with a cannula, and thoroughly mixed. Finally, the test soil was adjusted to a water-holding capacity of 55% of WHCmax.
Spiking of soil with aqueous TiO2 dispersion
A maximum concentration of about 200 mg/L application dispersion of TiO2 nanoparticles was considered as adequate for the tests. Higher concentrations would have sedimented rapidly preventing a homogenous distribution of the nanomaterial in the soil. Furthermore, it was assumed that higher concentrations in the application dispersion would result in larger agglomerates. The maximum water content in the test soil should be about 55% of the maximum water-holding capacity. Based on the present water content of the soil, 202 mg/L application dispersion had to be used. The suspension was continuously stirred to achieve homogeneity during spiking. Due to these limitations only the soil contents of treatments 9.3 and 21 mg/kg were tested.

Soil microorganisms: Carbon Transformation Test – TiO2 107
Test concentrations were: dispersion with 92 and 202 mg/L deionised water; application of 202 ml test dispersion to 2.0 kg test soil (dm) corresponding to 9.3 ml, and application of 208 ml test dispersion to 2.0 kg test soil (dm) corresponding to 21 mg/kg soil (dm)
10.2.7 Test organism
A sandy soil with the individual soil microflora was investigated.
10.3 Study design
10.3.1 Total exposure period
The exposure period was 28 days: June 22, 2010 - July 20, 2010.
10.4 Test conditions
10.4.1 Environmental conditions
The incubation temperature was measured continuously with a thermograph. With 20 - 21°C the permitted range of 20 ± 2°C was kept. Incubation occurred in the dark. During the whole test the soil dry mass was maintained at 88.7% (controls), 88.3% (powder application: 9.3 mg/kg), 89.4% (powder application: 21 mg/kg), 88.8% (powder application: 45 mg/kg), 88.8% (powder application: 100 mg/kg), 89.3% (dispersion application: 9.3 mg/kg) and 89.1% (dispersion application: 21 mg/kg).
Physico-chemical data
10.4.2 Test soil
The test soil was a natural sandy soil (Certified RefeSol 01-A, batch IME-01: sand 71%, silt: 24%, clay: 5%, org C: 0.93%, pH 5.7, clay: 5%). Selected soil parameters are presented in Table 64. The soil was sieved to 2 mm. It was not sterilised and stored outdoors on the grounds of the test facility in high-grade stainless steel basins with drainage and ground con-tact. Dates of the soil handling for the test are shown in Table 65.
For at least one year prior to soil sampling in the field, no plant protection products were ap-plied to the sampling site. No organic or mineral fertilisers were applied to the soil for six and three months, respectively, prior to soil sampling.

Soil microorganisms: Carbon Transformation Test – TiO2 108
Table 64: Test soil for microbial tests: soil parameters.
Soil name RefeSol 01-A Soil batch IME-01 Soil texture Loamy sand Clay [%] 5 Silt [%] 24 Sand [%] 71 WHC [g H2O/kg soil dry weight] 264 CECeff [mmol/kg] 37.9 pH 5.7 Total org. C [%] 0.93 Microbial biomass [mg C/kg dry mass soil], calculated from respiration activity 92 Microbial biomass [% of total org. C] 1.0 Total nitrogen [%] 0.09 NO3
- [mg/kg dry weight] 81.7
WHC = water holding capacity; CECeff = effective cation exchange capacity
Table 65: Test soil for microbial tests: storage information.
Soil name RefeSol 01-A Soil batch IME-01 Date of field sampling 11.06.2010 Start of indoor storage at room temperature to reduce the water content and to allow sieving; the soil was distributed in a thin layer; surface drying was pre-vented by periodically turning the soil.
11.-13.09.2008
Date of sieving for the study 13.06.2010 Start of soil conditioning 1 13.06.2010 Date of application 22.06.2010
1 Soil conditioning was performed at room temperature in the dark.
10.4.3 Concentration levels
For the application via powder the nominal contents in the test containers with TiO2 nanopar-ticles were 9.3, 21.0, 45.0 and 100.0 mg/kg soil dry matter.
For the application via dispersion the nominal contents in the test containers with TiO2 nanoparticles were 9.3 and 21.0 mg/kg soil dry matter.
10.4.4 Other information on materials and methods
The treatment was performed once at test start.
Frequency of treatment

Soil microorganisms: Carbon Transformation Test – TiO2 109
The control consisted of soil. Three replicates were conducted per control.
Control group and treatment
Data evaluation:
Statistical method
In this report numerical values were frequently rounded to a smaller degree of precision (number of digits) than used in the actual calculation. Minor differences in results obtained from calculations with rounded values in comparison to results obtained with higher precision values are possible. They are, however, well within the limits of the experimental accuracy and of no practical concern.
Statistical calculations: For each concentration the quantity of consumed oxygen was determined. Performed ac-cording to the guidelines for non-agrochemicals, the glucose-induced respiration rates found in the treated samples after 28 days were compared to the respiration rates found in the con-trols. Furthermore, the percent inhibition value for the test concentrations was calculated. The percent deviation of the respiration rates were calculated in comparison to the control. ECx, LOEC and NOEC calculations were performed with the computer software ToxRat Pro-fessional version 2.10.4.1 (ToxRat® Solutions GmbH).
Three incubation containers per treatment were filled with 733 g moist spiked soil. A further three incubation containers were filled with 733 g of control soil.
Test procedure
The test was carried out in the dark at 20 ± 2°C for 28 days. During the test the moisture con-tent of the soil was maintained at 40 - 60% of WHCmax with a maximum of 5% outside this range. The mass in the test vessels was measured weekly. Evaporated water was supple-mented by adding deionised water.
Samples of each treated and control replicate were analysed for glucose-induced respiration at the beginning (day 0) and at the end of the exposure period (28 days).
The soil samples (100 g dry mass) were mixed with 4000 mg glucose per kg dry weight. The glucose concentration was based on a range finding test for the soil to achieve maximum activity. The glucose-amended soil samples were continuously incubated in an apparatus for the measurement of respiration rates (day 0: Sapromat® Voith Inc.; day 28: Sensomat, Aqualytik) at 20 ± 2°C. The oxygen consumed was measured consecutively for at least 12 h. Measurements started as soon as possible after glucose supplement. For evaluation the linear phase of oxygen consumption was used.

Soil microorganisms: Carbon Transformation Test – TiO2 110
10.5 Results
10.5.1 Zeta potential
The zeta potential is presented in Table 66. A negative value of -18mV (100 mg/L) was de-termined in deionised water.
Table 66: P25 - C-transformation: zeta potential of the stock dispersion for application via dispersion.
Sample Zeta potential [mV] 100 mg/L -18 mV
10.5.2 Carbon transformation
For both application forms, inhibitory effects were not observed and no EC-values were cal-culated. There was no statistically significant difference between the treatments and the con-trol. The NOEC was therefore higher than the highest test concentration (≥ 100 mg/kg).
Effect concentrations
For each treatment three replicate vessels were incubated. From each vessel one soil sam-ple was taken for measurement. The results showed a large variation between the replicates. This was especially true for the measurement at day 28, where another measuring device than applied for day 0 had to be used due to technical reasons (day 0: Sapromat with con-tinuous oxygen supply depending on respiration activity; the amount of oxygen supplied is the measure for microbial respiration activity; day 28: OxiTop (= respirometer without oxygen supply; a decrease in pressure is the measure for microbial respiration activity; 500 mL incu-bation vessels). In previous projects the comparability of both measuring devices was proven (joint project sponsored by BMBF: FKZ 0330303; Project: Biologische Testverfahren in der Vor-Ort-Analytik zur Beurteilung der Qualität von Böden und Bodenmaterialien; Teilvorhaben 2: Mikrobielle Atmungsaktivität).
Respiration measurement
Looking at the replicates, in several cases two values were identical or very similar, whereas one value differed obviously. In these cases a further assessment was performed after elimi-nating the "extreme" values. The results of the short-term respiration measurement are pre-sented as mean values in Table 67 and for better visualisation in Figure 19. The evaluation based on all measured values and the evaluation based on the reduced number of values is listed. Table 68 shows the percentage deviation compared to the control. For single values of the replicates see Table 69.
In the test vessels with spiked soil a stimulation of respiration at day 28 was observed. Appli-cation via dispersion resulted in a slight inhibition of respiration activity. After elimination of the “extreme” values, the stimulation was less pronounced and the slight elimination van-ished. No statistical significance was observed for either of the treatments and calculations.
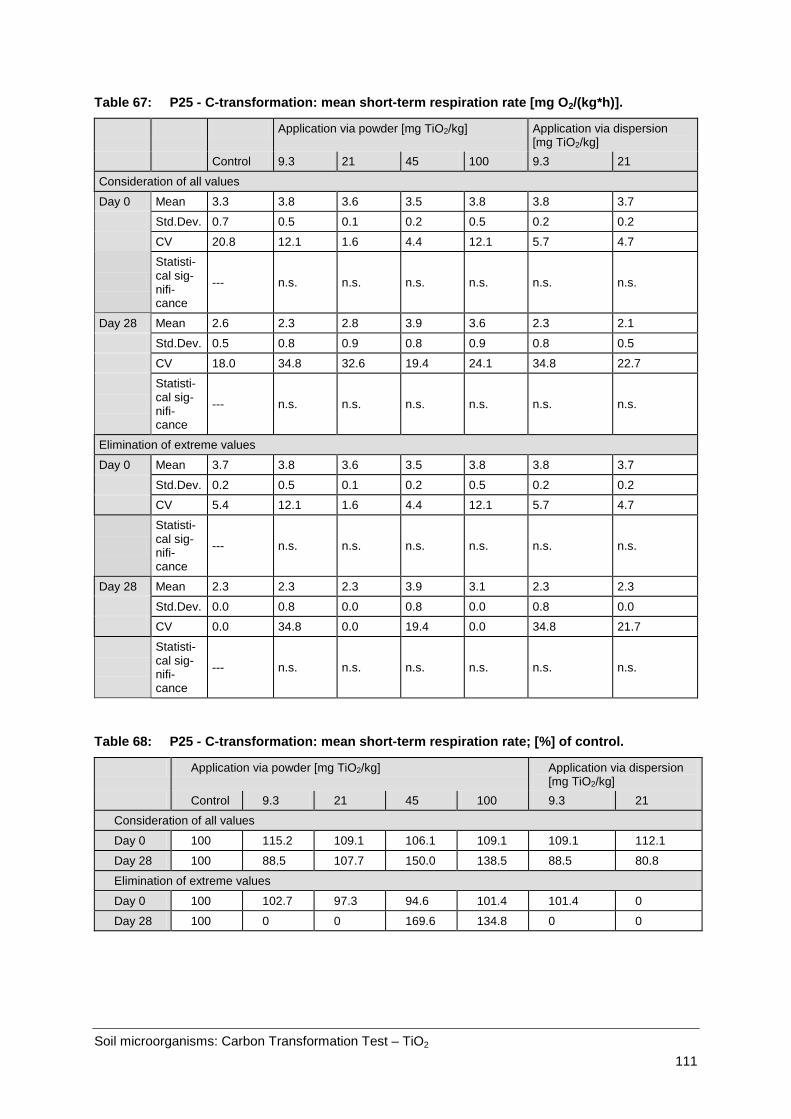
Soil microorganisms: Carbon Transformation Test – TiO2 111
Table 67: P25 - C-transformation: mean short-term respiration rate [mg O2/(kg*h)].
Application via powder [mg TiO2/kg] Application via dispersion [mg TiO2/kg]
Control 9.3 21 45 100 9.3 21
Consideration of all values
Day 0 Mean 3.3 3.8 3.6 3.5 3.8 3.8 3.7
Std.Dev. 0.7 0.5 0.1 0.2 0.5 0.2 0.2
CV 20.8 12.1 1.6 4.4 12.1 5.7 4.7
Statisti-cal sig-nifi-cance
--- n.s. n.s. n.s. n.s. n.s. n.s.
Day 28 Mean 2.6 2.3 2.8 3.9 3.6 2.3 2.1
Std.Dev. 0.5 0.8 0.9 0.8 0.9 0.8 0.5
CV 18.0 34.8 32.6 19.4 24.1 34.8 22.7
Statisti-cal sig-nifi-cance
--- n.s. n.s. n.s. n.s. n.s. n.s.
Elimination of extreme values
Day 0 Mean 3.7 3.8 3.6 3.5 3.8 3.8 3.7
Std.Dev. 0.2 0.5 0.1 0.2 0.5 0.2 0.2
CV 5.4 12.1 1.6 4.4 12.1 5.7 4.7
Statisti-cal sig-nifi-cance
--- n.s. n.s. n.s. n.s. n.s. n.s.
Day 28 Mean 2.3 2.3 2.3 3.9 3.1 2.3 2.3
Std.Dev. 0.0 0.8 0.0 0.8 0.0 0.8 0.0
CV 0.0 34.8 0.0 19.4 0.0 34.8 21.7
Statisti-cal sig-nifi-cance
--- n.s. n.s. n.s. n.s. n.s. n.s.
Table 68: P25 - C-transformation: mean short-term respiration rate; [%] of control.
Application via powder [mg TiO2/kg] Application via dispersion [mg TiO2/kg]
Control 9.3 21 45 100 9.3 21
Consideration of all values
Day 0 100 115.2 109.1 106.1 109.1 109.1 112.1
Day 28 100 88.5 107.7 150.0 138.5 88.5 80.8
Elimination of extreme values
Day 0 100 102.7 97.3 94.6 101.4 101.4 0
Day 28 100 0 0 169.6 134.8 0 0

Soil microorganisms: Carbon Transformation Test – TiO2 112
Table 69: P25 - C-transformation: short-term respiration rate (SIR) [mg O2/(kg*h)]. Single values of the replicates; values eliminated for the evaluation ("extreme" values are marked bold)
Date of sampling
Replicate Application via powder [mg TiO2/kg]
Application via dispersion [mg TiO2/kg]
Control 9.3 21 45 100 9.3 21
Test start
1 2.5 3.9 3.5 3.5 3.3 - 3.6
2 3.8 4.2 3.5 3.3 4.2 3.9 3.9
3 3.5 3.3 3.6 3.6 - 3.6 3.6
Day 28
1 2.3 3.1 2.3 3.1 3.1 3.1 2.3
2 3.1 1.5 2.3 3.9 3.1 2.3 1.5 3 2.3 2.3 3.9 4.6 4.6 1.5 2.3
Figure 19: P25 – C-Tranformation: mean short-term respiration rate [(mg O2/(kg*h)].
10.5.3 Further information
To confirm the results the test was repeated. The results are presented in Table 70, Table 71 and Figure 20.
For both application forms, no inhibitory effects were observed and no EC-values were calcu-lated.
Effect concentrations:

Soil microorganisms: Carbon Transformation Test – TiO2 113
There was no statistically significant difference between the treatments and the control after an incubation period of 28 d. The NOEC was ≥100 mg/kg (100 mg/kg: highest test concen-tration).
Deviating from the first test, there was a small concentration-dependent inhibition at day 0; at day 28 a concentration-dependent stimulation was not measured. A statistical difference to the control was not observed. The results obtained at day 28 were independent of the appli-cation form (application of powder / application via dispersion). Therefore the conclusion drawn from the results from both tests (the first test and the repeated test) is the same: P25 does not affect the microbial respiration activity. A lower respiration activity after 28 days is well known. During the incubation period of 28 days the microorganisms consume nutrients. Depletion of the nutrients results in lower microbial biomass and consequently in a lower respiration activity at the end of the incubation period
Respiration measurement:
Table 70: P25 - C-transformation: mean short-term respiration rate [mg O2/(kg*h)].
Application via powder [mg TiO2/kg] Application via dispersion [mg TiO2/kg]
Control 9.3 21 45 100 9.3 21
Day 0 Mean 5.87 5.33 5.07 4.80 4.80 4.80 5.07
Std.Dev. 0.46 0.92 0.46 0.00 0.00 0.00 0.46
CV 7.9 17.3 9.1 0.0 0.0 0.0 9.1
Statistical significance --- n.s. n.s. * 1 * 1 * 1 n.s.
Day 28 Mean 3.20 2.93 3.20 3.20 3.47 2.93 3.73
Std.Dev. 0.00 0.46 0.00 0.00 1.22 0.46 0.46
CV 0.0 15.7 0.0 0.0 35.3 15.7 12.4
Statistical significance --- n.s. n.s. n.s. n.s. n.s. n.s.
1 Statistical significance: p > 0.05
Table 71: P25 - C-transformation: mean short-term respiration rate, [%] of control.
Application via powder [mg TiO2/kg] Application via dispersion [mg TiO2/kg]
Control 9.3 21 45 100 9.3 21
Day 0 100 90.8 86.4 81.8 81.8 81.8 86.4
Day 28 100 91.6 0 0 108.4 91.6 116.6

Soil microorganisms: Carbon Transformation Test – TiO2 114
Figure 20: P25 – C-Transformation: mean short-term respiration rate [mg O2/(kg*h)] (test repetition).
10.6 Validity
A validity criterion is only available in the guideline for the testing of agrochemicals. The evaluation of the results from the tests performed with agrochemicals is based on relatively small differences (i.e. average value ± 25%) between the carbon dioxide released or the oxygen consumed in control and treated soil samples; accordingly, large variations in the controls can lead to false results. Therefore, the variation between replicate control samples should be less than ± 15%.
For non-agrochemicals concentration-effect relationships are the relevant endpoint. There-fore, a variation of 15% is of minor importance. From the results it is obvious that there are no concentration-effect relationships and P25 does not affect microbial respiration activity. Nevertheless, the validity criteria for agrochemicals are fulfilled as the variation is 8% (day 0) and 0% (day 28).
10.7 Reference substance
In the guideline the investigation of a reference substance is not demanded. A reference substance was not tested.
10.8 Conclusion
The TiO2 nanoparticles tested by means of
Soil microorganisms: Carbon Transformation Test – TiO2 115
• Application via powder in soil: 9.3, 21.0, 45.0 and 100.0 mg/kg soil, dry matter,
• Application via dispersion in soil: 9.3 and 21.0 mg/kg soil, dry matter,
did not affect the carbon transformation activity.
10.9 Executive Summary
TiO2 nanoparticles (P25) were tested in the microbial carbon transformation assay (OECD Test Guideline 217). Soil was spiked with the test item via powder and via dispersion. As the test substrate, a natural sandy soil was used. The following test concentrations were investi-gated:
• Application via powder in soil: 9.3, 21.0, 45.0 and 100.0 mg/kg soil, dry matter
• Application via dispersion in soil: 9.3 and 21.0 mg/kg soil, dry matter.
For each treatment three replicate vessels were incubated. From each vessel one soil sample was taken for measurement.
For both application forms, no inhibitory effect was observed and no EC-values were calcu-lated. There is no statistically significant difference between the treatments and the control. The NOEC is higher than the highest test concentration (≥ 100 mg/kg). This result was con-firmed by a repetition of the test.

Test with plants: seedling emergence and growth – TiO2 116
11 Growth Tests with Plants (OECD TG 208) – TiO2
11.1 Test principle
Seeds of different terrestrial plants were sown in control pots and in pots containing a natural soil and different concentrations of the test item. The test item was applied once. The se-lected test species were kept under the recommended growth conditions. Emergence and mass (fresh weight) of the shoots was determined at least 14 days after 50% of the control seedlings have emerged and compared with the shoots of the control plants.
11.2 Materials and methods
11.2.1 Test guideline
The test was performed according to OECD Guidelines for the Testing of Chemicals Test No. 208: Terrestrial Plant Test: Seedling Emergence and Seedling Growth Test (2006).
11.2.2 GLP
The test was performed following the principles of GLP. In deviation to GLP no archiving of the raw data was performed and the Quality Assurance Unit was not involved with respect to the inspection of the test, the raw data, and the report. All laboratory equipment (e.g. bal-ances, thermometers, pH-meters) were controlled and documented according to GLP.
11.2.3 Test material
• P25 - distributed by Evonik for the OECD Sponsorship Programme The properties should correspond to the properties of NM-105.
The nanoparticles were stored in the dark at room temperature until use.
11.2.4 Analytical monitoring
Due to the high natural concentration of TiO2 in the test soil no specific chemical analyses were performed in the test soil.
The zeta potential was measured in the test dispersions using a Malvern Zetasizer Nano ZS. The particle size distribution in the dispersion was not determined. Particle size gives no in-formation on the size distribution in soil. A measurement of the zeta-potential or the particle size distribution in soil is not yet possible.

Test with plants: seedling emergence and growth – TiO2 117
11.2.5 Test species
The plant species used in the test were Avena sativa (oat), Sinapis alba (mustard), and Phaseolus aureus (mung bean), which are representatives of monocotyledonous and dicoty-ledonous plants, respectively. The species are recommended by the guideline.
Avena sativa: Saaten-Union GmbH 30916 Isernhagen HB Date of receipt: April 26, 2010 Cultivar Freddy germination capacity: 92%
Origin of the seeds
Sinapis alba: Landesinstitut für Landwirtschaftliche Qualitätskontrolle; Pro-ducer country: Hungary Date of sealing (06.2005): certified seeds 1st generation. Cultivar Dr. Francks Hohenheimer gelb. Reference No.: H 4-51/632. Reference number of basis seeds: D/KA 3078590/4
Phaseolus aureus: SPERLI Samen Carl Sperling & Co. Lüneburg, Germany D 6210 H; Charge 3650
The seeds were stored in the dark at room temperature (20 ± 5 °C) in the test facility and protected from moisture until use.
Storage
11.3 Study design
11.3.1 Study type
Laboratory test.
11.3.2 Test duration type
Short term test.
11.3.3 Test type
Seedling emergence toxicity test.

Test with plants: seedling emergence and growth – TiO2 118
11.3.4 Substrate type
The soil used in the test was a natural sandy soil (Certified RefeSol 01-A, batch IME-01 composed of sand 71%, silt: 24%, clay: 5%, Org C: 0.93%, pH 5.7, clay: 5%). The soil was sieved to 2 mm. It was not sterilised and had been stored outdoors in high grade stainless steel basins with drainage and ground contact at the test facility.
11.3.5 Exposure period
The exposure period was 14 days starting after germination of 50% of the seeds in the con-trol vessels.
• Phaseolus aureus: 2nd November 2009 - 17 November 2009
• Avena sativa: 5 January 2010 - 21 January 2010
• Sinapis alba: 5 January 2010 - 21 January 2010
11.3.6 Post exposure period
There was no post exposure period.
11.4 Test conditions
11.4.1 Environmental conditions
The test was carried out in a plant growth chamber at 20 ± 2 °C, 70 ± 25% humidity, and an illumination period of 16 h per day with a light intensity of > 7000 lux (light colour 25, univer-sal white).
The incubation temperature was measured continuously with a thermograph. With 19 – 22 °C measured throughout the test, the permitted range of 20 ± 2°C was maintained.
The light intensity was measured in Lux using an illuminance meter (MINOLTA) with photo-metric sensor. With 9000 – 10,000 lux measured throughout the test, the permitted value of at least 7000 lux was maintained.
At 60 – 80% humidity, the permitted range of 70% ± 25% was maintained.
11.4.2 Concentration levels
The nominal concentrations in the test containers with TiO2 nanoparticles were 10, 20, 30, 44, 67, 100 mg P25/kg soil, dry mass (application via powder) and 10 and 20 mg/kg (applica-tion via dispersion).

Test with plants: seedling emergence and growth – TiO2 119
11.4.3 Other information on materials and methods
The treatment was applied once at test start.
Frequency of treatment
The control treatment group consisted of soil and plants. Four replicates were conducted per control.
Control group and treatment
Spiking of soil with TiO2 powder
Test item – Preparation protocol
For the first application the TiO2 powder was mixed directly into the soil using air-dried test soil (1% of the total amount) as a carrier for the TiO2 powder. Suitable amounts of TiO2 pow-der to achieve the desired final soil content were mixed homogenously with the dry soil. Care was taken to avoid a modification of the TiO2 crystalline structure. Uncontaminated test soil (between 20 - 30% of WHCmax) was spread on a plate, the carrier material with the TiO2 powder distributed on the test soil, and all was then mixed carefully. For the test with con-taminated soil, the soil was adjusted to a water-holding capacity of 60% of the maximum wa-ter-holding capacity (WHCmax).
Spiking of soil with aqueous TiO2 dispersion The second application trial utilised a TiO2 dispersion (TiO2 nanoparticles in deion. water) that had been prepared with a magnetic flea (900 rpm; 1 min) and ultrasonication (3 min) in a bath sonicator. The test soil was dried to about 10% of WHCmax and spread on a plate. Im-mediately after preparation of the TiO2 dispersion was sprayed onto the soil by means of a syringe coupled with a cannula, and then mixed thoroughly. Finally, the test soil was adjusted to a water-holding capacity of 60% of WHCmax. A maximum concentration of about 200 mg/L application dispersion of TiO2 nanoparticles was considered adequate for the tests. Higher concentrations would have sedimented rapidly preventing a homogenous distribution of the nanomaterial in the soil. Furthermore, it was assumed that higher concentrations in the appli-cation dispersion would result in larger agglomerates. Based on the present water content of the soil, 165 mg/L application dispersion of TiO2 nanoparticles was used in the test with Phaseolus aureus, and of 177 mg/L in the test with Avena sativa and Sinapis alba. The sus-pensions were continuously stirred to achieve homogeneity during spiking.
Due to these limitations, only the soil contents of the treatments 10 and 20 mg/kg were tested. Test concentrations used in the test with Avena sativa and Sinapis alba were: dispersion with 89 and 178 mg/L deionised water; application of 225 ml test dispersion to 2.0 kg test soil (dm), corresponding to 10 and 20 mg/kg soil (dm).
Test concentrations in the test with Phaseolus aureus were: dispersion with 83 and 165 mg/L deionised water; application of 185 ml test dispersion to 1.5 kg test soil (dm), corresponding to 10 and 20 mg/kg soil (dm).
Test with plants: seedling emergence and growth – TiO2 120
Floragard Grünpflanzendünger was used as fertiliser., manufactured by Floragard Vertriebs GmbH für Gartenbau, P.O. Box 9006, 26138 Oldenburg, Germany. The concentration ap-plied in the test was 1 mL fertiliser per litre water.
Fertiliser
Nutrient content of Floragard Grünpflanzendünger: Ammonium nitrogen 23 mg/L , iron (Chelate) 0.50 mg/L; nitrate nitrogen 23 mg/L; copper (chelate) 0.30 mg/L; phosphate 30 mg/L; manganese (chelate) 0.30 mg/L; potassium oxide 60 mg/L; molybdenum 0.01 mg/L; zinc (chelate) 0.05 mg/L; and boron 0.10 mg/L
Round containers made of nonporous plastic with a diameter of 85 - 95 mm were used. A glass fibre wick originating from a water reservoir and passing through the bottom of the con-tainer was used to ensure consistent soil moisture. The containers were filled up with ap-proximately 280 g moist soil.
Test containers
For each plant test species a control and several concentrations were tested. Five seeds were planted in each replicate immediately after incorporation of the test item. For each test and each species seeds of the same size class were used. Twenty-four hours after test start, the glass fibre wicks passing through the bottom of the container were connected with a res-ervoir of fertiliser to ensure consistent soil moisture.
Test procedure
The test was carried out in a plant growth chamber at 20 ± 2°C, 70 ± 25% humidity and an illumination period of 16 h per day with a light intensity of > 7000 lux (light colour 25, univer-sal white).
Watering/fertilisation: Continuous bottom watering of the test container via glass fibre wicks was performed. Fertiliser was used for watering.
The 14-day-growth-phase started when 50% of the seedlings in the control group had emerged. This day was determined as "growth day 1". On this day, the number of emerged seedlings of all containers was recorded. Observations concerning emergence and visual phytotoxicity and mortality were performed throughout the exposure period of 14 days. At "growth day 14", all seedlings were counted and the aboveground biomass was measured. The wet mass of the plants was measured immediately after harvesting and the length of the roots was determined. The roots were carefully rinsed with tap water. The length of the main root biomass and the shortest and longest root of individual roots were measured.
Data evaluation
Statistical method
Numerical values in this report are frequently rounded to a smaller degree of precision (num-ber of digits) than were used in the actual calculation. Minor differences in results obtained

Test with plants: seedling emergence and growth – TiO2 121
from calculations with rounded values compared to the results obtained with higher precision values are possible. They are, however, well within the limits of the experimental accuracy and of no practical concern.
Statistical calculations The percentage inhibition of seedling emergence was calculated for each plant species as an absolute value and in comparison to the control. Survival of emerged seedlings was calcu-lated as an absolute value. The percentage inhibition of fresh weight was calculated in com-parison to the control. Germination and biomass were compared by a suitable test for multi-ple comparisons with a control after testing variance homogeneity. All statistical tests were performed with the computer software ToxRat Professional version 2.10.4.1 (ToxRat® Solu-tions GmbH).
11.5 Results
(Raw data, chapter 21.4)
11.5.1 Zeta potential
The zeta potential in deionised water is documented in Table 72. A negative zeta potential of -18 mV (in deion. water) was measured.
Table 72: P25 – Test with plants: zeta potential of the stock dispersion for application via dispersion.
Sample Zeta potential [mV] 100 mg/L -18 mV
11.5.2 Effects
Effect concentrations
The effect concentrations (ECx, NOEC and LOEC values) are presented in Table 73.

Test with plants: seedling emergence and growth – TiO2 122
Table 73: P25 – Plant test: summary of the effects. Application via powder; critical effect and threshold concentrations [mg/kg]
Avena sativa Phaseolus aureus Sinapis alba Emergence EC10 [mg/kg] EC50 [mg/kg] LOEC [mg/kg] NOEC [mg/kg]
32.4 n.d. 2 > 100 ≥ 100
n.d. 2 n.d. 2 n.d. 2 n.d. 2
n.d. 2 n.d. 2 > 100 ≥ 100
Shoot fresh weight EC10 [mg/kg] 1 EC50 [mg/kg] 1 LOEC [mg/kg] NOEC [mg/kg]
51.7 (36.1 – 61.4) n.d. 2 100.0 67.0
n.d. 2 n.d. 2 67 44
n.d. 2 n.d. 2 > 100 ≥ 100
Root length: EC10 [mg/kg] EC50 [mg/kg] LOEC [mg/kg] NOEC [mg/kg]
n.d. 2 n.d. 2 > 100 ≥ 100
n.d. 2 n.d. 2 n.d. 2 n.d. 2
n.d. 2 n.d. 2 > 100 ≥ 100
1 values in brackets: confidence interval; 2 n.d. = not determined due to mathematical reasons or inappropriate data or considered as unreliable
No pathological symptoms were observed during the test (
Pathological symptoms
Table 74).
Table 74: P25 – Plant test: pathological symptoms [% plants].
Application via powder [mg TiO2/kg] Application via dispersion [mg TiO2/kg]
Test species Control 10 20 30 44 67 100 10 20 Avena sativa - 1 - - - - - - - -
Phaseolus aureus - - - - - - - - -
Sinapis alba - - - - - - - - - 1 - = no visual symptom
The plants measured after the 14 days exposure periods are presented in
Seedling emergence and growth
Figure 21. No dif-ference between control and highest test concentration is obvious. The results of emergence and growth inhibition are presented as mean values (Table 75 - Table 80, Figure 22). Raw data are presented in chapter 21.4 (Table 239 - Table 243). The most sensitive endpoint was the fresh shoot biomass. For Phaseolus aureus NOEC and LOEC values and for Avena sa-tiva EC25 and EC50 values were calculated (Table 73). The calculated EC50 value was far beyond the highest test concentration (158.8 mg/kg with a confidence interval of 126.0 – 268.5 mg/kg). At higher test concentrations effects by nanoparticles can decrease due to agglomeration. According to our experience only EC values which are within the range of test
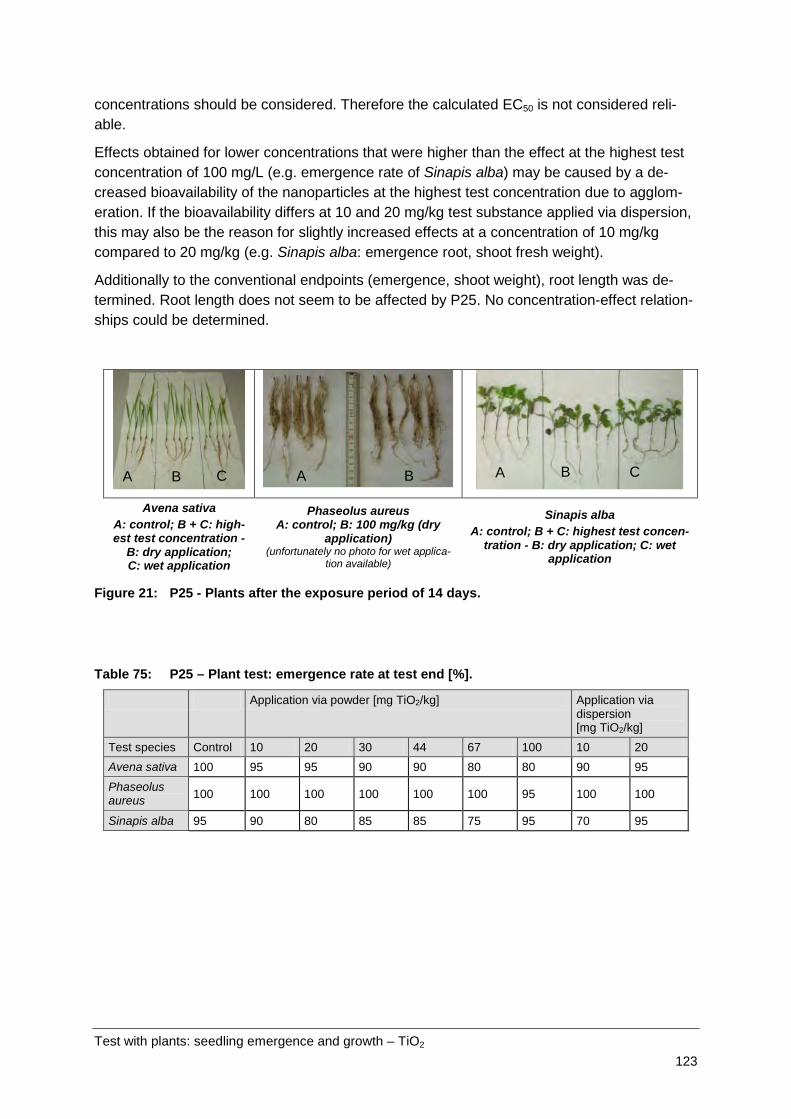
Test with plants: seedling emergence and growth – TiO2 123
concentrations should be considered. Therefore the calculated EC50 is not considered reli-able.
Effects obtained for lower concentrations that were higher than the effect at the highest test concentration of 100 mg/L (e.g. emergence rate of Sinapis alba) may be caused by a de-creased bioavailability of the nanoparticles at the highest test concentration due to agglom-eration. If the bioavailability differs at 10 and 20 mg/kg test substance applied via dispersion, this may also be the reason for slightly increased effects at a concentration of 10 mg/kg compared to 20 mg/kg (e.g. Sinapis alba: emergence root, shoot fresh weight).
Additionally to the conventional endpoints (emergence, shoot weight), root length was de-termined. Root length does not seem to be affected by P25. No concentration-effect relation-ships could be determined.
Avena sativa
A: control; B + C: high-est test concentration -
B: dry application; C: wet application
Phaseolus aureus A: control; B: 100 mg/kg (dry
application) (unfortunately no photo for wet applica-
tion available)
Sinapis alba A: control; B + C: highest test concen-
tration - B: dry application; C: wet application
Figure 21: P25 - Plants after the exposure period of 14 days.
Table 75: P25 – Plant test: emergence rate at test end [%].
Application via powder [mg TiO2/kg] Application via dispersion [mg TiO2/kg]
Test species Control 10 20 30 44 67 100 10 20 Avena sativa 100 95 95 90 90 80 80 90 95 Phaseolus aureus 100 100 100 100 100 100 95 100 100
Sinapis alba 95 90 80 85 85 75 95 70 95
A A A B B B C C

Test with plants: seedling emergence and growth – TiO2 124
Table 76: P25 – Plant test: emergence rate at test end compared to control [%].
Application via powder [mg TiO2/kg] Application via dispersion [mg TiO2/kg]
Test species Control 10 20 30 44 67 100 10 20 Avena sativa 100 95 95 90 90 80 80 90 95
Phaseolus aureus 100 100 100 100 100 100 95 100 100
Sinapis alba 100 95 84 89 89 79 100 74 100
Table 77: P25 – Plant test: fresh weight of the shoots; mean values ± SD [g].
Application via powder [mg TiO2/kg] 1 Application via dispersion [mg TiO2/kg]
Test species Control 10 20 30 44 67 100 10 20
Avena sativa 2.591 ± 0.286
2.571 ± 0.487
2.461 ± 0.279
2.567 ± 0.391
2.382 ± 0.329
2.200 ± 0.185
1.803 ± 0.204 1
2.130 ± 0.201 *
2.286 ± 0.368
Phaseolus aureus
3.851 ± 0.087
3.446 ± 0.166
3.472 ± 0.363
3.869 ± 0.414
3.674 ± 0.345
3.171 ± 0.377
3.127 ± 0.443
3.530 ± 0.400
3.271 ± 0.302±
Sinapis alba 2.411 ± 0.517
2.256 ± 0.398
2.195 ± 0.520
1.964 ± 0.486
2.243 ± 0.506
2.174 ± 0.868
1.984 ± 0.215
1.449 ± 0.468
2.040 ± 0.245
1 *: significant when compared with control (p > 0.05)
Table 78: P25 – Plant test: growth inhibition related to control at test end [% FW].
Application via powder [mg TiO2/kg] Application via dispersion [mg TiO2/kg]
Test species Control 10 20 30 44 67 100 10 20 Avena sativa 0 1 5 1 8 15 30 * 1 18 12
Phaseolus aureus 0 11 10 0 5 18 * 1 19 * 1 8 15
Sinapis alba 0 6 9 19 7 10 18 40 15 1 *: significant when compared with control (p > 0.05)
Table 79: P25 – Plant test: mean root length of main root biomass [cm].
Application via powder [mg TiO2/kg] Application via dispersion [mg TiO2/kg]
Test species Control 10 20 30 44 67 100 10 20
Avena sativa 7.225 ± 0.386
7.800 ± 0.548
6.775 ± 0.506
7.525 ± 0.189
7.025 ± 0.556
6.925 ± 0.512
7.775 ± 0.386
7.375 ± 0.519
7.150 ± 0.569
Phaseolus aureus
12.0 ± 0.91
10.9 ± 0.85 1
10.6 ± 1.11
11.1 ± 1.32
10.2 ± 0.50 1
10.0 ± 0.41 1
11.0 ± 0.91 1
10.3 ± 0.29
9.9 ± 0.48
Sinapis alba 4.9 ± 1.88
5.1 ± 0.44
4.5 ± 0.90
3.8 ± 0.55
3.8 ± 0.30
3.9 ± 0.21
4.3 ± 0.32
4.3 ± 0.41
4.4 ± 0.30
1 *: significant when compared with control (p > 0.05)

Test with plants: seedling emergence and growth – TiO2 125
Table 80: P25 – Plant test: inhibition of mean root length of main root biomass [%].
Application via powder [mg TiO2/kg] Application via dis-persion [mg TiO2/kg]
Test species Control 10 20 30 44 67 100 10 20 Avena sativa --- -8 *) 6 -4 3 4 -8 -2 1
Phaseolus aureus --- 9 1 11 7 15 1 17 1 8 1 15 18
Sinapis alba --- -3 9 23 23 22 13 13 12 1 *: significant when compared with control (p > 0.05); 2 negative values indicate stimulation;

Test with plants: seedling emergence and growth – TiO2 126
Avena sativa Phaseolus aureus
Sinapis alba
Figure 22: P25 – Test with plants: shoot fresh weight response curve (results for application via powder).
11.5.3 Results with reference substance
In order to confirm the reproducibility of the study as well as the germination capacity and sensitivity of the test species Avena sativa, Phaseolus aureus and Latuca sativa, the Terres-trial Plants Growth Tests with trichloroacetate (TCA) was performed. The results of the last reference study are in agreement with experienced EC50 values obtained at Fraunhofer IME.
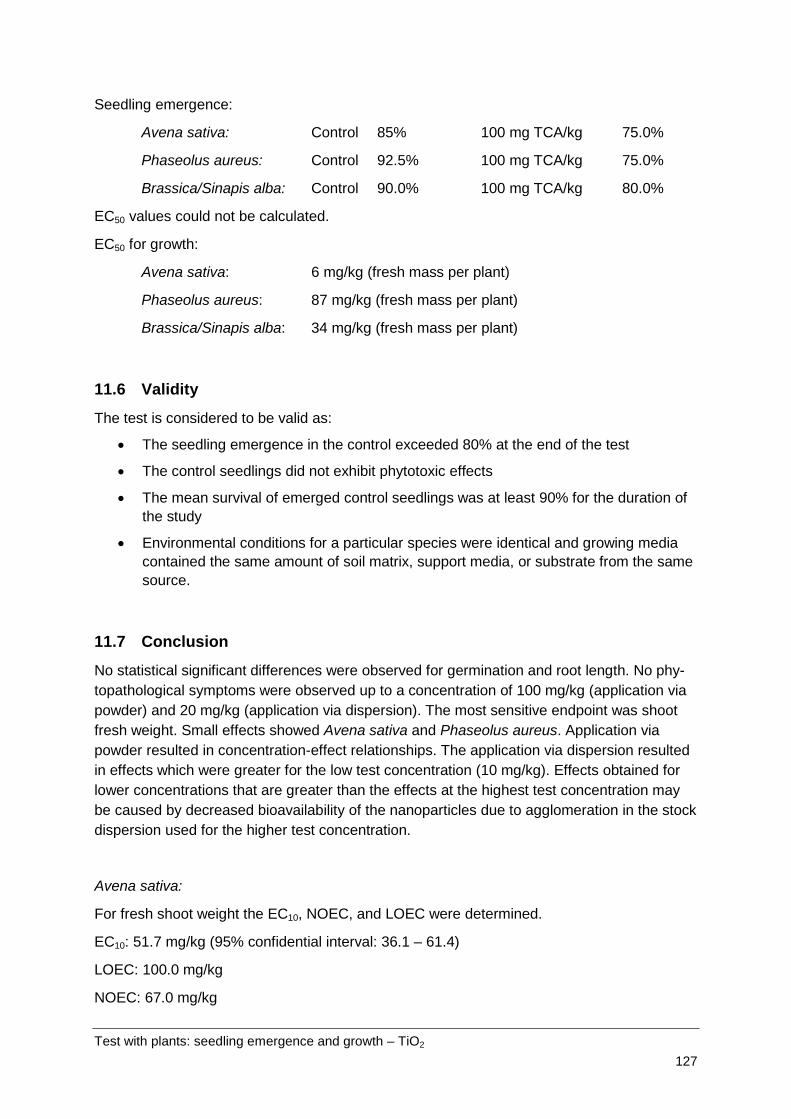
Test with plants: seedling emergence and growth – TiO2 127
Seedling emergence:
Avena sativa: Control 85% 100 mg TCA/kg 75.0%
Phaseolus aureus: Control 92.5% 100 mg TCA/kg 75.0%
Brassica/Sinapis alba: Control 90.0% 100 mg TCA/kg 80.0%
EC50 values could not be calculated.
EC50 for growth:
Avena sativa: 6 mg/kg (fresh mass per plant)
Phaseolus aureus: 87 mg/kg (fresh mass per plant)
Brassica/Sinapis alba: 34 mg/kg (fresh mass per plant)
11.6 Validity
The test is considered to be valid as:
• The seedling emergence in the control exceeded 80% at the end of the test
• The control seedlings did not exhibit phytotoxic effects
• The mean survival of emerged control seedlings was at least 90% for the duration of the study
• Environmental conditions for a particular species were identical and growing media contained the same amount of soil matrix, support media, or substrate from the same source.
11.7 Conclusion
No statistical significant differences were observed for germination and root length. No phy-topathological symptoms were observed up to a concentration of 100 mg/kg (application via powder) and 20 mg/kg (application via dispersion). The most sensitive endpoint was shoot fresh weight. Small effects showed Avena sativa and Phaseolus aureus. Application via powder resulted in concentration-effect relationships. The application via dispersion resulted in effects which were greater for the low test concentration (10 mg/kg). Effects obtained for lower concentrations that are greater than the effects at the highest test concentration may be caused by decreased bioavailability of the nanoparticles due to agglomeration in the stock dispersion used for the higher test concentration.
Avena sativa:
For fresh shoot weight the EC10, NOEC, and LOEC were determined.
EC10: 51.7 mg/kg (95% confidential interval: 36.1 – 61.4)
LOEC: 100.0 mg/kg
NOEC: 67.0 mg/kg

Test with plants: seedling emergence and growth – TiO2 128
Phaseolus aureus:
For fresh shoot weight, the NOEC, and LOEC were determined.
LOEC: 67.0 mg/kg
NOEC: 44.0 mg/kg
Sinapis alba:
For fresh shoot weight, the NOEC, and LOEC were determined.LOEC: > 100.0 mg/kg
NOEC: ≥ 100.0 mg/kg
11.8 Executive summary
TiO2 nanoparticles (P25) were tested in the seedling emergence test and in the growth test with plants (OECD test guideline 208). Soil was spiked via powder and via dispersion. As test substrate a natural sandy soil was used. Following test concentrations were investigated:
• Application via powder in soil: 10, 20, 30, 44, 67, 100 mg/kg soil, dry matter
• Application via dispersion in soil: 10, 20 mg/kg soil, dry matter.
The plant species used in the test were Avena sativa (oat), Sinapis alba (mustard) and Phaseolus aureus (mung bean), representative of monocotyledonous and dicotyledonous plants, respectively. Additionally to the endpoints mentioned in the test guideline (i.e. germi-nation, biomass) the root length was determined.
No statistically significant differences were observed for germination and root length. Phyto-pathological symptoms were not observed up to a concentration of 100 mg/kg (application via powder) and 20 mg/kg (application via dispersion). The most sensitive endpoint was shoot fresh weight. Small effects were observed for Avena sativa and Phaseolus aureus. Application via dispersion resulted in effects which were greater for the low test concentration (10 mg/kg). It is assumed that the bioavailability of the nanoparticles decreased due to a higher agglomeration in the higher concentrated stock dispersion used for the high test con-centration (20 mg/kg).
A summary of the effect values is presented in Table 81.

Test with plants: seedling emergence and growth – TiO2 129
Table 81: P25 – test with plants: summary of the effect values. Application via powder; critical effect and threshold concentrations [mg/kg]
Avena sativa Phaseolus aureus Sinapis alba Emergence EC10 [mg/kg] EC50 [mg/kg] LOEC [mg/kg] NOEC [mg/kg]
32.4 n.d. 2 > 100 ≥ 100
n.d. 2 n.d. 2 n.d. 2 n.d. 2
n.d. 2 n.d. 2 > 100 ≥ 100
Shoot fresh weight EC10 [mg/kg] 1 EC50 [mg/kg] 1 LOEC [mg/kg] NOEC [mg/kg]
51.7 (36.1 – 61.4) n.d. 2 100.0 67.0
n.d. 2 n.d. 2 67 44
n.d. 2 n.d. 2 > 100 ≥ 100
Root length: EC10 [mg/kg] EC50 [mg/kg] LOEC [mg/kg] NOEC [mg/kg]
n.d. 2 n.d. 2 > 100 ≥ 100
n.d. 2 n.d. 2 n.d. 2 n.d. 2
n.d. 2 n.d. 2 > 100 ≥ 100
1 values in brackets: confidence interval; 2 n.d. = not determined due to mathematical reasons or inappropriate data or considered unreliable
Test with chironomids: emergence – TiO2 130
12 Emergence Test with Chironomids (OECD TG 219) – TiO2
12.1 Test principle
Sediment-dwelling larvae (first instar) of the fresh water dipteran Chironomus riparius were placed in a sediment-water test system with defined artificial sediment. The overlaying water was spiked with the test item at a defined range of concentrations. The test item was applied once. Chironomid emergence was measured as the endpoint at the end of the test, i.e. after 28 days of incubation. Emergence rate, development time and rate, and sensitivity of the sexes in the treatment test systems and in the control were analysed for statistically signifi-cant differences using appropriate statistical methods.
12.2 Materials and methods
12.2.1 Test guideline
The test was performed according to:
OECD Guidelines for the Testing of Chemicals Test No. 219: Sediment-Water Chironomid Toxicity Using Spiked Water (2004)
12.2.2 GLP
The test was performed following the principles of GLP. In deviation to GLP no archiving of the raw data was performed and the Quality Assurance Unit was not involved with respect to the inspection of the test, of the raw data and of the report. All laboratory equipment (e.g. balances, thermometers, pH-meters) were controlled and documented according to GLP.
12.2.3 Test substances
• P25 - distributed by Evonik for the OECD Sponsorship Programme The properties should correspond to the properties of NM-105.
• NM-101
The test substances were stored in the dark at room temperature.
Test with chironomids: emergence – TiO2 131
12.3 Analytical monitoring
For the control and for each concentration one additional vessel was used for analytical measurements. The additional vessels were treated as the control vessels and the test ves-sels used for the assessment of the nanoparticles.
Sampling
At several points of time aqueous samples (50 mL) were taken at four depths (about 2.0 cm; 4.0 cm; 5.5 cm; 6.5 cm). The samples were combined. About 20 mL was used for analysis and the remaining amount was carefully returned into the test vessels without disturbing the sediment.
Chemical analysis was performed in the samples collected from the additional vessels.
Characterisation of application dispersion and test dispersion
Furthermore, using a Malvern Zetasizer, the zeta potential was measured in one vessel of each concentration and of the control three hours after application of the nanoparticles. Par-ticle size distribution was determined in the control and the test vessels with P25 at selected time points during the incubation period. No measurements were performed in the highly concentrated application dispersions as the particle size distributions were not representative for the particle size distribution in the test vessels. No measurements were performed for NM-101 due to the fast sedimentation and the high polydispersity at day 0 of P25.
In all vessels, temperature and pH were measured at test start and test end as well as once a week during the study. Dissolved oxygen was measured in one representative vessel per treatment at test start and twice a week during the course of the study, and in all test vessels at the end of the test. Hardness and ammonia were measured in the controls at the highest concentration in one test vessel at the start and the end of the study.
Physical-chemical parameters (overlaying water)
12.3.1 Details of sediment and water
Artificial sediment components
• Sphagnum peat, air-dried, finely ground 5%
• Kaolinite, air-dried 20%
• Industrial quartz sand, air-dried 75%
The test substrate was wetted with deionised water to reach a water content of about 25% -30%. According to the guideline a water content between 30% and 50% is recommended. Our experience shows that lower water content results in a more homogenous distribution of the sediment in the individual vessels. Pulverised calcium carbonate of chemically pure qual-ity (CaCO3) was added to adjust the pH of the final mixture of the sediment to 7.0 ± 0.5. Or-ganic carbon content of the final mixture was 1.5% (test with P25) and 2.1% (test with NM-101) which was in the demanded range of 2% ± 0.5%.

Test with chironomids: emergence – TiO2 132
Water
• Purified tap water was used as test water.
12.3.2 Details of application
The nominal concentrations in the test containers with the test item were 15, 23, 39, 63, and 100 mg test item/L. Four replicates per concentration were conducted.
For each vessel, a 500 mL double concentrated stock dispersion of the nanomaterial was prepared in tap water. For the double concentrated dispersion of the final test concentration the respective amount of nanomaterial was weighed in brown glass vessels using a suitable balance. Five hundred millilitres of tap water was added, the mixture was stirred (magnetic stirrer, 900 rpm), followed by ultrasonic treatment in a water bath (3 min, 500 W). The double concentrated stock dispersion was added thoroughly to the water column (500 mL) in the test vessels 24 h after adding the test specimens. Due to the large amount of stock dispersion the dispersion mixed with the water in the test vessels while being added. There was no fur-ther mixing to avoid disturbance of the sediment.
12.4 Test organism
Test organisms were the first instar larvae from the dipteran Chironomus riparius.
Origin of the midges: Bayer Crop Science AG, 40789 Monheim, Germany. Specimens used in the test were bred in the laboratory of the Fraunhofer IME.
Breeding conditions: Purified tap water was added to a layer of diatomaceous earth. The dipterans were fed daily with powder of TetraMin® Hauptfutter (Tetra Werke, Melle, Germany).
Pre-treatment: Four to five days before adding the test organisms to the test vessels egg masses were taken from the cultures and placed in small aerated vessels with test water at about 20 °C. First instar larvae (one day post hatching) were used in the test. As the larvae were added one day before spiking, the age of the larvae was about 2 days at day 0 (day 0 = day of spiking the water phase).
12.5 Study design
12.5.1 Study type
Laboratory study.

Test with chironomids: emergence – TiO2 133
12.5.2 Test duration type
Long-term.
12.5.3 Test type
Static.
12.5.4 Water media type
Fresh water.
12.5.5 Type of sediment
Artificial sediment.
12.5.6 Total exposure duration
The exposure period was 28 days.
• P25: April 21 - May 19, 2010
• NM-101: May 27 - June 24, 2010
No post-exposure observation period was performed.
12.5.7 Test conditions
Hardness: Test start 110 – 150 mg/L as CaCO3 equivalents (de-manded threshold value of 400 mg/L as CaCO3 equi-valents) Test end: 100 – 120 mg/L as CaCO3 equivalents in the controls and 210 mg/L as CaCO3 equivalents in one representative replicate of the highest test concentration
P25
Test temperature: 20.3°C (permitted range: 20 ± 2°C)
pH: 7.9 – 8.4 (permitted range: pH 6 – 9)
Dissolved oxygen: About 100% at test start and test end (demanded threshold value: 60%)
Ammonia: Test start: 0.8 - 1.0 (control); 0.2 (highest test concent-ration)

Test with chironomids: emergence – TiO2 134
Test end: 8.0 - 10.2 (control); 9.2 (highest test concent-ration)
Nominal concentrations: The nominal concentrations in the test containers with TiO2 nanoparticles were 15, 23, 39, 63, and 100 mg test item/L.
Details on test conditions: The light intensity was measured using an illuminance meter (MINOLTA) with photometric sensor in lux. With 748 – 850 lux the permitted range of about 500 - 1000 lux was kept.
Hardness: At test start 130 – 150 mg/L CaCO3 equivalents in the control and 140 mg/L CaCO3 equivalents in one repre-sentative replicate of the highest test concentration (demanded threshold value of 400 mg/L as CaCO3 equivalents) Test end: 150 – 170 mg/L CaCO3 equivalents in the control and 170 mg/L CaCO3 equivalents in one repre-sentative replicate of the highest test concentration.
NM-101
Test temperature: 20.3 °C -20.5°C (permitted range: 20 ± 2 °C)
pH: 7.8 – 8.7 (permitted range: pH 6 – 9)
Dissolved oxygen: About 100% at test start and test end (demanded threshold value: 60%)
Ammonia: Test start: 0.5 - 0.9 (control); 0.7 (highest test concent-ration) Test end: 0.1 - 7.5 (control); 0.6 (highest test concent-ration)
Nominal concentrations: The nominal concentrations in the test containers with TiO2 nanoparticles were 15, 23, 39, 63, and 100 mg test item/L.
Details on test conditions: The light intensity was measured using an illuminance meter (MINOLTA) with photometric sensor in lux. With 771 – 826 lux the permitted range of about 500 – 1000 lux was kept.
According to the guideline a test with a reference substance is not compulsory. However, 2-chloracetamid was tested in a sediment-water chironomid toxicity test using spiked sediment (OECD 218).
Reference substance:

Test with chironomids: emergence – TiO2 135
12.5.8 Other information on materials and methods
The control consists of sediment, tap water and chironomids. Four replicates per control were conducted.
Control treatment
Data evaluation:
Statistical method
Numerical values in this report are frequently rounded to a smaller degree of precision (num-ber of digits) than used in the actual calculation. Minor differences in the results obtained from calculations with the rounded values compared to the values obtained with higher preci-sion values are possible. They are, however, well within the limits of the experimental accu-racy and thus of no practical concern.
Statistical calculations: The number of emerged males and females were determined. The results of the listed bio-logical parameters (total, males, females) were compared by a suitable test for multiple com-parisons with a control after testing variance homogeneity. All statistical tests were per-formed with the computer software ToxRat Professional version 2.10.4.1 (ToxRat® Solutions GmbH).
TetraMin® Hauptfutter powder was used for feeding the larvae. According to the guideline the food ration for the first 10 days was 0.25 – 0.5 mg TetraMin® /larvae/day, from day 10 on the food ration was increased to 0.5 – 1.0 mg TetraMin® /larvae/day.
Food
Round glass beakers (3L) were used as test vessels. The vessels were filled to a height of 2 cm with wet artificial sediment (corresponding to 370 g dry mass). The overlaying water was 8 cm high (ratio sediment:water about 1:4). The containers were covered with glass plates. After 10 days, emergence traps were placed on the test vessels, the glass plates re-mained on the emergence traps to avoid evaporation. Aeration of overlaying water was pro-vided through a glass pipette fixed 2-3 cm above the sediment layer (at least 1 bubble /second).
Test container
Sediment was placed into the test vessels. Four hundred millilitres of tap water was added and the sediment-water system was left under gentle aeration for several days prior to add-ing the test organisms. Batches of twenty larvae were placed into each vessel.
Test procedure
After incubation for 24 h, 500 mL of the freshly prepared stock dispersion of the nanoparti-cles was added. A further 100 mL of tap water was used to rinse the vessels containing the stock dispersions. To avoid separation of sediment ingredients during addition of test water and stock dispersion, the surface of the water column was covered with a stainless steel disc
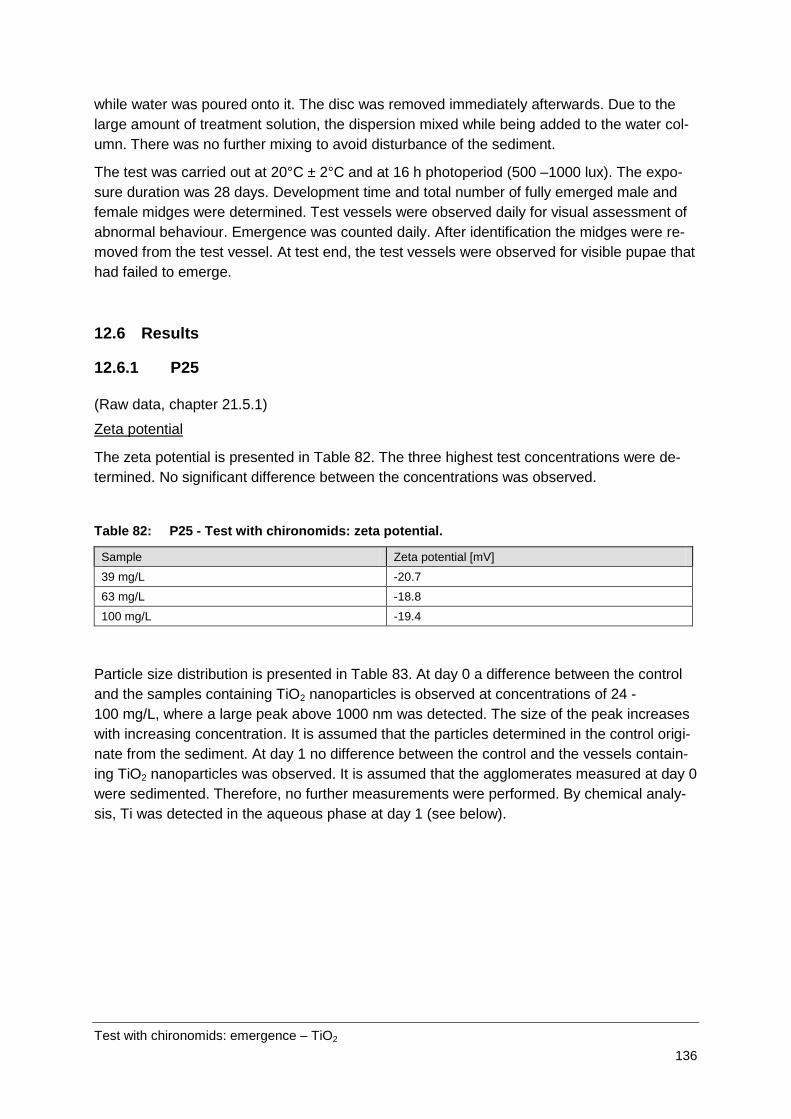
Test with chironomids: emergence – TiO2 136
while water was poured onto it. The disc was removed immediately afterwards. Due to the large amount of treatment solution, the dispersion mixed while being added to the water col-umn. There was no further mixing to avoid disturbance of the sediment.
The test was carried out at 20°C ± 2°C and at 16 h photoperiod (500 –1000 lux). The expo-sure duration was 28 days. Development time and total number of fully emerged male and female midges were determined. Test vessels were observed daily for visual assessment of abnormal behaviour. Emergence was counted daily. After identification the midges were re-moved from the test vessel. At test end, the test vessels were observed for visible pupae that had failed to emerge.
12.6 Results
12.6.1 P25
(Raw data, chapter 21.5.1)
The zeta potential is presented in
Zeta potential
Table 82. The three highest test concentrations were de-termined. No significant difference between the concentrations was observed.
Table 82: P25 - Test with chironomids: zeta potential.
Sample Zeta potential [mV] 39 mg/L -20.7 63 mg/L -18.8 100 mg/L -19.4
Particle size distribution is presented in Table 83. At day 0 a difference between the control and the samples containing TiO2 nanoparticles is observed at concentrations of 24 - 100 mg/L, where a large peak above 1000 nm was detected. The size of the peak increases with increasing concentration. It is assumed that the particles determined in the control origi-nate from the sediment. At day 1 no difference between the control and the vessels contain-ing TiO2 nanoparticles was observed. It is assumed that the agglomerates measured at day 0 were sedimented. Therefore, no further measurements were performed. By chemical analy-sis, Ti was detected in the aqueous phase at day 1 (see below).

Test with chironomids: emergence – TiO2 137
Table 83: P25 - Test with chironomids: particle size distribution (spiked water).
Concentration [mg/L]
Z-Average [nm] 1 PDI 2 Peak 1
[nm] Peak 2 [nm]
Count rate 3 [kcps]
Measurement position 4 Attenuation 5
Day 0
Control 1542 0.8 616 - 110 1.25 7 15 1101 0.5 737 - 162 4.65 7 24 2019 0.5 1070 - 184 4.65 6 39 2111 0.5 1208 - 79 4.65 5 63 2262 0.4 1364 - 32 1.25 4 100 2060 0.2 1659 - 486 1.05 6 Day 1
Control 2551 1 302 - 198 4.65 8 15 970 0.6 481 - 289 4.65 9 24 1377 0.8 633 - 148 4.65 8 39 1871 0.9 525 - 67 4.65 7 63 1482 0.8 550 - 166 4.65 9 100 1971 1 535 - 149 4.65 9
1 calculated value (cumulative mean); 2 increasing value indicates increasing polydispersity (maximum: 1); 3 best results with a count rate between 150 and 500 kilo counts per second (kcps); 4 measurement position in the mid-dle of the measuring cell; 5 indicator for turbidity (high values indicate low turbidity; maximum: 11); 6 1 mg/L sam-ples below quantification limit; 7 prepared from 10 mg/L samples with 3 min of ultrasonic treatment; 8 prepared from 10 mg/L samples with 30 min of ultrasonic treatment
Titanium concentrations in the overlaying water at several measuring dates are presented in
Test item concentrations
Table 84. There was sedimentation of TiO2 nanoparticles resulting in Ti concentrations in the overlaying water below the detection limit at the end of the test. Information concerning the validity of the analyses is included in the annex. Due to the high background values (refer to Table 88 for NM-101) in this experimentTi was not analysed in the sediment.

Test with chironomids: emergence – TiO2 138
Table 84: P25 - Test with chironomids: Ti concentration.
Sample Control 15 mg/L 24 mg/L 39 mg/L 63 mg/L 100 mg/L
Ti [mg/L] 9.0 1 14.4 1 23.4 1 37.8 1 59.9 1
Day 1
Water Replicate 1 [µg/L] 12.1 522.2 621.6 645.6 466.5 467.8
Replicate 2 [µg/L] 11.6 515.2 632.7 656.7 466.3 474.6
mean value [µg/L] 11.8 518.7 627.2 651.2 466.4 471.2
Day 7
Water Replicate 1 [µg/L] 8.9 18.6 23.7 34.9 18.1 32.7
Replicate 2 [µg/L] 8.6 18.2 23.0 34.3 16.0 36.1
mean value [µg/L] 8.8 18.4 23.4 34.6 17.1 34.4
Day 14
Water Replicate 1 [µg/L] 60.7 57.9 166.0 71.6 105.0 20.4
Replicate 2 [µg/L] 58.5 56.0 171.0 69.2 102.0 19.9
mean value [µg/L] 59.6 57.0 168.5 70.4 103.5 20.2
Day 28
Water Replicate 1 [µg/L] 2 2 2 2 2 2
Replicate 2 [µg/L] 2 2 2 2 2 2
MW [µg/L] 1 nominal values for Ti (calculated from TiO2 concentrations); 2 < LOQ/LOD
Summarised results are presented in
Effects
Table 85 and Table 86.
No significant effect was observed.
The NOEC (no observed effect concentration) of the biological endpoints was ≥ 100 mg/L. EC10, EC20, and EC50 values of the biological endpoints were all > 100 mg/L.
Neither physical nor pathological symptoms were obtained. All specimens gave the impres-sion of healthy condition. Only one emerged animal died, in the second concentration (24 mg/L) at day 18.
Physical/pathological symptoms and changes in behaviour
The results of emergence are presented in
Emergence rate
Table 85.
No concentration/effect dependency on emergence rate due to P25 was detected. The NOEC for the tested species Chironomus riparius was found to be > 100 mg/L for males, females, and the combined sexes.

Test with chironomids: emergence – TiO2 139
Table 85: P25 - Test with chironomids: emergence. Emergence: number of individuals; emergence rate: % of introduced larvae; concentrations given as nominal values
Control 15 mg/L 24 mg/L 39 mg/L 63 mg/L 100 mg/L Emerged midges [Ind.] 54 58 61 53 55 53
Emergence rate midges [%] 67.5 72.5 76.2 66.2 68.7 66.2
Emerged midges [males] 20 30 32 23 31 28
Emerged midges [females] 34 28 29 30 24 25
The results for development time and rate are presented as mean values (
Development time and rate
Table 86). No in-fluence on emergence due to P25 was detected.
Table 86: P25 - Test with chironomids: development time [d] and rate [1/d]. Concentrations given as nominal values.
Control 15 mg/L 24 mg/L 39 mg/L 63 mg/L 100 mg/L Development time midges 18.5 18.5 17.5 17.5 17.2 18.5
Development rate midges 0.054 0.054 0.057 0.057 0.058 0.054
Development time males 17.5 17.5 16.4 16.4 16.4 16.9
Development rate males 0.057 0.057 0.061 0.061 0.061 0.059
Development time females 19.2 19.2 18.9 18.2 18.2 18.5
Development rate females 0.052 0.052 0.053 0.055 0.055 0.054
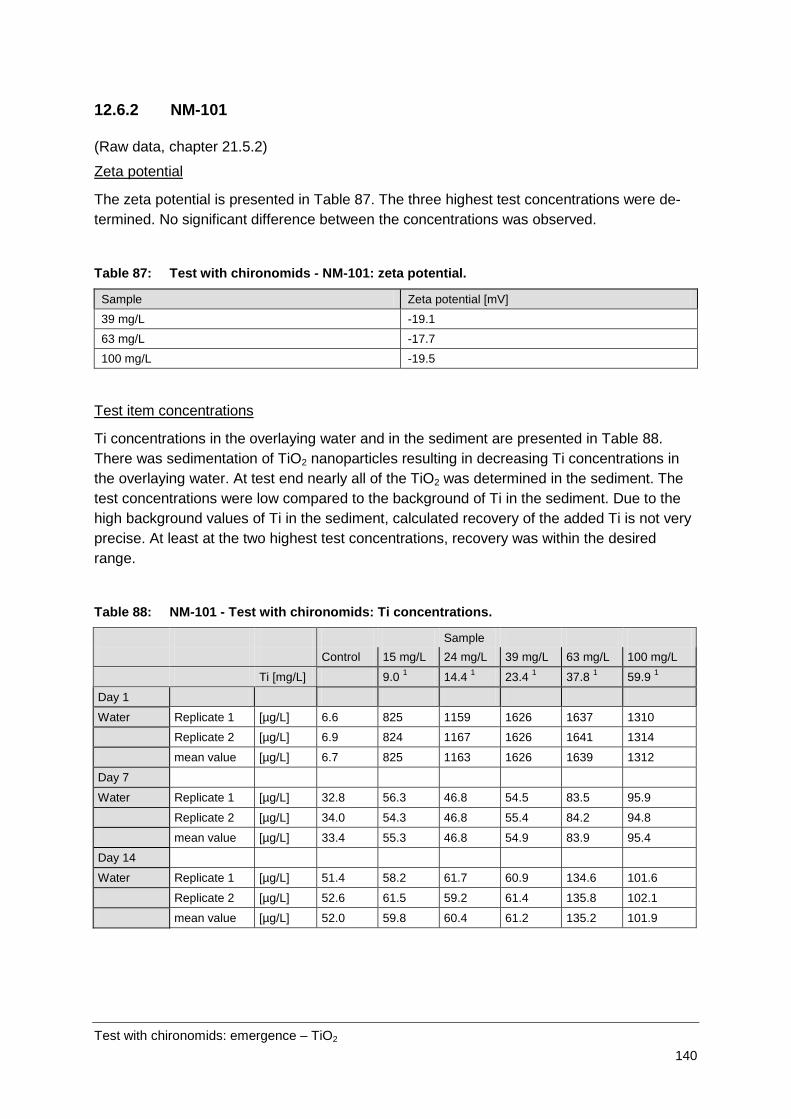
Test with chironomids: emergence – TiO2 140
12.6.2 NM-101
(Raw data, chapter 21.5.2)
The zeta potential is presented in
Zeta potential
Table 87. The three highest test concentrations were de-termined. No significant difference between the concentrations was observed.
Table 87: Test with chironomids - NM-101: zeta potential.
Sample Zeta potential [mV] 39 mg/L -19.1 63 mg/L -17.7 100 mg/L -19.5
Ti concentrations in the overlaying water and in the sediment are presented in
Test item concentrations
Table 88. There was sedimentation of TiO2 nanoparticles resulting in decreasing Ti concentrations in the overlaying water. At test end nearly all of the TiO2 was determined in the sediment. The test concentrations were low compared to the background of Ti in the sediment. Due to the high background values of Ti in the sediment, calculated recovery of the added Ti is not very precise. At least at the two highest test concentrations, recovery was within the desired range.
Table 88: NM-101 - Test with chironomids: Ti concentrations.
Sample Control 15 mg/L 24 mg/L 39 mg/L 63 mg/L 100 mg/L
Ti [mg/L] 9.0 1 14.4 1 23.4 1 37.8 1 59.9 1
Day 1
Water Replicate 1 [µg/L] 6.6 825 1159 1626 1637 1310
Replicate 2 [µg/L] 6.9 824 1167 1626 1641 1314
mean value [µg/L] 6.7 825 1163 1626 1639 1312
Day 7
Water Replicate 1 [µg/L] 32.8 56.3 46.8 54.5 83.5 95.9
Replicate 2 [µg/L] 34.0 54.3 46.8 55.4 84.2 94.8
mean value [µg/L] 33.4 55.3 46.8 54.9 83.9 95.4
Day 14
Water Replicate 1 [µg/L] 51.4 58.2 61.7 60.9 134.6 101.6
Replicate 2 [µg/L] 52.6 61.5 59.2 61.4 135.8 102.1
mean value [µg/L] 52.0 59.8 60.4 61.2 135.2 101.9

Test with chironomids: emergence – TiO2 141
Sample Control 15 mg/L 24 mg/L 39 mg/L 63 mg/L 100 mg/L
Ti [mg/L] 9.0 1 14.4 1 23.4 1 37.8 1 59.9 1
Day 28
Water Replicate 1 [µg/L] 2.82 1.83 0.979 0.266 1.35 3.49
Replicate 2 [µg/L] 3.31 1.88 0.982 0.089 2.59 2.77
MW [µg/L] 3.07 1.86 0.981 0.177 1.97 3.13
Sediment [mg/kg] 1084 1080 1163 1082 1161 1228
Sample - control - [mg/kg] -- -4 79 -2 77 144
Recovery 2 [%] -- -- 203 -- 77 150
Sediment background + addition [mg/kg] 1084 1099 1108 1123 1147 1184
Recovery [%] -- 98 105 96 101 104 1 nominal values for Ti (calculated from TiO2 concentrations); 2 Recovery considering the amount of sediment (370 g dry weight) in the vessel and assuming 100% of Ti in the sediment;
Due to the activity of the chironomids in the sediment, settled TiO2 nanoparticles were trans-ferred into the sediment. During the exposure period of 28 days the settled white powder of TiO2 on the surface of the sediment vanished. It is assumed that during their development the organisms were mainly exposed to TiO2 nanoparticles present in the sediment. Exposure via the water phase after hatching and until leaving the aqueous compartment is considered to be negligible.
Exposure
Summarised results are presented in
Effects
Table 89 and Table 90.
No significant effect for the total midges, the males and females was observed.
The LOEC, EC10, EC20, and EC50 values of the biological endpoints were > 100 mg/L. The NOEC was ≥ 100 mg/L.
Neither physical nor pathological symptoms were obtained. All specimens gave the impres-sion of healthy condition.
Physical/pathological symptoms and changes in behaviour
The results of emergence are presented in
Emergence rate
Table 89.
No concentration/effect dependency on the emergence rate due to NM-101 was detected. The NOEC (no observed effect concentration) for the tested species Chironomus riparius was found to be > 100 mg/L for males, females, and the combined sexes.

Test with chironomids: emergence – TiO2 142
Table 89: NM-101 - Test with chironomids: emergence. Emergence: number of individuals; emergence rate: % of introduced larvae; concentrations given as nominal values
Control 15 mg/L 24 mg/L 39 mg/L 63 mg/L 100 mg/L Emerged midges [Ind.] 74 69 75 60 61 74 Emergence rate midges [%] 92.5 86.25 93.75 75.0 76.25 92.5 Emerged midges [males] 36 39 38 21 37 37 Emerged midges [females] 38 30 37 39 24 37
The results of development time and rate are presented as mean values (
Development time and rate
Table 90). No in-fluence on emergence due to NM-101 was detected.
Table 90: NM-101 - Test with chironomids: development time [d] and rate [1/d]. Concentrations given as nominal values.
Control 15 mg/L 24 mg/L 39 mg/L 63 mg/L 100 mg/L Development time midges 18.5 20.3 18.3 18.7 18.1 18.0 Development rate midges 0.055 0.050 0.056 0.055 0.057 0.057 Development time males 17.0 19.3 17.0 17.1 17.6 16.5 Development rate males 0.060 0.053 0.060 0.060 0.058 0.061 Development time females 19.6 21.3 19.2 19.2 18.9 19.2 Development rate females 0.051 0.047 0.052 0.052 0.053 0.052

Test with chironomids: emergence – TiO2 143
12.7 Validity
12.7.1 P25
The test is considered of limited validity since:
• The mean emergence in the controls was 68% at test end. The minimum as stated in the guideline is 70%.
• The development time of most adults of C. riparius in the controls was between 16 and 23 days after their insertion into the test vessels. This is within the required range of 12 – 23 days. However, one further animal developed each time at days 25, 26 and 29.
All further criteria mentioned in the guidelines are fulfilled.
• At the end of the test the dissolved oxygen concentration was at least 60% of the air saturation level at the temperature used; the pH in the overlaying water was in a range of 6 – 9 in all test vessels.
• The water temperature differed by less than ± 1 °C between the vessels and was maintained within the temperature range of 20 ± 2 °C.
The test was not repeated as no difference between the controls and the treated samples was observed.
12.7.2 NM-101
The test is considered valid since:
• The mean emergence in the controls was 92.5% (corresponding to more than the minimum 70% mentioned in the guideline) at test end.
Furthermore:
• The development time of the adults of C. riparius in the controls was between 16 and 21 days after their insertion into the test vessels.
• At the end of the test the dissolved oxygen concentration was at least 60% of the air saturation level at the temperature used; the pH of the overlaying water was in a range from 6 – 9 in all test vessels.
• The water temperature differed not more than ± 1°C between the vessels and was maintained within the temperature range of 20 ± 2°C.
12.8 Additional experiments
We investigated whether it was suitable to mix the chironomid food into the sediment at test start to avoid a sorption of P25 into the food in the water phase. In the test with P25, an addi-tional four control vessels and four vessels with the highest test concentration were used to apply ground nettle. In the control vessels very low hatching was observed with 3, 10, 5, 0 hatched animals. In the vessels with the highest test concentration only 36 animals in total hatched. Due to the low hatching rate compared to the vessels with periodical feeding over

Test with chironomids: emergence – TiO2 144
the whole incubation time (e.g. control: 18 organisms vs. 54; highest concentration: 36 or-ganisms vs. 53) mixing of food with sediment was not considered a suitable method.
12.9 Conclusion
P25: Up to a concentration of 100 mg/L, P25 resulted in no negative impact on the emer-gence of larvae in a spiked water sediment test with chironomids. The NOEC was ≥ 100 mg/L.
NM-101: Up to a concentration of 100 mg/L, NM-101 resulted in no negative impact on the emergence of larvae in a spiked water-sediment test with chironomids. The NOEC was ≥ 100 mg/L.
12.10 Executive summary
The OECD Test Guideline 219 (Sediment-Water Chironomid Toxicity Using Spiked Water) was applied using Chironomus riparius as test organism. The test required feeding of the larvae at least three times per week. When testing strongly adsorbing substances the amount of food necessary to ensure survival and natural growth of the organisms may be added to the sediment before the stabilisation period. Finely ground leaves (0.5% dry weight) may be used. As the sorption behaviour of the nanoparticles was unknown, both feeding variants were applied. Mixing the total amount of food into the sediment at test start to avoid a sorption of P25 into the food that was applied to the water phase, instead of periodical feeding, was not considered a suitable method as this caused reduced emergence even in the control.
For the tests with TiO2 nanoparticles, the nominal concentrations in the test containers were 15, 23, 39, 63 and 100 mg test item/L.
There was strong sedimentation of TiO2 nanoparticles resulting in Ti concentrations below the detection limit in the overlaying water. At test end nearly all of the applied TiO2 nanoparti-cles were determined in the sediment.
P25: Concentrations up to 100 mg/L P25 did not cause a negative impact on the emergence of larvae in the sediment-water chironomid test using spiked water. The NOEC was ≥100 mg/L.
NM-101: NM-101 concentrations up to 100 mg/L did not have a negative impact on the emergence of larvae. The NOEC was ≥100 mg/L.

Test with chironomids: emergence – Ag 145
13 Emergence Test with Chironomids (OECD TG 219) - Ag
13.1 Test principle
Sediment-dwelling larvae (first instar) of the fresh water dipteran Chironomus riparius were placed in a sediment-water test system with defined artificial sediment. The overlaying water was spiked with the test item at a defined range of concentrations. The test item was applied once. Chironomid emergence was measured as the endpoint at the end of the test, i.e. after 28 days of incubation. Emergence rate, development time and rate, and sensitivity of the sexes in the treatment test systems and in the control were analysed for statistically signifi-cant differences using appropriate statistical methods.
13.2 Materials and methods
13.2.1 Test guideline
The test was performed according to:
OECD Guidelines for the Testing of Chemicals Test No. 219: Sediment-Water Chironomid Toxicity Using Spiked Water (2004)
13.2.2 GLP
The test was performed following the principles of GLP. In deviation to GLP no archiving of the raw data was performed and the Quality Assurance Unit was not involved with respect to the inspection of the test, of the raw data and of the report. All laboratory equipment (e.g. balances, thermometers, pH-meters) were controlled and documented according to GLP.
13.2.3 Test substances
• NM-300K
• NM-300KDIS (dispersant of NM-300K)
The test substances were stored in the dark at room temperature.
13.3 Analytical monitoring
For the control and for each concentration one additional vessel was used for analytical measurements. The additional vessels were treated as the control vessels and the test ves-sels used for the assessment of the nanoparticles.
Sampling
At several points of time aqueous samples (5 mL) were taken at four depths (about 1.5 cm, 3.0 cm, 4.0 cm, and 5.5 cm). The samples were combined and used for analysis.
Test with chironomids: emergence – Ag 146
Chemical analysis was performed in the samples collected from the additional vessels.
Characterization of application dispersion and test dispersion
Furthermore, using a Malvern Zetasizer, the zeta potential was measured in one vessel of each concentration and of the control three hours after application of the nanoparticles. Par-ticle size distribution was determined in the control and the test vessels with NM-300K at selected time points during the incubation period.
In all vessels temperature and pH were measured at test start and test end, as well as once a week during the study. Dissolved oxygen was measured in one representative vessel per treatment at test start and twice a week during the course of the study, and in all test vessels at the end of the test. Hardness and ammonia were measured in the controls and at the highest concentration in one test vessel at the start and the end of the study.
Physical-chemical parameters (overlaying water)
13.3.1 Details of sediment and water
Artificial sediment components
• Sphagnum peat, air-dried, finely ground 5%
• Kaolinite, air-dried 20%
• Industrial quartz sand, air-dried 75%
The test substrate was wetted with deionised water to reach a water content of 25% - 30%. According to the guideline a water content between 30% and 50% is recommended. Our experience shows that lower water content results in a more homogenous distribution of the sediment in the individual vessels. Pulverised calcium carbonate of chemically pure quality (CaCO3) was added to adjust the pH of the final mixture of the sediment to 7.0 ± 0.5. Organic carbon content of the final mixture was 2.0% which was within the demanded range of 2% ± 0.5%.
Water
• Purified tap water was used as test water.
13.3.2 Details of application
The nominal concentrations in the test containers with test item were 0.3125, 0.625, 1.25, 2.5, 5.0, and 10.0 mg test item/L. Four replicates per concentration were conducted.
A stock dispersion of 200 mg/L was prepared by mixing the respective amount of NM-300K with tap water. Fifty millilitres of the stock dispersion was used for the 10 mg/L concentration.

Test with chironomids: emergence – Ag 147
Appropriate amounts of the stock dispersion were diluted to obtain further concentrations. Each vessel was spiked with 50 mL of a suitable dispersion.
The dispersions were mixed by stirring.
13.4 Test organism
Test organisms were the first instar larvae from the dipteran Chironomus riparius.
Origin of the midges: Bayer Crop Science AG, 40789 Monheim, Germany. Speci-mens used in the test were bred in the laboratory of the Fraunhofer IME.
Breeding conditions: Purified tap water was added to a layer of diatomaceous earth. The dipterans were fed daily with powder of TetraMin® Hauptfutter (Tetra Werke, Melle, Germany).
Pre-treatment: Four to five days before adding the test organisms to the test vessels, egg masses were taken from the cultures and placed in small aerated vessels with test water at about 20 °C. First instar larvae (one day post hatching) were used in the test. As the larvae were added one day before spiking, the age of the larvae was about 2 days at day 0 (day 0 = day of spiking the water phase).
13.5 Study design
13.5.1 Study type
Laboratory study.
13.5.2 Test duration type
Long-term.
13.5.3 Test type
Static.
13.5.4 Water media type
Fresh water.

Test with chironomids: emergence – Ag 148
13.5.5 Type of sediment
Artificial sediment.
13.5.6 Total exposure duration
The exposure period was 28 days.
• NM-300K: January 12 - February 9, 2011
No post-exposure observation period was performed.
13.5.7 Test conditions
Hardness: At test start 100 – 120 mg/L CaCO3 equivalent in the control and 110 mg/L CaCO3 equivalents in one repre-sentative replicate of the highest test concentration (demanded threshold value of 400 mg/L as CaCO3 equivalents). Test end: 140 – 170 mg/L CaCO3 equivalents in the controls and 160 mg/L CaCO3 equivalents in one re-presentative replicate of the highest test concentration.
NM-300K
Test temperature: 20.3°C - 20.3°C (permitted range: 20 ± 2°C)
pH: 8.0 – 8.2 (permitted range: pH 6 – 9)
Dissolved oxygen: 93 - 97% at test start and 70 - 99% at test end (de-manded threshold value: 60%)
Ammonia: Test start: 0.3 - 0.5 (control); 0.4 (highest test concent-ration) Test end: 3.0 - 8.0 (control); 7.0 (highest test concent-ration)
Nominal concentrations: The nominal concentrations in the test containers with Ag were 0.3125, 0.625, 1.25, 2.5, 5.0, and 10.0 mg test item/L.
Details on test conditions: The light intensity was measured using an illuminance meter (MINOLTA) with photometric sensor in lux. With 621 – 682 lux the permitted range of about 500 – 1000 lux was kept.

Test with chironomids: emergence – Ag 149
According to the guideline a test with a reference substance is not necessary. However, 2-chloracetamid was tested in a sediment-water chironomid toxicity test using spiked sediment (OECD 218).
Reference substance
13.5.8 Other information on materials and methods
The control consisted of sediment, tap water and chironomids. Four replicates per control were conducted. Additionally a dispersant control with the concentration of dispersant of the highest test concentration was tested.
Control treatment
Data evaluation:
Statistical method
Numerical values in this report are frequently rounded to a smaller degree of precision (num-ber of digits) than used in the actual calculation. Minor differences in the results obtained from calculations with the rounded values compared to the values obtained with higher preci-sion values are possible. They are, however, well within the limits of the experimental accu-racy and thus of no practical concern.
Statistical calculations: The number of emerged males and females were determined. The results of the listed bio-logical parameters (total, males, females) were compared by a suitable test for multiple com-parisons with a control after testing variance homogeneity. All statistical tests were per-formed with the computer software ToxRat Professional version 2.10.4.1 (ToxRat® Solutions GmbH).
TetraMin® Hauptfutter powder was used for feeding the larvae. According to the guideline the food ration for the first 10 days was 0.25 – 0.5 mg TetraMin® /larvae/day, from day 10 on the food ration was increased to 0.5 – 1.0 mg TetraMin® /larvae/day.
Food
Round glass beakers (3L) were used as test vessels. The vessels were filled to a height of 2 cm with wet artificial sediment (corresponding to 370 g dry mass). The overlaying water was 8 cm high (ratio sediment:water about 1:4). The containers were covered with glass plates. After 10 days, emergence traps were placed on the test vessels, the glass plates remained on the emergence traps to avoid evaporation. Aeration of overlaying water was provided through a glass pipette fixed 2-3 cm above the sediment layer (at least 1 bubble /second).
Test container

Test with chironomids: emergence – Ag 150
Sediment was put into the test vessels. Nine hundred and fifty millilitres of tap water was added and the sediment-water system was left under gentle aeration for several days prior to adding the test organisms. Batches of 20 larvae were placed into each vessel.
Test procedure
After an incubation of 24 h, 50 mL of the freshly prepared stock dispersion of the nanoparti-cles was added. To avoid separation of sediment ingredients during addition of test water and stock dispersion, the surface of the water column was covered with a stainless steel disc while water was poured onto it. The disc was removed immediately afterwards. There was no further mixing to avoid disturbance of the sediment.
The test was carried out at 20 C ± 2°C and over a 16 h photoperiod (500 –1000 lux). The exposure duration was 28 days. The development time and total number of fully emerged male and female midges were determined. The test vessels were observed daily for visual assessment of abnormal behaviour. Emergence was counted daily. After identification the midges were removed from the test vessel. At test end, the test vessels were observed for visible pupae that had failed to emerge.
13.6 Results
(Raw data, chapter 21.6)
In a first test (test concentrations 15, 24, 39, 63, 100 mg/L) all chironomid larvae died. Only the larvae in the control and in the dispersant control (NM-300KDIS) with the concentration of dispersant of the highest test concentration (100 mg/L) survived. The results are presented in Table 91. Emergence occurred between day 15 and 21 of the total incubation period (4 weeks). The total number of emerged midges in the four replicates, the total number and the ratio of females and males are shown. The difference between the control and the dis-persant control was considered to be small. Whether the observed small difference indicates an effect caused by the dispersant or represents biological variability is unknown. On the basis of a range finder test (0.01, 0.1, 1.0, 10.0 mg/L) as test concentrations for the main test 0.3215, 0.625, 1.25, 2.5, 5.0, 10.0 mg/L were selected. In the following, the results of the second test are presented. As the highest test concentration, 10 mg/L was selected, which is lower than the highest concentration of for the first test by a factor of 10. As the amount of dispersant, corresponding to a silver concentration of 100 mg/L resulted in no or only a small effect, no dispersant control was included in the second test.
Table 91: Comparison of emergence of chironomids in the presence of NM-300KDIS (dis-persant of NM-300K) and the control.
Date 19.10. 20.10. 21.10. 22.10. 23.10. 24.10. 25.10. 26.10. Total
Ratio Day 14 15 16 17 18 19 20. 21 Sex Control 0 9 0 9 4 8 3 4 6 3 7 3 4 0 2 0 26 36 1.4 Dispersant (NM-300KDIS)
0 0 0 11 3 8 7 7 11 2 4 1 2 0 0 0 27 29 1.1

Test with chironomids: emergence – Ag 151
A negative zeta potential of -16.1 mV was measured for NM-300K in (5 mg/L in test medium) (
Zeta potential
Table 92).
Table 92: NM-300K - Test with chironomids: zeta potential in test medium.
Sample Zeta potential [mV] 5 mg/L -16.1 mV
The particle size distribution in all treatments is presented in
Particle size distribution
Table 93. Particles could be determined in the control indicating the measurement of sediment particles. In the vessels with NM-300K peak maximums were observed that differed from the peak maximums deter-mined in the control. The peak maximums differed at the four measurement times and can-not be interpreted so far. The high attenuation values indicated obvious polydispersity.

Test with chironomids: emergence – Ag 152
Table 93: NM-300K - Test with chironomids: particle size distribution (spiked water).
Concentra-tion [mg/L]
Z-Ave-rage [nm] 1
PDI 2
Peak 1 [nm]
Peak 2 [nm]
Count rate 3 [kcps]
Measure-ment position 4
Attenuation 5
Remarks
Day 0 Control 1861 1 515 - 140 1.5 8 0.3125 1543 1 208 [82%] 26 [18%] 73 1.5 7 count rate below
recommended range
0.625 687 0.7 244 [66%] 42 [34%] 280 1.5 8 1.25 337 0.5 269 [47%] 65 [45%] 156 1.5 7 3rd peak at 15 nm
with 8% 2.5 299 0.4 67 [50%] 271
[40%] 94 1.5 6 3rd peak at 14 nm
with 10% 5.0 174 0.3 62 [48%] 199
[45%] 379 1.5 7 3rd peak at 10 nm
with 7%
10.0 87 0.4 116 [83%] 14 [8%] 309 1.5 6 artefact at 4912 nm with 8%
Day 7 Control 1740 1 330 - 92 1.5 8 0.3125 1028 0.9 367 [89%] 54 [11%] 211 1.5 9 0.625 1052 0.7 415 [91%] 79 [9%] 91 1.5 7 1.25 1315 0.9 300 [91%] 35 [9%] 262 1.5 8 2.5 744 0.7 303 [64%] 71 [36%] 260 1.5 9 5.0 930 0.8 199 [69%] 49 [31%] 158 1.5 8 10.0 224 0.4 73 [63%] 419
[30%] 203 1.5 7 3rd peak at 14 nm
with 7% Day 14 Control 1650 0.9 577 - 112 4.65 7 0.3125 1290 0.9 368 - 92 4.65 7 0.625 841 0.6 507 - 381 4.65 7 1.25 825 0.6 492 - 355 4.65 7 2.5 - - - - - - - 5.0 1529 1 235 [94%] 21 [6%) 239 4.65 9 10.0 1035 0.8 138 - 108 4.65 7 Day 28 Control 3488 1 158 - 151 1.5 10 0.3125 2416 1 424 - 89 1.5 7 0.625 868 0.7 646 [70%] 114
[30%] 213 1.5 11
1.25 1314 0.8 453 [94%] 71 [6%] 336 1.5 8 2.5 1890 1 379 - 88 1.5 7 5.0 906 0.8 489 [93%] 87 [7%] 102 1.5 7 10.0 929 0.8 406 [91%] 74 [9%] 142 1.5 7
1 calculated value (cumulative mean); 2 increasing value indicates increasing polydispersity (maximum: 1); 3 best results with a count rate between 150 and 500 kilo counts per second (kcps); 4 measurement position in the mid-dle of the measuring cell; 5 indicator for turbidity (high values indicate low turbidity; maximum: 11); 6 1 mg/L sam-ples below quantification limit; 7 prepared from 10 mg/L samples with 3 min of ultrasonic treatment; 8 prepared from 10 mg/L samples with 30 min of ultrasonic treatment

Test with chironomids: emergence – Ag 153
Total Ag concentrations in water and sediment were determined. Furthermore the Ag+ con-centration (ion concentration of Ag) was determined in the sediment.
Test item concentrations
The Ag concentrations of the stock suspensions (20 mg/L; 200 mg/L) as well as the concen-trations in the overlaying water in the vessels only used for chemical analyses were deter-mined. Samples of 20 mL of the overlaying water were taken at three depths and combined. Only 20 mL was used for chemical analysis and the remaining volume was backfilled in the test vessels.
The results of the stock suspensions are presented in Table 94.
Recovery of the test item was between 80% (stock suspension 200 mg/L) and 92% (stock suspension 20 mg/L).
Table 94: NM-300K - Test with chironomids: Ag concentration of stock suspensions.
Replicate Measured value Nominal value Recovery
Stock suspension 20 mg/L 1 [µg/L] 18750 20000 93.8
Stock suspension 20 mg/L 2 [µg/L] 18015 20000 90.1
Stock suspension 200 mg/L 1 [µg/L] 162900 200000 81.5
Stock suspension 200 mg/L 2 [µg/L] 159750 200000 79.9
In Table 95, Figure 23, the measured silver concentrations in the aqueous phase of the test systems are summarised. The amount of silver in the sediment after 28 days is compiled in Table 96.

Test with chironomids: emergence – Ag 154
Table 95: NM-300K - Test with chironomids: Ag concentration in test.
Control 0.325 mg/L
0.625 mg/L
1.25 mg/L 2.5 mg/L 5 mg/L 10 mg/L
Day 1
Water Replicate 1 [µg/L] < LOD (3.6) 1 208 402 854 1697 3110 7022
Replicate 2 [µg/L] < LOD (3.6) 1 197 399 915 1622 3108 7106
Mean value [µg/L] < LOD (3.6) 1 203 401 885 1660 3109 7064
Recovery 2 [%] --- 64.8 64.1 70.8 66.4 62.2 70.6 Day 7
Water Replicate 1 [µg/L] < LOD (1.9) 1 90.3 85.7 164 287 355 1727
Replicate 2 [µg/L] < LOD (1.9) 1 96.6 92.8 171 288 339 1715
Mean value [µg/L] < LOD (1.9) 1 93.5 89.2 168 288 347 1721
Recovery 2 [%] --- 29.9 14.3 13.4 11.5 6.9 17.2 Day 14
Water Replicate 1 [µg/L] < LOD (1.9) 1
< LOQ (6.3) 1
< LOQ (6.3) 1
< LOQ (6.3) 1 166 192 671
Replicate 2 [µg/L] < LOD (1.9) 1
< LOQ (6.3) 1
< LOQ (6.3) 1
< LOQ (6.3) 1 177 179 666
Mean value [µg/L] < LOD (1.9) 1
< LOQ (6.3) 1
< LOQ (6.3) 1
< LOQ (6.3) 1 171 186 668
Recovery 2 [%] --- --- --- --- 6.8 3.7 6.7 Day 28
Water Replicate 1 [µg/L] < LOD (1.9) 1
< LOD (1.9) 1
< LOD (1.9) 1
< LOD (1.9) 1
< LOD (1.9) 1 109 277
Replicate 2 [µg/L] < LOD (1.9) 1
< LOD (1.9) 1
< LOD (1.9) 1
< LOD (1.9) 1
< LOD (1.9) 1 96 278
Mean value [µg/L] < LOD (1.9) 1
< LOD (1.9) 1
< LOD (1.9) 1
< LOD (1.9) 1
< LOD (1.9) 1 103 278
Recovery 2 [%] --- --- --- --- --- 2.1 2.8 1 LOD: limit of detection; LOQ: limit of quantification; 2 Recovery referring to the nominal test concentration [mg/L];

Test with chironomids: emergence – Ag 155
Table 96: NM-300K - Test with chironomids: Ag concentration in dried sediment samples after 28 days.
Sample Weighed for digestion [g]
Measured Ag conc. [µg/L]
Calculated Ag conc. in sedi-ment [mg/kg]
Mean Ag conc. in sediment ± SD [mg/kg]
Ag recovery related to 370 g of dried sediment [%]
Sediment control 3.075 0.66 0.022 0.03 ± < 0.1 -
Sediment control 3.055 1.38 0.045 Sediment 312.5 µg/L 3.082 24.1 0.783
0.77 ± < 0.1 91.2 Sediment 312.5 µg/L 3.081 23.4 0.758 Sediment 625 µg/L 3.087 36.0 1.16
1.17 ± < 0.1 69.1 Sediment 625 µg/L 3.076 36.0 1.17 Sediment 1250 µg/L 3.042 103 3.39
3.32 ± 0.1 98.4 Sediment 1250 µg/L 3.058 100 3.26 Sediment 2500 µg/L 3.079 211 6.86
6.41 ± 0.6 94.8 Sediment 2500 µg/L 3.063 182 5.95 Sediment 5000 µg/L 3.066 349 11.4
11.2 ± 0.3 82.6 Sediment 5000 µg/L 3.078 338 11.0 Sediment 10000 µg/L 3.139 328 * 2 (dilu-
tion) = 656 20.9 21.0 ± 0.2 77.8
Sediment 10000 µg/L 3.112 329 * 2 (dilu-tion) = 658 21.2
0
10
20
30
40
50
60
70
80
90
100
0 5 10 15 20 25 30
day
reco
very
[%]
312,5 µg/L625 µg/L1250 µg/L2500 µg/L5000 µg/L10000 µg/L20000 µg/L
Figure 23: NM-300K – Test with chironomids: days versus recoveries in aqueous samples. The calculated recoveries of measured values which were below LOD/ LOQ are also presented.

Test with chironomids: emergence – Ag 156
Table 97: NM-300K - Test with chironomids: concentration of Ag ions measured by DGTs in the sediment at test end.
Control 0.325 mg/L 0.625 mg/L 1.25 mg/L 2.5 mg/L 5 mg/L 10 mg/L Replicate 1 [µg/L] 0.0017 0.0024 0.0050 0.0050 0.0129 0.1364 0.4860 Replicate 2 [µg/L] 0.0015 0.0022 0.0035 0.0322 0.0122 0.4176 0.7590 Mean value [µg/L] 0.0016 0.0023 0.0042 0.0186 0.0125 0.2770 0.6225 Recovery 1 [%] --- 0.22 * 10-3 0.42 * 10-3 1.4 * 10-3 0.44 * 10-3 5.5 * 10-3 6.21* 10-3 Recovery 2 [%] --- 0.26 * 10-4 0.50 * 10-4 1.6 * 10-4 0.52 * 10-4 6.6 * 10-4 7.4 * 10-4
1 Recovery with respect to nominal concentration added to the test vessels; concentration in control sediment was considered; 2 Recovery assuming 100% of NM-300K in the sediment and considering the water in the sediment (370 g sediment, dry weight, 489.5 g fresh weight); concentration in control sediment was considered.
During the four week incubation period, sedimentation of NM-300K took place. It mainly oc-curred during the first week. At test end Ag could be determined in the water phase only at the two highest test concentrations. The remaining concentrations in the water phase were below the detection limit (0.325 – 2.5 mg/L) or low. In the test vessels with 5 and 10 mg/L, 2 and 3 % of the applied amount of NM-300K was detected. This calculation is based on the concentration in the stock suspension of 20 mg/L.
By chemical analysis, 69 - 98% of the expected NM-300K amount was detected in the sedi-ment. The quality criterion for recovery in environmental samples is ± 25%. With the excep-tion of the concentration of 0.625 mg/L, the samples were within this range. Compared to the total Ag concentration, the concentration of the Ag ions in the sediment was low. Depending on the referred value (concentration in overlaying water or concentration in water content of sediment) the percentage of the ions was about 10-3 or 10-4% (Table 97). Chemical analysis revealed that silver nanoparticles sedimented. Therefore, the concentration in the water con-tent of the sediment seems to be more suitable with respect to hazard assessment.
Further results concerning the validation of the chemical analyses are presented in chapter 21.5.1.
A summary of all endpoints is given in
Effects
Table 98. Summarised results are presented in Table 99. The presented results are based on nominal concentrations. Based on the ion concentra-tion determined with DGTs in the sediment, the effect values are lower by a factor of 10-3 – 10-4. This makes it clear that the basis of the calculation has to be fixed for regulatory pur-poses.
A concentration/effect dependency on the emergence rate due to silver was detected.

Test with chironomids: emergence – Ag 157
Table 98: NM-300K - Test with chironomids: summary of the effects. Concentrations given as nominal values.
NOEC [mg/L] 2 LOEC [mg/L] 2 EC10 [mg/L] 1,2 EC20 [mg/L] 1,2 EC50 [mg/L] 1,2
Emerged males and females 1.250 2.5 1.583 (1.350 -
1.750) 1.772 (1.566 - 1.926)
2.201 (2.041 - 2.357)
Emerged midges [males] 1.250 2.5 2.059 (n.d.) 2.175 (n.d.) 2.415 (n.d.)
Emerged midges [fe-males] 1.250 2.5 1.055 (0.825 -
1.242) 1.276 (1.051 - 1.467)
1.835 (1.610 - 2.091)
Development rate of males and females 0.625 1.250 0.925 (n.d.) 1.897 (n.d.) 7.508 (n.d.)
Development rate of males 0.625 1.250 0.994 (n.d.) 1.824 (n.d.) 5.828 (n.d.)
Development rate of females n.d. n.d. 0.934 (n.d.) 2.443 (n.d.) 15.369 (n.d.)
1 values in brackets: confidence interval; 2 n.d. = not determined due to mathematical reasons or inappropriate data
At a concentration of 5 mg/L, emerged organisms were smaller than the organisms in the control and in the concentrations ranging from 0.3125 - 0.625 mg/L. It is assumed that the size of the organisms was affected by NM-300K. In the next concentration no emergence was observed at all.
Physical/pathological symptoms and changes in behaviour
The results of emergence are presented in
Emergence rate
Table 99.
A concentration/effect dependency on the emergence rate due to silver was detected. Fur-thermore a time delayed emergence was observed in concentrations ≥ 1.25 mg/L.
Table 99: NM-300K - Test with chironomids: emergence. Emergence: number of individuals; emergence rate: % of introduced larvae; concentrations given as nominal values
Control 0.3125 mg/L 0.625 mg/L 1.25 mg/L 2.5 mg/L 5.0 mg/L 10.0 mg/L
Emerged midges [Ind.]
67 76 75 67 21 0 0
Emergence rate midges [%]
83.75 95.0 93.75 83.75 26.25 0 0
Emerged midges [males]
33 31 39 35 12 0 0
Emerged midges [females]
34 45 36 32 9 0 0

Test with chironomids: emergence – Ag 158
The results of development time and rate are presented as mean values (
Development time and rate
Table 100). A con-centration/response curve of emergence due to silver was detected.
Table 100: NM-300K - Test with chironomids: development time [d] and rate [1/d]. Concentrations given as initially measured values
Control 0.3125 mg/L 0.625 mg/L 1.25 mg/L 2.5 mg/L 5.0 mg/L 10.0 mg/L
Development time midges
18.7 20.0 19.1 22.1 24.8 --- ---
Development rate midges
0.054 0.051 0.053 0.046 * 0.041 * --- ---
Development time males
17.8 18.7 17.8 21.3 24.1 --- ---
Development rate males
0.057 0.054 0.057 0.047 * 0.042 * --- ---
Development time females
19.6 20.8 20.3 22.9 24.5 --- ---
Development rate females
0.051 0.049 0.050 0.044 * 0.041 --- ---
* Significant deviation when compared with control (total midges, males: Williams Multiple Sequential t-test, p < 0.05; one-sided; females: multiple sequentially rejective comparisons after Welch of treatments with "control" by the t test procedure, p < 0.05; one-sided)
The overlaying water changed colour during the incubation period and the sedimentation of NM-300K.
Observations
Day 2: The overlaying water of the vessels with NM-300K had a yellowish colour. The vessel with the highest test concentration was slightly brownish.
Day 5: A ginger colour of the water body at concentrations of 0.3125 - 5.0 mg/L was ob-served. At the highest test concentration the water body had turned to red.
Day 8: In all vessels the colour of the overlaying water was brown, with the intensity concent-ration dependant.
It is assumed that the change in colour was based on agglomeration and sedimentation. Due to the high polydispersity (see Table 93), DLS measurements have limited information and the process in the test vessels cannot be proven in detail.
13.7 Validity
The test is considered valid since:
• The mean emergence in the controls was 83.8% (corresponding to the minimum 70% mentioned in the guideline) at test end.
Furthermore:

Test with chironomids: emergence – Ag 159
• The development time of the adults of C. riparius in the controls was between 15 and 25 days after their insertion into the test vessels.
• At the end of the test the dissolved oxygen concentration was at least 60% of the air saturation level at the temperature used; the pH of the overlaying water was in a range from 6 – 9 in all test vessels.
• The water temperature differed by less than ± 1°C between the vessels and was maintained within the temperature range of 20 ± 2°C.
13.8 Additional experiments
In a pre-test, we investigated whether it was suitable to mix the total food in the sediment at test start to avoid a sorption of the test item to the food in the water phase. Those experi-ments were done only for TiO2 nanoparticles. For complete information, the results are also mentioned in the chapter for silver. Four control vessels and four vessels with the highest test concentration were used to examine the effects of applying ground nettle. In the control vessels very low hatching was observed with 3, 10, 5, 0 hatched animals. In the vessels with the highest test concentration 36 animals hatched in total. Due to the low hatching rate com-pared to the vessels with periodical feeding over the whole incubation time (e.g. control: 18 organisms vs. 54; highest concentration: 36 organisms vs. 53) mixing of food with sediment was not considered a suitable method.
13.9 Conclusion
NM-300K showed a concentration-effect curve for the emergence of larvae in a spiked water sediment test with chironomids. Based on nominal concentrations, the NOEC was 1.250 mg/L (total emergence and emerged males and females) and 0.625 mg/L (total development rate and development rates of males), respectively. For females no NOEC could be calculated as there was a statistically significant effect at 1.25 mg/L, whereas no effect was observed at 2.5 mg/L and a 100% ef-fect was observed at 5 and 10 mg/L. Based on the ion concentration in the sediment deter-mined with DGTs, the effect values are lower by a factor of 10-3 – 10-4.
13.10 Executive summary
NM-300K was tested in the OECD Test Guideline 219 (Sediment-Water Chironomid Toxicity Using Spiked Water) using Chironomus riparius as the test organism. The organisms were fed three times per week. The nominal concentrations in the test containers with silver were 0.3125, 0.625, 1.25, 2.5, 5 and 10 mg test item/L.
There was strong sedimentation of silver resulting in Ag concentrations below the detection limit in the overlaying water. At test end nearly all of the applied Ag was identified in the sediment.
The concentration of the Ag ions in the sediment was determined using DGTs. Compared to the total Ag amount the concentration of the Ag ions in the sediment was low. Depending on

Test with chironomids: emergence – Ag 160
the referred value (nominal concentration in overlaying water or concentration in water con-tent of sediment) the percentage of the ions was about 10-3 or 10-4%.
The dispersant used for stabilising the Ag nanoparticles had no negative effect on the emer-gence of the chironomids.
The application of NM-300K resulted in a clear concentration-effect curve. The NOEC value for total emergence and for emerged males and females was 1.250 mg/L. The NOEC value for the total development rate and for the development rates of males was 0.625 mg/L. For females a NOEC could not be calculated as there was a statistically significant effect at 1.25 mg/L, whereas no effect was determined at 2.5 mg/L and a 100% effect was measured at 5 and 10 mg/L.
The presented results are based on nominal concentrations. Based on the ion concentration determined with DGTs in the sediment, the effect values are lower by a factor of 10-3 – 10-4.
This illustrates that the basis of the calculation has to be clearly fixed for regulatory purposes.
A summary of the results obtained for all endpoints is presented in Table 101.
Table 101: NM-300K – test with chironomids: summary of effect values. Concentrations given as nominal values.
NOEC [mg/L] 2 LOEC [mg/L] 2 EC10 [mg/L] 1,2 EC20 [mg/L] 1,2 EC50 [mg/L] 1,2
Emerged males and females 1.250 2.5 1,583
(1.350 - 1.750) 1.772 (1.566 - 1.926)
2.201 (2.041 - 2.357)
Emerged midges [males] 1.250 2.5 2.059 (n.d.) 2.175 (n.d.) 2.415 (n.d.)
Emerged midges [females] 1.250 2.5 1.055
(0.825 - 1.242) 1.276 (1.051 - 1.467)
1.835 (1.610 - 2.091)
Development rate of males and females 0.625 1.250 0.925 (n.d.) 1.897 (n.d.) 7.508 (n.d.)
Development rate of males 0.625 1.250 0.994 (n.d.) 1.824 (n.d.) 5.828 (n.d.)
Development rate of females n.d. n.d. 0.934 (n.d.) 2.443 (n.d.) 15.369 (n.d.)
1 values in brackets: confidence interval; 2 n.d. = not determined due to mathematical reasons or inappropriate data

Test with chironomids: emergence – Au 161
14 Emergence Test with Chironomids (OECD TG 219) - Au
14.1 Test principle
Sediment-dwelling larvae (first instar) of the fresh water dipteran Chironomus riparius were placed in a sediment-water test system with defined artificial sediment. The overlaying water was spiked with the test item at a defined range of concentrations. The test item was applied once. Chironomid emergence was measured as the endpoint at the end of the test, i.e. after 28 days of incubation. Emergence rate, development time and rate, and sensitivity of the sexes in the treatment test systems and in the control were analysed for statistically signifi-cant differences using appropriate statistical methods.
14.2 Materials and methods
14.2.1 Test guideline
The test was performed according to OECD Guidelines for the Testing of Chemicals Test No. 219: Sediment-Water Chironomid Toxicity Using Spiked Water (2004).
14.2.2 GLP
The test was performed following the principles of GLP. In deviation to GLP no archiving of the raw data was performed and the Quality Assurance Unit was not involved with respect to the inspection of the test, of the raw data and of the report. All laboratory equipment (e.g. balances, thermometers, pH-meters) were controlled and documented according to GLP.
14.3 Test substances
• NM-330: gold nanoparticles in dispersant
• NM-330DIS: dispersant of the gold nanoparticles
14.4 Analytical monitoring
For the control and for each concentration one additional vessel was used especially for ana-lytical measurements. The additional vessels were treated as the control vessels and the test vessels used for the assessment of the nanoparticles.
Sampling
At day 0 the pure substance and the double concentrated stock suspensions were meas-ured. During the incubation period, 20 mL of test solution were taken from the middle of the water phase at day 1, 7 and 28 for chemical analysis. Furthermore the concentration in the sediment was determined at the end of the incubation period (day 28).

Test with chironomids: emergence – Au 162
Zeta-potential and particle size distribution of the nanoparticles were measured with a Mal-vern Zeta-Sizer. At day 0 the applied suspensions and the purified tap water used for the control were characterised. Furthermore, particle size distribution was determined in the con-trol and the test vessels with NM-330 at selected time points during the incubation period. The samples collected for the chemical analysis were used.
Characterisation of application dispersion and test dispersion
In all vessels temperature and pH were measured at test start and test end as well as once a week during the study. Dissolved oxygen was measured in one representative vessel per treatment at test start and twice a week during the course of the study, and in all test vessels at the end of the test. Hardness and ammonia were measured in the controls and at the highest concentration in one test vessel at the start and the end of the study.
Physical-chemical parameters (overlaying water)
14.4.1 Details on sediment and water
Sphagnum peat, air-dried, finely ground 5%
Artificial sediment components
Kaolinite, air-dried 20%
Industrial quartz sand, air-dried 75%
The test substrate was wetted with deionised water to reach a water content of 25% - 30%. According to the guideline a water content between 30% and 50% is recommended. Our experience shows that lower water content results in a more homogenous distribution of the sediment in the individual vessels. Pulverised calcium carbonate of chemically pure quality (CaCO3) was added to adjust the pH of the final mixture of the sediment to 7.0 ± 0.5. Organic carbon content of the final mixture was 1.8% which was within the demanded range of 2% ± 0.5%.
Purified tap water was used as test water.
Water
14.4.2 Details on application
The nominal concentrations in the test containers with the test item (NM-330; NM-330DIS) were 50%, 10%, 1%, and 0.1% test item/L. Four replicates per concentration were con-ducted.
For each vessel a 135 mL stock dispersion of the nanomaterial was prepared in tap water. For the double concentrated stock dispersions of the final test concentrations a measuring cylinder was filled with the respective volume of nanomaterial and adjusted to 135 mL with

Test with chironomids: emergence – Au 163
purified tap water. The stock dispersion was added thoroughly to the water column in the test vessels 24 h after adding the test specimens. An additional 10 mL of purified tap water was used to rinse the measuring cylinder. Due to the large amount of treatment solution, the dis-persion mixed with the water column while being added. No further mixing was applied in order to avoid a disturbance of the sediment.
14.5 Test organism
Test organisms were the first instar larvae from the dipteran Chironomus riparius.
Origin of the midges: Bayer Crop Science AG, 40789 Monheim, Germany. Specimens used in the test were bred in the laboratory of the Fraunhofer IME.
Breeding conditions: Purified tap water was added to a layer of diatomaceous earth. The dipterans were fed daily with powder of TetraMin® Hauptfutter (Tetra Werke, Melle, Germany).
Pretreatment: Four to five days before adding the test organisms to the test vessels egg masses were taken from the cultures and placed in small aerated vessels with test water at about 20°C. First instar larvae (one day post hatching) were used in the test. As the larvae were added one day be-fore spiking, the age of the larvae was about 2 days at day 0 (day 0 = day of spiking the water phase).
14.6 Study design
14.6.1 Study type
Laboratory study.
14.6.2 Test duration type
Long-term.
14.6.3 Test type
Static.
14.6.4 Water media type
Fresh water.

Test with chironomids: emergence – Au 164
14.6.5 Type of sediment
Artificial sediment.
14.6.6 Total exposure duration
The exposure period was 28 days. November 24 – December 22, 2011.
No post-exposure observation period was performed.
14.6.7 Test conditions
Hardness: Test start: 110 – 130 mg/L as CaCO3 equivalents in the controls and in one representative replicate of the high-est test concentration (demanded threshold value of 400 mg/L as CaCO3 equivalents). Test end: 100 – 140 mg/L as CaCO3 equivalents in the controls and in one representative replicate of the high-est test concentration
NM 330
Test temperature: 20°C (permitted range: 20 ± 2°C)
pH: Permitted range: pH 6 – 9 Test start: 7.3 -7.8 (in permitted range) Test end
Dissolved oxygen:
: Control: 7.9 – 8.5 (in permitted range) Gold:8.1 – 8.5 (in permitted range) Dispersant: 8.5 - 9.4 (in permitted range; one replicate of 50 % dispersant: 9.5 – just outside the permitted range) No peculiarities during the test
Test start: about 100 % in all test vessels During the test: Control: 68 – 91 % Gold: 68 – 96 % (exception: December 13: 49 %) Dispersant: oxygen concentration in water phase de-pendant on concentration of dispersant 0.1 – 10 %: 62 – 93 % (exception: 10 %, November 29 36 %, aeration was increased; 1 %, December 12: 56 %, aeration was increased resulting in values above the threshold value of 60 % at the next measuring date) 50 %: 49 % at test start, aeration was increased result-ing in values above the threshold value of 60 % at the next measuring date; values below the threshold value

Test with chironomids: emergence – Au 165
from December 12 on, increased aeration resulted in no improvement.
Ammonia: Test start: 0.8 – 0.9 mg/L in the controls and in one rep-resentative replicate of the highest test concentration (one replicate in the control: 0.5) Test end
Nominal concentrations: The nominal concentrations in the test containers with gold and dispersant were 50%, 10%, 1%, 0.1%. For gold the concentrations corresponded to 25, 5, 0.5 and 0.05 mg /L.
: Control: 23 – 28 mg/L Gold (highest test concentration): 27 mg/L Dispersant: 0.1 mg/L
Details on test conditions: The light intensity was measured using an illuminance meter (MINOLTA) with photometric sensor in Lux. With 523 – 577 lux the permitted range of about 500 - 1000 lux was kept.
Reference substance:
According to the guideline a test with a reference substance is not necessary. How-ever, 2-chloracetamid was tested in a sediment-water chironomid toxicity test using spiked sediment (OECD 218).
14.6.8 Other information on materials and methods
The control consists of sediment, tap water and chironomids. Four replicates per control were conducted. Additionally a dispersant control with the concentration of dispersant of the highest test concentration was tested.
Control treatment
Data evaluation:
Statistical method
Numerical values in this report are frequently rounded to a smaller degree of precision (num-ber of digits) than used in the actual calculation. Minor differences in the results obtained from calculations with the rounded values compared to the values obtained with higher preci-sion values are possible. They are, however, well within the limits of the experimental accu-racy and thus of no practical concern.
Statistical calculations:
The number of emerged males and females were determined. The results of the listed bio-logical parameters (total, males, females) were compared by a suitable test for multiple com-parisons with a control after testing variance homogeneity. All statistical tests were per-

Test with chironomids: emergence – Au 166
formed with the computer software ToxRat Professional version 2.10.4.1 (ToxRat® Solutions GmbH).
TetraMin® Hauptfutter powder was used for feeding the larvae. According to the guideline the food ration for the first 10 days was 0.25 – 0.5 mg TetraMin® /larvae/day, from day 10 on the food ration was increased to 0.5 – 1.0 mg TetraMin® /larvae/day.
Food
Glass vessels (600 mL) were used as test vessels. The vessels were filled up to a height of 1.5 cm with 128.2 g wet artificial sediment (corresponding to 95 g dry mass). The overlaying water was 6 cm high (ratio sediment:water about 1:4). The containers were covered with glass plates. After 10 days, emergence traps were placed on the test vessels, the glass plates remained on the emergence traps to avoid evaporation. Aeration of overlaying water was provided through a glass pipette fixed 2-3 cm above the sediment layer (at least 1 bub-ble /second).
Test container
Sediment was put into the test vessels. One hundred and twenty five millilitres of tap water was added and the sediment-water system was left under gentle aeration for several days prior to adding the test organisms. Batches of 20 larvae were placed into each vessel.
Test procedure
After an incubation period of 24 h, 135 mL of the freshly prepared stock dispersion of the nanoparticles was added. A further 10 mL of tap water were used to rinse the vessels con-taining the stock dispersions. To avoid separation of sediment ingredients during addition of test water and stock dispersion, the surface of the water column was covered with a stainless steel disc while water was poured onto it. The disc was removed immediately afterwards. Due to the large amount of stock dispersion the dispersion admixed while being added to the water column. No further mixing was applied in order to avoid disturbance of the sediment.
The test was carried out at 20 C ± 2°C and at 16 h photoperiod (500 –1000 lux). The expo-sure duration was 28 days. Development time and total number of fully emerged male and female midges were determined. Test vessels were observed daily for visual assessment of abnormal behaviour. Emergence was counted daily. After identification the midges were re-moved from the test vessel. At test end, the test vessels were observed for visible pupae that had failed to emerge.
14.7 Results
The zeta potential is presented in Table 102. The values were measured in dilution water. The applied concentrations reflect the situation in the test. The highest concentration of NM-330 resulted in a zeta potential of -48 mV. With decreasing concentration the zeta potential

Test with chironomids: emergence – Au 167
became less negative. The concentration of 10% NM-330 resulted in a zeta potential of -24 mV.
Table 102: NM-330 – Test with chironomids: zeta potential. Concentrations given as percentage of NM-330 in dilution water
Sample Zeta potential [mV] 10% -24.2 (± 0.4) 50% -48.0 (± 1.1)
Particle size distribution is presented in Table 103. Only reliable results are presented. In the distributed NM-330 suspension the particle size was about 45 – 50 nm. Dilution resulted in larger agglomerates and worse poly dispersity indices in the stock suspensions. Measure-ments below 2% NM-330 did not show acceptable results. It is assumed that the concentra-tions were too low for the measurement. On days 1, 7, 14 and 28 in one vessel per test con-centration the particle size distribution was determined. However, at day 1 only in the highest test concentration acceptable results were obtained. All further measurements revealed no acceptable results. Sedimentation of NM-330 as well as re-suspension of sediment particles in the overlaying water resulted in values unsuitable for interpretation.
Table 103: Particle size distribution in the chironomid test (spiked water) with NM-330 (gold nanoparticles in dispersant). Mean value of 10 measurements; concentration given as percentage of NM-330 in the medium (application suspension or in test vessels)
Concentration [mg/L]
Z-Average [nm] 1 (±SD) 4
PDI 2 (±SD) 4
Peak 1 [nm] (±SD) 4
Peak 2 [nm] (±SD) 4
Peak 1 [%]
Peak 2 [%]
Attenu-ation 3
Re-mark
Day 0 Appli-cation sus-pension
2.0% 118.1 (±6.9)
0.3 (±0.03)
159.0 (±9.5) - 96 3 8
Peak 2 = arte-fact
20% 342.8 (±50.8)
0.4 (±0.05)
497.0 (±69.2)
36.8 (±46.9) 96 4 6
100% 49.1 (±22.2)
0.2 (±0.03)
45.7 (±3.4)
8.2 (±1.0) 77 19 6
Day 1 Test medium
50% 82.3 (±2.7) 0.4 (±0.06)
108.5 (±8.9) - 90 10 6
Peak 2 = arte-fact
1 calculated value (cumulative mean); 2 increasing value indicates increasing polydispersity (maximum: 1); 3 indi-cator for turbidity (high values indicate low turbidity; maximum: 11); All presented results have a count rate be-tween 150 and 500 kilo counts per second (kcps), which creates the best results stated by Malvern. Results pre-sented are the best results out of ten in accordance to the quality report. For a better comparison of the results the measurement position was fixed at 1.5 mm from the wall of the cell for each measurement; 4 SD = standard deviation

Test with chironomids: emergence – Au 168
The concentrations of Au are presented in Table 104. The gold concentration measured in NM-330 was lower than the value reported by the producer (expected: 0.01% corresponding to 100 mg/L; measured 43.8 mg/L). The NIST reference material 8011 (gold nanoparticles, nominal diameter 10 nm) was analysed along with the samples of the test; recovery amounted to about 100%. The recovery of the applied standard Au solution was about 100% also. Details of the analytical method used by the producer of NM-330 are unknown. There-fore, the discrepancy in the results cannot be explained. Due to the discrepancy between measured and communicated values, the concentrations of the ecotoxicological analyses are presented as % NM-330 (v/v) in the test suspension.
Using the measured concentration as 100%, it is obvious that at day 0 the concentrations in the stock suspensions were above quantification and detection limits were in the range of the expected values (expected 2% - measured 1.7%; expected 20% - measured 18%). During the incubation period of 28 days sedimentation occurred. In the highest test concentration, at the end of the test only 0.6% of NM-330 was detected. The lower test concentrations were below the detection limit.
At the end of the incubation period the Au concentration in the sediment was determined. The results are presented in Table 105. The Au concentration in the sediment of the control samples and of the lowest test concentration were below the detection limit. The other test concentrations showed about 50% of the expected concentration. We cannot explain the missing 50% of the substance. Sorption of 50 % at the walls of the test vessels, independent of the test concentrations, is considered to be unreliable. The spacing factors between the concentrations that were above the detection limit fit, and the recovery of the reference for the chemical analyses was about 100%. Additionally, a nano-particular gold reference mate-rial (NIST standard) was applied. The concentrations of the stock suspensions were correct and the required volumes of the stock suspensions were added to the test vessels at test start according to the documentation of the procedure. The required volumes were 50% of the overlaying water. Therefore, the addition of half of the required volumes (corresponding to 50% recovery) would have been evident.

Test with chironomids: emergence – Au 169
Table 104: Concentration of Au in the test vessels with NM-330 (overlaying water). Concentrations given as percentage of NM-330 in the stock suspension (day 0) and in the test me-dium (day 1 – 28).
Sample Nominal con-centration [%]
Au concentration [µ/L]
Concentration with respect to NM-330 (pure substance) [%]
Day 0 dispersant -- -14.9 (< detection limit) --- Dilution water (= control) -- -22.0 (< detection limit) --- NM-330 0.2% 0.2 53.1 (< quantification
limit) ---
NM-330 2% 2 752 1.7 NM-330 20% 20 8010 18 NM-330 100 % (pure substance) 100 43840 100 Day 1 Control --- -1.69 (< detection limit) --- NM-330 0.1% 0.1 34.5 (< quantification
limit) ---
NM-330 1% 1 199 0.45 NM-330 10% 10 1251 2.2 NM-330 50% 50 11690 27 Day 7 Control --- NM-330 0.1% 0.1 -0.986 (< detection limit) --- NM-330 1% 1 38.9 (< quantification
limit) ---
NM-330 10% 10 222 0.5 NM-330 100% 50 4559 10 Day 28 – overlaying water Control --- NM-330 0.1% 0.1 1.6 (< detection limit) --- NM-330 1% 1 2.4 (< detection limit) --- NM-330 10% 10 -9.6 (< detection limit) --- NM-330 100% 50 254 0.6

Test with chironomids: emergence – Au 170
Table 105: Concentration of Au in the test vessels with NM-330 (sediment). Concentrations given as percentage of NM-330 in the stock suspension (day 0) and in the test me-dium (day 1 – 28).
Sample Weighed for digestion [g]
Measured Ag conc. [µg/L]
Calculated Ag conc. in sediment [mg/kg]
Mean Ag conc. in sediment ± SD [mg/kg]
Ag recovery re-lated to 95 g of dried sediment 1 [%]
Sediment control 3.061 -4.54 -0.148 < detection limit ---
Sediment control 3.022 -3.77 -0.125 Sediment (0.1%) 3.058 -2.56 -0.084
< detection limit --- Sediment (0. %) 3.042 -1.88 -0.062 Sediment (1%) 3.085 18.7 0.606
0.541 43 % Sediment (1%) 3.030 14.4 0.475 Sediment (10%) 3.022 162 5.36
6.10 48 % Sediment (10%) 3.017 207 6.85 Sediment (50%) 3.046 906 29.75
28.78 46 % Sediment (50%) 3.046 847 27.81
1 concentration of Au in NM-330 of 43,840 µg/L
Colour of test suspensions
Observations
The addition of NM-330 resulted in coloured test suspensions. At day 1 (Figure 24) the test suspensions with the highest test concentration were red. 25 % NM-330 resulted in blue-grey colour. The colours of the further test concentrations were comparable to the control and to the test vessels with dispersant (NM-330DIS). During the incubation period the colour of the test suspensions with 25% gold nanoparticles vanished. The red colour of the highest test concentration turned to grey indicating further agglomeration of the gold nanoparticles. The test vessels with dispersant turned to amber (Figure 25).
Figure 24: NM-300K – Test with chi-ronomids: Colour of the test ves-sels at day 1
Figure 25: NM-300K – Test with chironomids: Colour of the test vessels at day 12

Test with chironomids: emergence – Au 171
Oxygen concentration in the presence of dispersant (NM-330DIS)
The dispersant resulted in a decreased oxygen concentration in the water phase dependant on concentration of the dispersant. The threshold concentration of 60% oxygen saturation was not achieved in the vessels with the highest dispersant concentration after the third week even with increased aeration. In the vessels with the highest dispersant concentration a very high microbial number was determined.
As explanation for the observations, two different possibilities are listed:
Possibility 1:
Larvae are introduced → larvae die after an incubation period of several days due to a toxic effect → degradation of the larvae by microorganisms → an increased number of microor-ganisms due to the nutrients and low oxygen concentration measured in the test medium due to increased microbial activity
Possibility 2:
Larvae are introduced → low oxygen concentration → larvae die → increased number of microorganisms due to the nutrients.
The oxygen supply was controlled qualitatively on a daily basis during the working week. The aeration of all vessels was comparable. Therefore, possibility 2 is rejected. A technical defect as the reason for the low oxygen concentration is unlikely. Therefore, it is assumed that (i) microbial degradation of the dead larvae resulted in a decreased oxygen concentration and (ii) that the comparable low oxygen concentration is not the reason for the missing emer-gence.
A strong effect was observed for the dispersant (NM-330DIS) at the highest test concentra-tion. The larvae were fully grown even though there was a delay in the development. How-ever, no larvae emerged as the organisms died before hatching. In the presence of gold this effect did not occur.
Effects
For the concentrations resulting in emergence (NM-330: all test concentrations; NM-330DIS all test concentrations except the highest test concentration) no statistical difference between the treated vessels and the control was observed for the development time and the emer-gence rate. For the development rate a statistical difference was calculated. However, no concentration-effect relationship and no difference between the vessels with NM-330 (gold in dispersant) and NM-330DIS (dispersant) was obvious. Therefore, it was concluded that the statistical difference in the development rate is not substance related effect but indicates bio-logical variability.

Test with chironomids: emergence – Au 172
Neither physical nor pathological symptoms were observed in the presence of
Physical/pathological symptoms and changes in behaviour
gold nanopar-ticles. All specimens gave the impression of healthy condition. In the highest test concentration of the dispersant, full-grown larvae were observed after an incubation period of three weeks. After 28 days all larvae were dead on the surface of the sediment.
The results of emergence are presented in
Emergence rate
Table 106.
For NM-330 (gold nanoparticles in dispersant) no concentration/effect dependency on emer-gence rate was detected. The NOEC for the tested species Chironomus riparius was found to be ≥ 50% for the combined sexes. For the dispersant NM-330DIS
No difference between the sexes was observed.
the highest test concen-tration (50%) resulted in no emergence at all. The lower test concentrations showed no sta-tistical significant difference compared to the control. The NOEC for NM-330DIS was calcu-lated to be 10%.
Table 106: Emergence at test end. Emerged midges [Ind.] and emergence rate [% of intro-duced larvae]; concentrations given as nominal values.
NM-330 NM-330DIS
Control 0.1% 1.0% 10% 50% 0.1% 1.0% 10% 50% Emerged midges [Ind.] 75 76 75 77 73 75 68 73 0
Emergence rate midges [%] 93.7 95.0 93.7 91.7 91.2 93.7 85.0 91.2 0
Emerged midges [males] 36 33 42 34 40 34 31 36 0
Emerged midges [females] 39 43 33 43 33 41 37 37 0
The results for development time and rate are presented as mean values (
Development time and rate
Table 86).
For NM-330 (gold nanoparticles in dispersant)
For the three lower test concentrations of the
and the development time, no statistically sig-nificant difference was observed. The development rate showed a statistically significant dif-ference (Williams multiple sequential t-test, α = 0.05) for the combined sexes, males and females and all test concentrations, although no concentration-effect curves were obvious.
dispersant NM-330DIS the development time showed no significant difference compared to the control for the combined sexes, males and females. The development rate for the combined sexes and for males differed statistically significant from the control, although no concentration-effect curves were obtained. The de-velopment rate of the females was not statistically affected.

Test with chironomids: emergence – Au 173
Table 107: Development time [d] and rate [1/d] of midges. Concentrations given as nominal values.
NM-330 NM-330DIS
Control 0.1% 1.0% 10% 50% 0.1% 1.0% 10% 50% Development time midges 17.2 19.1 18.8 20.0 18.7 19.6 19.5 18.2 ---
Development rate midges 0.059 0.054 * 0.054 * 0.051 * 0.054 * 0.052 * 0.053 * 0.056 * --- *
Development time males 16.3 17.5 17.8 18.3 18.0 18.6 18.8 17.3 ---
Development rate males 0.062 0.058 * 0.057 * 0.056 * 0.056 * 0.055 * 0.055 * 0.059 * --- *
Development time females 18.0 20.3 19.9 21.3 19.4 20.3 19.9 19.2 ---
Development rate females 0.056 0.050 * 0.051 * 0.048 * 0.052 * 0.050 0.052 0.053 ---
* Significant deviation when compared with control (Williams Multiple Sequential t-test, p < 0.05; one-sided)
14.8 Validity
The test is considered valid since:
• The mean emergence in the controls was 93.7% (corresponding to the minimum 70% mentioned in the guideline) at test end.
• The development time of the adults of C. riparius in the controls was 17.2 days after their insertion into the test vessels (threshold concentration in the test guide-line: between 12 and 23 days).
• At the end of the test the dissolved oxygen concentration was at least 60% of the air saturation level at the temperature used; the pH of the overlaying water was in a range from 6 – 9 in all test vessels. The test vessels with 50% dispersant are an exception where a substance specific effect is assumed.
• The water temperature differed by less than ± 1°C between the vessels and was maintained within the temperature range of 20 ± 2°C.
14.9 Conclusion
The dispersant NM-330DIS in the highest test concentration showed an obvious effect. No emergence was observed. In contrast, NM-330 (gold nanoparticles in dispersant) showed no effect, even at the highest test concentration of 50%. Gold nanoparticles compensated the effect of the dispersant.

Test with chironomids: emergence – Au 174
14.10 Executive summary
NM-330 and NM-330DIS were tested in the test with Chironomus riparius with spiked water (OECD 219).
The gold concentration measured in NM-330 was lower than the value reported by the pro-ducer (expected: 0.01% corresponding to 100 mg/L; measured 43.8 mg/L). The NIST refer-ence material 8011 (gold nanoparticles, nominal diameter 10 nm) was analysed along with the samples of the test; recovery amounted to about 100%. The recovery of the applied standard Au solution was about 100% as well. As details on the analytical method used by the producer of NM-330 are not known, the discrepancy between the results cannot be ex-plained. Due to the discrepancy between measured and communicated values, the concen-trations of the ecotoxicological analyses are presented as % NM-330 (v/v) in the test sus-pension.
The nominal test concentrations in the vessels were 0, 0.1, 1, 10 and 50% of the test item/L. The test concentrations were verified by chemical analysis.
The addition of NM-330 and NM-330DIS caused coloured test suspensions. Changing col-ours during the incubation indicated a modification of the added NM-330 and NM-330DIS. Sedimentation of Au was demonstrated by chemical analysis. At day 28 of the incubation period 0.5% of the Au was detected in the water phase at the highest test concentration (50% test item). The Au concentrations determined at the lower test concentrations were below the detection limit.
General observations
The dispersant caused a concentration-dependent decrease of the oxygen concentration in the water phase. After three weeks the threshold concentration of 60% oxygen saturation was not achieved in the vessels with the highest concentration of the dispersant, not even upon increased aeration. In the vessels with the highest concentration of the dispersant a very high microbial number was determined.
The oxygen supply was controlled qualitatively on a daily basis during the working week. The aeration of all vessels was comparable. A technical defect as reason for the low oxygen con-centration is unlikely. Therefore it is assumed that (i) microbial degradation of the dead lar-vae resulted in a decrease of the oxygen concentration and (ii) that the comparably low oxy-gen concentration is not the reason for the missing emergence.
For the dispersant a strong effect was observed at the highest test concentration. The larvae were fully grown, even though their development was delayed. However, no larvae emerged as the organisms died before hatching. In the presence of gold this effect did not occur.
Effects
All effect values are summarised in Table 108. In contrast to the dispersant no effect was observed for the treatments with gold. Although statistically significant differences to the con-trol were observed for the development rates, the differences were not considered to be an effect of the test substance, since they were not related to concentration-effect relationships.
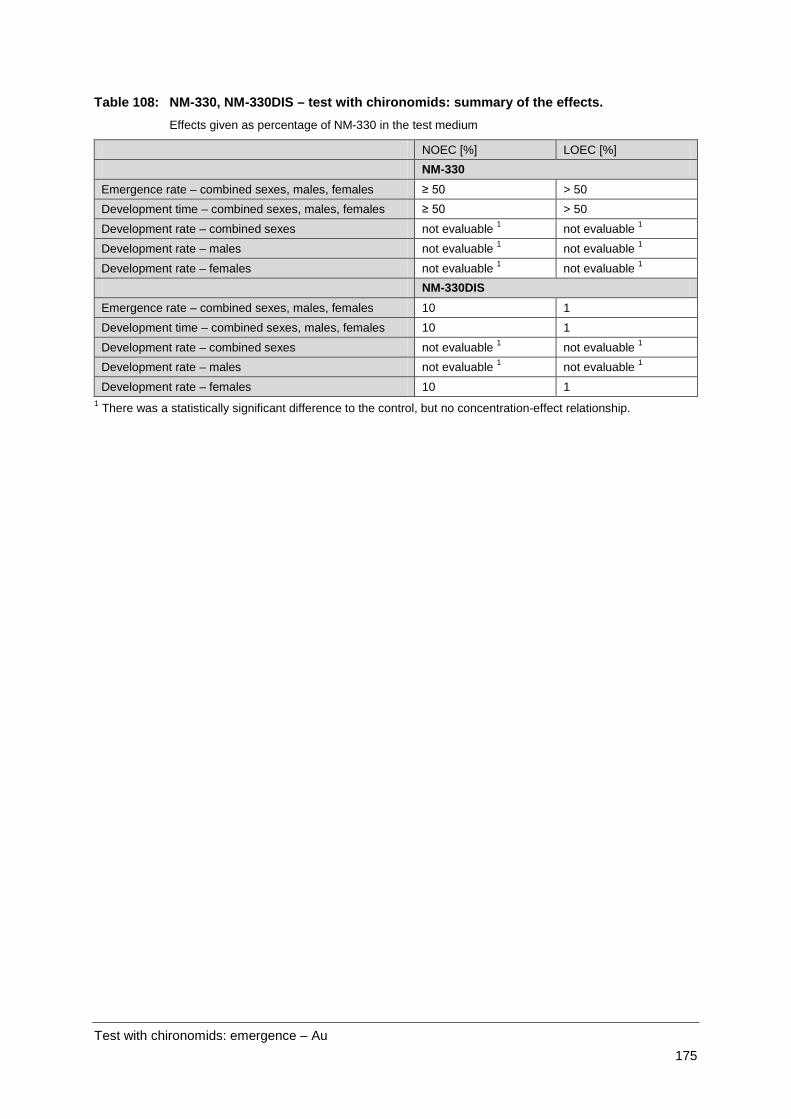
Test with chironomids: emergence – Au 175
Table 108: NM-330, NM-330DIS – test with chironomids: summary of the effects. Effects given as percentage of NM-330 in the test medium
NOEC [%] LOEC [%] NM-330
Emergence rate – combined sexes, males, females ≥ 50 > 50 Development time – combined sexes, males, females ≥ 50 > 50 Development rate – combined sexes not evaluable 1 not evaluable 1 Development rate – males not evaluable 1 not evaluable 1 Development rate – females not evaluable 1 not evaluable 1 NM-330DIS Emergence rate – combined sexes, males, females 10 1 Development time – combined sexes, males, females 10 1 Development rate – combined sexes not evaluable 1 not evaluable 1 Development rate – males not evaluable 1 not evaluable 1 Development rate – females 10 1
1 There was a statistically significant difference to the control, but no concentration-effect relationship.

Test with daphnids: reproduction – TiO2 176
15 Reproduction Tests with Daphnids (OECD TG 211) – TiO2
15.1 Test principle
Young female Daphnia (parent animals) aged less than 24 h at test start were exposed to the test item for 21 days under semi-static conditions. The test item was added to the water at a defined range of concentrations. The test solution was exchanged either daily or three times a week. At the end of the test, the total number of living offspring produced per parent animal and alive at test end was assessed. Immobilisation and reproduction rate in the treatments and in the control were analysed for statistically significant differences.
Three tests were performed:
Test 1: medium renewal three times a week
Test 2: medium renewal three times a week and daily
Test 3: medium renewal three times a week, sonication period 3 and 30 min
In the first test the results differed from those reported in the literature. Test 2 and 3 were performed for clarification of the discrepancies.
15.2 Materials and methods
15.2.1 Test guideline
The test was performed according to
OECD 211 (21.09.1998): OECD guideline for testing of chemicals – Daphnia magna Repro-duction Test.
15.2.2 GLP
The test was performed following the principles of GLP. In deviation to GLP no archiving of the raw data was performed and the Quality Assurance Unit was not involved with respect to the inspection of the test, of the raw data and of the report. Any laboratory equipment (e.g. balances, thermometers, pH-meters) was controlled and documented according to GLP.
15.2.3 Test substances
• P25 - distributed by Evonik for the OECD Sponsorship Programme.
TiO2
The test substance was stored in the dark at room temperature.
15.3 Analytical monitoring
Test concentrations and particle size distribution were determined once per week.

Test with daphnids: reproduction – TiO2 177
15.3.1 Details on sampling
Samples for analyses were taken from the stock dispersion of each concentration before test start, and from the test vessels after the incubation periods listed below together, as well as at each medium renewal. Samples from the incubated test suspensions were withdrawn from the water phase. Care was taken that sedimented particles were not removed. Sampling times were as follows:
• Day 0 (start of the test): stock dispersion and each test concentration
Medium renewal three times a week
• Day 2: each test concentration after incubation (before medium renewal) in the test vessels with daphnids
• Day 7: stock dispersion and each test concentration
• Day 9: each test concentration after incubation in the test vessels with daphnids
• Day 14: stock dispersion and each test concentration
• Day 16: each test concentration after incubation in the test vessels with daphnids.
• Day 0 (start of the test): stock dispersion and each test concentration
Medium renewal daily
• Day 1: each test concentration after incubation (before medium renewal) in the test vessels with daphnids
• Day 7: stock dispersion and each test concentration
• Day 8: each test concentration after incubation in the test vessels with daphnids
• Day 14: stock dispersion and each test concentration
• Day 15: each test concentration after incubation in the test vessels with daphnids.
15.3.2 Details on analytical methods
For test item concentrations see chapter
Characterisation of the application dispersion and test dispersion
4.1
Zeta-potential and particle size distribution was measured using a Malvern Zetasizer NanoZS. Particle size distribution was measured only in suitable (higher) test concentrations.
Test with daphnids: reproduction – TiO2 178
15.3.3 Details on test suspensions
Purified tap water was used as test water and to prepare the test suspension. The stock dis-persion was 20.0 mg/L. The test concentrations were achieved by dilution:
5.0 mg/L: 250 mg/L stock dispersion + 750 mL purified tap water
1.0 mg/L: 50 mg/L stock dispersion + 950 mL purified tap water
0.5 mg/L: 25 mg/L stock dispersion + 975 mL purified tap water
0.1 mg/L: 5 mg/L stock dispersion + 995 mL purified tap water
0.05 mg/L: 2.5 mg/L stock dispersion + 997.5 mL purified tap water
The stock dispersion and every test concentration was stirred (magnetic stirrer, 900 rpm) and treated with ultrasound in a water bath (3 min, 500 W). For the third test, 30 min of ultra-sound was included in addition to the original 3 min ultrasound.
For the renewal of the medium the test suspensions were freshly prepared.
15.4 Test organism
The test organisms were young specimens of Daphnia magna, 4 – 24 h old at test start.
Origin of the daphnids: German Federal Environment Agency, Institut für Wasser-, Boden- und Lufthygiene. Specimens used in the test were bred in the laboratory of the Fraunhofer IME.
Breeding conditions: Adult Daphnia, at least 3 weeks old, were separated from the stock population by sieving. Batches of 30 to 50 animals were held at room temperature in approx. 1.8 L dilution water for one week. During this week the daphnids were fed daily with an algal suspension (Desmodesmus subspicatus) and Liquizell (HOBBY). Algae growing in the log-phase were centrifuged and the pellet was re-suspended in a few mL of medium. 30 mL of this suspension were given to 1 L Daphnia medium. The water was changed once per week. New born Daphnia were separated by sieving, the first generation was discarded.
Holding- and dilution-water: Purified drinking water was used as holding- and dilu-tion water. The purification included filtration with acti-vated charcoal, passage through a lime-stone column and aeration. To avoid copper contamination, plastic water pipes were used in the purification system. The following water chemistry data, recorded regularly in the testing facility, were: pH, conductivity, dissolved oxygen content, content of nitrate, nitrite, ammonium (NH4+), phosphate, calcium, magnesium, total hard-
Test with daphnids: reproduction – TiO2 179
ness, alkalinity, DOC content, content of metals (cop-per, iron, manganese and zinc)
Food: The daphnids were fed during the test with suspen-sions of the unicellular alga Desmodesmus subspica-tus. The content of food in the test suspensions, measured as turbidity at 758 nm, was increased dur-ing the test from about 7 mg C/L equivalents to 15 mg C/L equivalents.
15.5 Study design
15.5.1 Study type
Reproduction, semi-static.
15.5.2 Water medium type
Fresh water.
15.5.3 Total exposure duration
21 d, for each test period;
• September 22, 2010 - October 13, 2010
• March 9, 2011 – March 30, 2011
• August 17, 2011 – September 7, 2011
No post-exposure observation period was performed.
15.5.4 Test conditions
Total hardness: 1.1 mmol/L
P25 – first test
Test temperature: 20.7 - 21.3°C (permitted range: 20 ± 2°C)
pH: 7.8 – 8.8 (permitted range: pH 6 – 9; variation less than 1.5)
Dissolved oxygen: About 100% corresponding to about 8.6 mg/L (demanded threshold value: 3 mg/L)
Salinity: 304 - 337 µS/cm
Nominal concentrations: The nominal concentrations in the test containers with TiO2 nanoparticles were 0.05, 0.1, 0.5, 1.0, 5.0 mg test item/L.

Test with daphnids: reproduction – TiO2 180
Details on test conditions:
• Test vessel: glass beakers (60 mL) filled with 50 mL test suspension; covered with glass panes
• Aeration: no
• Renewal rate of test solution (frequency/flow rate): 3 times a week
• No. of organisms per vessel: 1
• No. of vessels per concentration (replicates): 10
• No. of vessels per control (replicates): 10
TEST MEDIUM / WATER PARAMETERS
The quality of the applied water is described in Table 109.
Table 109: Chemical parameter of the holding- and dilution-water in the first test
Conductivity [µS/cm]
Alkalinity [mmol/l]
Total hard-ness [mmol/l]
Ca hardness [mmol/l]
Mg hardness [mmol/l]
TC [mg/L]
IC [mg/L]
304 - 337 2.1 – 2.9 1.1 0.9 0.2 28.2 27.2 TOC [mg/L] NO3 [mg/L] NO2 [mg/L] NH4 [mg/L] PO4 [mg/L] Cl [mg/L] Cd [µg/L]
0.9 2.8 – 3.2 < 0.005 - 0.017
< 0.01 – 0.02 0.35 – 1.04 < 0.02 < LOQ
Cr [µg/L] Cu [µg/L] Fe [µg/L] Mn [µg/L] Ni [µg/L] Pb [µg/L] Zn [µg/L] < LOQ 2.35 – 7.38 < LOQ – 4.6 < LOQ < LOQ < LOQ 4.7 – 5.8
OTHER TEST CONDITIONS
• Culture medium different from test medium: no
• Intervals of water quality measurement: once per month
• Adjustment of pH: no
• Photoperiod: light/dark cycle 16/8 h
• Light intensity: 563 - 591 lux
Total hardness: 1.0 mmol/L
P25 – second test
Test temperature: 19.9 - 20.6°C (permitted range: 20 ± 2°C)
pH: 7.9 – 8.7 (permitted range: pH 6 – 9; variation less than 1.5)
Dissolved oxygen: About 100% corresponding to about 8.6 mg/L (demanded threshold value: 3 mg/L)
Salinity: 298 µS/cm

Test with daphnids: reproduction – TiO2 181
Nominal concentrations: The nominal concentrations in the test containers with TiO2 nanoparticles were 1.0, 5.0 mg test item/L.
Details on test conditions:
• Test vessel: glass beakers (60 mL) filled with 50 mL test suspension; covered with glass panes
• Aeration: no
• Renewal rate of test solution (frequency/flow rate): 3 times a week and daily
• No. of organisms per vessel: 1
• No. of vessels per concentration (replicates): 10
• No. of vessels per control (replicates): 10
TEST MEDIUM / WATER PARAMETERS
The quality of the applied water is described in Table 110.
Table 110: Chemical parameter of the holding- and dilution-water in the second test
Conductivity [µS/cm]
Alkalinity [mmol/l]
Total hard-ness [mmol/l]
Ca hardness [mmol/l]
Mg hardness [mmol/l]
NPOC a [mg/L]
298 2.1 1.0 0.8 0.2 0.76 NO3 [mg/L] NO2 [mg/L] NH4 [mg/L] PO4 [mg/L] Cl [mg/L] Cd [µg/L] 4 < 0.005 < 0.01 1.18 < 0.02 < LOQ Cr [µg/L] Cu [µg/L] Fe [µg/L] Mn [µg/L] Ni [µg/L] Pb [µg/L] Zn [µg/L] <1.96 <6.24 <8.57 <2.26 <1.26 <9.50 < 15.2
a NPOC = non purgeable organic carbon
OTHER TEST CONDITIONS
• Culture medium different from test medium: no
• Intervals of water quality measurement: once per month
• Adjustment of pH: no
• Photoperiod: light/dark cycle 16/8 h
• Light intensity: 560 - 607 lux
Total hardness: 1.2 - 1.3 mmol/L
P25 – third test
Test temperature: 20.5 - 21.3°C (permitted range: 20 ± 2°C)
pH: 8.0 – 8.8 (permitted range: pH 6 – 9; variation less than 1.5)
Dissolved oxygen: About 100% corresponding to about 8.6 mg/L (demanded threshold value: 3 mg/L)
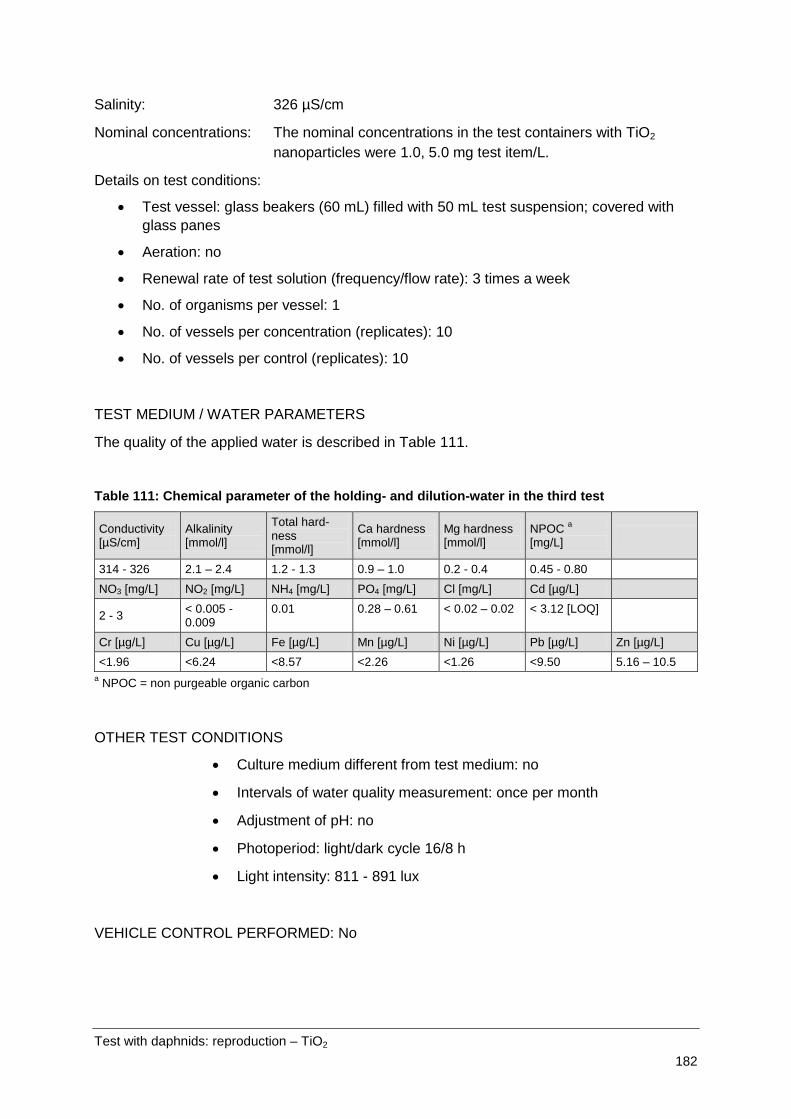
Test with daphnids: reproduction – TiO2 182
Salinity: 326 µS/cm
Nominal concentrations: The nominal concentrations in the test containers with TiO2 nanoparticles were 1.0, 5.0 mg test item/L.
Details on test conditions:
• Test vessel: glass beakers (60 mL) filled with 50 mL test suspension; covered with glass panes
• Aeration: no
• Renewal rate of test solution (frequency/flow rate): 3 times a week
• No. of organisms per vessel: 1
• No. of vessels per concentration (replicates): 10
• No. of vessels per control (replicates): 10
TEST MEDIUM / WATER PARAMETERS
The quality of the applied water is described in Table 111.
Table 111: Chemical parameter of the holding- and dilution-water in the third test
Conductivity [µS/cm]
Alkalinity [mmol/l]
Total hard-ness [mmol/l]
Ca hardness [mmol/l]
Mg hardness [mmol/l]
NPOC a [mg/L]
314 - 326 2.1 – 2.4 1.2 - 1.3 0.9 – 1.0 0.2 - 0.4 0.45 - 0.80 NO3 [mg/L] NO2 [mg/L] NH4 [mg/L] PO4 [mg/L] Cl [mg/L] Cd [µg/L]
2 - 3 < 0.005 - 0.009
0.01 0.28 – 0.61 < 0.02 – 0.02 < 3.12 [LOQ]
Cr [µg/L] Cu [µg/L] Fe [µg/L] Mn [µg/L] Ni [µg/L] Pb [µg/L] Zn [µg/L] <1.96 <6.24 <8.57 <2.26 <1.26 <9.50 5.16 – 10.5
a NPOC = non purgeable organic carbon
OTHER TEST CONDITIONS
• Culture medium different from test medium: no
• Intervals of water quality measurement: once per month
• Adjustment of pH: no
• Photoperiod: light/dark cycle 16/8 h
• Light intensity: 811 - 891 lux
VEHICLE CONTROL PERFORMED: No

Test with daphnids: reproduction – TiO2 183
Reference substance: According to the guideline a test with a reference substance is not compulsory necessary.
15.5.5 Other information on materials and methods
Less than 24 h old Daphnia magna were exposed to five concentrations of the test item un-der semi-static conditions for a period of 21 days. Test suspensions were exchanged three times a week. Algae of a stock culture were added to achieve the desired amount in the test medium (
Test performance
21.8.1, Table 278; calibration curves: Figure 59, Figure 60). Afterwards, the test organisms were added.
Data evaluation
Statistical method
In this report numerical values are frequently rounded to a smaller degree of precision (num-ber of digits) than have been used in the actual calculation. Minor differences in results ob-tained from calculations with rounded values compared to those obtained with higher preci-sion values are possible. They are, however, well within the limits of the experimental accu-racy and of no practical concern.
The parental mortality, the time to first brood and the number of offspring were used to calcu-late the intrinsic rate of population increase r as integrative parameter relevant for population effects.
Statistical calculations The results of the listed biological parameters were compared by a suitable test for multiple comparisons with a control after testing variance homogeneity. All statistical tests were per-formed with the computer software ToxRat version 2.10.4.1 Professional (ToxRat® Solutions GmbH).
In pre-tests the behaviour of P25 in the presence of algae used as food for the daphnids was studied. On the basis of these results the period for the renewal of the medium was deter-mined. The experiments consisted of:
Pre-tests
• Three concentrations of P25 (0.05 mg/L; 0.5 mg/L, 5.0 mg/L) and the control
• For each sampling time, three replicates per concentration and the control
• Four sampling times (0, 24, 48, 72 h)
• Concentration of algae: during the reproduction test as the parent animals grow the amount of algae added as feed had to increase. For the pre-test that investigated the behaviour of P25 in the presence of algae (e.g. sorption and sedimentation), a me-

Test with daphnids: reproduction – TiO2 184
dium concentration of algae (resulting in an extinction of 0,075 at 585 nm in the test vessels) was used.
TiO2 concentrations were prepared as described above (1 min stirring, 3 min ultrasonic treatment) and the test medium was filled in the test vessels used for the main test. Algae were added. For each sampling time about 35 mL of the respective test vessels (three per concentration + control) were carefully removed and the TiO2 concentration was determined. Removal of sedimented particles was avoided. The results of the analyses are presented in Table 112. Recovery of P25 used as standard was 100%.
Table 112: P25 – test with daphnids: concentration of TiO2 determined in the supernatant of the test vessels. Mean values of three replicates [µg/L] and standard deviation.
TiO2 [mg/L]
Pure algae
Stock suspen-sion Day 0 Day 1 Day 2 Day 3
Mean [µg/L]
Stan-dard devia-tion
Mean [µg/L]
Stan-dard devia-tion
Mean [µg/L]
Stan-dard devia-tion
Mean [µg/L]
Stan-dard devia-tion
Mean [µg/L]
Stan-dard devia-tion
0,05 < LOQ 56.7 3.2 48.8 1.4 26.8 2.3 21.6 1.8 18.7 2.4 0,5 < LOQ 65.2 2.7 51.8 2.0 22.5 0.8 19.3 0.6 16.7 1.5 5.0 < LOQ 72.3 2.8 56.9 0.9 18.5 0.7 11.9 0.2 8.9 0.2
From the results the following conclusions can be drawn:
• Due to the 100% recovery of the standard the lower values in the samples result from the incubation design.
• The main difference was between day 0 and day 1. This may be due to sedimentation of P25 agglomerates and P25 sorbed to algae.
In experiments with lumbriculus (UBA project FKZ: 3709 65 418) it was found, by particle measurement, that sedimentation mainly occurred within the first three hours. Due to their mobility, daphnids ingest sedimented as well as non-sedimented nanoparticles and algae. Therefore, a daily renewal of the medium with a temporarily higher concentration in the su-pernatant should not give a significant advantage compared to medium renewals at longer time intervals. Therefore it was decided to renew the medium three times a week. At every change of the medium, clean vessels are filled with freshly prepared dispersion and the daphnids are transferred. Therefore, an increase of the test concentrations due to remaining sedimented nanoparticles is impossible.
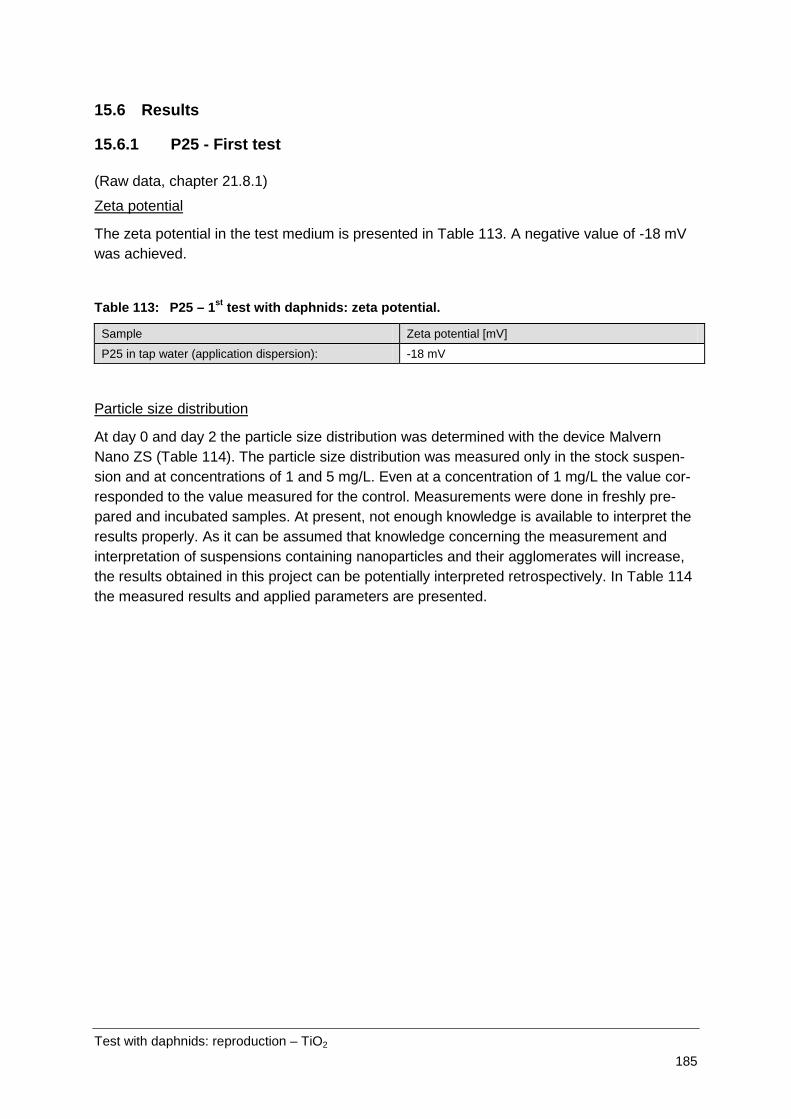
Test with daphnids: reproduction – TiO2 185
15.6 Results
15.6.1 P25 - First test
(Raw data, chapter 21.8.1)
The zeta potential in the test medium is presented in
Zeta potential
Table 113. A negative value of -18 mV was achieved.
Table 113: P25 – 1st test with daphnids: zeta potential.
Sample Zeta potential [mV]
P25 in tap water (application dispersion): -18 mV
At day 0 and day 2 the particle size distribution was determined with the device Malvern Nano ZS (
Particle size distribution
Table 114). The particle size distribution was measured only in the stock suspen-sion and at concentrations of 1 and 5 mg/L. Even at a concentration of 1 mg/L the value cor-responded to the value measured for the control. Measurements were done in freshly pre-pared and incubated samples. At present, not enough knowledge is available to interpret the results properly. As it can be assumed that knowledge concerning the measurement and interpretation of suspensions containing nanoparticles and their agglomerates will increase, the results obtained in this project can be potentially interpreted retrospectively. In Table 114 the measured results and applied parameters are presented.

Test with daphnids: reproduction – TiO2 186
Table 114: P25 – 1st test with daphnids: particle size distribution.
Concentration [mg/L]
Z-average [nm] 1 PDI 2 Peak 1
[nm] 6 Peak 2 [nm] 6
Count rate 3 [kcps]
Measurement position 4 Attenuation 5
Day 0
Control 1421 0.821 506.3 50.5 4.65 11 20 mg/L (stock suspension)
1780 0.742 804.2 - 262.4 4.65 6
1 mg/L 1768 1.000 412.1 - 243.9 4.65 9 5 mg/L 1662 0.752 726.5 - 48.2 4.65 6 Day 2 - supernatant of the suspensions after incubation in the test vessels
Control 1261 0.831 48.0 (86%)
74.87 (14%)
50.8 4.65 10
1 mg/L 659.3 0.580 553.4 (81%)
157.3 (19%)
66.1 4.65 8
5 mg/L 2661 1.000 652.9 - 246.1 4.65 9 Day 2 - freshly prepared suspensions Control 810.4 0.703 766.0
(72%) 205.7 (28%)
52.7 4.65 11
20 mg/L (stock suspension)
2320 0.652 1105 - 239.0 4.65 6
1 mg/L 641.0 0.568 426.4 - 72.4 4.65 8 5 mg/L 1255 0.550 797.6 - 148.3 4.65 7
1 calculated value (cumulative mean); 2 increasing value indicates increasing polydispersity (maximum: 1); 3 best results with a count rate between 150 and 500 kilo counts per second (kcps); 4 measurement position in the mid-dle of the measuring cell; 5 indicator for turbidity (high values indicate low turbidity; maximum: 11); 6 In the case of more than two peaks, value in brackets gives percentage of the single peak compared to all peaks (prerequisite: the peak increases 10%).
The concentrations of P25 are presented in
Test item concentrations
Table 115 (percentage recovery) and Table 273 (chapter 21.8.1, measured concentrations). The stock suspensions had a recovery of about 90%. Dilution of the stock dispersions resulted in analytical concentrations which were about 64 - 86% of the nominal concentrations. Incubation for two days resulted in a decrease of the Ti concentration in the overlaying water.

Test with daphnids: reproduction – TiO2 187
Table 115: P25 – 1st test with daphnids: Ti recovery [%]
Concentration d0 freshly prepared
d2 incubated for 2 days in test vessels
d7 freshly prepared
d9 incubated for 2 days in test vessels
d14 freshly prepared
d16 incu-bated for 2 days in test vessels
Test suspensions 0.05 mg/L 68.1 17.7 64.0 3.1 65.3 17.4 0.1 mg/L 63.6 15.4 61.9 3.9 69.3 15.3 0.5 mg/L 64.9 14.6 66.9 2.8 59.9 14.0 1.0 mg/L 72.6 15.6 72.4 3.5 75.3 14.6 5.0 mg/L 84.4 6.9 76.6 4.4 86.0 18.0 Stock suspension 20 mg/L 89.8 87.2 88.2
Summarised results are presented in
Effects
Table 116, Table 117 and Figure 26 - Figure 30.
No concentrations causing a modification of the mobility or reproduction of the adults were observed. No other clinical signs were detected in any replicate at any concentration tested.
The LOEC, EC10, EC20, and EC50 values of the biological endpoints (cumulative offspring per survivor, mobility) were > 5 mg/L. The NOEC was ≥ 5 mg/L.
For the body length the LOEC and NOEC were 0.5 mg/L and 0.1 mg/L.
The results of survival and reproduction are presented in
Reproduction rate
Table 116 and Figure 26 - Figure 29.
Table 116: P25 – 1st test with daphnids: survival and reproduction data. Number of D. magna per concentration: n = 10.
Concentration Parental sur-vival
Age at first brood
Cumulative offspring per female Intrinsic rate of increase
[mg TiO2./L] [%] Mean ± SD [days] Mean ± SD [Ind.] Mean ± SD [Ind./day]
Control 100 11.0 ± 1.65 90.4 ± 18.12 0.309 ± 0.032
0.05 (nominal) 100 10.9 ± 1.43 80.2 ± 16.22 0.290 ± 0.029
0.1 (nominal) 100 10.5 ± 1.56 86.9 ± 13.50 0.303 ± 0.030
0.5 (nominal) 100 12.1 ± 1.51 78.1 ± 14.88 0.296 ± 0.050
1.0 (nominal) 100 10.7 ± 1.32 84.0 ± 6.83 0.301 ± 0.025
5.0 (nominal) 100 11.1 ± 0.97 83.1 ± 12.58 0.288 ± 0.021
SD = standard deviation.

Test with daphnids: reproduction – TiO2 188
DataMean
Concentration [mg/L]543210
Mea
n Cu
mula
tive
Offs
pring
per
Sur
vivor
120,0
115,0
110,0
105,0
100,0
95,0
90,0
85,0
80,0
75,0
70,0
65,0
60,0
Figure 26: P25 – 1st test with daphnids: mean cumulative offspring per survivor of Daphnia magna after 21 d.
DataFunction
Concentration [mg/L]0,1 1
% O
ffspri
ng R
educ
tion
100
90
80
70
60
50
40
30
20
10
0
Figure 27: P25 – 1st test with daphnids: concentration-effect curve on mean cumulative offspring per survivor of Daphnia magna after 21 d.

Test with daphnids: reproduction – TiO2 189
DataMean
Concentration [mg/L]543210
Age
at F
irst R
epro
duct
ion [d
]14,0
13,0
12,0
11,0
10,0
9,0
Figure 28: P25 – 1st test with daphnids: age at first reproduction of Daphnia magna.
DataMean
Concentration [mg/L]543210
Intri
nsic
Rate
r [1
/d]
0,400
0,350
0,300
Figure 29: P25 – 1st test with daphnids: intrinsic rate of population increase r of Daphnia magna after 21 d.

Test with daphnids: reproduction – TiO2 190
No concentration/effect dependency on P25 on the reproduction rate was detected. The NOEC (no observed effect concentration) for the tested species Daphnia magna was found to be ≥ 5 mg/L for reproduction rate and survival.
The results of the body length are presented in
Body length
Table 117 and Figure 30. The three highest test concentrations (0.5, 1.0, 5.0 mg/L) resulted in statistical significant differences to the control. However, no concentration effect relationship was observed. The length of the daph-nids at 1.0 mg/L exceeded the length at 0.5 and 5.0 mg/L. The maximum effect was 10%. Therefore, it is concluded that P25 up to a concentration of 5 mg/L does not affect body length and the statistical difference is based on the very homogenous length and the high number of replicates.
Table 117: P25 – 1st test with daphnids: body length of the adult daphnids at day 21.
Replicate Control 0.05 mg/L 0.1 mg/L 0.5 mg/L 1.0 mg/L 5.0 mg/L
1 4.79 4.65 4.09 4.69 4.43 4.76
2 4.66 4.96 4.87 4.48 5.07 4.39
3 4.89 4.49 4.72 4.46 4.67 4.41
4 4.84 4.52 4.83 4.62 4.56 4.03
5 4.87 4.99 5.04 4.77 4.22 4.53
6 4.90 4.59 4.83 4.82 4.41 4.26
7 5.10 4.60 4.79 4.34 4.63 4.34
8 4.96 4.72 5.04 4.44 5.10 4.39
9 5.44 5.00 5.01 4.59 4.96 4.63
10 4.66 4.67 5.29 4.95 5.05 4.99
Number 10 10 10 10 10 10
Mean 4.91 4.72 4.85 4.62 * 1 4.71 * 1 4.47 * 1
Standard deviation 0.22 0.18 0.30 0.18 0.30 0.26
* 1 Significant different to the control; t-test procedure after Williams, α = 0.05, one-sided smaller
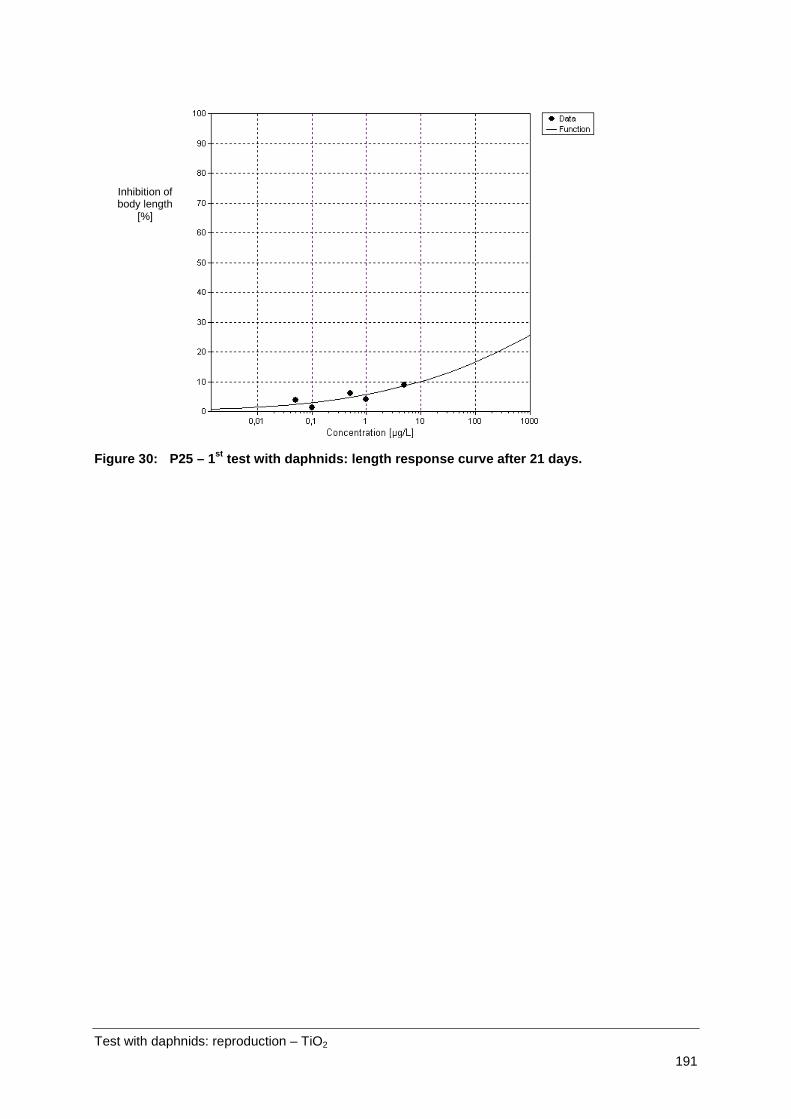
Test with daphnids: reproduction – TiO2 191
Figure 30: P25 – 1st test with daphnids: length response curve after 21 days.
Inhibition of body length
[%]
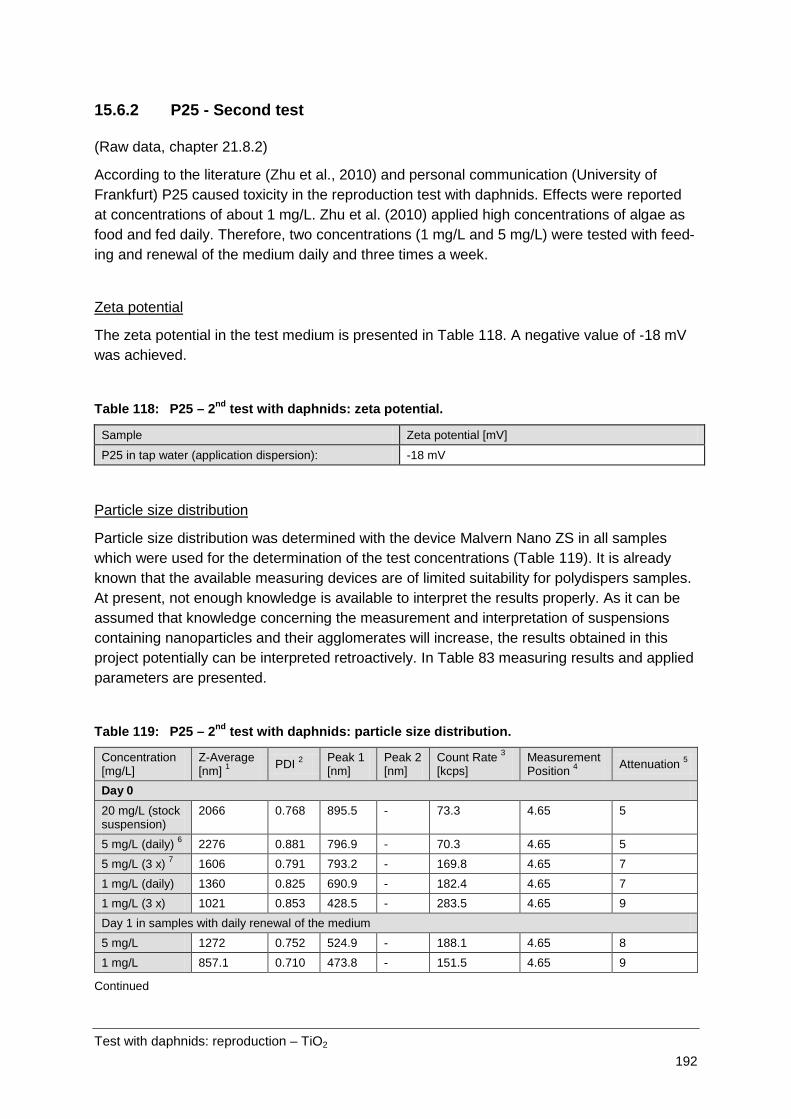
Test with daphnids: reproduction – TiO2 192
15.6.2 P25 - Second test
(Raw data, chapter 21.8.2)
According to the literature (Zhu et al., 2010) and personal communication (University of Frankfurt) P25 caused toxicity in the reproduction test with daphnids. Effects were reported at concentrations of about 1 mg/L. Zhu et al. (2010) applied high concentrations of algae as food and fed daily. Therefore, two concentrations (1 mg/L and 5 mg/L) were tested with feed-ing and renewal of the medium daily and three times a week.
The zeta potential in the test medium is presented in
Zeta potential
Table 118. A negative value of -18 mV was achieved.
Table 118: P25 – 2nd test with daphnids: zeta potential.
Sample Zeta potential [mV]
P25 in tap water (application dispersion): -18 mV
Particle size distribution was determined with the device Malvern Nano ZS in all samples which were used for the determination of the test concentrations (
Particle size distribution
Table 119). It is already known that the available measuring devices are of limited suitability for polydispers samples. At present, not enough knowledge is available to interpret the results properly. As it can be assumed that knowledge concerning the measurement and interpretation of suspensions containing nanoparticles and their agglomerates will increase, the results obtained in this project potentially can be interpreted retroactively. In Table 83 measuring results and applied parameters are presented.
Table 119: P25 – 2nd test with daphnids: particle size distribution.
Concentration [mg/L]
Z-Average [nm] 1 PDI 2 Peak 1
[nm] Peak 2 [nm]
Count Rate 3 [kcps]
Measurement Position 4 Attenuation 5
Day 0
20 mg/L (stock suspension)
2066 0.768 895.5 - 73.3 4.65 5
5 mg/L (daily) 6 2276 0.881 796.9 - 70.3 4.65 5 5 mg/L (3 x) 7 1606 0.791 793.2 - 169.8 4.65 7 1 mg/L (daily) 1360 0.825 690.9 - 182.4 4.65 7 1 mg/L (3 x) 1021 0.853 428.5 - 283.5 4.65 9 Day 1 in samples with daily renewal of the medium 5 mg/L 1272 0.752 524.9 - 188.1 4.65 8 1 mg/L 857.1 0.710 473.8 - 151.5 4.65 9
Continued

Test with daphnids: reproduction – TiO2 193
Table 83 (continued)
Day 2 in samples with renewal of the medium three times a week 5 mg/L 1251 0.883 443.8 - 97.5 4.65 8 1 mg/L 1171 0.835 286.1 - 142.0 4.65 10 Day 7 20 mg/L (stock suspension)
1621 0.462 1054 - 216.4 4.65 6
5 mg/L (daily) 6 1982 0.684 995.9 - 233.0 4.65 6 5 mg/L (3 x) 7 1036 0.769 498.1 - 53.9 4.65 6 1 mg/L (daily) 1017 0.610 641.5 - 144.8 4.65 7 1 mg/L (3 x) 1127 0.836 511.3
(84.2%) 8 161.3 (15.8%) 8
240.5 4.65 9
Day 8 in samples with daily renewal of the medium 5 mg/L 939.4 0.657 502.4 - 99.5 4.65 7 1 mg/L 982.2 0.761 414.1 - 113.4 4.65 9 Day 9 in samples with renewal of the medium three times a week 5 mg/L 650.7 0.611 442.8 - 229.4 4.65 8 1 mg/L 775.4 0.703 433.6 - 217.8 4.65 9 Day 14 20 mg/L (stock suspension)
1547 0.495 1018 - 254.4 4.65 6
5 mg/L (daily) 6 1694 0.559 961.2 - 188.1 4.65 6 5 mg/L (3 x) 7 1107 0.709 608.7 - 147.6 4.65 7 1 mg/L (daily) 1438 0.795 523.2 - 200.6 4.65 7 1 mg/L (3 x) 947.2 0.885 358.3 - 184.9 4.65 9 Day 15 in samples with daily renewal of the medium 5 mg/L 1268 0.721 551.9 - 104.9 4.65 7 1 mg/L 2482 0.711 343.5 - 68.3 4.65 7 Day 16 in samples with renewal of the medium three times a week 5 mg/L 1116 0.680 528.9 - 143.3 4.65 7 1 mg/L 1768 0.934 553.4 - 223.5 4.65 8
1 calculated value (cumulative mean); 2 increasing value indicates increasing polydispersity (maximum: 1); 3 best results with a count rate between 150 and 500 kilo counts per second (kcps); 4 measurement position in the mid-dle of the measuring cell; 5 indicator for turbidity (high values indicate low turbidity; maximum: 11); 6 1 mg/L sam-ples below quantification limit; 7 prepared from 10 mg/L samples with 3 min of ultrasonic treatment; 8 prepared from 10 mg/L samples with 30 min of ultrasonic treatment; 6 samples with daily renewal of the medium; 7 sam-ples with renewal of the medium three times a week; 8 In the case of more than two peaks, value in brackets gives percentage of the single peak compared to all peaks (prerequisite, the peak increases 10%)
The concentrations of P25 are presented in
Test item concentrations
Table 120 (percentage recovery) and Table 273 (chapter 21.8.2, measured concentrations). The stock suspensions had a recovery between 85 and 101%. Dilution of the stock dispersions resulted in analytical concentrations between 82 - 103% of the nominal concentrations. The concentration in the supernatant decreased during incubation except the concentration in the vessel with TiO2 nanoparticles of 1 mg/L. At day 16 a higher concentration compared to day 15 was detected. One sample was taken

Test with daphnids: reproduction – TiO2 194
which was analysed twice. The replicate determinations were identical. It is assumed that the sample was contaminated with sedimented nanoparticles.
Table 120: P25 – 2nd test with daphnids: Ti recovery [%].
Concentration Test suspension 1 mg/L
Test suspension 5 mg/L
Stock suspension 20 mg/L
d0 freshly prepared 94.9 81.6 84.6
d1 incubated for 1 day in test vessels with daily medium renewal 30.4 22.6
d2 incubated for 2 day in test vessels with medium renewal three times a week
10.8 8.6
d7 freshly prepared 85.3 89.1 92.5
d8 incubated for 1 day in test vessels with daily medium renewal 42.4 37.6
d9 incubated for 2 day in test vessels with medium renewal three times a week
38.4 27.6
d14 freshly prepared 103.1 99.1 101.3
d15 incubated for 1 day in test ves-sels with daily medium renewal 49.3 42.4
d16 incubated for 2 day in test ves-sels with medium renewal three times a week
(77.4) * 23.0
* Sample presumably contaminated with sedimented nanoparticles
Summarised results are presented in
Effects
Table 121 - Table 123 and Figure 31 - Figure 34.
No concentrations causing a modification of the mobility or reproduction of the adults were observed. No other clinical signs were detected in any replicate at any concentration tested.
The LOEC, EC10, EC20, and EC50 values of the biological endpoints (cumulative offspring per survivor, mobility, and body length) were > 5 mg/L. The NOEC was ≥ 5 mg/L.
The results obtained for survival and reproduction are presented in
Reproduction rate
Table 121, Table 122 and Figure 31 - Figure 33.
From day 7 on in the control of the test design where the medium was replaced three times a week, a single daphnid containing algae in its brood pouch was observed throughout the test. This daphnid did not reproduce at all which might have been due to the algae. There-fore, this organism was not considered for the calculation of the reproduction.
A concentration/effect dependency on P25 for the reproduction rate was not detected. This was independent on the time interval for the renewal of the medium. The NOEC (no ob-

Test with daphnids: reproduction – TiO2 195
served effect concentration) for the tested species Daphnia magna was found to be ≥ 5 mg/L for reproduction rate and survival.
Table 121: P25 – 2nd test with daphnids: survival and reproduction data. Number of D. magna per concentration: n = 10
Concentration Parental survival Age at first brood Cumulative offspring per female
Intrinsic rate of in-crease
[mg TiO2./L] [%] mean ± SD [days] mean ± SD[ind.] mean ± SD[ind./day]
Medium renewal three times a week
Control 100 11.9 ± 1.19 75.8 ± 22.02 0.267 ± 0.033
1.0 (nominal) 100 11.2 ± 1.16 70.7 ± 29.28 0.279 ± 0.032
5.0 (nominal) 100 11.8 ± 1.49 73.2 ± 20.30 0.271 ± 0.037
Daily medium renewal
Control 100 10.7 ± 1.14 64.4 ± 20.74 0.287 ± 0.040
1.0 (nominal) 70 11.1 ± 1.51 47.9 ± 23.86 0.244 ± 0.059
5.0 (nominal) 100 10.3 ± 0.79 71.4 ± 18.00 0.297 ± 0.027
Table 122: P25 – 2nd test with daphnids: percent survival and reproduction.
Concentration Parental survival Cumulative offspring per female Intrinsic rate of increase
[mg TiO2./L] [%]
Medium renewal three times a week
Control - 100 100 100
1.0 (nominal) 100 93 104
5.0 (nominal) 100 97 101
Daily medium renewal
Control 100 100 100
1.0 (nominal) 70 74 85
5.0 (nominal) 100 111 103

Test with daphnids: reproduction – TiO2 196
Medium renewal three times a week
Daily medium renewal
Figure 31: P25 – 2nd test with daphnids: mean cumulative offspring per survivor of Daphnia magna after 21 d.

Test with daphnids: reproduction – TiO2 197
Medium renewal three times a week
Daily medium renewal
Figure 32: P25 – 2nd test with daphnids: age at first reproduction of Daphnia magna.

Test with daphnids: reproduction – TiO2 198
Medium renewal three times a week
Daily medium renewal
Figure 33: P25 – 2nd test with daphnids: intrinsic rate of population increase r of Daph-nia magna after 21 days.

Test with daphnids: reproduction – TiO2 199
The results for the body length are presented in
Body length
Table 123 and Figure 34. Neither the applied concentration nor the time interval of medium renewal affected the body length of the adult daphnids.
Table 123: P25 – 2nd test with daphnids: body length of the adult daphnids at day 21.
Medium renewal three times a week Daily medium renewal
Replicate Control 1 mg/L 5 mg/L Control 1 mg/L 5.0 mg/L
1 4.39 5.73 4.67 4.99 5.21 5.30
2 3.06 4.12 4.96 4.69 --- 5.23
3 4.80 5.44 5.04 5.30 3.39 4.66
4 4.45 5.24 4.67 5.31 4.47 4.70
5 5.64 4.68 5.41 5.02 4.37
6 4.90 4.86 4.56 5.08 5.59 5.03
7 4.80 4.27 3.88 5.05 4.53 5.64
8 5.03 4.58 4.23 5.06 5.63 4.81
9 4.19 4.95 4.34 4.90 --- 4.39
10 2.89 5.28 4.96 4.61 4.67 5.04
Number 10 10 10 10 7 10
Mean 4.42 4.92 4.67 5.00 4.78 4.92
Standard deviation 0.86 0.52 0.45 0.23 0.78 0.41

Test with daphnids: reproduction – TiO2 200
Medium renewal three times a week
Daily medium renewal
Figure 34: P25 – 2nd test with daphnids: response curve of the body length after 21 days.

Test with daphnids: reproduction – TiO2 201
15.6.3 P25 – Third test
(Raw data, chapter 21.8.3)
In the experiments reported by Zhu et al. (2010) and those performed at the University of Frankfurt, periods of ultrasonication were applied that exceeded the period applied by Fraun-hofer IME (IME: 3 min; Zhu: 10 min; University of Frankfurt: 60 min). To investigate whether a longer period of ultrasonic treatment would cause an effect, a further experiment with 3 min and 30 min ultrasonication was performed. Two concentrations (1mg/L and 5 mg/L) were tested. The medium was renewed three times a week.
The Zeta potential in the test medium is presented in
Zeta potential
Table 124. A negative value of -18 mV was achieved.
Table 124: P25 – 3rd test with daphnids: zeta potential.
Sample Zeta potential [mV]
P25 in tap water (application dispersion): -18 mV
Particle size distribution was determined with the device Malvern Nano ZS in all samples which were used for the determination of the test concentrations. It is already known that the available measuring devices are of limited suitability for polydispers samples. At present, not enough knowledge is available to interpret the results properly. As it can be assumed that knowledge concerning the measurement and interpretation of suspensions containing nanoparticles and their agglomerates will increase, the results obtained in this project poten-tially can be interpreted retroactively. In
Particle size distribution
Table 125 measuring results and applied parameters are presented.
The peak measured in the stock dispersion was larger than the peaks determined in the di-luted test dispersions. The period of ultrasonication treatment of the stock suspensions showed no obvious tendency with respect to the size of peak 1 (e.g. it is not clear whether a 3 min ultrasonication treatment resulted in larger peaks than a 30 min ultrasonication treat-ment). For the freshly prepared test concentrations, 1 mg/L resulted in smaller particle sizes (location of the peak) compared to the concentrations of 5 mg/L. No tendency was obvious for the aged test suspensions of different concentrations. Furthermore, no tendency was ob-vious for freshly prepared and aged test suspensions with respect to the two ultrasonication periods.

Test with daphnids: reproduction – TiO2 202
Table 125: P25 – 3rd test with daphnids: particle size distribution.
Concentration [mg/L]
Z-Average [nm] 1 PDI 2 Peak 1
[nm] Peak 2 [nm]
Count Rate 3 [kcps]
Measurement position 4 Attenuation 5
Day 0
20 mg/L (stock suspension) – 3 min
1992 0.6 1058 - 189 4.65 6
20 mg/L (stock suspension) – 30 min
1671 0.4 1199 - 228 4.65 6
5 mg/L – 3 min 1479 0.9 711 - 159 4.65 7 1 mg/L - 3 min 823 0.7 390 - 207 4.65 9 5 mg/L – 30 min 858 0.6 617 - 205 4.65 7 1 mg/L - 30 min 370 0.5 280 - 277 4.65 9 Day 2 5 mg/L – 3 min 3565 1 578 - 108 4.65 9 1 mg/L – 3 min 959 0.7 404 - 217 4.65 10 5 mg/L – 30 min 1373 0.9 706
(60%) 175 (40%)
254 4.65 11
1 mg/L - 30 min 1091 0.8 442 - 272 4.65 10 Day 7 20 mg/L (stock suspension) – 3 min
2805 0.5 1312 - 219 4.65 6
20 mg/L (stock suspension) – 30 min
2750 0.5 1256 - 236 4.65 6
5 mg/L - 3 min 1586 0.8 630 - 180 4.65 7 1 mg/L – 3 min 907 0.7 453 - 204 4.65 9 5 mg/L – 30 min 1522 0.6 833 - 82 4.65 6 1 mg/L - 30 min 574 0.5 342 - 171 4.65 8 Day 9 in samples with renewal of the medium three times a week
5 mg/L – 3 min 513 0.6 355 - 196 4.65 9 1 mg/L – 3 min 2127 1 346 - 140 4.65 8 5 mg/L – 30 min 477 0.6 357 - 146 4.65 8 1 mg/L - 30 min 563 0.6 403 - 179 4.65 9
Continued
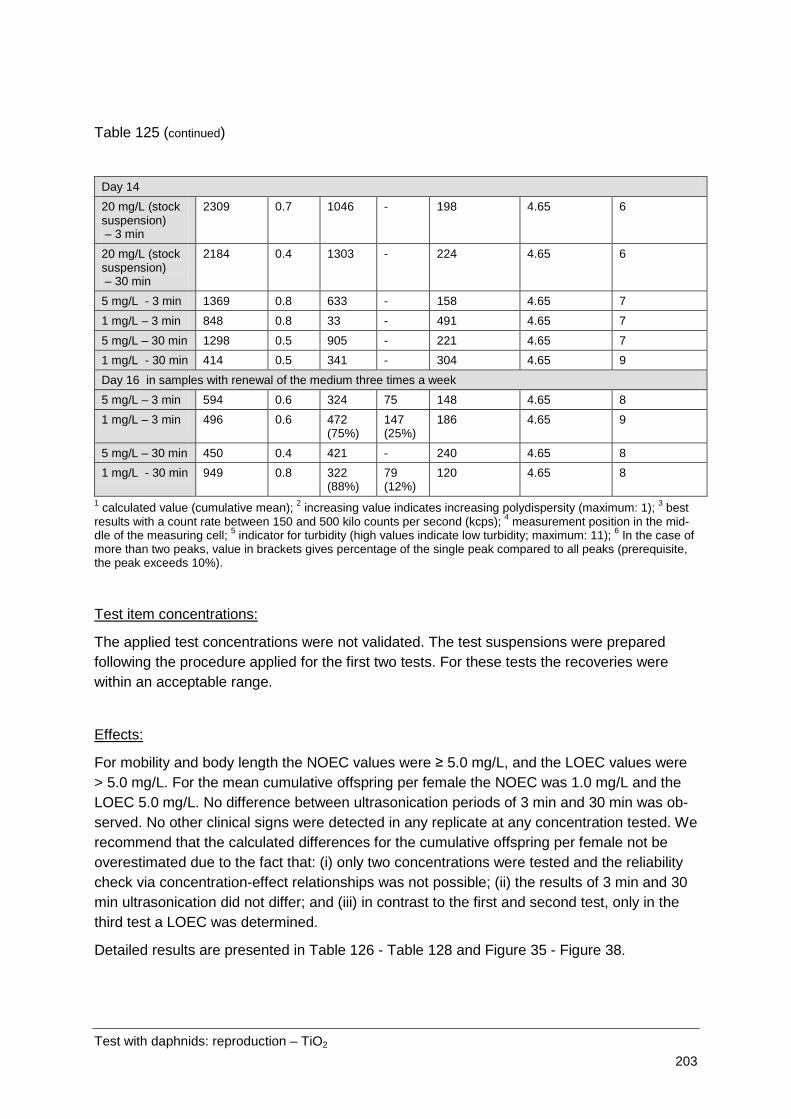
Test with daphnids: reproduction – TiO2 203
Table 125 (continued)
Day 14 20 mg/L (stock suspension) – 3 min
2309 0.7 1046 - 198 4.65 6
20 mg/L (stock suspension) – 30 min
2184 0.4 1303 - 224 4.65 6
5 mg/L - 3 min 1369 0.8 633 - 158 4.65 7 1 mg/L – 3 min 848 0.8 33 - 491 4.65 7 5 mg/L – 30 min 1298 0.5 905 - 221 4.65 7 1 mg/L - 30 min 414 0.5 341 - 304 4.65 9 Day 16 in samples with renewal of the medium three times a week 5 mg/L – 3 min 594 0.6 324 75 148 4.65 8 1 mg/L – 3 min 496 0.6 472
(75%) 147 (25%)
186 4.65 9
5 mg/L – 30 min 450 0.4 421 - 240 4.65 8 1 mg/L - 30 min 949 0.8 322
(88%) 79 (12%)
120 4.65 8
1 calculated value (cumulative mean); 2 increasing value indicates increasing polydispersity (maximum: 1); 3 best results with a count rate between 150 and 500 kilo counts per second (kcps); 4 measurement position in the mid-dle of the measuring cell; 5 indicator for turbidity (high values indicate low turbidity; maximum: 11); 6 In the case of more than two peaks, value in brackets gives percentage of the single peak compared to all peaks (prerequisite, the peak exceeds 10%).
The applied test concentrations were not validated. The test suspensions were prepared following the procedure applied for the first two tests. For these tests the recoveries were within an acceptable range.
Test item concentrations:
For mobility and body length the NOEC values were ≥ 5.0 mg/L, and the LOEC values were > 5.0 mg/L. For the mean cumulative offspring per female the NOEC was 1.0 mg/L and the LOEC 5.0 mg/L. No difference between ultrasonication periods of 3 min and 30 min was ob-served. No other clinical signs were detected in any replicate at any concentration tested. We recommend that the calculated differences for the cumulative offspring per female not be overestimated due to the fact that: (i) only two concentrations were tested and the reliability check via concentration-effect relationships was not possible; (ii) the results of 3 min and 30 min ultrasonication did not differ; and (iii) in contrast to the first and second test, only in the third test a LOEC was determined.
Effects:
Detailed results are presented in Table 126 - Table 128 and Figure 35 - Figure 38.

Test with daphnids: reproduction – TiO2 204
The results of survival and reproduction are presented in
Reproduction rate:
Table 126, Table 127 and Figure 35 - Figure 38.
At 5 mg/L statistically reduced reproduction activity was observed. The NOEC (no observed effect concentration) for the tested species Daphnia magna was found to be 1 mg/L for re-production. For mobility no statistical difference was observed. For survival the NOEC was ≥ 5.0 mg/L. No statistical difference between the ultrasonication periods of 3 min and 30 min was detected. Neither the results for 1 mg/L with both sonication periods nor for 5 mg/L were different.
Table 126: P25 – 3rd test with daphnids: survival and reproduction data. Number of D. magna per concentration: n = 10
Concentration Parental survival Age at first brood Cumulative offspring per female
Intrinsic rate of in-crease
[mg TiO2./L] [%] mean ± SD [days] mean ± SD[ind.] mean ± SD[ind./day]
Ultrasonication: 3 min
Control 100 9.8 ± 0.95 85.0 ± 7.7 0.306 ± 0.021
1.0 (nominal) 80 9.6 ± 0.32 79.8 ± 9.9 0.304 ± 0.022
5.0 (nominal) 90 10.1 ± 1.35 76.4 ± 8.2 1 0.301 ± 0.033
Ultrasonication: 30 min
Control 100 9.8 ± 0.95 85.0 ± 7.7 0.306 ± 0.021
1.0 (nominal) 100 9.8 ± 0.95 81.9 ± 8.9 0.314 ± 0.025
5.0 (nominal) 100 9.9 ± 0.97 71.2 ± 17.7 1 0.297 ± 0.021 1 statistical significance p> 0.05
Table 127: P25 – 3rd test with daphnids: percentage survival and reproduction.
Concentration Parental survival Cumulative offspring per female Intrinsic rate of increase
[mg TiO2./L] [%] [%] [%]
Ultrasonication: 3 min
Control - 100 100 100
1.0 (nominal) 80 94 99
5.0 (nominal) 90 90 98
Ultrasonication: 30 min
Control 100 100 100
1.0 (nominal) 100 96 103
5.0 (nominal) 100 84 97
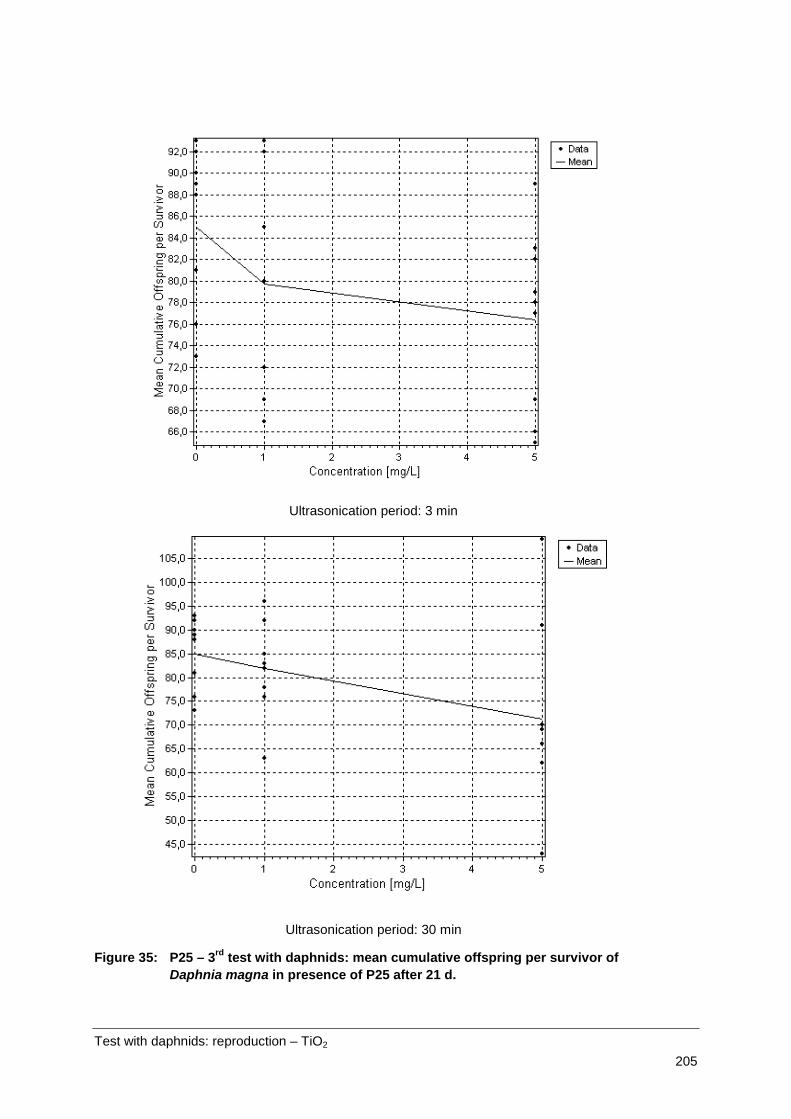
Test with daphnids: reproduction – TiO2 205
Ultrasonication period: 3 min
Ultrasonication period: 30 min
Figure 35: P25 – 3rd test with daphnids: mean cumulative offspring per survivor of Daphnia magna in presence of P25 after 21 d.

Test with daphnids: reproduction – TiO2 206
Ultrasonication period: 3 min
Ultrasonication period: 30 min
Figure 36: P25 – 3rd test with daphnids: age at first reproduction of Daphnia magna in presence of P25.

Test with daphnids: reproduction – TiO2 207
Ultrasonication period: 3 min
Ultrasonication period: 30 min
Figure 37: P25 – 3rd test with daphnids: intrinsic rate of population increase r of Daph-nia magna after 21 days.
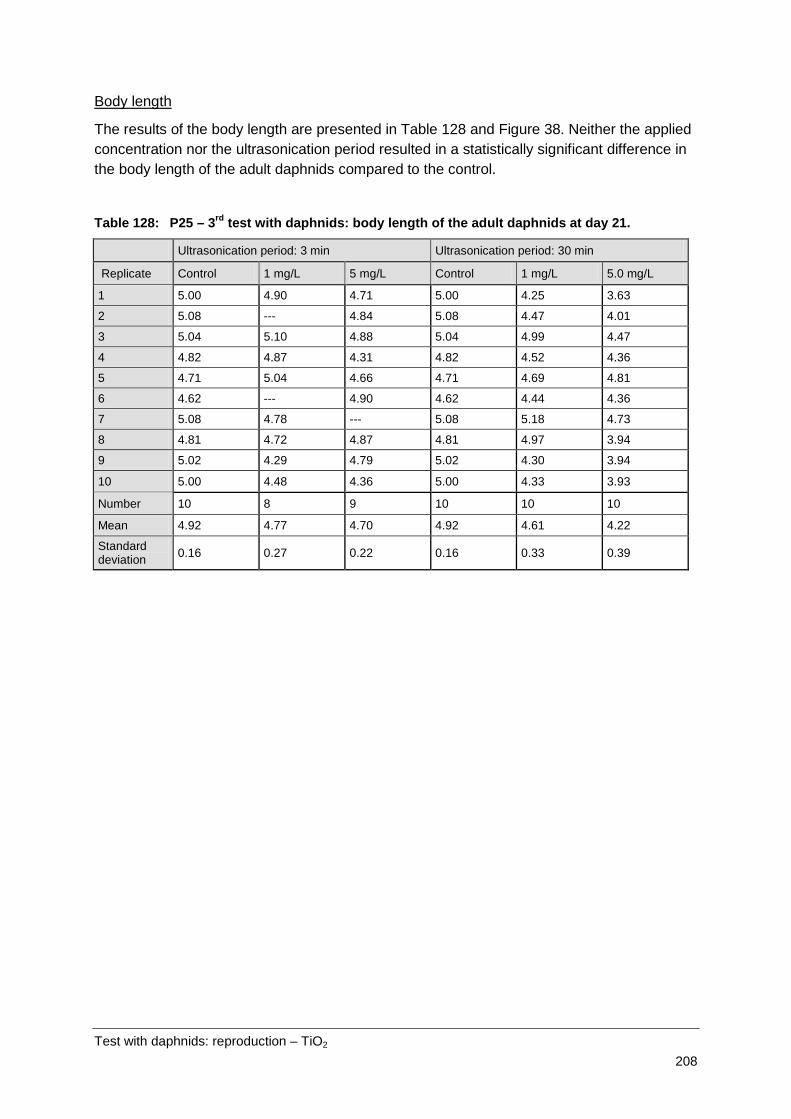
Test with daphnids: reproduction – TiO2 208
The results of the body length are presented in
Body length
Table 128 and Figure 38. Neither the applied concentration nor the ultrasonication period resulted in a statistically significant difference in the body length of the adult daphnids compared to the control.
Table 128: P25 – 3rd test with daphnids: body length of the adult daphnids at day 21.
Ultrasonication period: 3 min Ultrasonication period: 30 min
Replicate Control 1 mg/L 5 mg/L Control 1 mg/L 5.0 mg/L
1 5.00 4.90 4.71 5.00 4.25 3.63
2 5.08 --- 4.84 5.08 4.47 4.01
3 5.04 5.10 4.88 5.04 4.99 4.47
4 4.82 4.87 4.31 4.82 4.52 4.36
5 4.71 5.04 4.66 4.71 4.69 4.81
6 4.62 --- 4.90 4.62 4.44 4.36
7 5.08 4.78 --- 5.08 5.18 4.73
8 4.81 4.72 4.87 4.81 4.97 3.94
9 5.02 4.29 4.79 5.02 4.30 3.94
10 5.00 4.48 4.36 5.00 4.33 3.93
Number 10 8 9 10 10 10
Mean 4.92 4.77 4.70 4.92 4.61 4.22
Standard deviation 0.16 0.27 0.22 0.16 0.33 0.39

Test with daphnids: reproduction – TiO2 209
Ultrasonication period: 3 min
Ultrasonication period: 30 min
Figure 38: P25 – 3rd test with daphnids: response curve of the body length after 21 days.

Test with daphnids: reproduction – TiO2 210
15.7 Validity
P25 - three tests:
The tests are considered valid since:
• survival in the control (100%) was above 80% (all tests: 100%)
• within the 21 days the mean number of offspring in the control was above the criterion of 60/female (first test: 90.4; second test (medium renewal three times a week): 75.8; second test (daily medium renewal): 64.4; third test: 85.0).
15.8 Conclusion
Three experiments were performed. The results concerning the NOEC differ slightly. A sum-mary is presented in Table 129. The effect of P25 on the reproduction activity, mobility, and body length seems to be small up to the highest test concentration of 5 mg/L. The differ-ences between the tests reflect the biological variability.
Table 129: P25 – 3rd test with daphnids: summary of the NOEC values. Mean cumulative offspring per female, mobility and body length in the three tests
1st test: ultrasonication period 3 min; medium renewal 3 times per week
2nd Test: medium renewal daily or 3 times per week
3rd test: ultrasonication pe-riod. 3 min and 30 min
Mean cumulative offspring per female NOEC [mg/L] ≥ 5.0 ≥ 5 5.0 Mobility NOEC [mg/L] ≥ 5.0 ≥ 5 ≥ 5.0 Body length NOEC [mg/L] 0.1 mg/L ≥ 5 ≥ 5.0
15.9 Executive summary
TiO2 nanoparticles were tested in the reproduction test with daphnids (OECD 211). Three semi-static tests were carried out. In the first test the medium was renewed on days 2, 5, 7, 9, 12, 14, 16 and 19. The nominal concentrations of TiO2 nanoparticles in the test containers were 0.05, 0.1, 0.5, 1.0 and 5.0 mg test item/L. The concentrations of the test item were measured in the freshly prepared test suspensions on days 0, 7 and 14. After two days of incubation the concentrations of the test item were measured in the incubation flasks (days 2, 9, 16). Sedimentation of TiO2 nanoparticles resulted in a reduction of the Ti concentrations in the overlaying water after incubation.
In the second test two concentrations (1 mg/L, 5 mg/L) were investigated. Two periods for the renewal of the test medium were studied: three times per week and a daily.
In the third test two concentrations (1 mg/L, 5 mg/L) were investigated. Two ultrasonication periods (3 min and 30 min) were studied. The test medium was renewed three times per week.

Test with daphnids: reproduction – TiO2 211
The results concerning the NOEC differ slightly. A summary is presented in Table 130. The effect of P25 on reproduction activity, mobility and body length seems to be negligible up to the highest test concentration of 5 mg/L. The differences between the tests reflect the bio-logical variability.
Table 130: P25 – Compilation of the tests with daphnids: summary of the NOEC values. Mean cumulative offspring per female, mobility and body length in the three tests
1st test: ultrasonication period 3 min; medium renewal 3 times per week
2nd test: medium renewal daily or 3 times per week
3rd test: ultrasonication period 3 min and 30 min
Mean cumulative offspring per female NOEC [mg/L] ≥ 5.0 ≥ 5.0 5.0 Mobility NOEC [mg/L] ≥ 5.0 ≥ 5.0 ≥ 5.0 Body length NOEC [mg/L] 0.1 mg/L ≥ 5.0 ≥ 5.0

Test with daphnids: immobilisation - Au 212
16 Acute Immobilisation Tests with Daphnids (OECD TG 202) - Au
16.1 Test principle
Young female Daphnia (parent animals) aged less than 24 h at test start were exposed to the test item for 2 days under static conditions. The test item had been added to the water at a defined range of concentrations. Immobilisation was recorded after 24 and 48 h. Immobilisa-tion in the treatments and in the control were analysed for statistically significant differences using appropriate statistical methods.
16.2 Materials and methods
16.2.1 Test guideline
The test was performed according to OECD 202 (13.04.2004): OECD guideline for testing of chemicals – Daphnia sp. Acute Immobilisation Test.
16.2.2 GLP
The test was performed following the principles of GLP. In deviation to GLP no archiving of the raw data was performed and the Quality Assurance Unit was not involved with respect to the inspection of the test, of the raw data and of the report. Any laboratory equipment (e.g. balances, thermometers, pH-meters) was controlled and documented according to GLP.
16.3 Test substances
• NM-330: gold nanoparticles in dispersant • NM-330DIS: dispersant of the gold nanoparticles
16.4 Analytical monitoring
16.4.1 Details on sampling
Samples were taken from the pure substance (NM-330), from test concentrations at test start and in the test vessels after the incubation period.
16.4.2 Details on analytical methods
The zeta potential and particle size distribution was measured using a Malvern Zeta-Sizer NanoZS.
Characterization of the application dispersion and test dispersion

Test with daphnids: immobilisation - Au 213
The applied chemical methods are described in chapter 6.7. Only the two highest test con-centrations in the main test were analysed.
Chemical analysis
16.4.3 Details on test suspensions
Purified tap water was used as test water and to prepare the test suspension.
The pristine gold dispersion and the dispersing agent were used as stock dispersions. The test concentrations were achieved by dilution.
50.0%: 50 mL/L gold dispersion / dispersing agent per 100 mL with purified tap water
Pre-test
10%: 10 mL/L gold dispersion / dispersing agent per 100 mL with purified tap water
1.0%: 1 mL/L gold dispersion / dispersing agent per 100 mL with purified tap water
10%: 25 mL/L gold dispersion / dispersing agent per 250 mL with purified tap water
Main test
5.0%: 12.5 mL/L gold dispersion / dispersing agent per 250 mL with purified tap water
2.5%: 6.25 mL/L dispersing agent per 250 mL with purified tap water
1.25%: 3.125 mL/L dispersing agent per 250 mL with purified tap water
0.625%: 1.563 mL/L dispersing agent per 250 mL with purified tap water
For every test concentration a small amount of water was poured in a volumetric flask, the required gold dispersion and the dispersion agent resp. were added and the volume adjusted to 250 mL with purified tap water. The mixture was shaken several times.
16.5 Test organism
The test organisms were young specimens of Daphnia magna, 4 – 24 h old at test start.
Origin of the daphnids: German Federal Environment Agency, Institut für Wasser-, Boden- und Lufthygiene. Specimens used in the test were bred in the laboratory of the Fraunhofer IME.
Breeding conditions: Adult Daphnia, at least 3 weeks old, were separated from the stock population by sieving. Batches of 30 to 50 animals were held at room temperature in approx. 1.8 L dilution water for one week. During this week the daphnids were fed daily with an al-gal suspension (Desmodesmus subspicatus) and LiquizellR (HOBBY). Algae growing in the log-phase were centrifuged and the pellet was re-suspended in a few mL of medium. 30 mL of this suspension were given to 1 L Daphnia medium. The water

Test with daphnids: immobilisation - Au 214
was changed once per week. Newborn Daphnia were sepa-rated by sieving, the first generation was discarded.
Holding- and dilution-water: Purified drinking water was used as holding- and dilution water. The purification included filtration with activated charcoal, pas-sage through a lime-stone column and aeration. To avoid cop-per contamination, plastic water pipes were used. The following water chemistry data were regularly recorded in the testing facility, and were: pH, conductivity, dissolved oxygen content, content of nitrate, nitrite, ammonium (NH4+), phos-phate, calcium, magnesium, total hardness, alkalinity, DOC content, content of metals (copper, iron, manganese and zinc).
Food: The daphnids were not fed during the test.
16.6 Study design
16.6.1 Study type
Short-term test, static.
16.6.2 Water medium type
Fresh water.
16.6.3 Total exposure duration
48 h
• Pre-test: November 29, 2011 - December 01, 2011 • Main test: December 06, 2011 – December 08, 2011
No post-exposure observation period was performed.
16.6.4 Test conditions
Total hardness: 1.2 mmol/L
Pre-test
Test temperature: 20.7 - 21.3 °C (permitted range: 20 ± 2 °C)
pH in control: 8.1 – 8.3 (permitted range: pH 6 – 9; variation less than 1.5)
Dissolved oxygen in control: 8.3 – 9.0 mg/L corresponding to 97 – 100% (demanded thresh-old value: 3 mg/L)
Salinity: 277 µS/cm

Test with daphnids: immobilisation - Au 215
Nominal concentrations: The nominal concentrations in the test containers with gold dis-persion / dispersant were 1.0, 10.0, 50.0 % (v/v).
Details on test conditions:
• Test vessel: glass beakers (60 mL) filled with 50 mL test suspension; covered with glass panes
• Aeration: no • No. of organisms per vessel: 5 • No. of vessels per concentration (replicates): 2 • No. of vessels per control (replicates): 2
TEST MEDIUM / WATER PARAMETERS
The quality of the applied water is described in Table 131.
Table 131: Chemical parameter of the holding- and dilution-water in the pre-test
Conductivity [µS/cm]
Alcalinity [mmol/l]
Total hard-ness [mmol/l]
Ca hardness [mmol/l]
Mg hardness [mmol/l]
NPOC a [mg/L] Cl [mg/L]
277 1.8 1.2 0.8 0.4 0.7332 0.0. NO3 [mg/L] NO2 [mg/L] NH4 [mg/L] PO4 [mg/L] Cd [µg/L] Cr [µg/L] Cu [µg/L] 2.2 <0.005 <0.01 1.3 <3.05 <3.04 <5.07 Fe [µg/L] Mn [µg/L] Ni [µg/L] Pb [µg/L] Zn [µg/L] <22.1 <2.86 <2.37 <6.59 6.69
a NPOC = non purgeable organic carbon
OTHER TEST CONDITIONS
• Culture medium different from test medium: no • Intervals of water quality measurement: once per month • Adjustment of pH: no • Photoperiod: light/dark cycle 16/8 h • Light intensity: 553 - 560 lux
Total hardness: 1.2 mmol/L
Main test
Test temperature: 20.5 - 21.5 °C (permitted range: 20 ± 2°C)
pH in control: 8.3 – 8.4 (permitted range: pH 6 – 9; variation less than 1.5)
Dissolved oxygen in control: 8.2 – 8.7 mg/L corresponding to 96 - 99%. (demanded thresh-old value: 3 mg/L)
Salinity: 277 µS/cm
Nominal concentrations: The nominal concentrations in the test containers with gold dis-persion / dispersant were 0.625 – 10% (v/v)

Test with daphnids: immobilisation - Au 216
Details on test conditions:
• Test vessel: glass beakers (60 mL) filled with 50 mL test suspension; covered with glass panes
• Aeration: no • No. of organisms per vessel: 5 • No. of vessels per concentration (replicates): 4 • No. of vessels per control (replicates): 4
TEST MEDIUM / WATER PARAMETERS
The quality of the applied water is described in Table 132.
Table 132: Chemical parameter of the holding- and dilution-water in the main test
Conductivity [µS/cm]
Alcalinity [mmol/l]
Total hard-ness [mmol/l]
Ca hardness [mmol/l]
Mg hardness [mmol/l]
NPOC a [mg/L] Cl [mg/L]
277 1.8 1.2 0.8 0.4 0.7332 0.0. NO3 [mg/L] NO2 [mg/L] NH4 [mg/L] PO4 [mg/L] Cd [µg/L] Cr [µg/L] Cu [µg/L] 2.2 <0.005 <0.01 1.3 <3.05 <3.04 <5.07 Fe [µg/L] Mn [µg/L] Ni [µg/L] Pb [µg/L] Zn [µg/L] <22.1 <2.86 <2.37 <6.59 6.69
a NPOC = non purgeable organic carbon
OTHER TEST CONDITIONS
• Culture medium different from test medium: no • Intervals of water quality measurement: once per month • Adjustment of pH: no • Photoperiod: light/dark cycle 16/8 h • Light intensity: 553 - 560 lux
VEHICLE CONTROL PERFORMED: No
Reference substance: A reference substance (K2Cr2O7) is tested twice a year. January 2011: EC50 – 24 h: 0.78 mg/L (0.68 – 0.89) June 2011: EC50 – 24 h: 0.85 mg/L (0.74 – 0.96) Results of an interlaboratory test (ISO 6341): EC50 – 24 h: 0.6 - 2.1 mg/L

Test with daphnids: immobilisation - Au 217
16.6.5 Other information on materials and methods
The control consisted of purified drinking water and daphnids.
Control treatment
Less than 24 h old Daphnia magna were exposed to defined concentrations of the test item under static conditions for a period of 48 days. The daphnids were exposed without aeration. The daphnids were subjected to a light/dark cycle of 16/8 h. The test temperature during the test was 18 – 22 C. The temperature did not vary by more than 2°C within these limits. The light intensity did not exceed 15 -20 µE / (m2 * s) or 1125 - 1500 lux.
Test performance
Data evaluation:
Statistical method
In this report numerical values are frequently rounded to a smaller degree of precision (num-ber of digits) than have been used in the actual calculation. Minor differences in results ob-tained from calculations with rounded values compared to those obtained with higher preci-sion values are possible. They are, however, well within the limits of the experimental accu-racy and of no practical concern.
The parental immobility was used to calculate effects.
Statistical calculations: The results of the immobilisation were compared by a suitable test for multiple comparisons with a control after testing variance homogeneity. All statistical tests were performed with the computer software ToxRat Professional version 2.10.4.1 (ToxRat® Solutions GmbH).
16.7 Results
Chemical analyses were performed only for the main tests. In range-finder-tests the determi-nation of the test concentration is not obligatory according to the guideline. The gold concen-tration measured in NM-330 was lower than the value reported by the producer (expected: 0.01% corresponding to 100 mg/L; measured 43.8 mg/L). The NIST reference material 8011 (gold nanoparticles, nominal diameter 10 nm) was analysed along with the samples of the test; recovery amounted to about 100%. The recovery of the applied standard Au solution was about 100% as well. Details on the analytical method used by the producer of NM-330 are unknown. Therefore, the discrepancy of the results cannot be explained. Due to the dis-crepancy between measured and communicated values, the concentrations of the ecotoxi-cological analyses are presented as % NM-330 (v/v) in the test suspension.
16.7.1 Pre-test

Test with daphnids: immobilisation - Au 218
Summarised results are presented in
Effects:
Table 116.
A high toxicity was detected for the dispersant. In the control and in the test vessels with gold dispersion no immobilisation was observed. Based on these findings for the main test, follow-ing concentrations were selected:
NM-330 (gold nanoparticles): 10%, 5% (v/v)
NM-330DIS (dispersant): 10%, 5%, 2.5%, 1.25%, 0 625% (v/v)
Table 133: Immobilisation effects at 24 and 48 h.
Concentration Immobilisation 24 h [%] Immobilisation 48 h [%]
Control 0 5 NM-330 (gold nanoparticles) 1% (nominal) 0 0
10% (nominal) 0 0
50% (nominal) 0 0 NM-330DIS (dispersant) 1% (nominal) 100 10
10% (nominal) 100 100
50% (nominal) 100 100
Summarised results of the oxygen concentrations and pH-values are presented in
Water parameters
Table 134.
The dispersant resulted in a decrease of the oxygen concentration during the test which was less pronounced in the presence of gold nanoparticles. The pH was lower in the vessels with dispersant. In the presence of gold nanoparticles the decrease was less pronounced.
Table 134: Oxygen concentration and pH values during the test.
Concentration O2 [mg/L] O2 [%] pH start end start end start end
Control 9.0 8.3 100 97 8.1 8.3 NM-330 (gold nanoparticles) 1% 9.1 8.4 103 99 8.0 8.3
10% 8.8 8.0 100 93 7.9 8.2
50% 8.8 5.5 99 63 6.9 7.8 NM-330DIS (dispersant) 1% 8.8 4.8 102 54 6.7 8.0
10% 8.5 4.4 98 51 6.0 6.4
50% 7.9 5.0 90 58 5.8 5.8

Test with daphnids: immobilisation - Au 219
16.7.2 Main test
Based on the findings in the pre-test, the following concentrations were selected for the main test:
NM-330 (gold nanoparticles): 10%, 5% (v/v)
NM-330DIS (dispersant): 10%, 5%, 2.5%, 1.25%, 0,625% (v/v)
The zeta potential of NM-330 (10%) in purified tap water is presented in
Zeta potential
Table 118. A nega-tive value of -24 mV was achieved.
Table 135: Zeta potential.
Sample Zeta potential [mV] 10% NM-330 in purified tap water -24
The particle size distribution of NM-330 in the test suspensions was determined at day 0 and day 48. However, the concentrations of NM-330 were too low to give acceptable values. Therefore, no results are presented.
Particle size distribution
The concentrations of Au are presented in
Test item concentrations
Table 136. Only the two highest test concentra-tions were analysed. The gold concentration measured in NM-330 was lower than the value reported by the producer (expected: 0.01% corresponding to 100 mg/L; measured 43.8 mg/L). As already mentioned above, the NIST reference material 8011 (gold nanoparticles, nominal diameter 10 nm) was analysed along with the samples of the test; recovery amounted to about 100%. The recovery of the applied standard Au solution was about 100% as well. Details on the analytical method used by the producer of NM-330 are unknown. Therefore, the discrepancy of the results cannot be explained. Due to the discrepancy be-tween measured and communicated values, the concentrations of the ecotoxicological analyses are presented as % NM-330 (v/v) in the test suspension.
Using the measured concentration as 100% it is obvious that at day 0 the concentrations in the test suspensions were in the range of the expected values (expected 5% - measured 6%; expected 10% - measured 11%). During the incubation period of two days sedimentation occurred resulting in concentrations of gold of about 1% for both test concentrations.
Due to the uncertainty the concentrations of the ecotoxicological analyses are presented as % NM-330 in the test suspension.
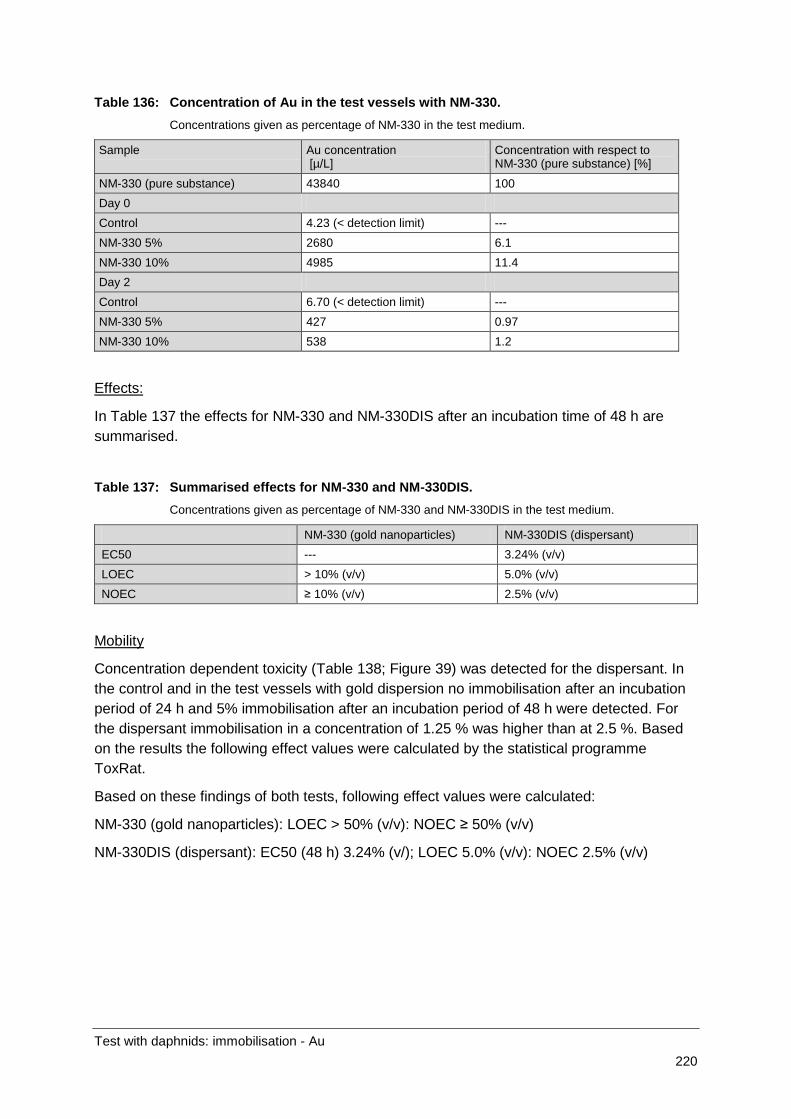
Test with daphnids: immobilisation - Au 220
Table 136: Concentration of Au in the test vessels with NM-330. Concentrations given as percentage of NM-330 in the test medium.
Sample Au concentration [µ/L]
Concentration with respect to NM-330 (pure substance) [%]
NM-330 (pure substance) 43840 100 Day 0 Control 4.23 (< detection limit) --- NM-330 5% 2680 6.1 NM-330 10% 4985 11.4 Day 2 Control 6.70 (< detection limit) --- NM-330 5% 427 0.97 NM-330 10% 538 1.2
In
Effects:
Table 137 the effects for NM-330 and NM-330DIS after an incubation time of 48 h are summarised.
Table 137: Summarised effects for NM-330 and NM-330DIS. Concentrations given as percentage of NM-330 and NM-330DIS in the test medium.
NM-330 (gold nanoparticles) NM-330DIS (dispersant) EC50 --- 3.24% (v/v) LOEC > 10% (v/v) 5.0% (v/v) NOEC ≥ 10% (v/v) 2.5% (v/v)
Concentration dependent toxicity (
Mobility
Table 138; Figure 39) was detected for the dispersant. In the control and in the test vessels with gold dispersion no immobilisation after an incubation period of 24 h and 5% immobilisation after an incubation period of 48 h were detected. For the dispersant immobilisation in a concentration of 1.25 % was higher than at 2.5 %. Based on the results the following effect values were calculated by the statistical programme ToxRat.
Based on these findings of both tests, following effect values were calculated:
NM-330 (gold nanoparticles): LOEC > 50% (v/v): NOEC ≥ 50% (v/v)
NM-330DIS (dispersant): EC50 (48 h) 3.24% (v/); LOEC 5.0% (v/v): NOEC 2.5% (v/v)

Test with daphnids: immobilisation - Au 221
Table 138: Immobilisation of Daphnia magna in the presence of NM-330 and NM-330DIS. Concentrations given as percentage of NM-330 and NM-330DIS in the test medium.
Concentration Immobilisation 24 h [%]
Immobilisation 48 h [%]
Control 0 5 NM-330 (gold nanoparticles)
10% 0 5
50% 0 5 NM-330DIS (dispersant) 0.625% 0 0
1.25% 0 30
2.5% 0 15
5% 35 65
10% 80 100
DataFunction95%-CL
Concentration [%]1 10
% Im
mob
ility
100
90
80
70
60
50
40
30
20
10
0
Figure 39: NM-330DIS – effect on mobility of Daphnia magna. Incubation time: 24 h.

Test with daphnids: immobilisation - Au 222
DataFunction
Concentration [%]1 10
% Im
mob
ility
100
90
80
70
60
50
40
30
20
10
0
Figure 40: NM-330DIS –effect on mobility of Daphnia magna. Incubation time: 48 h.
Water parameter
Summarised results of the oxygen concentrations and pH-values are presented in in Table 139.
Oxygen concentration The dispersant resulted in a decrease of the oxygen concentration during the test which was much more pronounced than in the control and in the presence of gold nanoparticles. In the control and the vessels with gold nanoparticles, the validity criterion (O2-concentration ≥ 3 mg/L at test end) was fulfilled. In all vessels with the dispersant the validity criterion was not fulfilled.
An influence of the low oxygen concentration on the mobility of the daphnids was not sus-pected. The oxygen concentration in the lowest and highest test concentration was compa-rable, although 0 and 100% effect was achieved.
pH value At the test start there was a concentration dependent decrease of the pH value in the test vessels with dispersant. The value was within the accepted range of 6 – 9.
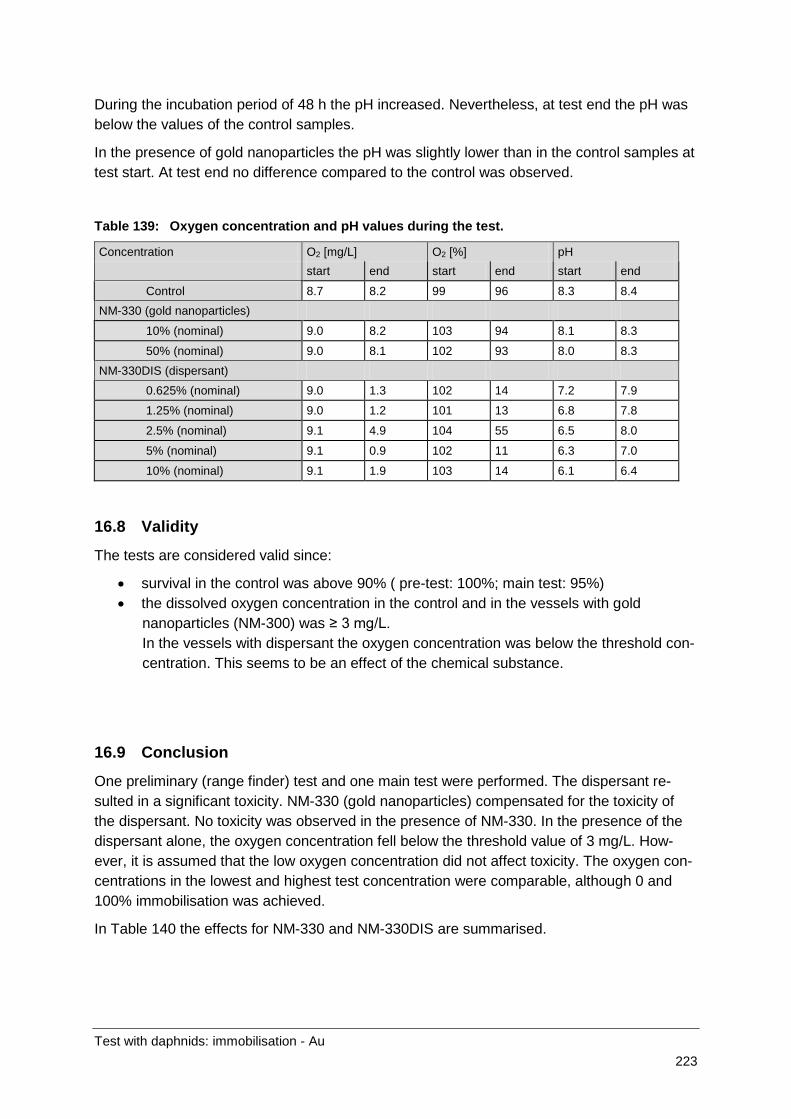
Test with daphnids: immobilisation - Au 223
During the incubation period of 48 h the pH increased. Nevertheless, at test end the pH was below the values of the control samples.
In the presence of gold nanoparticles the pH was slightly lower than in the control samples at test start. At test end no difference compared to the control was observed.
Table 139: Oxygen concentration and pH values during the test.
Concentration O2 [mg/L] O2 [%] pH start end start end start end
Control 8.7 8.2 99 96 8.3 8.4 NM-330 (gold nanoparticles)
10% (nominal) 9.0 8.2 103 94 8.1 8.3
50% (nominal) 9.0 8.1 102 93 8.0 8.3 NM-330DIS (dispersant) 0.625% (nominal) 9.0 1.3 102 14 7.2 7.9
1.25% (nominal) 9.0 1.2 101 13 6.8 7.8
2.5% (nominal) 9.1 4.9 104 55 6.5 8.0
5% (nominal) 9.1 0.9 102 11 6.3 7.0
10% (nominal) 9.1 1.9 103 14 6.1 6.4
16.8 Validity
The tests are considered valid since:
• survival in the control was above 90% ( pre-test: 100%; main test: 95%) • the dissolved oxygen concentration in the control and in the vessels with gold
nanoparticles (NM-300) was ≥ 3 mg/L. In the vessels with dispersant the oxygen concentration was below the threshold con-centration. This seems to be an effect of the chemical substance.
16.9 Conclusion
One preliminary (range finder) test and one main test were performed. The dispersant re-sulted in a significant toxicity. NM-330 (gold nanoparticles) compensated for the toxicity of the dispersant. No toxicity was observed in the presence of NM-330. In the presence of the dispersant alone, the oxygen concentration fell below the threshold value of 3 mg/L. How-ever, it is assumed that the low oxygen concentration did not affect toxicity. The oxygen con-centrations in the lowest and highest test concentration were comparable, although 0 and 100% immobilisation was achieved.
In Table 140 the effects for NM-330 and NM-330DIS are summarised.

Test with daphnids: immobilisation - Au 224
Table 140: Summarised effects for NM-330 and NM-330DIS. Concentrations given as percentage of NM-330 and NM-330DIS in the test medium.
NM-330 (gold nanoparticles) NM-330DIS (dispersant) EC50 --- 3.2% (v/v) LOEC > 50% (v/v) 5.0% (v/v) NOEC ≥ 50% (v/v) 2.5% (v/v)
16.10 Executive summary
NM-330 (gold nanoparticles in dispersant) and NM-330DIS (dispersant of the gold nanopar-ticles) were tested in the acute test with Daphnia magna (OECD 202). Two static tests with different test concentrations were performed. The mobility of the daphnids was recorded after 24 h and 48 h.
The gold concentration measured in NM-330 was lower than the value reported by the pro-ducer (expected: 0.01% corresponding to 100 mg/L; measured 43.8 mg/L). The NIST refer-ence material 8011 (gold nanoparticles, nominal diameter 10 nm) was analysed along with the samples of the test; recovery amounted to about 100%. The recovery of the applied standard Au solution was about 100% as well. As details on the analytical method used by the producer of NM-330 are not known, the discrepancy between the results cannot be ex-plained. Due to the discrepancy between measured and communicated values, the concen-trations of the ecotoxicological analyses are presented as % NM-330 (v/v) in the test sus-pension.
Due to the low concentration of the Au nanoparticles in NM-330 the particle size distribution could not be determined. The zeta potential determined for the highest test concentration (10%) in purified tap water (= test water) was -24 mV.
During the incubation period of two days sedimentation occurred, resulting in concentrations of gold in the overlaying water of 1% for both concentrations analysed (5 and 10%).
Concentration dependent toxicity was detected for the dispersant. In the control and in the test vessels containing the gold dispersion, no immobilisation was detected after an incuba-tion period of 24 h; 5% immobilisation occurred after an incubation period of 48 h.
The dispersant caused a reduction of the pH-value and of the oxygen concentration. The pH was still within the accepted range of 6 – 9. All concentrations of the dispersant caused a reduction of the oxygen concentration below the threshold value of 3 mg/L. It is assumed that the low oxygen concentration did not affect toxicity, as the oxygen concentrations at the low-est and highest test concentrations were the same despite immobilisation effects of 0% in the lowest test concentration and of 100% in the highest test concentration.
Based on the findings of both tests, the following effect values were calculated:
NM-330 (gold nanoparticles): LOEC > 50% (v/v): NOEC ≥ 50% (v/v)
NM-330DIS (dispersant): EC50 (48 h) 3.24% (v/v); LOEC 5.0% (v/v): NOEC 2.5% (v/v).

Test with algae: growth - Au 225
17 Growth Inhibition Tests with Algae (OECD TG 201) - Au
17.1 Test principle
The purpose of the test was to determine the effects of a substance on the growth of fresh water microalgae and/or cyanobacteria. Exponentially growing test organisms were exposed to the test substance in batch cultures over a period of 72 h. In spite of the relatively brief test duration, effects over several generations were able to be assessed.
17.2 Materials and methods
17.2.1 Test guideline
The test was performed according to OECD 201 (23.03.2006): OECD guideline for testing of chemicals – Fresh water Alga and Cyanobacteria, Growth inhibition Test.
17.2.2 GLP
The test was performed following the principles of GLP. In deviation to GLP no archiving of the raw data was performed and the Quality Assurance Unit was not involved with respect to the inspection of the test, of the raw data and of the report. Any laboratory equipment (e.g. balances, thermometers, pH-meters) was controlled and documented according to GLP.
17.3 Test substances
• NM-330: gold nanoparticles in dispersant • NM-330DIS: dispersant of the gold nanoparticles
17.4 Analytical monitoring
17.4.1 Details on sampling
The concentration of gold was determined in the pristine NM-330. The test concentrations were prepared in the multi-well-plates. As the volume was too small (i.e. below the level of quantification) no further chemical analyses were performed.
17.4.2 Details on analytical methods
The particle size distribution was measured using a Malvern Zeta-Sizer Nano ZS.
Characterisation of the application dispersion and test dispersion

Test with algae: growth - Au 226
17.4.3 Details on test suspensions
The mineral medium described in the OECD test guideline was used.
The pristine gold dispersion and the dispersing agent were used as stock dispersion. The test was performed in multi-well-plates and the different test concentrations were achieved by dilution in the respective plates.
Blank: 180 µL ultrapure water
96-well plates:
20 µL 2 fold OECD algae medium
Control: 160 µL ultrapure water
20 µL 2 fold OECD algae medium
20 µL algae suspension (105 cells/mL)
Dilution: 160 µL test item
20 µL 2 fold OECD algae medium
20 µL algae suspension (105 cells/mL)
24-well plates:
Blank: 1800 µL ultrapure water
200 µL 2 fold OECD algae medium
Control: 1600 µL ultrapure water
200 µL 2 fold OECD algae medium
200 µL algae suspension (105 cells/mL)
Dilution: 1600 µL test item
200 µL 2 fold OECD algae medium
200 µL algae suspension (105 cells/mL)
A dual dilution series was prepared. For the test requiring a volume of 200 µL, a 96-well plate was used. All vessels of the dilution wells were filled with 160 µL ultrapure water. For the highest test concentration the respective wells were filled with 320 µL prestine gold disper-sion or dispersing agent and 160 µL were transferred to the wells for the next test concentra-tion and mixed. This procedure is repeated for the further dilution concentrations. From the wells for the last test concentration 160 µL were depleted.
For test 1 the dilution of NM-330 was additionally performed using NM-330DIS instead of ultrapure water to achieve the same concentration of the dispersant in every test concentra-tion.
For the test requiring a volume of 2000 µL, a 24-well plate was used for the dilution series. A comparable procedure was applied as described above.

Test with algae: growth - Au 227
17.5 Test organism
The green alga Pseudokirchneriella subcapitata (obtained from the Culture Collection of Al-gae at the University of Göttingen, Germany; SAG database no. 61.81) was used as the test organism.
17.6 Study design
17.6.1 Study type
72 h, static.
17.6.2 Water medium type
Fresh water.
17.6.3 Total exposure duration
72 h.
• Test 1: performed in 96-well-plates (test volume 200 µL) November 21, 2011 - No-vember 24, 2011
• Test 2: performed in 96-well-plates (test volume 200 µL) November 29, 2011 - De-cember 01, 2011
• Test 3: performed in 24-well-plates (test volume 2000 µL) December 19, 2011 - De-cember 22, 2011
No post-exposure observation period was performed.
17.6.4 Test conditions
All experiments were incubated at 22 ± 1°C with light intensity adjusted to ~7000 lux (95 µE m-2 s-1) provided by OSRAM L 36W/21-840 Plus Eco lamps. The light intensity was meas-ured using an LI-189 luminance meter with radiation sensor (LI-COR, Lincoln, USA) with a cosine (2π) receptor in lux units.
Test temperature / illumination:
• Test 1: Test temperature: 22.0°C (permitted range: 21 – 24°C, controlled by ± 2°C) Illumination: 7568 lux
• Test 2: Test temperature: 22.0°C (permitted range: 21 – 24°C, controlled by ± 2°C) Illumination: 7721 lux
• Test 3: Test temperature: 22.0°C (permitted range: 21 – 24°C, controlled by ± 2°C) Illumination: 7822 lux

Test with algae: growth - Au 228
Test concentrations:
Following test concentrations for NM-302 and NM-302DIS were tested:
• Test 1 + 2: 80, 40, 20, 10, 50, 25, 12.5, and 6.25% • Test 3: 80 and 40%
• Test vessel: black multi-well plates (96-well, 24-well)
Details on test conditions:
• No. of replicates per concentration (replicates): 3 • No. of replicates per control (replicates): 6
VEHICLE CONTROL PERFORMED: No
Reference substance: A reference substance (3-5-dichlorophenol) is tested periodi-cally at the Fraunhofer Institute IME. March 2011: growth rate - EC50 – 72 h: 2.91 mg/L (2.35 – 3.63).
17.6.5 Other information on materials and methods
Three days prior to testing, a pre-culture of the test alga Pseudokirchneriella subcapitata was established in sterile OECD growth medium, according to test guideline no. 201, to obtain exponentially growing algae. All stock solutions for the OECD medium were prepared with purified water processed using an ELGA “PURELAB Ultra”. Cell concentrations were calcu-lated using an electronic particle counter (CASY 1 Model TT, Schärfe System, Reutlingen, Germany). The cultures were kept in suspension by rotary shaking at 100 rpm on a Multitron Incubation Shaker (INFORS, Switzerland).
Test performance
In the test, algal biomass was determined after 0, 24, 48 and 72 h by recording the fluores-cence intensity using a Tecan Spectrafluorplus microtiter plate reader. The fluorescence sig-nal was converted into cell numbers using a calibration curve.
Data evaluation:
Statistical method
In this report numerical values are frequently rounded to a smaller degree of precision (num-ber of digits) than have been used in the actual calculation. Minor differences in results ob-tained from calculations with rounded values compared to those obtained with higher preci-sion values are possible. They are, however, well within the limits of the experimental accu-racy and of no practical concern.
The cell number was used to calculate effects.

Test with algae: growth - Au 229
Statistical calculations: Calculations were performed with the computer software ToxRat Professional version 2.10.4.1 (ToxRat® Solutions GmbH).
17.7 Results
17.7.1 Particle size distribution
The particle size distribution was only determined in the pristine NM-330 as the dilutions were performed in the micro-wells resulting in a volume that is too little for measuring. The results are presented in Table 141. The zeta-potential of the pristine NM-330 gives no infor-mation on the conditions in the test. Therefore, no zeta potential was determined.
Table 141: Particle size distribution of the NM-330 (gold nanoparticles in dispersant) (mean value of 10 measurements; SD = standard deviation) Concentration given as percentage of NM-330 in the test medium
Concentration [mg/L]
Z-Average [nm] 1 (±SD)
PDI 2 (±SD)
Peak 1 [nm] (±SD)
Peak 2 [nm] (±SD)
Peak 1 [%]
Peak 2 [%]
Attenu-ation 3
Re-mark
100% Au 49.1 (±22.2)
0.2 (±0.03)
45.7 (±3.4)
8.2 (±1.0) 77 19 6
17.7.2 Test concentrations
The dilutions for the tests were performed in the multi-well plates. Due to the low volumes an insufficient amount of solution was available for further analyses. The concentrations of the ecotoxicological analyses are presented as % NM-330 (v/v) in the test suspension.
17.7.3 Test 1
In test 1 the toxicity of NM-330 and of NM-330DIS (dispersant of gold nanoparticles) was determined. NM-330 was investigated twice: the test concentrations were achieved by dilu-tion with ultrapure water and with NM-330DIS. Dilution in NM330DIS was performed in order to obtain comparable concentrations of the dispersant in all test concentrations.The test con-centrations of NM-330DIS were achieved by dilution with ultrapure water.
In the presence of the two highest concentrations of NM-330 (gold nanoparticles in dispers-ant) and ultrapure water as diluent, the fluorescence at day 0 fell below the background value. Subtraction of the background values resulted in negative values. After 24 h fluores-cence values above the background values were determined. In the highest test concentra-tion the fluorescence did not change until the end of the test (
Effects:
Figure 41). It was assumed that
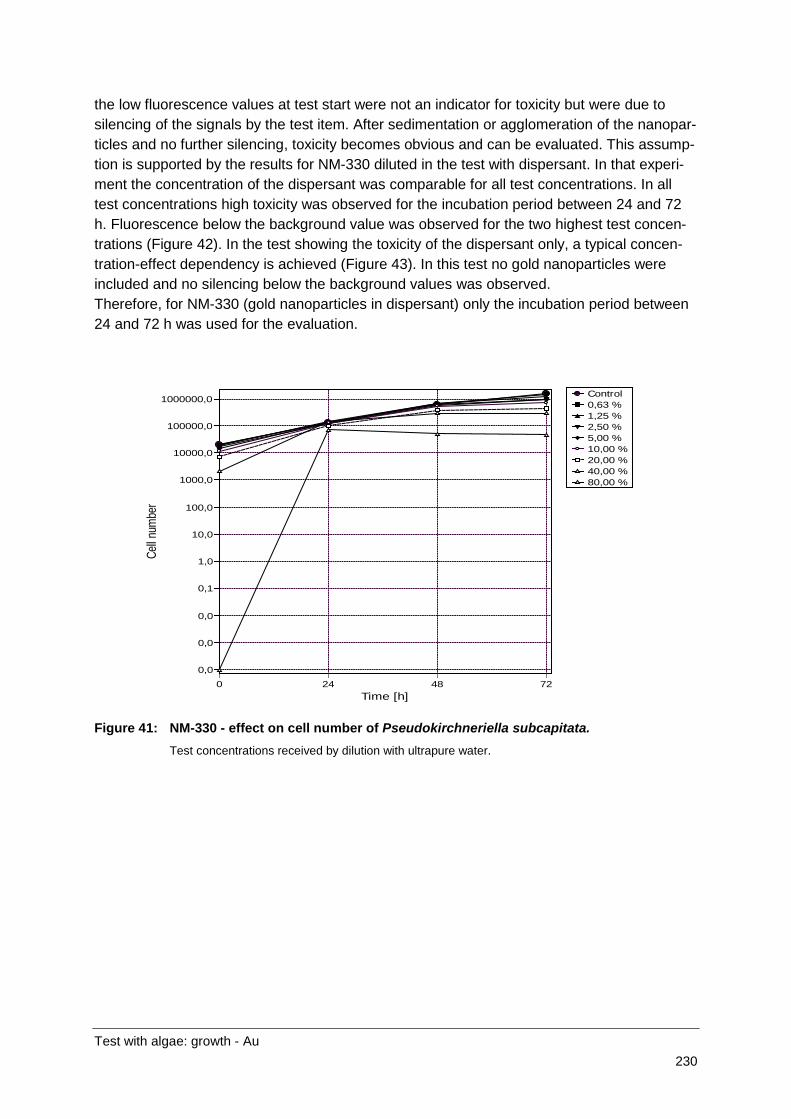
Test with algae: growth - Au 230
the low fluorescence values at test start were not an indicator for toxicity but were due to silencing of the signals by the test item. After sedimentation or agglomeration of the nanopar-ticles and no further silencing, toxicity becomes obvious and can be evaluated. This assump-tion is supported by the results for NM-330 diluted in the test with dispersant. In that experi-ment the concentration of the dispersant was comparable for all test concentrations. In all test concentrations high toxicity was observed for the incubation period between 24 and 72 h. Fluorescence below the background value was observed for the two highest test concen-trations (Figure 42). In the test showing the toxicity of the dispersant only, a typical concen-tration-effect dependency is achieved (Figure 43). In this test no gold nanoparticles were included and no silencing below the background values was observed. Therefore, for NM-330 (gold nanoparticles in dispersant) only the incubation period between 24 and 72 h was used for the evaluation.
Control0,63 %1,25 %2,50 %5,00 %10,00 %20,00 %40,00 %80,00 %
Time [h]7248240
Cell n
umbe
r
0,0
0,0
0,0
0,1
1,0
10,0
100,0
1000,0
10000,0
100000,0
1000000,0
Figure 41: NM-330 - effect on cell number of Pseudokirchneriella subcapitata. Test concentrations received by dilution with ultrapure water.

Test with algae: growth - Au 231
Control0,63 %1,25 %2,50 %5,00 %10,00 %20,00 %40,00 %80,00 %
Time [h]7248240
Cell n
umbe
r
0,0
0,0
0,0
0,1
1,0
10,0
100,0
1000,0
10000,0
100000,0
1000000,0
Figure 42: NM-330 - effect on cell number of Pseudokirchneriella subcapitata. Test concentrations received by dilution with NM-330DIS.
Figure 43: NM-330DIS - effect on cell number of Pseudokirchneriella subcapitata. Test concentrations received by dilution with ultrapure water.
A summary of the effective concentration results are presented in Table 142.

Test with algae: growth - Au 232
In the test with NM-330DIS high toxicity was observed. The values are comparable inde-pendent of the evaluation period (24 – 72 h or 0 – 72 h). Therefore it was concluded that the results for NM-330DIS, calculated following the guideline, (0 – 72 h), can be compared with the results obtained for NM-330 (which can only be evaluated for the incubation period of 24 – 72 h). In the presence of gold nanoparticles toxicity decreased. It is assumed that gold nanoparticles cover chemical groups of the dispersant responsible for toxicity. The high toxic-ity of dispersant is proven by the test with NM-330 and preparation of the test concentrations by dilution with dispersant. In all test vessels the dispersant concentration was comparable, and high toxicity and no clear concentration-effect curves were obtained.
The concentration-effect curves are presented in Figure 44 - Figure 51.
Table 142: NM-330 – 1st test with algae: summary of the effects. Effects given as percentage of NM-330 in the test medium.
Biomass Growth rate NM-330; concentrations achieved by dilution with ultrapure water
(evaluation period: 24 – 72 h) NOEC [%] 0.63 0.63 LOEC [%] 1.25 1.25 EC50 [%] 1 5.19 (4.43 – 6.07) 19.0 (15.3 – 23.9) NM-330; concentrations achieved by dilution with dispersant
(evaluation period: 24 – 72 h) NOEC [%] < 0.63 < 0.63 LOEC [%] ≤ 0.63 ≤ 0.63 EC50 [%] 1 No calculation possible due to quality of data NM-330DIS; concentrations achieved by dilution with ultrapure water
(evaluation period: 24 – 72 h) NOEC [%] < 0.63 0.63 LOEC [%] ≤ 0.63 1.25 EC50 [%] 1 0.46 (0.43 – 0.48) 1.61 (1.45 – 1.78) NM-330DIS; concentrations achieved by dilution with ultrapure water
(evaluation period: 0 – 72 h) NOEC [%] < 0.63 < 0.63 LOEC [%] ≤ 0.63 ≤ 0.63 EC50 [%] 1 0.48 (0.46 – 0.51) 2.42 (2.15 – 2.71)
1 Values in brackets: confidence interval
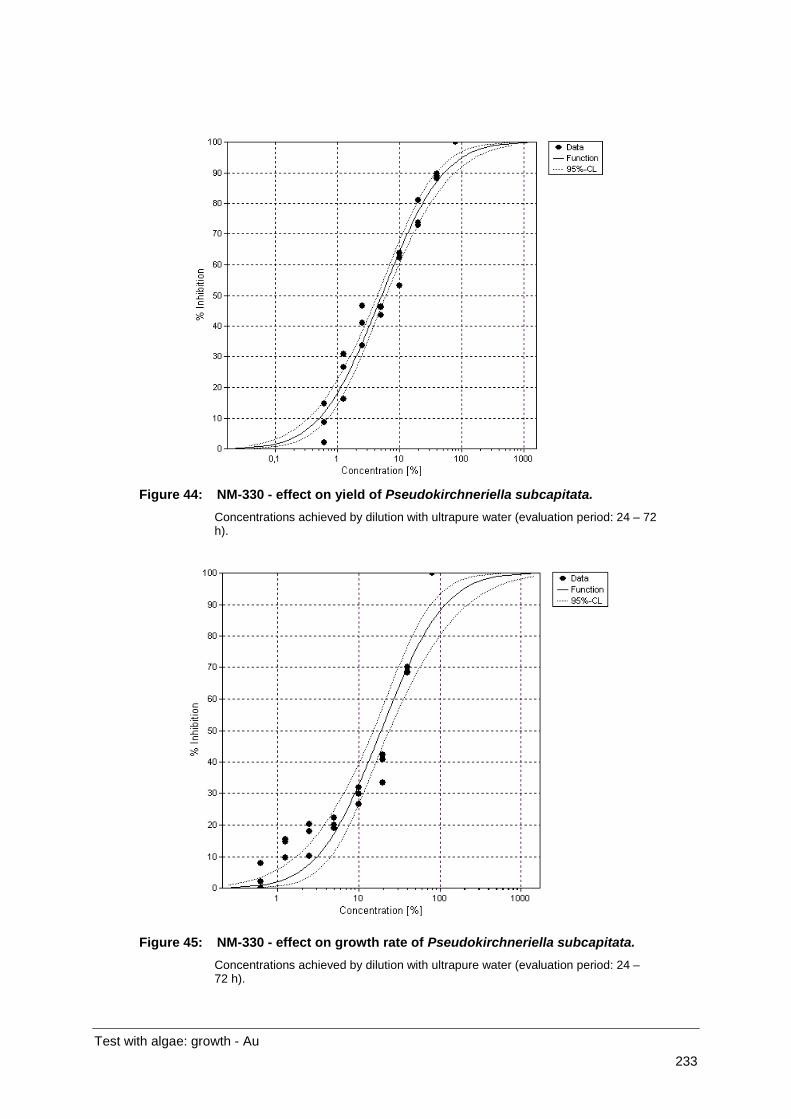
Test with algae: growth - Au 233
Figure 44: NM-330 - effect on yield of Pseudokirchneriella subcapitata.
Concentrations achieved by dilution with ultrapure water (evaluation period: 24 – 72 h).
Figure 45: NM-330 - effect on growth rate of Pseudokirchneriella subcapitata. Concentrations achieved by dilution with ultrapure water (evaluation period: 24 – 72 h).

Test with algae: growth - Au 234
Figure 46: NM-330 - effect on yield of Pseudokirchneriella subcapitata . Concentrations achieved by dilution with dispersant (evaluation period: 24 – 72 h).
Figure 47: NM-330 - effect on growth rate of Pseudokirchneriella subcapitata. Concentrations achieved by dilution with dispersant (evaluation period: 24 – 72 h).

Test with algae: growth - Au 235
Figure 48: NM-330DIS –effect on yield of Pseudokirchneriella subcapitata. Concentrations achieved by dilution with ultrapure water (evaluation period: 24 – 72 h).
Figure 49: NM-330DIS – effect on growth rate of Pseudokirchneriella subcapitata. Concentrations achieved by dilution with ultrapure water (evaluation period: 24 – 72 h).

Test with algae: growth - Au 236
Figure 50: NM-330DIS – effect on yield of Pseudokirchneriella subcapitata. Concentrations achieved by dilution with ultrapure water (evaluation period: 0 – 72 h).
Figure 51: NM-330DIS – effect on growth rate of Pseudokirchneriella subcapitata. Concentrations achieved by dilution with ultrapure water (evaluation period: 0 – 72 h).

Test with algae: growth - Au 237
17.7.4 Test 2
In test 2 the toxicity of NM-330 and NM-330DIS was determined to verify the results obtained in test 1. The test concentrations were achieved by dilution with ultrapure water.
The compiled effect and threshold concentrations are presented in
Effects:
Table 143. The concen-tration-effect curves are shown in Figure 52- Figure 55. The results are comparable to test 1. Toxicity of NM-330 is smaller than toxicity of NM-330DIS. Therefore, it was concluded that gold nanoparticles reduce the toxicity of the dispersant.
Table 143: NM-330 – 2nd test with algae: summary of the effects. Effects given as percentage of NM-330 in the test medium.
Biomass Growth rate NM-330; concentrations achieved by dilution with ultrapure water
(evaluation period: 24 – 72 h) NOEC [%] 0.63 0.63 LOEC [%] 1.25 1.25 EC50 [%] 1 8.96 (6.62 – 12.2) 39.2 (35.1 – 43.6) NM-330DIS; concentrations achieved by dilution with ultrapure water
(evaluation period: 0 – 72 h) NOEC [%] < 0.625 < 0.625 LOEC [%] ≤ 0.625 ≤ 0.625 EC50 [%] 1 1.05 (1.00 – 1.10) 4.59 (3.51 – 5.97)
1 Values in brackets: confidence interval

Test with algae: growth - Au 238
Figure 52: NM-330 – effect on yield of Pseudokirchneriella subcapitata. Concentrations achieved by dilution with ultrapure water (evaluation period: 24 – 72 h)
Figure 53: NM-330 – effect on growth rate of Pseudokirchneriella subcapitata. Concentrations achieved by dilution with ultrapure water (evaluation period: 24 – 72 h).

Test with algae: growth - Au 239
Figure 54: NM-330DIS – effect on yield of Pseudokirchneriella subcapitata. Concentrations achieved by dilution with ultrapure water (evaluation period: 0 – 72 h).
Figure 55: NM-330DIS - effect on growth rate of Pseudokirchneriella subcapitata. Concentrations achieved by dilution with ultrapure water (evaluation period: 0 – 72 h).

Test with algae: growth - Au 240
17.7.5 Test 3
Tests 1 and 2 were performed in 96-well microplates. Due to this, a higher number of variants and test concentrations could be investigated at the same time. For four out of five experiments, one of the three validity criteria was not fulfilled. According to OECD 201, the mean coefficient of variation, measured in the control from 0 to 72 h, must not be higher than 35%. In most tests performed here this coefficient of variation was exceeded. Low incubation volume (200 µL) is the assumed reason. Therefore, a further test was performed in 24-well plates with a test volume of 2 mL and a reduced number of test concentrations (80 and 40% test item concentration in the test). The results are presented in Figure 56 and Figure 57.
For both test items (NM-330 and NM-330DIS) the validity criteria were fulfilled.
The percentage inhibition of the two test concentrations for NM-330 tested in all three tests were rather comparable (Table 144). Although only two concentrations were tested in test 3 the EC50 value was in a comparable magnitude of order as for Test 1 and Test 2. An EC50 of 53.01% (50.5 – 55.6) was calculated (Test 1: 19.0%; Test 2: 39.2%).
NM-330DIS showed expected high toxicity (about 100% effect for yield and growth rate for both test concentrations).
Based on the results it was concluded that tests performed in 96-well microplates can be used if the amount of test substance is very limited. Although one of three validity criteria was not fulfilled in most of the tests with a test volume of 200 µL the results are considered to be suitable for risk assessment.
Table 144: Summarised percentage inhibition of algae growth by the concentrations of NM-330 applied in all tests (evaluation period: 24 – 72 h). Concentration of NM-330 given as percentage of NM-330 in the test medium.
Inibition of growth rate [%] 40% of NM-330 80% of NM-330 Test 1 52.5 100 Test 2 50.6 100 Test 3 38.1 67.1

Test with algae: growth - Au 241
Figure 56: Concentration-effect curve showing the influence of NM-330on yield of the introduced Pseudokirchneriella subcapitata. Concentrations achieved by dilution with ultrapure water (evaluation period: 0 – 72 h)
Figure 57: Concentration-effect curve showing the influence of NM-330 on growth rate of the introduced Pseudokirchneriella subcapitata. Concentrations achieved by dilution with ultrapure water (evaluation period: 24 – 72 h).

Test with algae: growth - Au 242
17.8 Validity
The validity criteria refer to the control and an incubation period of 72 h. Therefore, for the validity check the whole incubation period was used, although for the tests with NM-330 the incubation period of 24 – 72 h was used for the evaluation of the effects (see 17.7.3).
Validity criteria according to OECD TG 201:
• Factor of the biomass parameter, measured in the control between 0 and 72 h, must be at least 16.
• Evaluation of the section-by-section growth rates: the mean coefficient of variation, measured in the control from 0 to 72 h, must not be higher than 35%.
• The coefficient of variation of the mean specific growth rate, measured in the control from 0 to 72 h, must not exceed 7%.
• NM-330, concentrations achieved by dilution with ultrapure water (evaluation period: 24 – 72 h): valid
Test 1:
o Factor of the biomass parameter, measured in the control between 0 and 72 h: 79.8 (validity criterion fulfilled).
o Evaluation of the section-by-section growth rates: Arithmetic means of the control replicates from 0 h to 72 h were: Replicate 1: 1.538; Replicate 2: 1.493; Replicate 3: 1.481; Replicate 4: 1.402; Replicate 5: 1.431; Replicate 6: 1.393. [1/d]. Coefficients of variation in control replicates from 0 to 72 h were: Replicate 1: 32.9%; Replicate 2: 32.5%; Replicate 3: 36.0%; Replicate 4: 32.5%; Replicate 5: 35.9%; Replicate 6: 34.1%. The mean of the replicate co-efficients of variation in the section-by-section growth rate was 34.0% (validity criterion fulfilled).
o The coefficient of variation of the mean specific growth rate replicates in the control between 0 and 72 h was 3.9% (validity criterion fulfilled).
• NM-330, concentrations achieved by dilution with dispersant (evaluation period: 24 – 72 h): limited validity
o Factor of the biomass parameter, measured in the control between 0 and 72 h: 93.3 (validity criterion fulfilled).
o Evaluation of the section-by-section growth rates: Arithmetic means of the control replicates from 0 h to 72 h were: Replicate 1: 1.530; Replicate 2: 1.544; Replicate 3: 1.493; Replicate 4: 1.500; Replicate 5: 1.490. [1/d]. Coeffi-cients of variation in control replicates from 0 to 72 h were: Replicate 1: 39.1%; Replicate 2: 40.3%; Replicate 3: 42.9%; Replicate 4: 43.4%; Replicate 5: 41.0%. The mean of the replicate coefficients of variation in the section-by-section growth rate was: 41.3%. The test did not fulfil this validity criterion!
o The coefficient of variation of the mean specific growth rate replicates in the control between 0 and 72 h was 1.6% (validity criterion fulfilled).
• NM-330DIS: limited validity o Factor of the biomass parameter: 172.0 (validity criterion fulfilled)

Test with algae: growth - Au 243
o Evaluation of the section-by-section growth rates: Arithmetic means of the control replicates from 0 h to 72 h were: Replicate 1: 1.755; Replicate 2: 1.712; Replicate 3: 1.703; Replicate 4: 1.705; Replicate 5: 1.742; Replicate 6: 1.679. [1/d]. Coefficients of variation in control replicates from 0 to 72 h were: Replicate 1: 40.3%; Replicate 2: 37.5%; Replicate 3: 36.9%; Replicate 4: 37.1%; Replicate 5: 38.3%; Replicate 6: 35.8%. The mean of the replicate co-efficients of variation in the section-by-section growth rate was: 37.6%. The test did not fulfil this validity criterion!
o The coefficient of variation of the mean specific growth rate replicates in the control between 0 and 72 h was 1.6%. The test this (validity criterion fulfilled).
• NM-330, concentrations achieved by dilution with ultrapure water (evaluation period: 24 – 72 h): limited validity
Test 2
o Factor of the biomass parameter: 85.3 (validity criterion fulfilled). o Evaluation of the section-by-section growth rates: Arithmetic means of the
control replicates from 0 h to 72 h. [1/d]. Coefficients of variation in control replicates from 0 to 72 h were: Replicate 1: 42.9%; Replicate 2: 45.5%; Repli-cate 3: 44.0%; Replicate 4: 51.4%; Replicate 5: 47.4%; Replicate 6: 47.5%. The mean of the replicate coefficients of variation in the section-by-section growth rate was: 46.5%. According to OECD 201, the mean coefficient of variation, measured in the control from 0 to 72 h, must not be higher than 35%. The test did not fulfil this validity criterion!
o The coefficient of variation of the mean specific growth rate replicates in the control between 0 and 72 h was 2.6% (validity criterion fulfilled).
• NM-330DIS: limited validity o Factor of the biomass parameter: 104.0 (validity criterion fulfilled). o Evaluation of the section-by-section growth rates: Arithmetic means of the
control replicates from 0 h to 72 h were: Replicate 1: 1.567; Replicate 2: 1.574; Replicate 3: 1.540; Replicate 4: 1.536; Replicate 5: 1.553; Replicate 6: 1.520. [1/d]. Coefficients of variation in control replicates from 0 to 72 h were: Replicate 1: 42.8%; Replicate 2: 42.2%; Replicate 3: 45.1%; Replicate 4: 42.2%; Replicate 5: 41.4%; Replicate 6: 39.0%. The mean of the replicate co-efficients of variation in the section-by-section growth rate was: 42.1%. The test did not fulfil this validity criterion!
o The coefficient of variation of the mean specific growth rate replicates in the control between 0 and 72 h was 1.3% (validity criterion fulfilled).
• NM-330, concentrations achieved by dilution with ultrapure water (evaluation period: 24 – 72 h): valid
Test 3
o Factor of the biomass parameter: 36.9 (validity criterion fulfilled). o Evaluation of the section-by-section growth rates: Arithmetic means of the
control replicates from 0 h to 48 h were: Replicate 1: 1.761; Replicate 2:

Test with algae: growth - Au 244
1.809; Replicate 3: 1.778; Replicate 4: 1.888; Replicate 5: 1.804; Replicate 6: 1.801. [1/d]. Coefficients of variation in control replicates from 0 to 48 h were: Replicate 1: 1.0%; Replicate 2: 0.1%; Replicate 3: 0.5%; Replicate 4: 0.8%; Replicate 5: 0.9%; Replicate 6: 4.3%. The mean of the replicate coefficients of variation in the section-by-section growth rate was: 1.3% (validity criterion ful-filled).
o The coefficient of variation of the mean specific growth rate replicates in the control between 0 and 48 h was 2.4% (validity criterion fulfilled).
• NM-330DIS: valid o Factor of the biomass parameter: 174.0 (validity criterion fulfilled). o Evaluation of the section-by-section growth rates: Arithmetic means of the
control replicates from 0 h to 72 h were: Replicate 1: 1.760; Replicate 2: 1.723; Replicate 3: 1.683; Replicate 4: 1.658; Replicate 5: 1.751; Replicate 6: 1.735. [1/d]. Coefficients of variation in control replicates from 0 to 72 h were: Replicate 1: 0.7%; Replicate 2: 8.6%; Replicate 3: 9.9%; Replicate 4: 24.0%; Replicate 5: 5.3%; Replicate 6: 7.3%. The mean of the replicate coefficients of variation in the section-by-section growth rate was: 9.3% (validity criterion ful-filled).
o The coefficient of variation of the mean specific growth rate replicates in the control between 0 and 72 h was 2.3% (validity criterion fulfilled).
17.9 Conclusion
The dispersant NM-330DIS showed a high toxicity. This toxicity was reduced in the presence of gold nanoparticles.
Tests investigating NM-330 toxicity to algae could only be evaluated for the 24 -72 h period of the test. In the presence of the two highest concentrations of NM-330 (gold nanoparticles in dispersant) and ultrapure water as diluent, the fluorescence at day 0 fell below the back-ground value. Subtraction of the background values resulted in negative values. After 24 h fluorescence values above the background values were determined. It was assumed that the low fluorescence values at test start were not an indicator for toxicity but were due to silenc-ing of the signals by the test item. After sedimentation or agglomeration of the nanoparticles and no further silencing, toxicity became obvious and could be evaluated. Tests with NM-330DIS were assessed according to the guideline (incubation period: 0 – 72 h) even though an evaluation just for the period from 24 - 72 h resulted in effect and threshold values compa-rable to those for the complete test period. As the reduced and the standard incubation peri-ods resulted in comparable results for NM-330DIS, the results of both test substances were compared despite the different incubation periods.
Performing a test in 96 well plates with a test volume of 200 µL, one of the three validity crite-ria mentioned in the guideline was difficult to fulfil (mean of the replicate coefficients of varia-tion in the section-by-section growth rate). Using a test volume of 2 mL (24 well plates) im-proved the validity of the tests. However, the use of 24 well plates decreases the number of variants which can be investigated in parallel.

Test with algae: growth - Au 245
The effect and threshold concentrations were comparable for both test volumes.
In Table 145 the effects of NM-330 and NM-330DIS on algal growth are summarised. In Tab-le 146 the percent inhibition of algal growth by two tested concentrations of NM-330 of all tests are shown.
17.10 Executive summary
NM-330 (gold nanoparticles in dispersant) and NM-330DIS (dispersant of the gold nanoparti-cles) were tested in the growth test with green algae (OECD 201). Every 24 h, fluorescence was recorded as an indicator for algal growth. The fluorescence signal was converted into cell numbers using a calibration curve.
The gold concentration measured in NM-330 was lower than the value reported by the pro-ducer (0.01% corresponding to 100 mg/L expected; 43.8 mg/L measured). The NIST refer-ence material 8011 (gold nanoparticles, nominal diameter 10 nm) was analysed along with the samples of the test and the recovery amounted to about 100%. The recovery of the ap-plied standard Au solution was about 100% as well. As details on the analytical method used by the producer of NM-330 are not known, the discrepancy between the results cannot be explained. Due to the discrepancy between measured and communicated values, the con-centrations of the ecotoxicological analyses are presented as % NM-330 (v/v) in the test suspension.
As only minor amounts of the test substance (NM-330) were available for testing the test was performed in multi-well plates (96-well plates and 24-well plates). Tests using 96 well plates with a test volume of 200 µL per well can be used, if the available amount of test substance is strongly limited. However, using such a small amount of test item resulted in fulfilment of only two of the three validity criteria mentioned in the guideline. The validity criterion “Mean of the replicate coefficients of variation in the section-by-section growth rate” was unfulfilled. A test volume of 2 mL (24-well plates) improved the validity of the tests. However, the use of 24 well plates decreases the number of variants which can be investigated in parallel.
The dispersant itself (NM-330DIS) showed a high toxicity. The toxicity is reduced in the pres-ence of gold nanoparticles.
For the tests with NM-330 only the 24 - 72 h period of the tests could be evaluated. Tests with NM-330DIS were assessed as described in the guideline (incubation period: 0 – 72 h) but an evaluation restricted to the period from 24 - 72 h resulted in effect and threshold val-ues comparable to those obtained for the complete test period. As an evaluation using the reduced and the normal incubation period gave comparable results for NM-330DIS, the re-sults of both tests were compared despite the different incubation periods.
The effect and threshold concentrations are comparable for both test volumes.
In Table 167 the effects obtained for NM-330 and NM-330DIS are summarised. Table 168 shows the percent inhibition of algal growth for the concentrations of NM-330 applied in all tests.
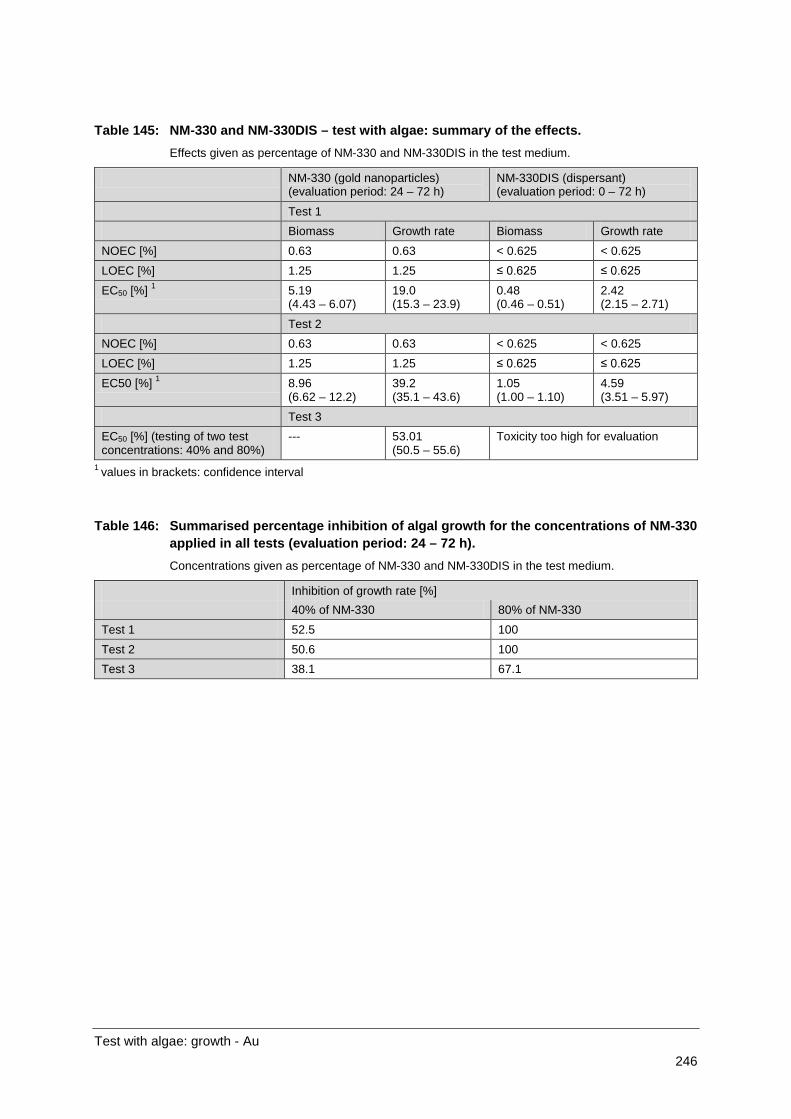
Test with algae: growth - Au 246
Table 145: NM-330 and NM-330DIS – test with algae: summary of the effects. Effects given as percentage of NM-330 and NM-330DIS in the test medium.
NM-330 (gold nanoparticles) (evaluation period: 24 – 72 h)
NM-330DIS (dispersant) (evaluation period: 0 – 72 h)
Test 1 Biomass Growth rate Biomass Growth rate NOEC [%] 0.63 0.63 < 0.625 < 0.625 LOEC [%] 1.25 1.25 ≤ 0.625 ≤ 0.625 EC50 [%] 1 5.19
(4.43 – 6.07) 19.0 (15.3 – 23.9)
0.48 (0.46 – 0.51)
2.42 (2.15 – 2.71)
Test 2 NOEC [%] 0.63 0.63 < 0.625 < 0.625 LOEC [%] 1.25 1.25 ≤ 0.625 ≤ 0.625 EC50 [%] 1 8.96
(6.62 – 12.2) 39.2 (35.1 – 43.6)
1.05 (1.00 – 1.10)
4.59 (3.51 – 5.97)
Test 3 EC50 [%] (testing of two test concentrations: 40% and 80%)
--- 53.01 (50.5 – 55.6)
Toxicity too high for evaluation
1 values in brackets: confidence interval
Table 146: Summarised percentage inhibition of algal growth for the concentrations of NM-330 applied in all tests (evaluation period: 24 – 72 h). Concentrations given as percentage of NM-330 and NM-330DIS in the test medium.
Inhibition of growth rate [%] 40% of NM-330 80% of NM-330 Test 1 52.5 100 Test 2 50.6 100 Test 3 38.1 67.1

Test with fish: fish embryo test - Au 247
18 Tests with Fish Embryos (OECD draft proposal) - Au
18.1 Test principle
The aim of the test was to elucidate representatively, at which concentrations of NM-330DIS and NM-330DIS the embryos of fish were affected significantly.
Fertilised eggs of zebra fish (Danio rerio) were exposed to five concentrations under static conditions in multi-well plates (individual exposure). Coagulated eggs and abnormalities in genesis were recorded.
18.2 Materials and methods
18.2.1 Test guideline
The test was performed according the OECD draft proposal for a new guideline “Fish Em-bryo Toxicity (FET) Test” (2006). In accordance with the presently discussed modified ver-sion, the test was extended to 96 h.
18.2.2 GLP
The test was performed following the principles of GLP. In deviation to GLP no archiving of the raw data was performed and the Quality Assurance Unit was not involved with respect to the inspection of the test, of the raw data and of the report. Any laboratory equipment (e.g. balances, thermometers, pH-meters) was controlled and documented according to GLP.
18.3 Test substances
• NM-330: gold nanoparticles in dispersant • NM-330DIS: dispersant of the gold nanoparticles
18.4 Analytical monitoring
18.4.1 Details on test suspensions
ISO water (1/5 strength) was used as test water and to prepare the test suspension (58.8 mg CaCl2 * 2 H2O; 24.7 mg MgSO4 * 7 H2O; 13.0 mg NaHCO3; 1.15 mg KCl)
The pristine gold dispersion and the dispersing agent were used as stock dispersion. The test concentrations were achieved by dilution.
50%: 50 mL gold dispersion / dispersing agent per 100 mL with ISO water
10.0%: 10 mL gold dispersion / dispersing agent per 100 mL with ISO water

Test with fish: fish embryo test - Au 248
1.0%: 1.0 mL gold dispersion / dispersing agent per 100 mL with ISO water
0.1%: 100 µL gold dispersion / dispersing agent per 100 mL with ISO water
0.01%: 10 µL gold dispersion / dispersing agent per 100 mL with ISO water
18.5 Test organism
Danio rerio (Teleostei, Cyprinidae; Hamilton-Buchanan 1822); laboratory breed
Origin of the fish: West Aquarium GmbH PB 146 37431 Bad Lauterberg, Germany. Fertilised eggs for the test were obtained from individuals that were reared in the laboratory of the Fraunhofer Institute, Schmallenberg, Germany.
Breeding conditions: Parental fish were held in 150 L aquaria.. At time of egg collec-tion, parental fish were about 18 months old (maximum age for parental fish is 2 years). Stock density was approximately 80 fish per vessel. The holding temperature was 26°C ± 1°C. The light/dark cycle was 12 h/12 h. The flow through rate was ad-justed to achieve a 2-fold exchange of water per day. Fish were fed daily ad libitum with TetraMinR Hauptfutter (Tetra Werke, Melle, Germany) and brine shrimp nauplii (Artemia salina). The broodstock were visually checked every working day for mortality, illness, parasites or abnormal behaviour. No prophy-lactic treatment of fish took place. Only healthy fish without dis-eases and abnormalities were used as parental fish for the pro-duction of fertilised eggs. Fertilisation rate was checked to fulfil the quality criterion of at least 50% for accepting the batch as parental fish for the production of fertilised eggs for a study.
Obtaining of eggs: Eggs were collected with spawning-trays (made of glass) that were placed at the bottom of the holding vessels described above. The trays were covered with a lattice (stainless steel), to prevent the adults from predating on the eggs, and artificial plant substrate (modified method according to (5)) to stimulate spawning into the tray).
Lighting (one neon lamp per vessel, light intensity approxi-mately 1000 lux, measured 5 cm above the water surface in the middle of the test vessel) induced mating of fish and spawning.
The collected eggs were transferred from the spawning-tray onto a sieve, rinsed with clean water in order to remove faeces and food waste, put into glass dishes and incubated at 26.0°C.
Holding water: Purified drinking water was used as holding water. The purifica-tion included filtration with activated charcoal, passage through
Test with fish: fish embryo test - Au 249
a lime-stone column and aeration. To avoid copper contamina-tion, plastic water pipes were used in the testing facilities. The following water chemistry data are recorded regularly in the testing facility: pH, conductivity, dissolved oxygen content, con-tent of nitrate, nitrite, ammonium (NH4+), phosphate, calcium, magnesium, total hardness, alkalinity, DOC content, content of metals (copper, iron, manganese and zinc). During preparation and performance of the test, all values were within the admissi-ble ranges.
18.6 Study design
18.6.1 Study type
Short-term test, static.
18.6.2 Water medium type
Fresh water.
18.6.3 Total exposure duration
96 h.
• November 30, 2011 - December 04, 2011
No post-exposure observation period was performed.
18.6.4 Test conditions
Fertilised eggs were exposed under static conditions to the test substance for a period of 96 h. The test temperature during the test was adjusted to 26.0°C. Polystyrene multi-well dishes (24 wells; NUNC, Denmark) with a total volume of 5 mL per well and flat bottom were used as test vessels. After 24 h and 48 h coagulated eggs and abnormalities in genesis were recorded. After 72 and 96 h hatching behaviour was documented.
Test conditions
After collecting the eggs, a pool of 50 – 100 undifferentiated eggs was transferred with a widened and deburred pipette tip into each of the beakers prepared with test dispersion and control water to guarantee an exposure to the test substance in the early genesis state. Time from spawning until transfer into the test solutions did not exceed one hour. From these egg
Test procedure

Test with fish: fish embryo test - Au 250
pools, one fertilised egg (microscopic determination of early blastula stage) was then trans-ferred in each well.
For each test concentration one multi well dish was used. The first vertical column of wells (4 wells) was reserved for the control and was filled with 2 mL ISO water (1/5 strength) per well. The other 20 wells were filled with the test dispersions (2 mL per well). After adding the eggs to the multi-well dishes the wells were covered with sealing tape and incubated in an incuba-tor at 26.0 ± 1°C with a light/dark cycle of 12/12 h. The remaining test solutions and purified drinking water were filled into beakers and also incubated.
The oxygen concentrations (WTW OXI 196) and pH values (WTW, pH-Meter 535) were measured in the beakers directly before adding the eggs.
All eggs (20 in the control and 20 in every test concentration) were observed and evaluated every 24 h, using an inverse microscope. Normally developed embryos were indicated in the protocol by the letter code N; all abnormal developments were indicated by specific letters (
Observation and evaluation letter code
Table 147). All listed abnormities are assumed to have lethal effects on the embryos. For the description of hatching the letter code is presented in Table 148.
Table 147: Letter code for observed effects.
Endpoints after 24 h Endpoints after 48 h N: normally developed Embryo N: normally developed Embryo K: coagulated K: coagulated S: no somites H: no heart beat C: tales not separated from the yolk sac B: no blood cycle A: no development of eyes P: no pigmentation T: no spontaneous movement O: edema
Table 148: Letter code for observed effects on hatching behaviour.
Hatching behaviour after 72 and 96 h G: hatched larvae, alive R: not yet hatched, alive M: hatched larvae, dead U: not yet hatched, dead
9.3.5 Endpoint evaluation and statistical analysis
The sum of individuals per concentration meeting lethal endpoint criteria was used to calcu-late a concentration effect - relationship by using the probit analysis. From this the LC/EC50- and LC/EC10-values were derived.
Heartbeat frequency was counted for 10 seconds per embryo. Only embryos without ab-normity were included in the statistical evaluation (t-test or U-test).

Test with fish: fish embryo test - Au 251
Statistical calculations:
Statistical method
Calculations were performed with the computer software ToxRat Professional version 2.10.4.1 (ToxRat® Solutions GmbH).
18.7 Results
The zeta potential of NM-330 in ISO water (1/5 strength) is presented in Table 118. A nega-tive value was achieved.
Table 149: Zeta potential in ISO water (1/5 strength)
Sample Zeta potential [mV] 10% NM-330 -26.1 50% NM-330 -39.1
The pH-values and oxygen saturation at test start are presented in Table 150.
Table 150: pH-values and oxygen saturation at test start.
Initial concentration [%] Control 0.01 0.1 1 10 50
NM-330 (gold in dispersant) O2 [%] 93 94 92 92 92 93 pH 7.8 7.2 7.2 7.1 7.0 5.9 NM-330DIS (dispersant) Observations after 72 h
O2 [%] 93 94 93 92 93 93 pH 7.8 7.3 6.8 6.0 6.2 6.0
The effect values are presented in Table 151.The dispersant NM-330DIS resulted in a con-centration-effect relationship concerning abnormities of the embryos. The dispersant at 50% resulted in complete mortality of all embryos. In the presence of 10% dispersant the larvae hatched after a shorter period of time. Some of them showed a lower heartbeat or missing blood circulation. After 120 h the hatched larvae were dead. In contrast, NM-330 (gold in dispersant) resulted in no abnormities after 24 and 48 h. The heartbeat was comparable to the control. Also the hatching behaviour was comparable to the control. An overview of the effects on the embryos is shown in Table 152. The hatching behaviour is presented in Table 153. The percentage of coagulated embryos and hatched organisms is summarised in Table 154 and Table 155.

Test with fish: fish embryo test - Au 252
Table 151: Effect concentrations of NM-330 and NM-330DIS. Concentrations given as % of the product in the test (v/v).
NM-330 NM-330DIS 48 h 72 h 96 h 48 h 72 h 96 h Development of embryos (mortality) LC10 [%] > 50% 1 > 50% 1 > 50% 1 48 10 9 LC50 [%] > 50% 1 > 50% 1 > 50% 1 10 17 16 Hatching EC10 [%] --- 3 > 50 % 1 > 50% 1 --- 3 1.2 nc 2 EC50 [%] --- 3 > 50 % 1 > 50% 1 --- 3 10 nc 2
1 highest test concentration; 2 not calculable (10%: comparable to control; 50% all are dead); 3 no hatching before 48 h, therefore, no EC value determinable

Test with fish: fish embryo test - Au 253
Table 152: Overview on effects of embryos (number of individuals) observed during the study. K (coagulated) indicates clear lethality, the other indicators (referring to Table 147) are assumed to result in lethality. They may occur at the same time in one embryo.
Initial concentration [%] Control 0.01 0.1 1 10 50
NM-330 (gold in dispersant) Effects after 24 h 3 K 0 1 1 0 0 0 Sum of affected embryos after 24 h 0 1 1 0 0 0
Effects after 48 h 3
K 0 1 1 0 0 Due to sedimenta-tion of parti-cles on eggs no evalua-tion of the embryos possible
BO 0 0 1 0 0 Sum of affected embryos after 48 h 0 1 2 0 0
Heartbeat frequency after 48 h. mean 1 156.8 157.7 157.3 158 156.4
Standard deviation 3.8 3.6 3.9 4.4 3.4
NM-330DIS (dispersant) Effects after 24 h 3
K 1 0 0 1 1 6 SCAT 0 0 0 0 1 0 Sum of affected embryos after 24 h 1 0 0 1 2 6
Effects after 48 h 3
K 1 0 0 1 2 11 2 O 0 0 0 0 1 0 Sum of affected embryos after 48 h 1 0 0 1 4 11 2
Heartbeat frequency after 48 h. mean 1 156.6 157.8 157.8 158.1 156.7 155.6
Standard deviation 4.9 3.3 4.2 4.1 3.8 4.7
1 per minute, embryos without abnormities only; 2 five of the embryos were completely developed, however dead, no heartbeat, no blood circulation; 3 K: coagulated ; S: no somites; C: tales not separated from the yolk sac; A: no development of eyes; T: no spontaneous movement; B: no blood circulation; O: edema
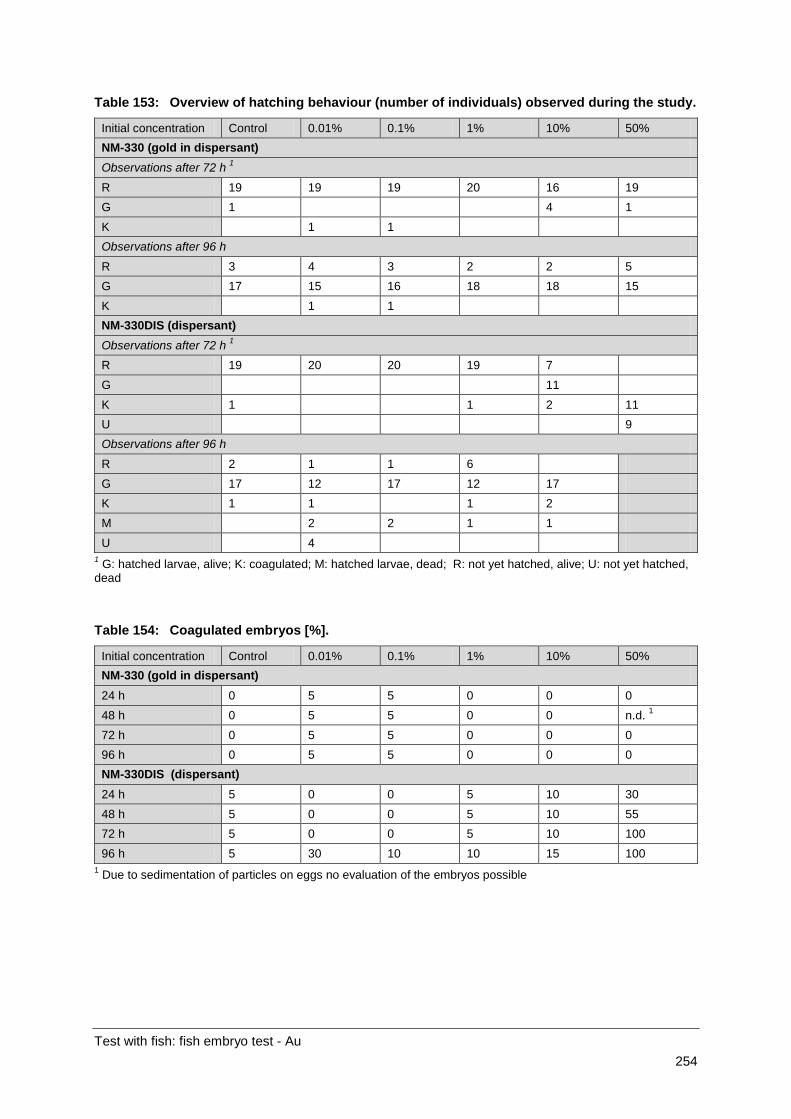
Test with fish: fish embryo test - Au 254
Table 153: Overview of hatching behaviour (number of individuals) observed during the study.
Initial concentration Control 0.01% 0.1% 1% 10% 50% NM-330 (gold in dispersant) Observations after 72 h 1
R 19 19 19 20 16 19 G 1 4 1 K 1 1 Observations after 96 h
R 3 4 3 2 2 5 G 17 15 16 18 18 15 K 1 1 NM-330DIS (dispersant) Observations after 72 h 1 R 19 20 20 19 7 G 11 K 1 1 2 11 U 9 Observations after 96 h
R 2 1 1 6 G 17 12 17 12 17 K 1 1 1 2 M 2 2 1 1 U 4
1 G: hatched larvae, alive; K: coagulated; M: hatched larvae, dead; R: not yet hatched, alive; U: not yet hatched, dead
Table 154: Coagulated embryos [%].
Initial concentration Control 0.01% 0.1% 1% 10% 50% NM-330 (gold in dispersant) 24 h 0 5 5 0 0 0 48 h 0 5 5 0 0 n.d. 1 72 h 0 5 5 0 0 0 96 h 0 5 5 0 0 0 NM-330DIS (dispersant) 24 h 5 0 0 5 10 30 48 h 5 0 0 5 10 55 72 h 5 0 0 5 10 100 96 h 5 30 10 10 15 100
1 Due to sedimentation of particles on eggs no evaluation of the embryos possible

Test with fish: fish embryo test - Au 255
Table 155: Hatched organisms [%].
Initial concentration Control 0.01% 0.1% 1% 10% 50% NM-330 (gold in dispersant) 72 h 5 0 0 0 20 5 96 h 85 75 80 90 90 75 NM-330DIS (dispersant)
72 h 0 0 0 5 55 0 (100% dead)
96 h 85 75 95 70 90 0 (100% dead)
18.8 Validity
No validity criteria are listed in the draft OECD test guideline (2006). Test acceptance criteria included in the version presently discussed were used as an alternative. According to these criteria, the test is considered to be valid as:
• The fertilisation rate of the eggs was ≥70% (about 90%). • At the beginning of the test, test dissolved oxygen concentration in the negative con-
trol and highest test concentration was ≥80% of saturation (92 – 94%) • Overall survival of embryos in the native control was ≥90% until the end of the expo-
sure (test with NM-330: 95%; test with NM-330DIS: 100%) • Hatching rate in the negative control was ≥80 % at the end of 96 h exposure (85%)
18.9 Conclusion
The dispersant itself (NM-330DIS) showed a high toxicity. This toxicity is reduced in the presence of gold nanoparticles.
The effect values are summarised in Table 156.
18.10 Executive summary
NM-330 (gold nanoparticles in dispersant) and NM-330DIS (dispersant of the gold nanopar-ticles) were tested in the fish embryo test using Danio rerio (OECD draft). The test period was 96 h. Qualitative observations on hatching, survival and abnormal behaviour were made daily.
The gold concentration measured in NM-330 was lower than the value reported by the pro-ducer (expected: 0.01% corresponding to 100 mg/L; measured 43.8 mg/L). The NIST refer-ence material 8011 (gold nanoparticles, nominal diameter 10 nm) was analysed along with the samples of the test and recovery amounted to about 100%. The recovery of the applied standard Au solution was about 100% as well. As details on the analytical method used by the producer of NM-330 are not known, the discrepancy between the results cannot be ex-plained. Due to the discrepancy between measured and communicated values, the concen-

Test with fish: fish embryo test - Au 256
trations of the ecotoxicological analyses are presented as % NM-330 (v/v) in the test sus-pension.
Due to the low concentration of Au nanoparticles in NM-330 the particle size distribution could not be determined. For the zeta potential in ISO water (1/5 strength) a negative value was determined. At 10% the zeta potential was -26 mV, whereas the test concentration of 50% resulted in a more negative value (-39 mV).
Tests with the dispersant NM-330DIS showed a concentration-effect relationship for ab-normities of the embryos. At 50% dispersant all embryos died. In the presence of 10% dis-persant the larvae hatched after a reduced embryo development period. Some of them showed a lower heartbeat or missing blood circulation. In contrast, NM-330 (gold in dispers-ant) caused no abnormities after 24 and 48 h. Heartbeat and hatching behaviour were com-parable to the control.
The effect values are presented in Table 156.
Table 156: Effect concentrations of NM-330 and NM-330DIS. Concentrations given as % of the product in the test (v/v).
NM-330 NM-330DIS 48 h 72 h 96 h 48 h 72 h 96 h Development of embryos (mortality) LC10 [%] > 50% 1 > 50% 1 > 50% 1 48 10 9 LC50 [%] > 50% 1 > 50% 1 > 50% 1 10 17 16 Hatching EC10 [%] --- 3 > 50% 1 > 50% 1 --- 3 1.2 nc 2 EC50 [%] --- 3 > 50% 1 > 50% 1 --- 3 10 nc 2
1 highest test concentration; 2 not calculable (10%: comparable to control; 50% all embryos died); 3 no hatching before 48 h, therefore, no EC value determinable

Extended summary, FKZ 3709 65 416 257
19 Extended summary
19.1 Introduction
In November 2007, the OECD’s Working Party on Manufactured Nanomaterials (WPMN) launched a Sponsorship Programme involving OECD member countries, as well as non-member economies and stakeholders, to pool available expertise and to fund the safety test-ing of specific Manufactured Nanomaterials (MNs). In launching the Sponsorship Pro-gramme, the WPMN agreed on a priority list of 13 MNs for testing selected from a pool of nanomaterials that are in, or close to, commerce. They also agreed upon a list of endpoints for which the selected materials should be tested. Much valuable information on the safety of MNs can be derived by testing this representative set with respect to human health and envi-ronmental safety.
As a sponsor country for titanium oxide research and a co-sponsor for silver research, Ger-many – among others, is involved in the assessment of TiO2 and Ag nanoparticles with re-spect to potential effects on human health and the environment. Several months after start-ing the project the work programme was extended to include the nanomaterial gold. Since ecotoxicological data based on standardised test methods as requested for risk assessments are not available for these substances and information on modifications of standardised test procedures required for the testing of nanoparticles are lacking, the aim of the present pro-ject was to contribute to the following topics:
• Recommendations for the improvement of existing OECD Test Guidelines on the test-ing of nanoparticles
• Recommendations for the application of the investigated nanoparticles to the test medium
• Ecotoxicity of titanium oxide and silver with respect to
o Earthworm reproduction
o Respiration rate of soil microflora
o Nitrification of soil microflora
o Growth of plants
o Reproduction of chironomids
o Reproduction of daphnids
• Ecotoxicity of gold with respect to
o Growth of algae
o Immobilisation of daphnids
o Development of fish embryos
o Reproduction of chironomids
As a first step in the present project the German Federal Environment Agency selected sev-eral nanoparticles from the priority list of the OECD Sponsorship Programme, and the tests

Extended summary, FKZ 3709 65 416 258
that should be performed with these nanoparticles were selected on the basis of available information and priority. The outcome is presented in following table (Table 157). In Table 158 and Table 159 the properties of the applied nanoparticles are presented. For gold no information was available.
Table 157: Nanoparticles and test guidelines to be studied in the project.
Titanium dioxide Silver Gold Name of the product / code 1 / producer / OECD Test Guideline
Aeroxid® P252): Evonik
PC105 (NM-102):
Crystal Global
Hombikat UV 100 (NM-101): Sachtleben
UV TITAN M212 (NM-104): Sachtleben
UV TITAN M262 (NM-103): Sachtleben
Ag Pure W10 (NM-300K)
Gold (NM 330): South Africa - MINTEK
201 (algae – growth) x
202 (daphnids - immobilisation) x
211 (daphnids - reproduction) x
219 (chironomids - emergence) x x x x
Draft – fish em-bryo test x
222 (earthworms - reproduction) x x x x
208 (plants - emergence, growth)
x
216/217 (soil microflora – N-/C-transformation)
x
1 Terms in brackets: code of the materials according to the OECD Sponsorship Programme; 2 P25 was distributed by Evonik; the OECD batch NM-105 is also the product AEROXIDE® TiO2 P25, but stems from a different batch
Table 158: Properties of the applied TiO2 nanoparticles. Data from the Joint Research Centre, European Commission.
Nanoparticles NM-101 NM-103 NM-1051 Crystal structure Anatase Rutile Rutile - Anatase
Purpose active component for photocatalytic reactions
UV screening agent in sunscreen
active component for photo catalytic reactions
Primary particle size (according to Scherrer) 8 nm 20 nm 21 nm
Composition TiO2: 91.7% TiO2: 89.0% Al2O3: 6.2%
TiO2: > 99%
BET > 250 m²/g 60 m²/g 60 m²/g Coating none hydrophobic none Condition solid, powder solid, powder solid, powder
1 Data elaborated for NM-105 and not for the batch distributed by Evonik and used in this study

Extended summary, FKZ 3709 65 416 259
Table 159: Properties of the applied silver nanomaterial. Data from the Joint Research Centre, European Commission.
Nanoparticles NM-300K NM-300KDIS Condition in dispersion dispersion Primary particle size (according to Scherrer) 15 nm ---
19.2 Pre-tests One essential step in ecotoxicity testing is the application of the test substance as bioavail-ability and subsequent toxicity can be influenced by the applied method. So far, documents referring specifically to the application of nanoparticles are unavailable.
Therefore, the application of the nanoparticles was studied in pre-tests with emphasis on terrestrial tests. For tests with daphnids and chironomids the method of Hund-Rinke et al. (2010) was used; supplementing studies on filtration and the use of stabilisers. Moreover, the sorption of P25 to algae was investigated to obtain information on the feeding frequency of the daphnids in the reproduction test.
Terrestrial tests
Application forms that might be suitable for terrestrial tests and the homogeneity of spiking were investigated in tests carried out with earthworms and the soil microflora. Several forms of spiking were investigated:
• Application as dispersion
• Application as solid (powder)
• Application in soil
• Application in food
On the basis of the obtained results the decision was made to apply the following procedure in the main tests:
• TiO2 nanoparticles (available as insoluble, dry powder): application via suspension and via solid carrier (soil) in soil as well as via suspension and directly in the form of powder in dung. Due to the high amount of nanomaterial added to dung, no carrier was considered to be necessary.
• Ag nanoparticles (available as dispersion): application via solid carrier (soil) in soil and directly in dung.
For Au no terrestrial tests were performed.

Extended summary, FKZ 3709 65 416 260
19.3 Main tests
A short overview of the toxicity for all test organisms is presented in Table 160.
The TiO2 nanoparticles were available as dry powder. The results are presented as mg TiO2/kg or mg TiO2/L. Silver was available as dispersion. Further to the total concentra-tion of silver the concentrations of Ag ions in soil and sediment were determined via DGT (diffusive gradient in thin films). The results are presented as nominal concentrations and as Ag+ concentration. The gold concentration measured in NM-330 was lower than the value reported by the producer (expected: 0.01% corresponding to 100 mg/L; measured 43.8 mg/L). The NIST reference material 8011 (gold nanoparticles, nominal diameter 10 nm) was analysed along with the samples of the test; recovery amounted to about 100%. The recov-ery of the applied standard Au solution was about 100% as well. As details on the analytical method used by the producer of NM-330 are not known, the discrepancy between the results cannot be explained. Due to the discrepancy between measured and communicated values, the concentrations of the ecotoxicological analyses are presented as % NM-330 (v/v) in the test suspension.
Table 160: Summary of the effect values of the applied nanoparticles.
Test Guideline Nanomaterial Result
TiO2
Earthworm OECD 222 P25, NM-101 Concentration-dependent stimulation in winter in tests performed with natural soil
NM-103 Reproduction: no difference to the control up to the highest test concentration (100 mg/kg)
Microflora – N-transformation
OECD 216 P25 Increased nitrogen transformation rate upon application via powder Application via powder: NOEC 9.3 mg/kg Application via dispersion: NOEC ≥ 21 mg/kg (highest test concentration)
Microflora – carbon trans-formation
OECD 217 P25 No effect up to the highest test concentration Application via powder: NOEC ≥ 100 mg/kg Application via dispersion: NOEC ≥ 21 mg/kg (highest test concentration)
Plant (bean, mustard, oat)
OECD 208 P25 Germination, root length: no effect on the three plants up to the highest test concentration (dry application 100 mg/kg, wet application 20 mg/kg) Fresh weightNOEC: oat: 67.0 mg/kg; bean: 44.0 mg/kg
: no effect on mustard
Daphnids OECD 211 P25 Change of the medium: 3 times per week or daily; sonication 3 min or 30 min: no effect up to the highest test concentration (5 mg/L)
Chironomids OECD 219 P25, NM-101 No effect up to the highest test concentration (spiked water: 100 mg/L)
continued

Extended summary, FKZ 3709 65 416 261
Table 160 continued.
Test Guideline Nanomaterial Result
NM-300K
Earthworm OECD 222 NM-300K Reproduction: NOEC < 15 mg/kg (lowest nominal con-centration) 65.5 * 10-3 µg/kg (concentration of Ag ions)
Chironomids OECD 219 NM-300K Development: NOEC 0.625 mg/L (nominal concentration) 4 µg/L (concentration of Ag ions measured by DGT) Emergence: NOEC 1.250 mg/L (nominal concentration) 19 µg/L (concentration of Ag ions measured by DGT)
NM-330 / NM-330DIS
Chironomids OECD 219 NM-330 No inhibitory effect up to the highest test concentration Emergence, development (combined sexes): NOEC ≥ 50%
NM-330DIS Emergence rate (combined sexes): NOEC 10% Development time (combined sexes): NOEC 10%
Daphnids OECD 202 NM-330 NOEC ≥ 50% (highest test concentration)
NM-330DIS NOEC 2.5%
Algae OECD 201 NM-330 Biomass, growth: NOEC 0.63%;
NM-330DIS Biomass, growth NOEC < 0.63% (lowest test concentra-tion)
Fish embryo test
OECD Draft NM-330 Development of embryos: LC10 > 50% (highest test con-centration) Hatch: EC10 > 50% (highest test concentration)
NM-330DIS Development of embryos: LC10 48% (48h); LC50 10% (48h) Hatch: EC10 1.2% (72 h); EC50 10% (72 h); 96 h: EC values not calculable – 10% comparable to control; 50% dispersion 100% effect

Extended summary, FKZ 3709 65 416 262
19.3.1 Tests with earthworms (OECD TG 222) – TiO2, Ag
TiO2 nanoparticles (NM-101, NM-103 and P25) were tested in the earthworm reproduction test. The particles were applied as powder and as aqueous dispersion in soil and in feed. The test substrate was a natural sandy soil. The experiments were performed several times.
TiO2
The following test concentrations were investigated:
• Application via powder in feed: 50, 100, 200 mg/kg soil, dry matter
• Application via powder in soil: 50, 100, 200 mg/kg soil, dry matter
• Application via dispersion in feed: 10, 20 mg/kg soil, dry matter
• Application via dispersion in soil: 10, 20 mg/kg soil, dry matter.
In several tests performed only with powder-spiked soil a higher number of concentrations were investigated. Following approaches were studied:
• Application via powder in soil: 50, 100, 200, 400 mg/kg soil, dry matter (NM-101, NM-103)
• Application via powder in soil: 50, 100, 200, 500, 750, 1000 mg/kg soil, dry matter (P25).
The tested TiO2 nanoparticles did not cause a reduction in the number of offspring. Stimula-tion of offspring production was observed for the earthworms in the uncoated material P25 treatment when the test was performed in winter. For the coated material NM-103 a stimula-tory effect was not observed. The stimulatory effect was less pronounced for the second un-coated material (NM-101).
There were indications that the stimulation was due to a disturbance of the biological clock.
In some of the tests the Ti concentration was determined in the earthworms. There were strong indications that Ti concentrations in the worms increased with increasing test concen-trations. However, there seemed to be a difference depending on whether the contamination was highly concentrated in food or distributed in soil. Contaminated food seemed to cause higher concentrations in the earthworms than contaminated soil giving an increase at 100 or 200 mg/kg concentrations, whereas for contaminated soil an increase was obvious only for the concentration of 1000 mg/kg. Differences between the three nanoparticles were not ob-served. In none of the test designs the concentration in the worms exceeded the soil concen-tration in the test substrate. Therefore, it was concluded that the nanoparticles did not accu-mulate in the tissue of the worms, but remained in the gut, possibly adsorbed to remaining soil/food particles.
Silver nanoparticles (NM-300K) and the dispersant in NM-300K (NM-300KDIS) were tested in the earthworm reproduction test. The particles were applied in soil and feed. The test sub-strate was a natural sandy soil. The test concentrations were 15, 30, 60, 120, 200 mg/kg soil, dry matter.
Ag

Extended summary, FKZ 3709 65 416 263
NM-300K caused a reduction of the reproduction rate, whereas the dispersant in NM-300K (NM-300KDIS) showed no effect.
Concerning reproduction, the ECx, NOEC and LOEC values presented in Table 161 were determined. Differences resulting from the exposure of the earthworms via feed and via soil seem to be negligible.
An increase in size and weight of the juveniles was observed. However, this observation was not reproducible.
Table 161: NM-300K - earthworm reproduction: summary of the effect values.
Spiked feed, control: without further additions
Spiked feed, control: dispersant control
Spiked soil, control: without further additions
Spiked soil, control: dispersant control
EC50 [mg/kg] 1 80.3 (58.5 - 113.4) 121.2 (85.3 - 183.8) 80.0 (33.6 - 413.3) 146.0 (85.8 - 741.4)
EC10 [mg/kg] 1 14.6 (4.6 - 24.8) 39.4 (7.5 - 62.9) n.d. 2 24.2 (0.2 - 50.7)
LOEC [mg/kg] ≤15.0 60.0 ≤15.0 30.0
NOEC [mg/kg] <15.0 30.0 <15.0 15.0 1 values in brackets: confidence interval; 2 n.d. = confidence interval not determined due to mathematical reasons or inappropriate data
Additionally, the Ag concentration inside the earthworms was determined. In the control worms and in the worms treated with the dispersant (the amount corresponded to the highest test concentration of silver) no silver was determined. In contrast, silver was detected in all worms incubated in soil containing NM-300K (nanosilver) and in the worms fed with spiked food. There was no obvious difference between the two experiments (spiking of soil or spik-ing of food). A dependence on the concentration was not observed. It was therefore as-sumed that a steady state of silver uptake was achieved already at the lowest test concentra-tion. Concentration-dependent effects were observed above the lowest test concentration. Although the applied test concentrations increased, the silver concentrations in the worms were the same. We assume that the fertility of adults is not affected but that the life stages involving development of cocoons and the juveniles in soil are sensitive. We do not know yet which life stage is more susceptible.
In none of the test designs the silver concentration in the worms exceeded the concentration in the test vessels. Therefore, it was concluded that the silver did not accumulate in the tis-sue of the worms. It is unclear whether the measured silver was located in the tissue or whether residues remained in the gut due to incomplete purging. We also do not know whether the determined silver occurred in its particle or ionic form.
19.3.2 Tests with microorganisms – nitrogen transformation test (OECD TG 216) – TiO2
TiO2 nanoparticles (P25) were tested in the nitrification assay. Soil was spiked with powder and with dispersion. As test substrate a natural sandy soil was used. The following test con-centrations were investigated:

Extended summary, FKZ 3709 65 416 264
• Application via powder in soil: 9.3, 21.0, 45.0, 100.0 mg/kg soil
• Application via dispersion in soil: 9.3, 21.0 mg/kg soil.
The nitrate content was determined photometrically at day 0 (sampling of the soil three hours after application) and at day 28.
The application via powder caused concentration-dependent effects, namely, decreased ni-trate values at day 0 (sampling of the soil three hours after application), increased nitrate values at day 28, and increased nitrogen transformation rates (difference in nitrate content between day 28 and day 0).
In Table 162 the NOEC and ECx values are summarised.
Table 162: P25 - Summary of the effect values for nitrogen transformation. Application via powder and dispersion.
Application via powder Application via dispersion Day 0 (= 3 h
after application) Day 28 Day 0 (= 3 h after application) Day 28
Nitrate content EC10 [mg/kg] 2 23.6 n.d. n.d. n.d. EC25 [mg/kg] 2 108.3 n.d. n.d. n.d. LOEC [mg/kg] 21.0 100.0 > 21 > 21 NOEC [mg/kg] 9.3 45.0 ≥ 21 ≥ 21 Nitrogen transformation 1 EC10 [mg/kg] 2 n.d. n.d. EC25 [mg/kg] 2 n.d. n.d. LOEC [mg/kg] 21.0 > 21 NOEC [mg/kg] 9.3 ≥ 21
1 Nitrogen transformation: difference in nitrate content at day 28 and day 0; 2 n.d. = not determined due to mathematical reasons or inappropriate data
The application via dispersion gave no clear information on its suitability for the application of nanomaterials. The difference in microbial activity of the spiked samples to the control was small and not statistically significant. It is assumed that an application via dispersion does not cause an increased bioavailability of TiO2 nanoparticles for the soil microflora.
19.3.3 Tests with microorganisms – carbon transformation test (OECD TG 217) – TiO2
TiO2 nanoparticles (P25) were tested in the microbial carbon transformation assay (OECD Test Guideline 217). Soil was spiked with the test item via powder and via dispersion. As test substrate a natural sandy soil was used. The following test concentrations were investigated:
• Application via powder in soil: 9.3, 21.0, 45.0 and 100.0 mg/kg soil, dry matter
• Application via dispersion in soil: 9.3 and 21.0 mg/kg soil, dry matter.

Extended summary, FKZ 3709 65 416 265
For each treatment three replicate vessels were incubated. From each vessel one soil sample was taken for measurement.
For both application forms, no inhibitory effect was observed and no EC-values were calcu-lated. There is no statistically significant difference between the treatments and the control. The NOEC is higher than the highest test concentration ( ≥ 100 mg/kg). This result was con-firmed by a repetition of the test.
19.3.4 Tests with plants (OECD TG 208) – TiO2
TiO2 nanoparticles (P25) were tested in seedling emergence and growth tests with plants (OECD test guideline 208). Soil was spiked via powder and via dispersion. As test substrate a natural sandy soil was used. Following test concentrations were investigated:
• Application via powder in soil: 10, 20, 30, 44, 67, 100 mg/kg soil, dry matter
• Application via dispersion in soil: 10, 20 mg/kg soil, dry matter.
The plant species used in the test were Avena sativa (oat), Sinapis alba (mustard) and Phaseolus aureus (mung bean), which are representative of monocotyledonous and dicoty-ledonous plants, respectively. The endpoints mentioned in the test guideline (i.e. germina-tion, biomass) and the root length were determined.
No statistically significant differences were observed for germination and root length. No phyto-pathological symptoms were observed up to a concentration of 100 mg/kg (application via powder) and 20 mg/kg (application via dispersion). The most sensitive endpoint was shoot fresh weight but only small effects were observed for Avena sativa and Phaseolus aureus. Application via dispersion resulted in concentration-effect relationships that were highest for the low test concentration (10 mg/kg). It is assumed that the bioavailability of the nanoparticles decreased due to a higher agglomeration in the higher concentrated stock dis-persion used for the high test concentration (20 mg/kg).
A summary is presented in Table 163.

Extended summary, FKZ 3709 65 416 266
Table 163: P25 – test with plants: summary of the effect values. Application via powder; critical effect and threshold concentrations [mg/kg].
Avena sativa Phaseolus aureus Sinapis alba Emergence EC10 [mg/kg] EC50 [mg/kg] LOEC [mg/kg] NOEC [mg/kg]
32.4 n.d. 2 > 100 ≥ 100
n.d. 2 n.d. 2 n.d. 2 n.d. 2
n.d. 2 n.d. 2 > 100 ≥ 100
Shoot fresh weight EC10 [mg/kg] 1 EC50 [mg/kg] 1 LOEC [mg/kg] NOEC [mg/kg]
51.7 (36.1 – 61.4) n.d. 2 100.0 67.0
n.d. 2 n.d. 2 67 44
n.d. 2 n.d. 2 > 100 ≥ 100
Root length: EC10 [mg/kg] EC50 [mg/kg] LOEC [mg/kg] NOEC [mg/kg]
n.d. 2 n.d. 2 > 100 ≥ 100
n.d. 2 n.d. 2 n.d. 2 n.d. 2
n.d. 2 n.d. 2 > 100 ≥ 100
1 values in brackets: confidence interval; 2 n.d. = not determined due to mathematical reasons or inappropriate data or considered unreliable
19.3.5 Tests with chironomids (OECD TG 219) – TiO2, Ag, Au
The OECD Test Guideline 219 (Sediment-Water Chironomid Toxicity Using Spiked Water) was applied using Chironomus riparius as test organism. The test required feeding of the larvae at least three times per week. Two feeding regimes were tested as the sorption of the nanoparticles was unknown – feeding three times weekly and adding 0.5% dry weight of finely ground leaves to the sediment before the stabilisation period. Mixing the total amount of food into the sediment at test start to avoid a sorption of P25 to the food applied to the water phase instead of a periodical feeding was not considered a suitable method, as this caused reduced emergence even in the control.
The nominal concentrations of TiO2 nanoparticles in the test containers were 15, 23, 39, 63 and 100 mg test item/L.
TiO2
There was strong sedimentation of TiO2 nanoparticles resulting in Ti concentrations below the detection limit in the overlaying water. At test end nearly all of the applied TiO2 nanoparti-cles were determined in the sediment.
P25: Concentrations up to 100 mg/L P25 did not cause a negative impact on the emergence of larvae in the sediment/water chironomid test using spiked water. The NOEC was ≥ 100 mg/L.
NM-101: NM-101 concentrations up to 100 mg/L did not have a negative impact on the emergence of larvae. The NOEC was ≥ 100 mg/L.

Extended summary, FKZ 3709 65 416 267
NM-300K: The nominal concentrations in the test containers with silver were 0.3125, 0.625, 1.25, 2.5, 5 and 10 mg test item/L.
Silver
There was strong sedimentation of silver resulting in Ag concentrations below the detection limit in the overlaying water. At test end nearly all of the applied Ag was determined in the sediment.
The concentration of the Ag ions in the sediment was determined using DGTs. Compared to the total Ag amount the concentration of the Ag ions in the sediment was low. Depending on the referred value (nominal concentration in overlaying water or concentration in water con-tent of sediment) the percentage of the ions was about 10-3 or 10-4%.
The dispersant used for stabilising the Ag nanoparticles had no negative effect on the emer-gence of the chironomids.
The application of NM-300K resulted in a clear concentration-effect curve. The NOEC value for total emergence and for emerged males and females was 1.250 mg/L. The NOEC value for the total development rate and for the development rates of males was 0.625 mg/L. For females a NOEC could not be calculated as there was a statistically significant effect at 1.25 mg/L but no effect at 2.5 mg/L and a 100% effect were at 5 and 10 mg/L.
The presented results are based on nominal concentrations. Based on the ion concentration determined with DGTs in the sediment, the effect values are lower by a factor of 10-3 – 10-4.
This illustrates that the basis of the calculation has to be clearly fixed for regulatory purposes.
A summary of the results obtained for all endpoints is presented in Table 164.
Table 164: NM-300K – test with chironomids: summary of effect values. Concentrations given as nominal values.
NOEC [mg/L] 2 LOEC [mg/L] 2 EC10 [mg/L] 1,2 EC20 [mg/L] 1,2 EC50 [mg/L] 1,2
Emerged males and females 1.250 2.5 1,583
(1.350 - 1.750) 1.772 (1.566 - 1.926)
2.201 (2.041 - 2.357)
Emerged midges [males] 1.250 2.5 2.059 (n.d.) 2.175 (n.d.) 2.415 (n.d.)
Emerged midges [females] 1.250 2.5 1.055
(0.825 - 1.242) 1.276 (1.051 - 1.467)
1.835 (1.610 - 2.091)
Development rate of males and females 0.625 1.250 0.925 (n.d.) 1.897 (n.d.) 7.508 (n.d.)
Development rate of males 0.625 1.250 0.994 (n.d.) 1.824 (n.d.) 5.828 (n.d.)
Development rate of females n.d. n.d. 0.934 (n.d.) 2.443 (n.d.) 15.369 (n.d.)
1 values in brackets: confidence interval; 2 n.d. = not determined due to mathematical reasons or inappropriate data
NM-330 and NM-330DIS: The nominal test concentrations in the vessels were 0, 0.1, 1, 10 and 50% test item/L. The test concentrations were verified by chemical analysis.
Gold

Extended summary, FKZ 3709 65 416 268
The addition of NM-330 and NM-330DIS caused coloured test suspensions. Changing col-ours during the incubation indicates a modification of the added NM-330 and NM-330DIS. Sedimentation of Au was demonstrated by chemical analysis. At day 28 of the incubation period 0.5% of the Au was detected in the water phase at the highest test concentration (50% test item). The Au concentrations determined at the lower test concentrations were below the detection limit.
General observations
The dispersant caused a concentration-dependent decrease of the oxygen concentration in the water phase. After three weeks the threshold concentration of 60% oxygen saturation was not achieved in the vessels with the highest concentration of the dispersant, not even upon increased aeration. In the vessels with the highest concentration of the dispersant a very high microbial number was determined.
The oxygen supply was controlled qualitatively on a daily basis during the working week. The aeration was comparable for all vessels. A technical defect as the reason for the low oxygen concentration is unlikely. Therefore it is assumed that (i) microbial degradation of the dead larvae resulted in a decrease of the oxygen concentration and (ii) that the comparably low oxygen concentration is not the reason for the missing emergence.
For the dispersant a strong effect was observed at the highest test concentration. The larvae were fully grown, even though their development was delayed. However, no larvae emerged as the organisms died before hatching. In the presence of gold this effect did not occur.
Effects
All effect values are summarised in Table 165. In contrast to the dispersant no effect was observed for the treatments with gold. Although statistically significant differences to the con-trol were observed for the development rates, the differences were not considered to be an effect of the test substance, since they were not related to concentration-effect relationships.
Table 165: NM-330, NM-330DIS – test with chironomids: summary of the effects. Effects given as percentage of NM-330 in the test medium.
NOEC [%] LOEC [%] NM-330
Emergence rate – combined sexes, males, females ≥ 50 > 50 Development time – combined sexes, males, females ≥ 50 > 50 Development rate – combined sexes not evaluable 1 not evaluable 1 Development rate – males not evaluable 1 not evaluable 1 Development rate – females not evaluable 1 not evaluable 1 NM-330DIS Emergence rate – combined sexes, males, females 10 1 Development time – combined sexes, males, females 10 1 Development rate – combined sexes not evaluable 1 not evaluable 1 Development rate – males not evaluable 1 not evaluable 1 Development rate – females 10 1
1 There was a statistically significant difference to the control, but no concentration-effect relationship.

Extended summary, FKZ 3709 65 416 269
19.3.6 Tests with daphnids – reproduction (OECD TG 211) – TiO2
TiO2 nanoparticles were tested in the reproduction test with daphnids (OECD 211). Three semi-static tests were carried out. In the first test the medium was renewed on days 2, 5, 7, 9, 12, 14, 16, and 19. The nominal concentrations of TiO2 nanoparticles in the test containers were 0.05, 0.1, 0.5, 1.0, and 5.0 mg test item/L. The concentrations of the test item were measured in the freshly prepared test suspensions on days 0, 7, and 14. After two days of incubation the concentrations of the test item were measured in the incubation flasks (days 2, 9, and 16). Sedimentation of TiO2 nanoparticles resulted in a reduction of the Ti concentra-tions in the overlaying water after incubation.
TiO2
In the second test two concentrations (1 mg/L, 5 mg/L) were investigated. Two periods for the renewal of the test medium were studied: three times per week and daily.
In the third test two concentrations (1 mg/L, 5 mg/L) were investigated. Two ultrasonication periods (3 min and 30 min) were studied. The test medium was renewed three times per week.
The results concerning the NOEC differ slightly. A summary is presented in Table 166. The effect of P25 on reproduction activity, mobility and body length seems to be negligible up to the highest test concentration of 5 mg/L. The differences between the tests reflect the bio-logical variability.
Table 166: P25 – test with daphnids: summary of the NOEC values. Mean cumulative offspring per female, mobility and body length in the three tests.
1st test: ultrasonication period 3 min; medium renewal 3 times per week
2nd test: medium renewal daily or 3 times per week
3rd test: ultrasonication period 3 min and 30 min
Mean cumulative offspring per female NOEC [mg/L] ≥ 5.0 ≥ 5.0 5.0 Mobility NOEC [mg/L] ≥ 5.0 ≥ 5.0 ≥ 5.0 Body length NOEC [mg/L] 0.1 mg/L ≥ 5.0 ≥ 5.0
19.3.7 Tests with daphnids – immobilisation (OECD TG 202) - Au
NM-330 (gold nanoparticles in dispersant) and NM-330DIS (dispersant of the gold nanopar-ticles) were tested in the acute test with Daphnia magna (OECD 202). Two static tests with
Au

Extended summary, FKZ 3709 65 416 270
different test concentrations were performed. The mobility of the daphnids was recorded after 24 h and 48 h.
Due to the low concentration of the Au nanoparticles in NM-330 the particle size distribution could not be determined. The Zeta potential determined for the highest test concentration (10%) in purified tap water (= test water) was -24 mV.
During the incubation period of two days sedimentation occurred resulting in concentrations of gold in the overlaying water of about 1% for both concentrations analysed (5 and 10%).
Concentration-dependent toxicity was detected for the dispersant. In the control and in the test vessels containing gold dispersion no immobilisation was detected after an incubation period of 24 h. After 48 h, 5% immobilisation occurred.
The dispersant caused a reduction of the pH and of the oxygen concentration. The pH was still in the accepted range of 6 – 9. All concentrations of the dispersant caused a reduction of the oxygen concentration below the threshold value of 3 mg/L. It is assumed that the low oxygen concentration does not affect toxicity, as the oxygen concentrations at the lowest and highest test concentrations were the same, although 0 (lowest test concentration) and 100% (highest test concentration) effect were achieved.
Based on the findings the following effect values were calculated:
NM-330 (gold nanoparticles): LOEC > 50% (v/v): NOEC ≥ 50% (v/v)
NM-330DIS (dispersant): EC50 (48 h) 3.24% (v/v); LOEC 5.0% (v/v): NOEC 2.5% (v/v)
19.3.8 Tests with algae (OECD TG 201) - Au
NM-330 (gold nanoparticles in dispersant) and NM-330DIS (dispersant of the gold nanoparti-cles) were tested in the growth test with green algae (OECD 201). Every 24 hours, fluores-cence was recorded as an indicator for algal growth. The fluorescence signal was converted into cell numbers using a calibration curve.
Au
As minor amounts of the expensive test substance (NM-330) were used, the test was per-formed in multi-well plates (96-well plates and 24-well plates).
The dispersant itself (NM-330DIS) showed a high toxicity. The toxicity was reduced in the presence of gold nanoparticles.
For the tests with NM-330 only the period of the test from 24 - 72 h was evaluated. Tests with NM-330DIS was assessed as described in the guideline (incubation period: 0 – 72) despite an evaluation of the 24 - 72 h that resulted in effect and threshold values comparable to those obtained for the complete test period. As an evaluation using the reduced and the normal incubation period gave comparable results for NM-330DIS, the results of both tests were compared despite the different incubation periods.
As only minor amounts of the test substance (NM-330) were available for testing, the test was performed in multi-well plates (96-well plates and 24-well plates). However, using such a small amount of test item resulted in fulfilment of only two of the three validity criteria men-
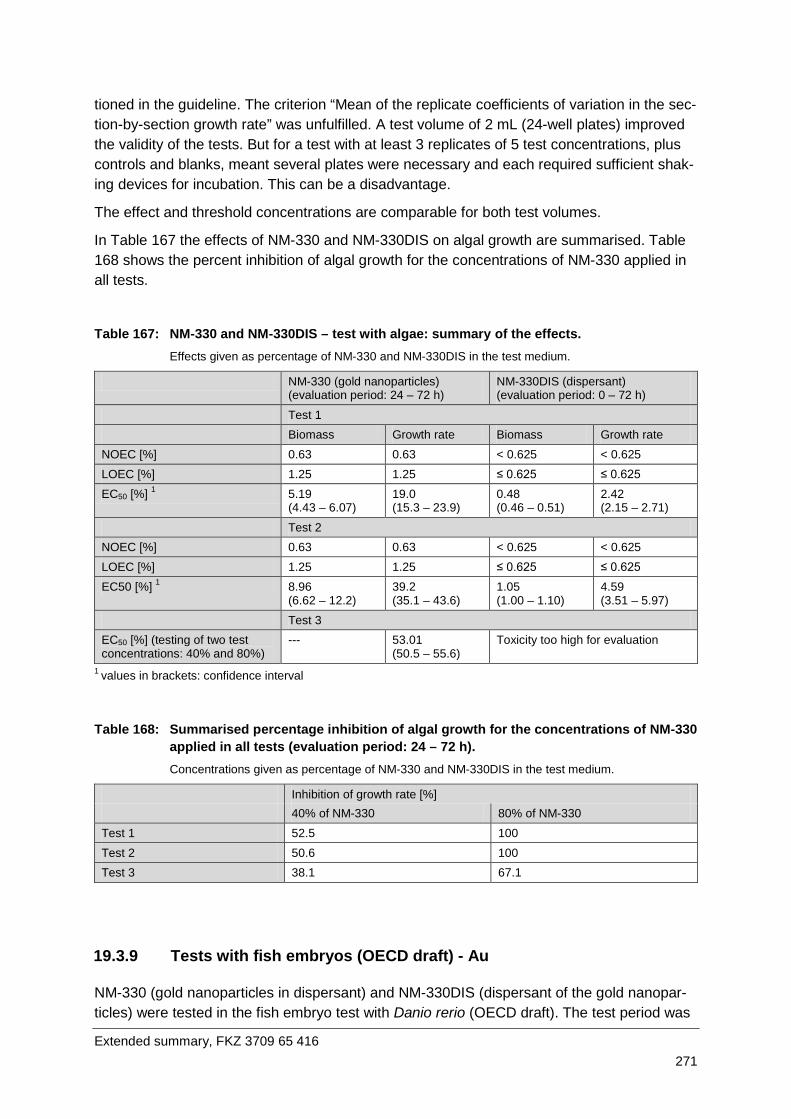
Extended summary, FKZ 3709 65 416 271
tioned in the guideline. The criterion “Mean of the replicate coefficients of variation in the sec-tion-by-section growth rate” was unfulfilled. A test volume of 2 mL (24-well plates) improved the validity of the tests. But for a test with at least 3 replicates of 5 test concentrations, plus controls and blanks, meant several plates were necessary and each required sufficient shak-ing devices for incubation. This can be a disadvantage.
The effect and threshold concentrations are comparable for both test volumes.
In Table 167 the effects of NM-330 and NM-330DIS on algal growth are summarised. Table 168 shows the percent inhibition of algal growth for the concentrations of NM-330 applied in all tests.
Table 167: NM-330 and NM-330DIS – test with algae: summary of the effects. Effects given as percentage of NM-330 and NM-330DIS in the test medium.
NM-330 (gold nanoparticles) (evaluation period: 24 – 72 h)
NM-330DIS (dispersant) (evaluation period: 0 – 72 h)
Test 1 Biomass Growth rate Biomass Growth rate NOEC [%] 0.63 0.63 < 0.625 < 0.625 LOEC [%] 1.25 1.25 ≤ 0.625 ≤ 0.625 EC50 [%] 1 5.19
(4.43 – 6.07) 19.0 (15.3 – 23.9)
0.48 (0.46 – 0.51)
2.42 (2.15 – 2.71)
Test 2 NOEC [%] 0.63 0.63 < 0.625 < 0.625 LOEC [%] 1.25 1.25 ≤ 0.625 ≤ 0.625 EC50 [%] 1 8.96
(6.62 – 12.2) 39.2 (35.1 – 43.6)
1.05 (1.00 – 1.10)
4.59 (3.51 – 5.97)
Test 3 EC50 [%] (testing of two test concentrations: 40% and 80%)
--- 53.01 (50.5 – 55.6)
Toxicity too high for evaluation
1 values in brackets: confidence interval
Table 168: Summarised percentage inhibition of algal growth for the concentrations of NM-330 applied in all tests (evaluation period: 24 – 72 h). Concentrations given as percentage of NM-330 and NM-330DIS in the test medium.
Inhibition of growth rate [%] 40% of NM-330 80% of NM-330 Test 1 52.5 100 Test 2 50.6 100 Test 3 38.1 67.1
19.3.9 Tests with fish embryos (OECD draft) - Au
NM-330 (gold nanoparticles in dispersant) and NM-330DIS (dispersant of the gold nanopar-ticles) were tested in the fish embryo test with Danio rerio (OECD draft). The test period was

Extended summary, FKZ 3709 65 416 272
96 h. Qualitative observations on hatching, survival and abnormal behaviour were made daily.
Due to the low concentration of Au nanoparticles in NM-330 the particle size distribution could not be determined. For the zeta potential in ISO water (1/5 strength) a negative value was determined. At 10% the zeta potential was -26 mV, whereas the test concentration of 50% resulted in a more negative value (-39 mV).
Tests with the dispersant NM-330DIS showed a concentration-effect relationship for ab-normities of the embryos. At 50% dispersant all embryos died. In the presence of 10% dis-persant the larvae hatched after a reduced embryo development period. Some of them showed a lower heartbeat or missing blood circulation. In contrast, NM-330 (gold in dispers-ant) caused no abnormities after 24 and 48 h. Heartbeat and hatching behaviour were com-parable to the control.
The effect values are presented in Table 169.
Table 169: Effect concentrations of NM-330 and NM-330DIS. Concentrations given as % of the product in the test (v/v)
NM-330 NM-330DIS 48 h 72 h 96 h 48 h 72 h 96 h Development of embryos (mortality) LC10 [%] > 50% 1 > 50% 1 > 50% 1 48 10 9 LC50 [%] > 50% 1 > 50% 1 > 50% 1 10 17 16 Hatching EC10 [%] --- 3 > 50% 1 > 50% 1 --- 3 1.2 nc 2 EC50 [%] --- 3 > 50% 1 > 50% 1 --- 3 10 nc 2
1 highest test concentration; 2 not calculable (10%: comparable to control; 50% all embryos died); 3 no hatching before 48 h, therefore, no EC value determinable
19.4 Recommendations for the test performance
19.4.1 Suitability of test guidelines
Our experiments showed that the following test guidelines
• OECD Test Guideline No. 222 (earthworm reproduction test) • OECD Test Guideline No. 216 (soil microflora, nitrogen transformation test) • OECD Test Guideline No. 217 (soil microflora, carbon transformation test) • OECD Test Guideline No. 208 (plant test) • OECD Test Guideline No. 219 (chironomid test with spiked water) • OECD Test Guideline No. 211 (daphnia reproduction test) • OECD Test Guideline No. 202 (daphnia immobilisation test) • OECD Test Guideline No. 201 (algae growth test)

Extended summary, FKZ 3709 65 416 273
• OECD Draft – fish embryo test
can be used to test nanoparticles in powder form or dispersed nanoparticles. Modifications to the test performance do not seem to be necessary. However, recommendations for the ap-plication of the nanoparticles are necessary.
19.4.2 Application of nanoparticles to solid test media (soil)
The preparation of test materials in powder form using 1% dry soil as a carrier is a suitable method for the application of the investigated nanoparticles in solid test media. The applica-tion via dispersion using water as a dispersant seems to be less suitable. This recommenda-tion is justified as follows: in most tests showing a concentration-effect curve after directly spiking the soil with the powder, concentration-dependent effects were not observed after the application of a dispersion. Examples are:
• Plant test with Avena sativa – growth
• Soil microflora – nitrogen / carbon transformation test
• Earthworm reproduction test
19.4.3 Spiking of soil versus spiking of feed
Although the same effects were observed for nanoparticles added directly to the soil and nanoparticles applied via feed, direct application to the soil is preferred as this method is de-scribed in an OECD guideline (earthworm reproduction test).
19.4.4 Application of insoluble nanoparticles in powder form to aquatic test media
The method described by Hund-Rinke et al. (2010) is suitable for the application of insoluble nanoparticles in powder form to aquatic test media:
• Weighing of the required amounts in glass vessels
• Addition of test medium
• Stirring of the mixture (1 min; magnetic stirrer; 900 rpm)
• Treatment with ultrasound (3 min, 500 W) in a bath sonicator (Bandelin Sonorex RK 514 BH; 35 kHz; 215/860 W).
Filtration (mixed cellulose ester, polycarbonate membrane filters; pore size 0.2 mm; filter of disposal type, filtration using vacuum) and the use of a synthetic stabiliser (sodium hexa-metaphosphate, 0.01%) are not recommended.
For nanoparticles stabilised in an aqueous medium (silver NM-300K; gold NM-330) a ho-mogenous distribution in suitable stock dispersions can be achieved by stirring.

Extended summary, FKZ 3709 65 416 274
19.4.5 Sensitivity of the applied test systems
For TiO2 nanoparticles we observed effects in terrestrial test systems (earthworms, soil mi-croflora) whereas effects on aquatic test systems (daphnids, chironomids) were not ob-served. On the basis of these results we recommend the application of both aquatic and ter-restrial tests within a comprehensive hazard / risk assessment. This is contrary to the ap-proach described in the scope of REACH where terrestrial tests are required only for sub-stances with high production volumes. However, it must be considered that a limited number of aquatic test organisms were investigated within this project. Further tests carried out with fish and algae may lead to modified conclusions, though published results do not indicate a high toxicity of the tested TiO2 nanoparticles for these organisms.
19.4.6 Toxicity of dispersants
Silver and gold nanoparticles were available as dispersions and the whole product was tested. As a consequence, no information was obtained on the toxicity of the nanoparticles. For regulatory purposes it is recommended that the producers are obliged to additionally provide their nanoparticles without dispersant. It is expected that nanoparticles and dispers-ants separate in the environment, and information on fate and effect of the pure particles is needed.
19.4.7 Total concentration vs. ion concentration
For metals forming ions, such as silver, the results can be calculated on the basis of the total concentration or the ion concentration. The effect values differ significantly. In our study (here: chironomids: OECD 219; earthworms: OECD 222), for example, the effect values dif-fer by a factor of 103 – 104 depending on whether the total concentration or the Ag+ concen-tration determined with DGTs in the sediment and soil resp. is used for the calculation of the endpoints (NOEC, ECx). This illustrates that the basis of the calculation has to be clearly fixed for regulatory purposes.
Literature 275
20 Literature
1. Fareé, M., Sanchís, J., Barceló, D.: Analysis and assessment of the occurrence, the fate and the behaviour of nanoparticles in the environment. Trends Anal. Chem. 30 (2011) 9 S. 517-527.
2. Hund-Rinke, K., Schlich, K., Wenzel, A.: TiO2 nanoparticles - Relationship between dispersion preparation method and ecotoxicity in the algal growth test. Umweltwiss. Schadst. Forsch. 22 (2010) 5 S. 517-528.
3. ISO 14442, April 2006, Water quality - guidance for algal growth inhibition tests with poorly soluble materials, volatile compounds, metals and waste water.
4. Nisimura, T., Numata, H.: Evaluation of the frequency demultiplication hypothesis of circannual pupation rhythm in the varied carpet beetle Antherenus verbasci (Coleoptera: Dermestidae). Biological Rhythm Research 33 (2002) 3 S. 255–260.
5. OECD (1998): Principles of Good Laboratory Practice, adopted by the Council on 26th November 1997; Environment Directorate, Organisation for Economic Co-operation and Development, Paris.
6. OECD (2006): Draft proposal for a new guideline – fish embryo toxicity (FET) test.
7. OECD 201, March 2006, Fresh water Alga and Cyanobacteria: Growth inhibition Test
8. OECD 208, August 2006, Terrestrial Plant Test: Seedling Emergence and Seedling Growth Test
9. OECD 211, October 2008, Daphnia magna Reproduction Test
10. OECD 216, January 2000, Soil Microorganisms: Nitrogen Transformation Test
11. OECD 217, January 2000, Soil Microorganisms: Carbon Transformation Test
12. OECD 219, November 2004, Sediment-Water Chironomid Toxicity Using Spiked Water
13. OECD 222, November 2004: Earthworm Reproduction Test (Eisenia fetida, Eisenia andrei).
14. OECD 23, December 2000, Guidance Document on Aquatic Toxicity Testing of Diffi-cult Substances and Mixtures.
15. Rozen, A.: Do earthworms (Dendrobaena octaedra) from differently polluted forests vary in life-history parameters? European Journal of Soil Biology 39 (2003) S. 73–77.
16. Rozen, A.: Internal regulation of reproduction seasonality in earthworm Dendrobaena octaedra (Savigny, 1826) (Lumbricidae, Oligochaeta). Soil Biol. Biochem. 38 (2006) S. 180-182.
17. Von der Kammer, F., Ferguson, P.L., Holden, P.A., Masion, A., Rogers, K.R., Klaine, S.J., Koelmans, A.A., Horne, N., Unrine, J.M.: Analysis of engineered nanomaterials in complex matrices (environment and biota): General con-siderations and conceptual case studies. Environ. Toxicol. Chem. 31 (2012) 1 S. 32-49.
18. Zhu X., Chang Y., Chen Y.: Toxicity and bioaccumulation of TiO2 nanoparticle aggre-gates in Daphnia magna. Chemosphere 78 (2010) S. 209 – 215.

Raw data – Methods for chemical analyses (chapter 4) 276
21 Annex
21.1 Raw data – methods for chemical analyses (chapter 4)
21.1.1 Raw data examples: Ti
Calibration data from the measurement performed on July 14, 2011.
Example for ICP-OES calibration - applied for determination of Ti-concentration

Raw data – Methods for chemical analyses (chapter 4) 277
Example printout from the measurement performed on July 14, 2011.
Example for ICP-OES raw data printout - used for determination of total Ag-concentration

Raw data – Methods for chemical analyses (chapter 4) 278
21.1.2 Raw data examples: total Ag
Calibration data from the measurement performed on March 2, 2011.
Example for ICP-OES calibration - applied for determination of total Ag-concentration

Raw data – Methods for chemical analyses (chapter 4) 279
Example printout from the measurement performed on March 2, 2011.
Example for ICP-OES raw data printout - used for determination of total Ag-concentration

Raw data – Methods for chemical analyses (chapter 4) 280
Printout of microwave program - used for determination of total Ag concentration

Raw data – Methods for chemical analyses (chapter 4) 281
21.1.3 Raw data examples: Ag+ (DGTs)
ICP-MS calibration - applied for determination of ion concentrations (DGTs)
Calibration data from the measurement performed on March 4, 2011. Calibration solutions used: 0.25 µg/L, 0.50 µg/L, 1.0 µg/L, 2.5 µg/L, 5.0 µg/L, 10 µg/L and 25 µg/L.
<r>: correlation coefficient
<DL> detection limit, limit of detection (LOD)
used for
calculation

Raw data – Methods for chemical analyses (chapter 4) 282
Example for ICP-MS raw data printout - used for determination of ion concentrations (DGTs)
Example printout from the measurement performed on March 4, 2011.
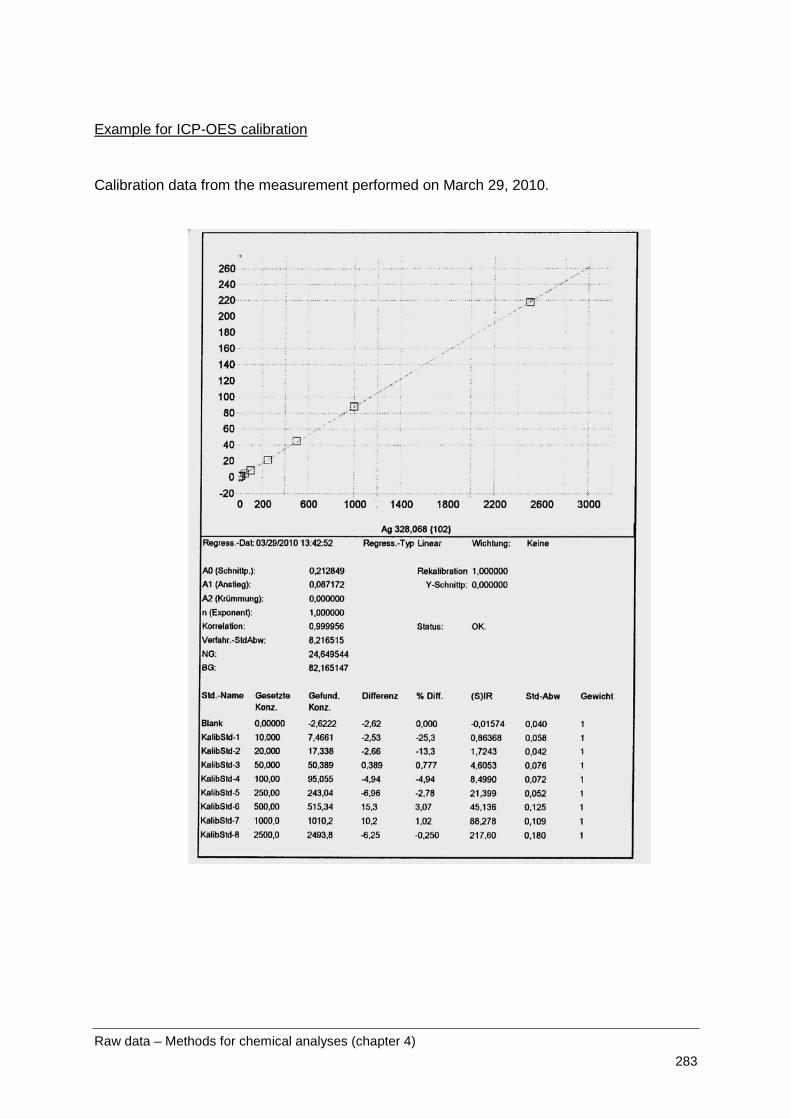
Raw data – Methods for chemical analyses (chapter 4) 283
Example for ICP-OES calibration
Calibration data from the measurement performed on March 29, 2010.
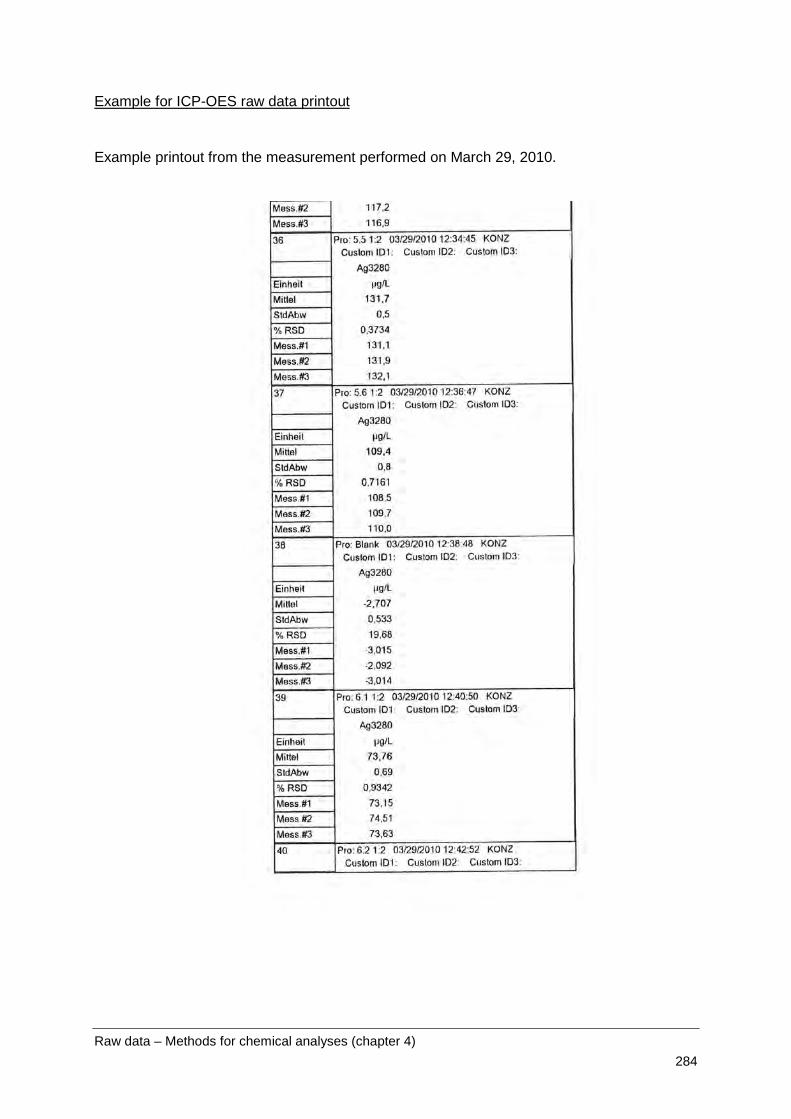
Raw data – Methods for chemical analyses (chapter 4) 284
Example for ICP-OES raw data printout
Example printout from the measurement performed on March 29, 2010.

Raw data – Methods for chemical analyses (chapter 4) 285
21.1.4 Raw data examples: total Au
Calibration data from the measurement performed on January 19, 2012.
Example for ICP-OES calibration - applied for determination of total Au-concentration

Raw data – Methods for chemical analyses (chapter 4) 286
Example printout from the measurement performed on January 19, 2012.
Example for ICP-OES raw data printout - used for determination of total Au-concentration

Raw data – Methods for chemical analyses (chapter 4) 287
21.1.5 Certificates of reference material and standard: Ti
Certified reference material TMDA70

Raw data – Methods for chemical analyses (chapter 4) 288
Certificate of BCR-142R (in extracts, 2 pages)

Raw data – Methods for chemical analyses (chapter 4) 289

Raw data – Methods for chemical analyses (chapter 4) 290
21.1.6 Certificates of reference material and standard: Ag
Certificate of CRM026-050

Raw data – Methods for chemical analyses (chapter 4) 291
Certified reference material TMDWS2

Raw data – Methods for chemical analyses (chapter 4) 292
ICP standard solution for silver
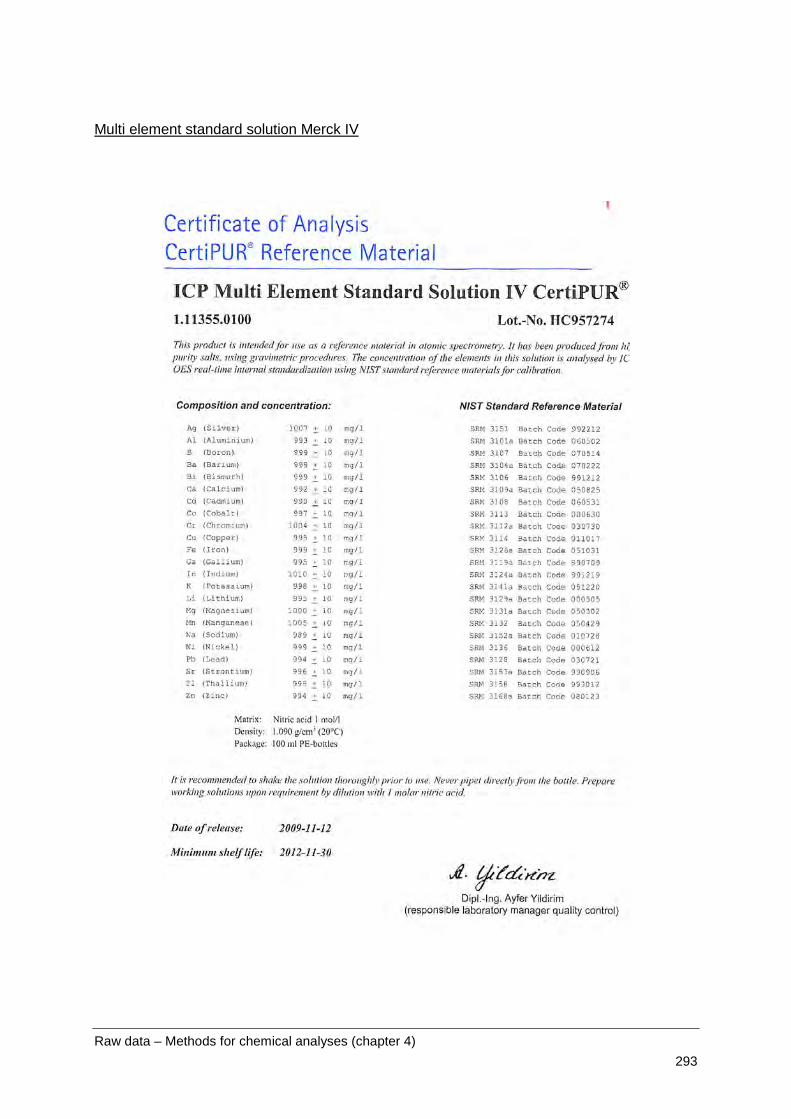
Raw data – Methods for chemical analyses (chapter 4) 293
Multi element standard solution Merck IV

Raw data – Methods for chemical analyses (chapter 4) 294
21.1.7 Certificates of reference material and standard: Au
Reference material NIST 8011 (extracted pages 1, 2)
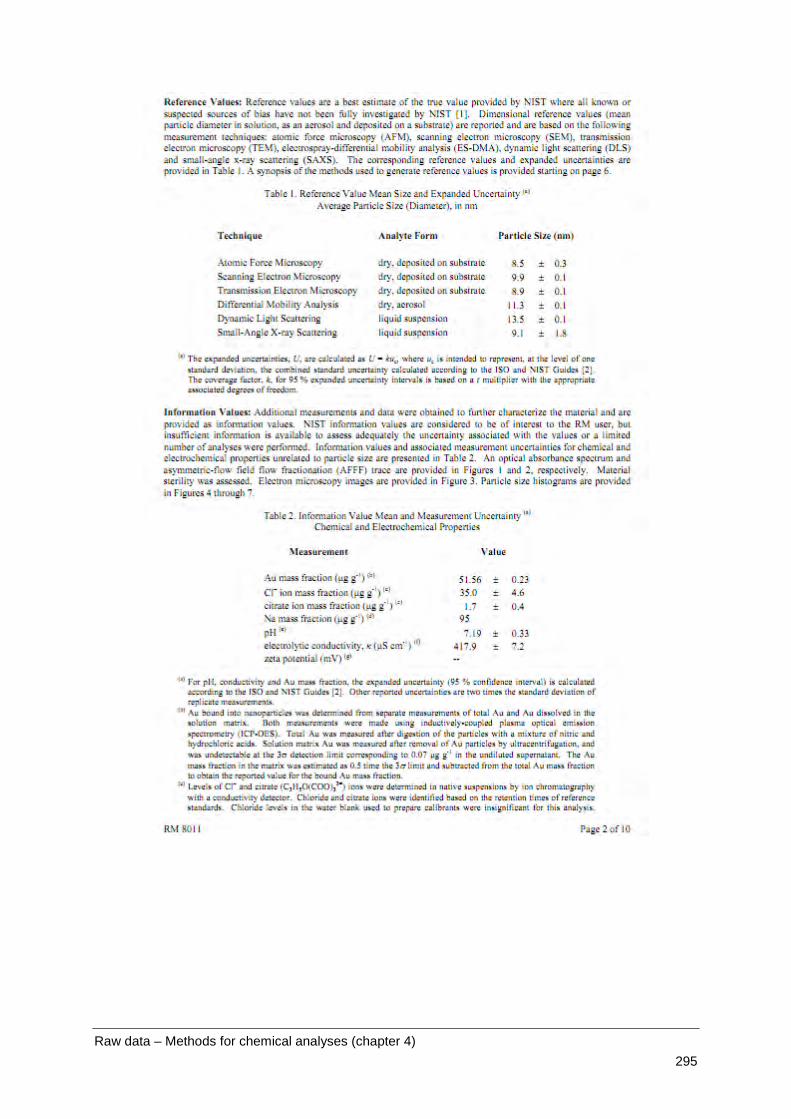
Raw data – Methods for chemical analyses (chapter 4) 295

Raw data – Methods for chemical analyses (chapter 4) 296
ICP standard solution for gold

Raw data - Reproduction test with earthworms – TiO2 (chapter 7) 297
21.2 Raw data – Reproduction test with earthworms – TiO2 (chapter 7)
21.2.1 P25 - First test
Table 170: P25 (1st test) – earthworm test: living worms after 28 days [Individuals]. Single values of the parallel test pots
Replicate No. 1 2 3 4 5 6 7 8
Control 10 10 10 10 10 10 10 10
Application via powder on feed
50 mg/kg 10 10 10 10 - - - -
100 mg/kg 10 10 10 10 - - - -
200 mg/mg/kg 10 10 10 10 - - - -
Application via powder on soil
50 mg/kg 10 10 10 10 - - - -
100 mg/kg 10 10 10 10 - - - -
200 mg/mg/kg 10 10 10 10 - - - -
Application of P25 via dispersion on feed
10 mg/kg 10 10 10 10 - - - -
20 mg/kg 10 10 10 10 - - - -
Application of P25 via dispersion on soil
10 mg/kg 10 10 10 10 - - - -
20 mg/kg 10 10 10 10 - - - -
Table 171: P25 (1st test) – earthworm test: biomass of worm batches at test start [g]. Single values of the replicate test pots
Replicate No. 1 2 3 4 5 6 7 8
Control 3.808 3.024 3.331 3.164 3.109 3.405 3.242 3.244
Application via powder on feed
50 mg/kg 3.260 3.734 3.259 3.178 - - - -
100 mg/kg 3.218 3.087 2.872 3.492 - - - -
200 mg/mg/kg 3.665 3.251 3.024 3.232 - - - -
Application via powder on soil
50 mg/kg 3.008 2.993 3.764 3.717 - - - -
100 mg/kg 3.430 3.534 3.649 3.353 - - - -
200 mg/mg/kg 3.428 3.524 3.264 3.577 - - - -
Application of P25 via dispersion on feed
10 mg/kg 3.204 3.320 3.121 3.274 - - - -
20 mg/kg 3.063 3.169 3.434 3.168 - - - -
Application of P25 via dispersion on soil
10 mg/kg 3.392 3.235 3.101 3.278 - - - -
20 mg/kg 3.594 3.076 3.161 3.492 - - - -
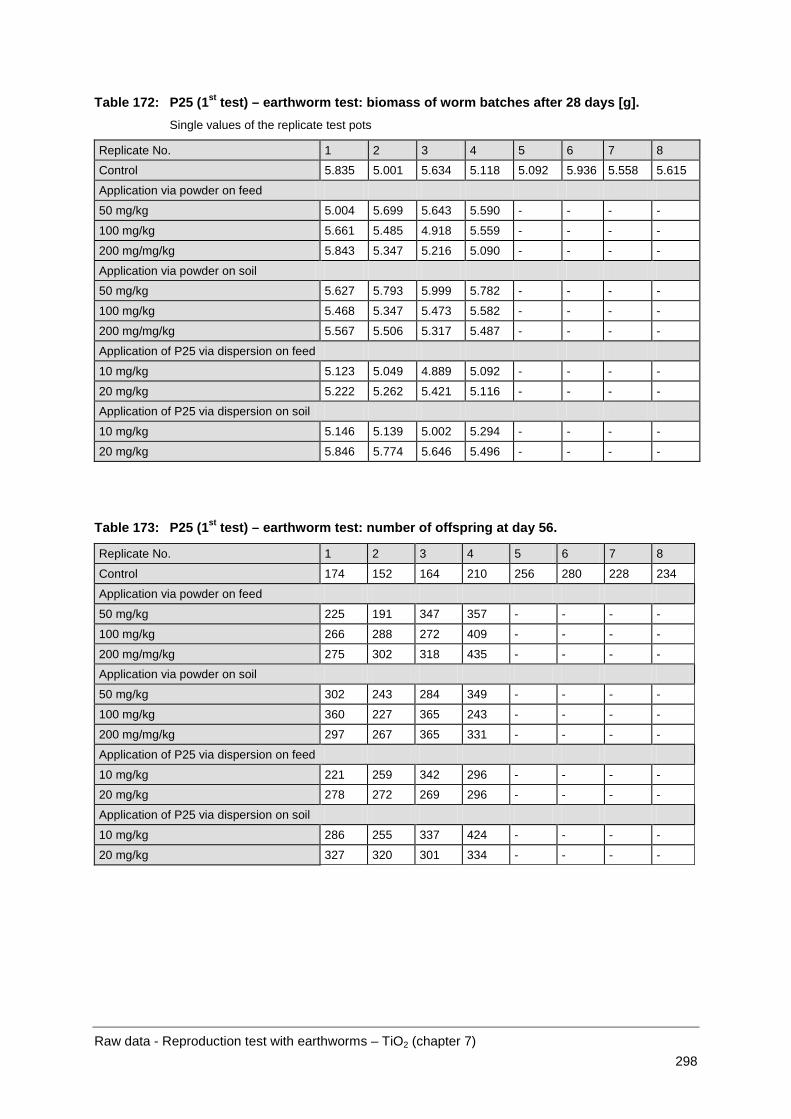
Raw data - Reproduction test with earthworms – TiO2 (chapter 7) 298
Table 172: P25 (1st test) – earthworm test: biomass of worm batches after 28 days [g]. Single values of the replicate test pots
Replicate No. 1 2 3 4 5 6 7 8
Control 5.835 5.001 5.634 5.118 5.092 5.936 5.558 5.615
Application via powder on feed
50 mg/kg 5.004 5.699 5.643 5.590 - - - -
100 mg/kg 5.661 5.485 4.918 5.559 - - - -
200 mg/mg/kg 5.843 5.347 5.216 5.090 - - - -
Application via powder on soil
50 mg/kg 5.627 5.793 5.999 5.782 - - - -
100 mg/kg 5.468 5.347 5.473 5.582 - - - -
200 mg/mg/kg 5.567 5.506 5.317 5.487 - - - -
Application of P25 via dispersion on feed
10 mg/kg 5.123 5.049 4.889 5.092 - - - -
20 mg/kg 5.222 5.262 5.421 5.116 - - - -
Application of P25 via dispersion on soil
10 mg/kg 5.146 5.139 5.002 5.294 - - - -
20 mg/kg 5.846 5.774 5.646 5.496 - - - -
Table 173: P25 (1st test) – earthworm test: number of offspring at day 56.
Replicate No. 1 2 3 4 5 6 7 8
Control 174 152 164 210 256 280 228 234
Application via powder on feed
50 mg/kg 225 191 347 357 - - - -
100 mg/kg 266 288 272 409 - - - -
200 mg/mg/kg 275 302 318 435 - - - -
Application via powder on soil
50 mg/kg 302 243 284 349 - - - -
100 mg/kg 360 227 365 243 - - - -
200 mg/mg/kg 297 267 365 331 - - - -
Application of P25 via dispersion on feed
10 mg/kg 221 259 342 296 - - - -
20 mg/kg 278 272 269 296 - - - -
Application of P25 via dispersion on soil
10 mg/kg 286 255 337 424 - - - -
20 mg/kg 327 320 301 334 - - - -

Raw data - Reproduction test with earthworms – TiO2 (chapter 7) 299
Table 174: P25 (1st test) – earthworm test: soil dry mass [%]. Single values of the replicate test pots [%]; concentrations given as nominal values [mg/kg]
Application via powder on feed
Application via powder on soil
Application via dispersion on feed
Application via dispersion on soil
Control 50 100 200 50 100 200 10 20 10 20
Test start 81.0 81.3 80.9 80.8 79.6 80.1 81.6 80.9 80.4 81.2 79.6
Test end 89.1 89.1 89.1 89.1 89.1 89.1 89.1 88.8 88.8 88.8 88.8
Table 175: P25 (1st test) – earthworm test: soil moisture [% WHC]. single values of the replicate test pots; since WHC is affected by feed adding, no calculation for test end can be applied; concentrations given as nominal values [mg/kg]
Application via powder on feed
Application via powder on soil
Application via dispersion on feed
Application via dispersion on soil
Control 50 100 200 50 100 200 10 20 10 20
Test start 54.1 54.1 54.1 54.1 54.1 54.1 54.1 55.5 55.5 55.5 55.5
Table 176: P25 (1st test) – earthworm test: soil pH. Single values of the parallel test pots; concentrations given as nominal values
Application via powder on feed
Application via powder on soil
Application via dispersion on feed
Application via dispersion on soil
Control 50 100 200 50 100 200 10 20 10 20
Test start 4.9 4.9 4.9 4.9 4.9 4.9 4.9 4.9 4.9 4.9 4.9
Test end 6.5 6.5 6.4 6.5 6.5 6.5 6.4 6.5 6.5 6.5 6.5

Raw data - Reproduction test with earthworms – TiO2 (chapter 7) 300
21.2.2 P25 - Second test
Table 177: P25 (2nd test) – earthworm test: living worms after 28 days. Single values of the parallel test pots [Individuals]
Replicate No. 1 2 3 4 5 6 7 8 Application via powder on soil
Control 10 10 10 10 10 10 10 10
50 mg/kg 10 10 10 10 - - - -
100 mg/kg 10 10 10 10 - - - -
200 mg/mg/kg 10 10 10 10 - - - -
500 mg/kg 10 10 10 10 - - - -
1000 mg/kg 10 10 10 10 - - - -
Table 178: P25 (2nd test) – earthworm test: biomass of worm batches at test start [g]. Single values of the replicate test pots
Replicate No. 1 2 3 4 5 6 7 8
Application via powder on soil
Control 4.024 4.274 3.937 3.947 3.585 3.358 3.501 3.819
50 mg/kg 3.683 3.520 3.719 3.540 - - - -
100 mg/kg 3.671 3.706 3.497 3.763 - - - -
200 mg/mg/kg 3.669 3.560 3.675 3.432 - - - -
500 mg/kg 3.463 3.619 3.493 3.596 - - - -
1000 mg/kg 3.952 3.404 3.555 3.593 - - - -
Table 179: P25 (2nd test) – earthworm test: biomass of worm batches after 28 days [g]. Single values of the replicate test pots
Replicate No. 1 2 3 4 5 6 7 8
Application via powder on soil
Control 5.684 5.687 5.060 5.783 5.254 4.792 5.308 5.398
50 mg/kg 5.276 4.813 5.130 5.148 - - - -
100 mg/kg 5.324 6.035 5.451 5.844 - - - -
200 mg/mg/kg 5.327 4.849 5.660 4.848 - - - -
500 mg/kg 4.701 5.479 5.173 5.606 - - - -
1000 mg/kg 5.711 5.712 5.173 5.679 - - - -

Raw data - Reproduction test with earthworms – TiO2 (chapter 7) 301
Table 180: P25 (2nd test) – earthworm test: number of offspring at day 56.
Replicate No. 1 2 3 4 5 6 7 8 Application via powder on soil
Control 326 417 297 347 315 311 338 372
50 mg/kg 379 350 301 334 - - - -
100 mg/kg 308 377 343 343 - - - -
200 mg/mg/kg 261 294 320 286 - - - -
500 mg/kg 174 319 279 240 - - - -
1000 mg/kg 307 373 326 271 - - - -
Table 181: P25 (2nd test) – earthworm test: soil dry mass [%]. Single values of the replicate test pots [%]; concentrations given as nominal values [mg/kg]
Control 50 100 200 500 1000
Test start 89.4 89.3 89.3 89.7 89.8 89.7
Test end 79.0 82.1 83.1 81.4 80.9 80.3
Table 182: P25 (2nd test) – earthworm test: Soil moisture [% WHC] Single values of the replicate test pots; since WHC is affected by feed adding; No calculation for test end can be applied; concentrations given as nominal values [mg/kg]
Control 50 100 200 500 1000
Test start 52.14 52.77 52.77 50.5 50.03 50.42
Table 183: P25 (2nd test) – earthworm test: soil pH. Single values of the parallel test pots; concentrations given as nominal values
Control 50 100 200 500 1000
Test start 5.11 5.1 5.1 5.09 5.09 5.09
Test end 6.6 6.6 6.6 6.6 6.6 6.5

Raw data - Reproduction test with earthworms – TiO2 (chapter 7) 302
21.2.3 P25 - Third test
Table 184: P25 (3rd test) – earthworm test: living worms after 28 days. Single values of the parallel test pots [Individuals]
Replicate No. 1 2 3 4 5 6 7 8 Application via powder on soil
Control 10 10 10 10 10 10 10 10
50 mg/kg 10 10 10 10 - - - -
100 mg/kg 10 10 10 10 - - - -
200 mg/mg/kg 10 10 10 10 - - - -
500 mg/kg 10 9 10 10 - - - -
750 mg/kg 10 10 10 10 - - - -
1000 mg/kg 10 9 10 10 - - - -
Table 185: P25 (3rd test) – earthworm test: biomass of worm batches at test start [g]. Single values of the replicate test pots
Replicate No. 1 2 3 4 5 6 7 8
Application via powder on soil
Control 3.846 3.631 4.068 3.560 3.904 3.565 3.242 3.776
50 mg/kg 3.650 3.459 3.766 3.828 - - - -
100 mg/kg 3.357 3.476 3.631 3.809 - - - -
200 mg/mg/kg 3.443 3.479 3.560 3.341 - - - -
500 mg/kg 3.728 3.538 3.781 3.299 - - - -
750 mg/kg 3.619 3.560 3.423 3.708 - - - -
1000 mg/kg 3.352 3.235 3.655 3.492 - - - -
Table 186: P25 (3rd test) – earthworm test: biomass of worm batches after 28 days [g]. Single values of the replicate test pots
Replicate No. 1 2 3 4 5 6 7 8
Application via powder on soil
Control 5.225 5.244 5.543 4.492 5.711 5.137 5.033 5.714
50 mg/kg 5.444 5.278 5.297 5.410 - - - -
100 mg/kg 5.357 5.438 5.614 5.160 - - - -
200 mg/mg/kg 5.557 5.853 5.633 5.262 - - - -
500 mg/kg 5.790 4.812 5.703 5.159 - - - -
750 mg/kg 5.491 5.240 5.082 5.901 - - - -
1000 mg/kg 5.498 4.518 5.685 5.474 - - - -

Raw data - Reproduction test with earthworms – TiO2 (chapter 7) 303
Table 187: P25 (3rd test) – earthworm test: number of offspring at day 56.
Replicate No. 1 2 3 4 5 6 7 8 Application via powder on soil
Control 219 293 207 192 197 237 218 194
50 mg/kg 268 214 234 240 - - - -
100 mg/kg 243 238 273 252 - - - -
200 mg/mg/kg 232 302 248 279 - - - -
500 mg/kg 237 253 238 225 - - - -
750 mg/kg 313 276 281 247
1000 mg/kg 299 261 277 308 - - - -
Table 188: P25 (3rd test) – earthworm test: soil dry mass [%]. Single values of the replicate test pots [%]; concentrations given as nominal values [mg/kg]
Control 50 100 200 500 750 1000
Test start 89.3 89.3 88.9 89 89.7 89.2 88.6
Test end 82.8 80.2 82.9 82.7 81.9 81.8 81.9
Table 189: P25 (3rd test) – earthworm test: soil moisture [% WHC]. Single values of the replicate test pots; since WHC is affected by feed adding, no calculation for test end can be applied; concentrations given as nominal values [mg/kg]
Control 50 100 200 500 750 1000
Test start 53.02 52.53 55.12 54.55 50.53 53.28 56.93
Table 190: P25 (3rd test) – earthworm test: soil pH. Single values of the parallel test pots; concentrations given as nominal values
Control 50 100 200 500 750 1000
Test start 5.4 5.3 5.2 5.3 5.2 5.1 5.2
Test end 6.9 6.9 6.7 6.7 6.8 6.8 6.9

Raw data - Reproduction test with earthworms – TiO2 (chapter 7) 304
21.2.4 NM-101 - First test
Table 191: NM-101 (1st test) – earthworm test: living worms after 28 days. Single values of the parallel test pots [Individuals]
Replicate No. 1 2 3 4 5 6 7 8
Control 10 10 10 10 10 10 10 10
Application via powder on feed
50 mg/kg 10 10 10 10 - - - -
100 mg/kg 10 10 10 10 - - - -
200 mg/mg/kg 10 10 10 10 - - - -
Application via powder on soil
50 mg/kg 10 10 10 10 - - - -
100 mg/kg 10 10 10 10 - - - -
200 mg/mg/kg 10 10 10 10 - - - -
Application of P25 via dispersion on feed
10 mg/kg 10 10 10 10 - - - -
20 mg/kg 10 10 10 10 - - - -
Application of P25 via dispersion on soil
10 mg/kg 10 10 10 10 - - - -
20 mg/kg 10 10 10 10 - - - -
Table 192: NM-101 (1st test) – earthworm test: biomass of worm batches at test start [g]. Single values of the replicate test
Replicate No. 1 2 3 4 5 6 7 8
Control 3.742 3.791 3.945 3.498 3.569 3.361 3.448 3.852
Application via powder on feed
50 mg/kg 3.150 3.430 3.523 3.543 - - - -
100 mg/kg 3.449 3.191 3.993 3.434 - - - -
200 mg/mg/kg 3.378 3.687 3.787 3.460 - - - -
Application via powder on soil
50 mg/kg 3.595 3.254 3.654 3.440 - - - -
100 mg/kg 3.271 3.658 3.363 3.290 - - - -
200 mg/mg/kg 3.332 3.127 3.785 3.091 - - - -
Application of P25 via dispersion on feed
10 mg/kg 3.250 3.312 3.413 3.087 - - - -
20 mg/kg 3.694 3.230 3.020 3.304 - - - -
Application of P25 via dispersion on soil
10 mg/kg 3.120 3.234 3.382 3.069 - - - -
20 mg/kg 3.131 3.380 2.958 3.025 - - - -

Raw data - Reproduction test with earthworms – TiO2 (chapter 7) 305
Table 193: NM-101 (1st test) – earthworm test: biomass of worm batches after 28 days [g]. Single values of the replicate test pots
Replicate No. 1 2 3 4 5 6 7 8
Control 6.261 6.312 6.148 5.721 6.192 5.744 5.774 6.304
Application via powder on feed
50 mg/kg 5.687 6.223 5.988 6.368 - - - -
100 mg/kg 5.938 5.738 6.588 6.238 - - - -
200 mg/mg/kg 6.076 6.367 6.170 6.403 - - - -
Application via powder on soil
50 mg/kg 6.262 6.127 6.580 5.892 - - - -
100 mg/kg 6.351 6.233 6.180 6.471 - - - -
200 mg/mg/kg 5.999 6.284 6.762 5.906 - - - -
Application of P25 via dispersion on feed
10 mg/kg 5.653 5.947 6.267 5.799 - - - -
20 mg/kg 6.745 6.272 5.983 6.176 - - - -
Application of P25 via dispersion on soil
10 mg/kg 6.013 6.202 5.881 5.731 - - - -
20 mg/kg 5.999 5.971 5.752 5.869 - - - -

Raw data - Reproduction test with earthworms – TiO2 (chapter 7) 306
Table 194: NM-101 (1st test) – earthworm test: .umber of offspring at day 56.
Replicate No. 1 2 3 4 5 6 7 8
Control 286 267 289 309 340 286 315 330
Application via powder on feed
50 mg/kg 248 269 361 309 - - - -
100 mg/kg 328 318 306 327 - - - -
200 mg/mg/kg 315 311 367 354 - - - -
Application via powder on soil
50 mg/kg 319 351 309 307 - - - -
100 mg/kg 353 317 333 407 - - - -
200 mg/mg/kg 345 425 392 337 - - - -
Application of P25 via dispersion on feed
10 mg/kg 327 349 328 307 - - - -
20 mg/kg 340 310 356 329 - - - -
Application of P25 via dispersion on soil
10 mg/kg 371 266 286 308 - - - -
20 mg/kg 392 329 354 276 - - - -
Table 195: NM-101 (1st test) – earthworm test: soil dry mass [%]. Single values of the replicate test pots [%]; concentrations given as nominal values [mg/kg]
Application via powder on feed
Application via powder on soil
Application via dispersion on feed
Application via dispersion on soil
Control 50 100 200 50 100 200 10 20 10 20
Test start 88.6 89.1 89.3 88.8 89.6 89.6 90.0 89.2 89.2 89.3 89.2
Test end 80.3 78.6 79.8 78.5 81.0 80.2 81.1 81.6 80.5 79.8 81.0
Table 196: NM-101 (1st test) – earthworm test: soil moisture [% WHC]. Single values of the replicate test pots; since WHC is affected by feed adding, no calculation for test end can be applied; concentrations given as nominal values [mg/kg]
Application via powder on feed
Application via powder on soil
Application via dispersion on feed
Application via dispersion on soil
Control 50 100 200 50 100 200 10 20 10 20
Test start 56.5 54.1 52.7 55.8 51.3 51.0 49.2 53.3 53.6 52.73 53.10
Table 197: NM-101 (1st test): – earthworm test: soil pH. Single values of the parallel test pots; concentrations given as nominal values [mg/kg]
Application via powder on feed
Application via powder on soil
Application via dispersion on feed
Application via dispersion on soil
Control 50 100 200 50 100 200 10 20 10 20
Test start 4.8 4.8 4.8 4.8 4.8 4.8 4.8 4.8 4.8 4.8 4.9
Test end 6.3 6.2 6.3 6.3 6.3 6.3 6.3 6.3 6.3 6.4 6.4
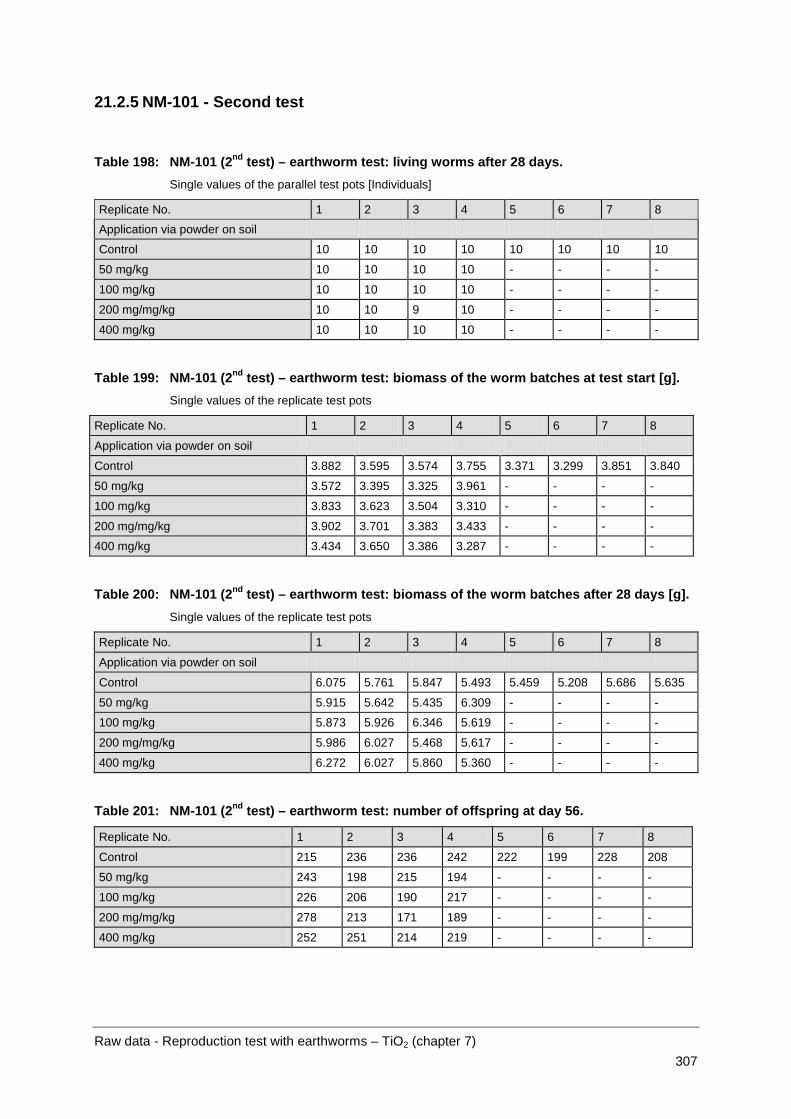
Raw data - Reproduction test with earthworms – TiO2 (chapter 7) 307
21.2.5 NM-101 - Second test
Table 198: NM-101 (2nd test) – earthworm test: living worms after 28 days. Single values of the parallel test pots [Individuals]
Replicate No. 1 2 3 4 5 6 7 8 Application via powder on soil
Control 10 10 10 10 10 10 10 10
50 mg/kg 10 10 10 10 - - - -
100 mg/kg 10 10 10 10 - - - -
200 mg/mg/kg 10 10 9 10 - - - -
400 mg/kg 10 10 10 10 - - - -
Table 199: NM-101 (2nd test) – earthworm test: biomass of the worm batches at test start [g]. Single values of the replicate test pots
Replicate No. 1 2 3 4 5 6 7 8
Application via powder on soil
Control 3.882 3.595 3.574 3.755 3.371 3.299 3.851 3.840
50 mg/kg 3.572 3.395 3.325 3.961 - - - -
100 mg/kg 3.833 3.623 3.504 3.310 - - - -
200 mg/mg/kg 3.902 3.701 3.383 3.433 - - - -
400 mg/kg 3.434 3.650 3.386 3.287 - - - -
Table 200: NM-101 (2nd test) – earthworm test: biomass of the worm batches after 28 days [g]. Single values of the replicate test pots
Replicate No. 1 2 3 4 5 6 7 8
Application via powder on soil
Control 6.075 5.761 5.847 5.493 5.459 5.208 5.686 5.635
50 mg/kg 5.915 5.642 5.435 6.309 - - - -
100 mg/kg 5.873 5.926 6.346 5.619 - - - -
200 mg/mg/kg 5.986 6.027 5.468 5.617 - - - -
400 mg/kg 6.272 6.027 5.860 5.360 - - - -
Table 201: NM-101 (2nd test) – earthworm test: number of offspring at day 56.
Replicate No. 1 2 3 4 5 6 7 8
Control 215 236 236 242 222 199 228 208
50 mg/kg 243 198 215 194 - - - -
100 mg/kg 226 206 190 217 - - - -
200 mg/mg/kg 278 213 171 189 - - - -
400 mg/kg 252 251 214 219 - - - -

Raw data - Reproduction test with earthworms – TiO2 (chapter 7) 308
Table 202: NM-101 (2nd test) – earthworm test: soil dry mass [%]. Single values of the replicate test pots [%]; concentrations given as nominal values [mg/kg]
Control 50 100 200 400
Test start 88.1 88.9 89.1 89.1 88.5
Test end 80.5 80.7 81.2 81.2 81.5
Table 203: NM-101 (2nd test) – earthworm test: soil moisture as [% WHC]. Single values of the replicate test pots; since WHC is affected by feed adding, no calculation for test end can be applied; concentrations given as nominal values [mg/kg]
Control 50 100 200 400
Test start 59.48 55.08 54.13 54.04 57.22
Table 204: NM-101 (2nd test) – earthworm test: soil pH. Single values of the parallel test pots; concentrations given as nominal values
Control 50 100 200 400
Test start 5.0 5.0 5.0 5.0 5.0
Test end 6.9 6.9 6.8 6.7 6.8

Raw data - Reproduction test with earthworms – TiO2 (chapter 7) 309
21.2.6 NM-103 - First test
Table 205: NM-103 (1st test) – earthworm test: living worms after 28 days. Single values of the parallel test pots [Individuals]
Replicate No. 1 2 3 4 5 6 7 8
Control 10 10 10 10 10 10 10 10
Application via powder on feed
50 mg/kg 10 10 10 10 - - - -
100 mg/kg 10 10 10 10 - - - -
200 mg/mg/kg 10 10 10 10 - - - -
Application via powder on soil
50 mg/kg 10 10 10 10 - - - -
100 mg/kg 10 10 9 10 - - - -
200 mg/mg/kg 10 10 10 10 - - - -
Application of P25 via dispersion on feed
10 mg/kg 10 10 10 10 - - - -
20 mg/kg 10 10 10 10 - - - -
Application of P25 via dispersion on soil
10 mg/kg 10 10 10 10 - - - -
20 mg/kg 10 10 10 10 - - - -
Table 206: NM-103 (1st test) – earthworm test: biomass of the worm batches at test start [g]. Single values of the replicate test pots
Replicate No. 1 2 3 4 5 6 7 8
Control 3.779 3.810 3.886 3.990 3.994 3.924 3.390 4.104
Application via powder on feed
50 mg/kg 3.710 3.496 3.878 3.826 - - - -
100 mg/kg 3.580 4.111 3.978 3.873 - - - -
200 mg/mg/kg 3.824 3.617 3.546 4.014 - - - -
Application via powder on soil
50 mg/kg 3.454 3.953 3.828 4.094 - - - -
100 mg/kg 3.866 3.461 3.508 4.279 - - - -
200 mg/mg/kg 3.915 3.465 3.555 3.708 - - - -
Application of P25 via dispersion on feed
10 mg/kg 3.832 3.461 3.421 3.519 - - - -
20 mg/kg 3.858 4.185 3.708 3.466 - - - -
Application of P25 via dispersion on soil
10 mg/kg 3.557 3.866 4.089 3.620 - - - -
20 mg/kg 3.697 3.502 3.405 3.252 - - - -
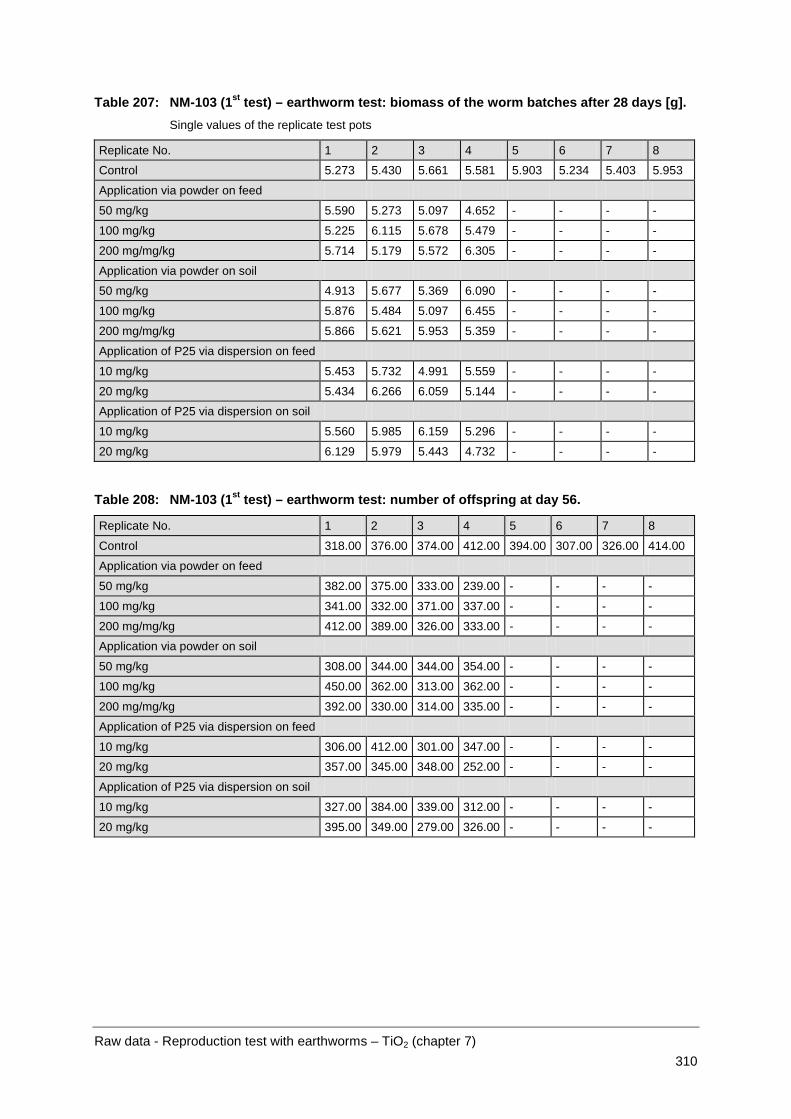
Raw data - Reproduction test with earthworms – TiO2 (chapter 7) 310
Table 207: NM-103 (1st test) – earthworm test: biomass of the worm batches after 28 days [g]. Single values of the replicate test pots
Replicate No. 1 2 3 4 5 6 7 8
Control 5.273 5.430 5.661 5.581 5.903 5.234 5.403 5.953
Application via powder on feed
50 mg/kg 5.590 5.273 5.097 4.652 - - - -
100 mg/kg 5.225 6.115 5.678 5.479 - - - -
200 mg/mg/kg 5.714 5.179 5.572 6.305 - - - -
Application via powder on soil
50 mg/kg 4.913 5.677 5.369 6.090 - - - -
100 mg/kg 5.876 5.484 5.097 6.455 - - - -
200 mg/mg/kg 5.866 5.621 5.953 5.359 - - - -
Application of P25 via dispersion on feed
10 mg/kg 5.453 5.732 4.991 5.559 - - - -
20 mg/kg 5.434 6.266 6.059 5.144 - - - -
Application of P25 via dispersion on soil
10 mg/kg 5.560 5.985 6.159 5.296 - - - -
20 mg/kg 6.129 5.979 5.443 4.732 - - - -
Table 208: NM-103 (1st test) – earthworm test: number of offspring at day 56.
Replicate No. 1 2 3 4 5 6 7 8
Control 318.00 376.00 374.00 412.00 394.00 307.00 326.00 414.00
Application via powder on feed
50 mg/kg 382.00 375.00 333.00 239.00 - - - -
100 mg/kg 341.00 332.00 371.00 337.00 - - - -
200 mg/mg/kg 412.00 389.00 326.00 333.00 - - - -
Application via powder on soil
50 mg/kg 308.00 344.00 344.00 354.00 - - - -
100 mg/kg 450.00 362.00 313.00 362.00 - - - -
200 mg/mg/kg 392.00 330.00 314.00 335.00 - - - -
Application of P25 via dispersion on feed
10 mg/kg 306.00 412.00 301.00 347.00 - - - -
20 mg/kg 357.00 345.00 348.00 252.00 - - - -
Application of P25 via dispersion on soil
10 mg/kg 327.00 384.00 339.00 312.00 - - - -
20 mg/kg 395.00 349.00 279.00 326.00 - - - -

Raw data - Reproduction test with earthworms – TiO2 (chapter 7) 311
Table 209: NM-103 (1st test) – earthworm test: soil dry mass content [%]. Single values of the replicate test pots [%]
Application via powder on feed
Application via powder on soil
Application via dispersion on feed
Application via dispersion on soil
Control 50 100 200 50 100 200 10 20 10 20
Test start 89.2 89.0 89.5 89.1 89.7 89.3 89.9 89.6 89.0 89.3 89.7
Test end 79.9 81.9 80.9 79.5 79.5 81.9 81.3 81.2 81.4 82.0 81.9
Table 210: NM-103 (1st test) – earthworm test: soil moisture as [% WHC]. Single values of the replicate test pots; since WHC is affected by feed adding, no calculation for test end can be applied; concentrations given as nominal values [mg/kg]
Application via powder on feed
Application via powder on soil
Application via dispersion on feed
Application via dispersion on soil
Control 50 100 200 50 100 200 10 20 10 20
Test start 53.2 55.1 51.5 54.3 51.1 53.5 50.1 50.8 54.5 53.3 50.6
Table 211: NM-103 (1st test) – earthworm test: soil pH. Single values of the parallel test pots; concentrations given as nominal values
Application via powder on feed
Application via powder on soil
Application via dispersion on feed
Application via dispersion on soil
Control 50 100 200 50 100 200 10 20 10 20
Test start 5.0 5.0 5.0 5.0 5.0 5.0 5.0 4.9 4.9 5.0 5.0
Test end 6.5 6.4 6.5 6.4 6.5 6.5 6.4 6.4 6.5 6.5 6.2
21.2.7 NM-103 - Second test
Table 212: NM-103 (2nd test) – earthworm test: living worms after 28 days. Single values of the parallel test pots [Individuals]
Replicate No. 1 2 3 4 5 6 7 8 Application via powder on soil
Control 10 10 10 10 10 10 10 10
50 mg/kg 10 10 10 10 - - - -
100 mg/kg 10 10 10 10 - - - -
200 mg/mg/kg 10 10 9 10 - - - -
400 mg/kg 10 10 10 10 - - - -
Raw data - Reproduction test with earthworms – TiO2 (chapter 7) 312
Table 213: NM-103 (2nd test) – earthworm test: biomass of the worm batches at test start [g]. Single values of the replicate test pots
Replicate No. 1 2 3 4 5 6 7 8
Application via powder on soil
Control 3.882 3.595 3.574 3.755 3.371 3.299 3.851 3.840
50 mg/kg 3.843 3.398 3.389 4.054 - - - -
100 mg/kg 3.413 3.622 3.729 3.110 - - - -
200 mg/mg/kg 3.522 3.480 3.539 3.253 - - - -
400 mg/kg 3.559 3.334 3.823 3.736 - - - -
Table 214: NM-103 (2nd test) – earthworm test: biomass of the worm batches after 28 days [g]. Single values of the replicate test pots
Replicate No. 1 2 3 4 5 6 7 8
Application via powder on soil
Control 6.075 5.761 5.847 5.493 5.459 5.208 5.686 5.635
50 mg/kg 5.846 5.493 5.743 5.620 - - - -
100 mg/kg 5.813 6.091 5.808 5.366 - - - -
200 mg/mg/kg 5.916 6.255 5.198 5.437 - - - -
400 mg/kg 6.406 5.460 6.131 5.931 - - - -
Table 215: NM-103 (2nd test) – earthworm test: number of offspring at day 56.
Replicate No. 1 2 3 4 5 6 7 8
Control 215 236 236 242 222 199 228 208
50 mg/kg 223 216 238 284 - - - -
100 mg/kg 217 221 307 262 - - - -
200 mg/mg/kg 214 230 289 198 - - - -
400 mg/kg 274 208 264 201 - - - -
Table 216: NM-103 (2nd test) – earthworm test: soil dry mass [%]. Single values of the replicate test pots [%]; concentrations given as nominal values [mg/kg]
Control 50 100 200 400
Test start 88.1 88.4 88.1 88.2 88.3
Test end 80.5 81.2 81.6 81.6 81.2
Table 217: NM-103 (2nd test) – earthworm test: Soil moisture [% WHC]. Single values of the replicate test pots; since WHC is affected by feed adding, no calculation for test end can be applied; concentrations given as nominal values [mg/kg]
Control 50 100 200 400
Test start 59.5 57.9 59.4 59.0 58.6

Raw data - Reproduction test with earthworms – TiO2 (chapter 7) 313
Table 218: NM-103 (2nd test) – earthworm test: soil pH. Single values of the parallel test pots; concentrations given as nominal values
Control 50 100 200 400
Test start 5.0 5.0 5.0 5.0 5.0
Test end 6.8 6.8 6.8 6.9 6.8

Raw data - Reproduction test with earthworms – TiO2 (chapter 7) 314
21.2.8 Ti concentration in earthworms
The information about the LOD/LOQ and correlation coefficient are compiled in
P25
Table 6.
Coefficient of determination (r) for respective calibration functions were taken from ICP-OES instrument outputs.
Table 219: P25 (1st test) – Ti concentration in earthworms: LODs/LOQs, correlation.
Measurement date, description LOD [µg/L]
LOQ [µg/L]
Correlation coefficient r
July 28, 2011 measurements of samples from May 19th 18 60* 0.99990
July 14, 2011 measurements of samples from Janu-ary 25th and February 18th 65 218* 0.99975
June 09, 2011 measurements of control worms for fortification 18 54* 0.99941
* Internal LOQ calculation was performed with more digits
The recovery for CPI multi element solution (appropriately diluted) samples containing 500 µg Ti/L was 104 ± 7% (n = 6).
For further quality assurance, recalibration samples were analysed along with the samples and the mean accuracy was determined to 103 ± 3% (n = 6) for a Ti concentration of 500 µg/L. For collecting validation information of the digestion procedure of samples as well as the analytical method several control worms were pooled and spiked with a weighed amount of TiO2 nanoparticles.
Therefore accurately weighted 2698 µg TiO2 nanoparticles (P25, 1617 µg Ti) were given to exactly 2164.0 mg of homogenized and dried worms. This titanium amount represents 747 µg/g. Without spiking the Eisenia fetida material exhibited a mean titanium concentration of 44.9 ± 2.8 µg/g (n = 2). In conclusion the nominal value is calculated to 792 µg/L.
Spiked samples were digested and analysed along with actual samples, exhibiting a mean value of 659 ± 57 µg/L (n = 6), representing a mean recovery of 83.1 ± 7.2%. The quality requirements for the digestion and analysis of titanium in Eisenia fetida were set to 100 ± 25%, and were therefore fulfilled.
Analytical results The titanium amounts in samples from two tests with P25 were quantified:
Loadings (food and soil), January 25th: control, 10 mg/kg, 20 mg/kg, 50 mg/kg, 100 mg/kg, 200 mg/kg (Table 18)
Loadings (soil), May 19th: 50 mg/kg, 100 mg/kg, 200 mg/kg, 500 mg/kg, 1000 mg/kg (Table 221)
The measured values in µg/L are calculated to µg/g:

Raw data - Reproduction test with earthworms – TiO2 (chapter 7) 315
Amount of Ti in dry weight = measured value / [1000 / 15 (final volume in mL)] / weight (mg) *1000
Table 220 - Table 221 summarize the measured titanium concentrations in the samples.
Table 220: P25 (1st test): Ti concentration in earthworms.
Sample name Weighted sample [mg]
Measured value [µg/L]
Ti in dry weight [µg/g]
Mean Ti in dry weight ± SD [µg/g]
Control c 193.8 844 65.3 58.4 ± 9.8
Control d 202.2 694 51.5 10 mg/kg (soil) c 209.8 711 50.8
54.2 ± 4.7 10 mg/kg (soil) d 206.5 792 57.5 10 mg/kg (food) c 197.9 733 55.5
58.6 ± 4.3 10 mg/kg (food) d 198.8 817 61.7 20 mg/kg (soil) c 196.8 989 75.3
77.4 ± 2.9 20 mg/kg (soil) d 192.5 1021 79.6 20 mg/kg (food) c 195.7 804 61.6
64.6 ± 4.1 20 mg/kg (food) d 201.1 905 67.5 50 mg/kg (soil) c 196.6 873 66.6
76.4 ± 19.9 50 mg/kg (soil) d 200.2 1152 86.3 50 mg/kg (food) c 198.1 1051 79.6
75.3 ± 6.1 50 mg/kg (food) d 197.0 933 71.0 100 mg/kg (soil) c 189.1 1076 85.3
76.3 ± 12.7 100 mg/kg (soil) d 212.6 954 67.3 100 mg/kg (food) c 203.5 1302 96.0
101 ± 7 100 mg/kg (food) d 204.5 1452 106 200 mg/kg (soil) c 199.5 1236 92.9
72.4 ± 29.0 200 mg/kg (soil) d 202.1 699 51.9 200 mg/kg (food) c 195.0 1280 98.5
121 ± 31 200 mg/kg (food) d 205.6 1955 143

Raw data - Reproduction test with earthworms – TiO2 (chapter 7) 316
Table 221: P25 (2nd test): Ti concentration in earthworms.
Sample name Weighted sample [mg]
Measured value [µg/L]
Ti in dry weight [µg/g]
Mean Ti in dry weight ± SD [µg/g]
Control a 202 722 53.6 55.2 ± 2.2
Control b 201.7 763 56.7 50 mg/kg (soil) a 202.5 705 52.2
49.2. ± 4.3 50 mg/kg (soil) b 202.2 621 46.1 100 mg/kg (soil) a 203.7 579 42.6
43.7 ± 1.5 100 mg/kg (soil) b 200.6 599 44.8 200 mg/kg (soil) a 201.9 788 58.6
50.1 ± 11.9 200 mg/kg (soil) b 201.4 560 41.7 500 mg/kg (soil) a 201 804 60.0
61.0 ± 1.4 500 mg/kg (soil) b 201.5 834 62.0 1000 mg/kg (soil) a 202.4 981 72.7
88.0 ± 21.7 1000 mg/kg (soil) b 201.7 1390 103

Raw data - Reproduction test with earthworms – TiO2 (chapter 7) 317
Raw data examples Example for ICP-OES calibration: Calibration data from the measurement performed on July 14, 2011

Raw data - Reproduction test with earthworms – TiO2 (chapter 7) 318
Example for ICP-OES raw data printout: Example printout from the measurement performed on July 14, 2011

Raw data - Reproduction test with earthworms – TiO2 (chapter 7) 319
The information about the LOD/LOQ and correlation coefficient are compiled in
NM-101
Table 222.
Coefficients of determination (r) for respective calibration functions were taken from ICP-OES instrument outputs.
Table 222: NM-101 - Ti concentration in earthworms: LODs/LOQs, correlation.
Measurement date, description LOD [µg/L]
LOQ [µg/L]
Correlation coefficient r
July 14, 2011 measurements of samples 65 218* 0.99975 June 09, 2011 measurements of control worms for fortifi-cation
18 54* 0.99941
* Internal LOQ calculation was performed with more digits
The recovery for CPI multi element solution (appropriately diluted) samples containing 500 µg Ti/L was 107 ± 5% (n = 4).
For further quality assurance, recalibration samples were analysed along with the samples and the mean accuracy was determined to 105 ± 3% (n = 4) for a Ti concentration of 500 µg/L.
For collecting validation information on the digestion procedure of samples as well as the analytical method several control worms were pooled and spiked with a weighed amount of TiO2 nanoparticles.
Accurately weighted 2698 µg TiO2 nanoparticles (P25, 1617 µg Ti) were given to exactly 2164.0 mg of homogenized and dried worms. This titanium amount represents 747 µg/g. Without spiking the Eisenia fetida material exhibited a mean titanium concentration of 44.9 ± 2.8 µg/g (n = 2). In conclusion the nominal value is calculated to 792 µg/L.
Spiked samples were digested and analysed along with actual samples, exhibiting a mean value of 685 ± 51 µg/L (n = 4), representing a mean recovery of 86.5 ± 6.5%. The quality requirements for the digestion and analysis of titanium in Eisenia fetida were set to 100 ± 25%, and were therefore fulfilled.
Analytical results In this chapter the measurement results of NM-101 in samples from Eisenia fetida are com-piled.
The measured values in µg/L are calculated to µg/g:
Amount of Ti in dry weight = measured value/[1000 / 15 (final volume in mL)]/weighted sam-ple (mg) *1000
Table 223 summarizes the measured titanium concentrations in the samples.

Raw data - Reproduction test with earthworms – TiO2 (chapter 7) 320
Table 223: NM-101: Ti concentration in earthworms.
Sample name Weighted sample [mg]
Measured value [µg/L]
Ti in dry weight [µg/g]
Mean Ti in dry weight ± SD [µg/g]
Control c - - - - Control d 185.9 670 54.1 54.1 10 mg/kg (food) a 210.1 647 46.2
49.7 ± 5.0 10 mg/kg (food) b 205.8 730 53.2 10 mg/kg (soil) a 196.7 424 32.3
28.9 ± 4.9 10 mg/kg (soil) b 191.4 324 25.4 20 mg/kg (food) a 204.8 581 42.5
45.1 ± 3.7 20 mg/kg (food) b 192.8 613 47.7 20 mg/kg (soil) a 203.1 477 35.2
38.1 ± 4.1 20 mg/kg (soil) b 190.8 522 41.0 50 mg/kg (food) d 202.3 900 66.7
59.4 ± 10.4 50 mg/kg (food) e 207.9 721 52.0 50 mg/kg (soil) d 207.2 904 65.4
70.8 ± 7.5 50 mg/kg (soil) e 190.7 968 76.1 100 mg/kg (food) d 200.9 903 67.4
66.2 ± 1.7 100 mg/kg (food) e 205.6 891 65.0 100 mg/kg (soil) d 206.4 851 61.8
53.1 ± 12.3 100 mg/kg (soil) e 210.3 623 44.5 200 mg/kg (food) d 204.7 1844 135
107 ± 40 200 mg/kg (food) e 197.4 1037 78.8 200 mg/kg (soil) d 203.6 797 58.7
52.7 ± 8.6 200 mg/kg (soil) e 190.7 592 46.6

Raw data - Reproduction test with earthworms – TiO2 (chapter 7) 321
Raw data examples Example for ICP-OES calibration: Calibration data from the measurement performed on July 14, 2011
Raw data - Reproduction test with earthworms – TiO2 (chapter 7) 322
Example for ICP-OES raw data printout: Example printout from the measurement performed on July 14, 2011

Raw data - Reproduction test with earthworms – TiO2 (chapter 7) 323
The information about the LOD/LOQ and correlation coefficient are compiled in
NM-103
Table 224.
Coefficient of determination (r) for respective calibration functions were taken from ICP-OES instrument outputs.
Table 224: NM-103 - Ti concentration in earthworms: LODs/LOQs, correlation.
Measurement date, descrip-tion
LOD [µg/L]
LOQ [µg/L]
Correlation coefficient r
July 28, 2011 measurements of samples from May 19th 18 60* 0.99990
June 09, 2011 measure-ments of control worms for fortification
18 54* 0.99941
* Internal LOQ calculation was performed with more digits
The recovery for CPI multi element solution (appropriately diluted) samples containing 500 µg Ti/L was 98.1 ± 1.2% (n = 3).
For further quality assurance, recalibration samples were analysed along with the samples and the mean accuracy was determined to 101 ± 2% (n = 3) for a Ti concentration of 500 µg/L.
For collecting validation information of the digestion procedure of samples as well as the analytical method several control worms were pooled and spiked with a weighed amount of TiO2 nanoparticles.
Therefore accurately weighted 2698 µg TiO2 nanoparticles (P25, 1617 µg Ti) were given to exactly 2164.0 mg of homogenized and dried worms. This titanium amount represents 747 µg/g. Without spiking the Eisenia fetida material exhibited a mean titanium concentration of 44.9 ± 2.8 µg/g (n = 2). In conclusion the nominal value is calculated to 792 µg/L.
Spiked samples were digested and analysed along with actual samples, exhibiting a mean value of 658 ± 60 µg/L (n = 4), representing a mean recovery of 83.0 ± 7.6%. The quality requirements for the digestion and analysis of titanium in Eisenia fetida were set to 100 ± 25%, and were therefore fulfilled.
Analytical results In this chapter the measurement results of NM-103 in samples from Eisenia fetida are com-piled. The titanium amounts in samples from three tests were quantified.
The measured values in µg/L are calculated to µg/g:
Amount of Ti in dry weight = measured value/[1000 / 15 (final volume in mL)]/weighted sam-ple (mg) *1000.
Table 225 summarizes the measured titanium concentrations in the samples.

Raw data - Reproduction test with earthworms – TiO2 (chapter 7) 324
Table 225: NM-103: Ti concentration in earthworms.
Sample name Weighted sample [mg]
Measured value [µg/L]
Ti in dry weight [µg/g]
Mean Ti in dry weight ± SD [µg/g]
Control a 202.8 285 21.1 22.6 ± 2.2
Control b 201.9 325 24.1 10 mg/kg (soil) a 202.6 949 70.3
55.3 ± 21.1 10 mg/kg (soil) b 200.9 541 40.4 10 mg/kg (food) a 203.7 519 38.2
33.8 ± 6.3 10 mg/kg (food) b 202.5 396 29.3 20 mg/kg (soil) c 202.2 391 29.0
30.1 ± 1.5 20 mg/kg (soil) d 202.0 420 31.2 20 mg/kg (food) c 202.4 498 36.9
43.6 ± 9.6 20 mg/kg (food) d 201.8 678 50.4 50 mg/kg (soil) c 202.2 401 29.7
30.8 ± 1.5 50 mg/kg (soil) d 203.2 432 31.9 50 mg/kg (food) c 203.8 350 25.8
23.6 ± 3.0 50 mg/kg (food) d 201.7 289 21.5 100 mg/kg (soil) c 202.1 454 33.7
32.9 ± 1.1 100 mg/kg (soil) d 203.4 436 32.2 100 mg/kg (food) c 202.1 724 53.7
56.1± 3.4 100 mg/kg (food) d 202.2 789 58.5 200 mg/kg (soil) c 201.9 397 29.5
31.1 ± 2.3 200 mg/kg (soil) d 201.3 439 32.7 200 mg/kg (food) c 202.9 861 63.6
62.9 ± 1.0 200 mg/kg (food) d 202.6 840 62.2

Raw data - Reproduction test with earthworms – TiO2 (chapter 7) 325
Raw data examples Example for ICP-OES calibration: Calibration data from the measurement performed on July 28, 2011
standards se-
lected for work-
ing range are

Raw data - Reproduction test with earthworms – TiO2 (chapter 7) 326
Example for ICP-OES raw data printout: Example printout from the measurement performed on July 28, 2011

Raw data - Reproduction test with earthworms – Ag (chapter 8) 327
21.3 Raw data – Reproduction test with earthworms – Ag (chapter 8)
21.3.1 Chemical analysis
Silver concentration in earthworms
The information about the LOD/LOQ and correlation coefficient are compiled in Table 226.
Coefficients of determination (r) for respective calibration functions were taken from ICP-OES instrument outputs.
Table 226: NM-300K - Ag concentration in earthworms: LODs/LOQs, correlation.
Measurement date, descrip-tion
LOD [µg/L]
LOQ [µg/L]
Correlation coefficient r
August 26, 2011 2.6 8.8* 0.99995
* Internal LOQ calculation was performed with more digits
The certified reference material TMDA-70 (certified with 10.9 µg/L Ag) was analysed as qual-ity assurance sample with solution samples from the test. According to the quality assurance requirement the silver recovery was in the range of ± 15% of the certified value. However, regarding Ag concentrations measured by ICP-OES, the mean recovery (accuracy) and pre-cision of the non-digested CRM TMDA-70 measurements were 109 ± 10% (n = 4).
The recovery for Merck IV solution samples containing 50 µg Ag/L was 104 ± 5% (n = 2).
For further quality assurance, recalibration samples were analysed along with the samples and the mean accuracy was determined to 101 ± 2% (n = 2) for an Ag concentration of 50 µg/L.
For collecting validation information of the digestion procedure of samples as well as the analytical method, the mean recovery of silver in the reference material NIST 2977 Mussel Tissue was determined to 73.5 ± 6.4% (n =3), although only a reference value is given in the certificate.
The amount of silver in dispersion in NM300K provided by the producer ´Rent a Scientist´ is determined by UV-VIS measurements without prior digestion. Because a certified standard solution containing nano-Ag is not available yet, the calibration used for this method is per-formed with a silver standard. The quantification of total silver after total digestion may differ because the amount which was provided by the producer was measured there without ma-trix-adjusted calibration.
The measured values in µg/L are calculated to µg/g:
Amount of Ag in dry weight = measured value * weighed volume/weighted * 1.089
1.089 corresponds to the density of the nitric acid after digestion and filled up to 20 mL.

Raw data - Reproduction test with earthworms – Ag (chapter 8) 328
Analytical results Table 227 summarizes the measured silver concentrations in the samples.
Table 227: NM-300K: Ag concentration in earthworms.
Sample name Weighted sample [mg]
Brought to mass of [g]
Measured value [µg/L]
Ag in dry weight [µg/g]
Mean Ag in dry weight ± SD [µg/g]
Control a 203.5 21.426 -0.9251 -0.11 Control b 201.9 21.207 -2.265 -0.26 Vehicle (food) a 203.0 21.263 1.487 0.17 Vehicle (food) b 203.4 21.302 -0.9253 -0.11 Vehicle (soil) a 202.0 21.338 -0.2231 -0.03 Vehicle (soil) b 201.6 21.289 -3.034 -0.35 15 mg/kg (food) a 201.8 21.336 79.8 9.19
9.54 ± 0.50 15 mg/kg (food) b 204.7 21.301 87.3 9.90 15 mg/kg (soil) a 204.8 21.276 61.8 6.99
6.99 ± <0.01 15 mg/kg (soil) b 203.0 21.315 61.2 6.99 30 mg/kg (food) a 202.0 21.300 90.2 10.4
10.6 ± 0.4 30 mg/kg (food) b 201.9 21.324 94.8 10.9 30 mg/kg (soil) a 202.0 21.294 89.0 10.2
10.5 ± 0.4 30 mg/kg (soil) b 201.5 21.233 94.3 10.8 60 mg/kg (food) a 204.7 21.315 109 12.3
11.7 ± 0.9 60 mg/kg (food) b 204.7 21.351 97.2 11.0 60 mg/kg (soil) a 204.8 21.277 96.8 10.9
11.1 ± 0.2 60 mg/kg (soil) b 202.0 21.283 97.8 11.2 120 mg/kg (food) a 203.4 21.263 97.4 11.1
11.3 ± 0.3 120 mg/kg (food) b 202.1 21.300 100 11.5 120 mg/kg (soil) a 201.8 21.252 101 11.6
11.3 ± 0.4 120 mg/kg (soil) b 201.3 21.266 95.3 11.0 200 mg/kg (food) a 201.9 21.247 117 13.4
13.2 ± 0.2 200 mg/kg (food) b 202.1 21.211 115 13.1 200 mg/kg (soil) a 201.4 21.284 97.9 11.3
11.2 ± 0.1 200 mg/kg (soil) b 202.5 21.340 96.5 11.1

Raw data - Reproduction test with earthworms – Ag (chapter 8) 329
Raw data examples Example for ICP-OES calibration: Calibration data from the measurement performed on Au-gust 26, 2011
Raw data - Reproduction test with earthworms – Ag (chapter 8) 330
Example for ICP-OES raw data printout: Example printout from the measurement performed on August 26, 2011

Raw data - Reproduction test with earthworms – Ag (chapter 8) 331
Table 228: NM-300K: measured silver concentration in DGT extracts and calculated estimated average Ag concentration in matrix - day 0.
Sample ID
Measured extract Ni Concen-tration (µg/L)
Extract volume (L)
Mass extracted (µg)
Extraction factor
Calculated mass in DGT section (µg)
Deploy-ment time (h)
DGT area sampled (cm2)
Metal ion flux µg/cm2
DGT boundary thickness (cm)
Metal diffu-sion coeffi-cient (cm2/sec)
Average water Ag concentration (mg/L)
Ag µg/L
Day 0
Control A 10.06 0.005 0.015 0.00007 0.93 0.00008 48 3.142 1.4776E-10 0.094 1.23E-05 0.0000011 0.001 Control B 10.06 0.010 0.015 0.00015 0.93 0.00016 48 3.142 3.0004E-10 0.094 1.23E-05 0.0000023 0.002 Ag15mg A 10.06 0.758 0.015 0.01137 0.93 0.01223 48 3.142 2.2518E-08 0.094 1.23E-05 0.0001723 0.172 Ag15mg B 10.06 1.271 0.015 0.01907 0.93 0.02050 48 3.142 3.7758E-08 0.094 1.23E-05 0.0002889 0.289 Ag60mg A 10.06 0.690 0.015 0.01036 0.93 0.01114 48 3.142 2.051E-08 0.094 1.23E-05 0.0001569 0.157 Ag60mg B 10.06 0.787 0.015 0.01181 0.93 0.01270 48 3.142 2.3391E-08 0.094 1.23E-05 0.0001790 0.179 Ag120mg A 10.06 1.048 0.015 0.01572 0.93 0.01690 48 3.142 3.1133E-08 0.094 1.23E-05 0.0002382 0.238 Ag120mg B 10.06 23.570 0.015 0.35355 0.93 0.38016 48 3.142 7.0019E-07 0.094 1.23E-05 0.0053577 5.358 1 Ag200mg A 10.06 1.183 0.015 0.01775 0.93 0.01908 48 3.142 3.5143E-08 0.094 1.23E-05 0.0002689 0.269 Ag200mg B 10.06 1.208 0.015 0.01812 0.93 0.01948 48 3.142 3.5886E-08 0.094 1.23E-05 0.0002746 0.275

Raw data - Reproduction test with earthworms – Ag (chapter 8) 332
Table 229: NM-300K: measured silver concentration in DGT extracts and calculated estimated average Ag concentration in matrix – day 28.
Sample ID
Measured extract Ni Concen-tration (µg/L)
Extract volume (L)
Mass extracted (µg)
Extraction factor
Calculated mass in DGT section (µg)
Deploy-ment time (h)
DGT area sampled (cm2)
Metal ion flux µg/cm2
DGT boundary thickness (cm)
Metal diffu-sion coeffi-cient (cm2/sec)
Average water Ag concentration (mg/L)
Ag µg/L
Day 28 Control A 10.07 0.027 0.015 0.00041 0.93 0.00044 48 3.142 8.0862E-10 0.094 1.23E-05 0.0000062 0.006 Control B 10.07 0.016 0.015 0.00024 0.93 0.00026 48 3.142 4.8452E-10 0.094 1.23E-05 0.0000037 0.004 Ag15mg A 10.07 0.982 0.015 0.01472 0.93 0.01583 48 3.142 2.9157E-08 0.094 1.23E-05 0.0002231 0.223 Ag15mg B 10.07 0.608 0.015 0.00912 0.93 0.00981 48 3.142 1.8062E-08 0.094 1.23E-05 0.0001382 0.138 Ag60mg A 10.07 1.081 0.015 0.01622 0.93 0.01744 48 3.142 3.2113E-08 0.094 1.23E-05 0.0002457 0.246 Ag60mg B 10.07 0.882 0.015 0.01322 0.93 0.01422 48 3.142 2.619E-08 0.094 1.23E-05 0.0002004 0.200 Ag120mg A 10.07 1.330 0.015 0.01995 0.93 0.02145 48 3.142 3.951E-08 0.094 1.23E-05 0.0003023 0.302 Ag120mg B 10.07 1.920 0.015 0.0288 0.93 0.03097 48 3.142 5.7037E-08 0.094 1.23E-05 0.0004364 0.436 Ag200mg A 10.07 1.782 0.015 0.02673 0.93 0.02874 48 3.142 5.2938E-08 0.094 1.23E-05 0.0004051 0.405 Ag200mg B 10.07 1.502 0.015 0.02253 0.93 0.02423 48 3.142 4.462E-08 0.094 1.23E-05 0.0003414 0.341
1 Not considered for the assessment; technical defect of the DGT

Raw data - Reproduction test with earthworms – Ag (chapter 8) 333
Table 230: NM-300K: measured silver concentration in DGT extracts and calculated estimated average Ag concentration in matrix - day 56.
Sample ID
Measured Extract Ni Concen-tration (µg/L)
Extract volume (L)
Mass Extracted (µg)
Extraction Factor
Calculated Mass in DGT section (µg)
Deploy-ment Time (h)
DGT area sampled (cm2)
Metal Ion Flux µg/cm2
DGT Boundary Thickness (cm)
Metal Dif-fusion Coefficient (cm2/sec)
Average water Ag concentration (mg/L)
Ag µg/L
Day 56 Control A 0.0210 0.015 0.00031 0.93 0.00034 48 3.142 6.2374E-10 0.094 1.23E-05 0.0000048 0.005 Control B 0.0198 0.015 0.0003 0.93 0.00032 48 3.142 5.8961E-10 0.094 1.23E-05 0.0000045 0.005 15mg A 0.6131 0.015 0.0092 0.93 0.00989 48 3.142 1.8212E-08 0.094 1.23E-05 0.0001394 0.139 15mg B 1.6200 0.015 0.0243 0.93 0.02613 48 3.142 4.8126E-08 0.094 1.23E-05 0.0003683 0.368 60mg A 1.2878 0.015 0.01932 0.93 0.02077 48 3.142 3.8258E-08 0.094 1.23E-05 0.0002927 0.293 60mg B 0.8755 0.015 0.01313 0.93 0.01412 48 3.142 2.6008E-08 0.094 1.23E-05 0.0001990 0.199 120mg A 2.7636 0.015 0.04145 0.93 0.04457 48 3.142 8.2098E-08 0.094 1.23E-05 0.0006282 0.628 120mg B 2.3846 0.015 0.03577 0.93 0.03846 48 3.142 7.084E-08 0.094 1.23E-05 0.0005421 0.542 200mg A 1.4711 0.015 0.02207 0.93 0.02373 48 3.142 4.3703E-08 0.094 1.23E-05 0.0003344 0.334 200mg B 1.5578 0.015 0.02337 0.93 0.02513 48 3.142 4.6277E-08 0.094 1.23E-05 0.0003541 0.354
The calculations were performed according to the Technical documentation on http://www.dgtresearch.com and references cited within. The following arithmetic statements were applied: 1. Extracted mass [µg] = measured extract Ag conc. [µg/L] *extract volume [L] 2. Extraction factor = 0.93 according to literature mentioned above 3. Calculated mass in DGT section [µg] = extracted mass [µg] / extraction factor 4. Metal ion flux [µg/s*cm2] = calculated mass in DGT section [µg] / deployment time [s] * sampled DGT area [cm2] 5. Estimated average Ag conc. in matrix [mg/L] = metal ion flux [µg/s*cm2] *DGT boundary thickness [cm] / metal diffusion coefficient [cm2 / s] 6. Estimated average Ag conc. in matrix [µg/L] = estimated average Ag conc. in matrix [mg/L] * 1000

Raw data - Reproduction test with earthworms – Ag (chapter 8) 334
21.3.2 Ecotoxicological test
Table 231: NM-300K – earthworm test: living worms after 28 days. Single values of the parallel test pots [Individuals]
Replicate No. 1 2 3 4 5 6 7 8
Control 10 10 10 10 10 10 10 10
Control with dispersant on feed 10 10 10 10 - - - -
Control with dispersant on soil 10 10 10 10 - - - -
Application on feed
15 mg/kg 10 10 10 10 - - - -
30 mg/kg 10 10 10 10 - - - -
60 mg/kg 10 10 10 10 - - - -
120 mg/kg 10 10 10 10 - - - -
200 mg/kg 10 10 9 10 - - - -
Application on soil
15 mg/kg 10 10 10 10 - - - -
30 mg/kg 10 10 10 10 - - - -
60 mg/kg 10 10 10 10 - - - -
120 mg/kg 10 10 10 10 - - - -
200 mg/kg 10 10 10 10 - - - -
Table 232: NM-300K – earthworm test: biomass of the worm batches at test start. Single values of the replicate test pots
Replicate No. 1 2 3 4 5 6 7 8
Control 3.57 3.85 3.87 3.43 3.52 3.60 3.35 3.39
Control with dispersant on feed 3.38 3.54 4.14 4.03 - - - -
Control with dispersant on soil 3.58 3.31 4.11 3.94 - - - -
Application on feed
15 mg/kg 3.65 3.63 3.83 3.79 - - - -
30 mg/kg 3.90 3.43 3.67 3.42 - - - -
60 mg/kg 4.19 3.71 3.94 3.26 - - - -
120 mg/kg 3.64 3.49 3.96 3.41 - - - -
200 mg/kg 3.32 3.42 3.61 3.44 - - - -
Application on soil
15 mg/kg 3.14 3.31 3.12 3.38 - - - -
30 mg/kg 3.39 3.32 3.39 3.22 - - - -
60 mg/kg 3.35 3.86 3.46 3.44 - - - -
120 mg/kg 3.42 3.46 3.18 3.52 - - - -
200 mg/kg 3.46 3.59 3.55 3.28 - - - -

Raw data - Reproduction test with earthworms – Ag (chapter 8) 335
Table 233: NM-300K – earthworm test: biomass of the worm batches after 28 days. Single values of the replicate test pots
Replicate No. 1 2 3 4 5 6 7 8
Control 4.83 5.02 5.06 4.87 4.94 5.29 4.80 5.12
Control with dispersant on feed 4.85 5.03 5.78 5.76 - - - -
Control with dispersant on soil 4.73 4.65 5.96 4.95 - - - -
Application on feed
15 mg/kg 5.77 5.17 5.99 5.66 - - - -
30 mg/kg 5.57 5.16 5.46 5.11 - - - -
60 mg/kg 6.05 5.64 5.60 4.70 - - - -
120 mg/kg 4.92 4.13 4.46 4.69 - - - -
200 mg/kg 4.36 4.40 4.54 4.32 - - - -
Application on soil
15 mg/kg 4.90 5.15 5.96 4.94 - - - -
30 mg/kg 4.67 5.72 5.37 5.73 - - - -
60 mg/kg 5.71 5.79 5.52 5.70 - - - -
120 mg/kg 5.52 5.86 5.47 5.78 - - - -
200 mg/kg 5.43 6.14 5.73 5.25 - - - -
Table 234: NM-300K – earthworm test: number of offspring at day 56.
Replicate No. 1 2 3 4 5 6 7 8
Control 355 341 316 319 371 382 312 335
Control with dispersant on feed 261 254 266 281 - - - -
Control with dispersant on soil 264 206 310 292 - - - -
Application on feed
15 mg/kg 281 328 281 329 - - - -
30 mg/kg 279 232 230 274 - - - -
60 mg/kg 206 233 239 204 - - - -
120 mg/kg 119 64 82 179 - - - -
200 mg/kg 100 81 89 97 - - - -
Application on soil
15 mg/kg 296 247 236 227 - - - -
30 mg/kg 145 209 254 227 - - - -
60 mg/kg 202 222 193 261 - - - -
120 mg/kg 161 157 179 135 - - - -
200 mg/kg 129 73 106 78 - - - -

Raw data - Reproduction test with earthworms – Ag (chapter 8) 336
Table 235: NM-300K – earthworm test: soil dry mass content [%]. Single values of the replicate test pots [%]; concentrations given as nominal values [mg/kg]
Application on feed Application on soil
Con-trol
Control with dispers-ant on feed
Control with dis-persant on soil
15 30 60 120 200 15 30 60 120 200
Test start 88.3 88.6 88.7 88.7 88.9 88.5 88.5 89.1 89.5 88.7 89.3 89.2 89.4
Test end 78.3 79.6 79.6 81.4 79.6 79.5 79.2 78.8 80.2 79.5 79.4 79.4 78.5
Table 236: NM-300K – earthworm test: soil moisture [% WHC]. Single values of the replicate test pots; since WHC is affected by feed adding, no calculation for test end can be applied; concentrations given as nominal values [mg/kg]
Application on feed Application on soil
Con-trol
Control with dispers-ant on feed
Control with dis-persant on soil
15 30 60 120 200 15 30 60 120 200
Test start 58.6 56.7 56.3 55.9 54.9 57.1 57.5 53.7 51.6 56.1 53.0 53.1 52.0
Table 237: NM-300K – earthworm test: soil pH. Single values of the parallel test pots; concentrations given as nominal values [mg/kg]
Application on feed Application on soil
Control
Control with disper-sant
15 30 60 120 200 15 30 60 120 200
Test start 5.0 4.9 5.0 5.0 4.9 4.9 5.0 5.0 5.0 5.0 5.0 5.1
Test end 6.8 6.8 6.8 7.0 7.1 6.9 6.8 7.0 7.1 7.0 7.0 6.8

Raw data – Test with plants (chapter 11) 337
21.4 Raw data - Test with plants (chapter 11)
Table 238: P25 – Test with plants: pathological symptoms [plants].
Application via powder [mg TiO2/kg] Application via dispersion [mg TiO2/kg]
Test species Replicate Control 10 20 30 44 67 100 10 20
Avena sativa
- 1 - - - - - - - - -
- - - - - - - - - -
- - - - - - - - - -
- - - - - - - - - -
Phaseolus aureus
- - - - - - - - - -
- - - - - - - - - -
- - - - - - - - - -
- - - - - - - - - -
Sinapis alba
- - - - - - - - - -
- - - - - - - - - -
- - - - - - - - - -
- - - - - - - - - - 1 - = no visual symptom
Table 239: P25 – Test with plants: emergence at test end [number of plants]. Single values of the replicate test pots
Application via powder [mg TiO2/kg] Application via dispersion [mg TiO2/kg]
Test species Replicate Control 10 20 30 44 67 100 10 20
Avena sativa
1 5 5 5 5 5 4 3 4 4
2 5 5 5 5 4 4 4 4 5
3 5 4 4 4 5 4 4 5 5
4 5 5 5 4 4 4 5 5 5
Phaseolus aureus
1 5 5 5 5 5 4 5 5 5
2 5 5 5 5 5 5 5 5 5
3 5 5 5 5 5 5 5 5 5
4 5 5 5 5 5 5 5 5 5
Sinapis alba
1 5 4 3 4 4 2 4 2 5
2 5 5 5 5 3 4 5 4 4
3 5 5 4 4 5 4 5 5 5
4 4 4 4 4 5 5 5 3 5

Raw data – Test with plants (chapter 11) 338
Table 240: P25 – Test with plants: fresh mass per plant [g]. Single values of the parallel test pots [g]
Application via powder [mg TiO2/kg] Application via dispersion [mg TiO2/kg]
Test species Replicate Control 10 20 30 44 67 100 10 20
Avena sativa
1 2.966 2.627 2.467 2.972 2.633 2.103 1.522 1.915 1.885
2 2.401 3.15 2.461 2.82 2.037 2.474 1.79 2.002 2.619
3 2.657 1.961 2.115 2.325 2.691 2.144 1.99 2.313 2.578
4 2.338 2.547 2.799 2.152 2.166 2.078 1.909 2.288 2.062
Phaseolus aureus
1 3.824 3.411 3.282 3.799 3.630 2.826 2.511 3.415 3.084
2 3.865 3.684 3.963 3.628 4.106 3.036 3.550 4.114 3.424
3 3.753 3.388 3.514 4.473 3.264 3.115 3.298 3.206 3.616
4 3.961 3.299 3.130 3.577 3.695 3.705 3.150 3.385 2.960
Sinapis alba
1 2.101 2.804 1.688 2.388 2.365 1.437 2.076 1.220 2.358
2 2.053 2.212 2.903 2.129 1.499 1.555 1.716 1.698 1.770
3 3.165 2.153 2.221 1.264 2.603 2.398 1.927 1.959 1.968
4 2.324 1.854 1.968 2.076 2.506 3.306 2.218 0.918 2.065

Raw data – Test with plants (chapter 11) 339
Table 241: P25 – Test with plants: root length - Avena sativa [cm].
Replicate Number of plants
Length of main root biomass
Maximum and minimum length of roots different to main root biomass Remark
Con
trol
I 5 6.8 12.0 – 21.5 -
II 5 7.6 9.6 – 20.4 -
III 5 7.5 11.2 – 16.6 -
IV 5 7.0 16.6 – 19.5 -
App
licat
ion
via
pow
der:
10
mg/
kg
I 5 7.7 14.5 – 21.2 -
II 5 8.0 12.8 – 29.4 -
III 4 8.4 14.0 – 23.4 -
IV 5 7.1 14.8 – 20.4 -
App
licat
ion
via
pow
der:
20
mg/
kg
I 5 6.2 11.4 – 19.6 -
II 5 7.2 13.6 – 27.1 -
III 4 7.2 12.6 – 23.4 -
IV 5 6.5 15.0 – 19.2 -
App
licat
ion
via
pow
der:
30
mg/
kg
I 5 7.4 15.7 – 27.2 -
II 5 7.5 13.0 – 23.1 -
III 4 7.4 17.0 – 21.7 -
IV 4 7.8 9.4 – 25.2 -
App
licat
ion
via
pow
der:
44
mg/
kg
I 5 6.6 10.9 – 24.4 -
II 4 7.1 13.1 – 19.2 -
III 5 7.6 16.8 – 22.5 -
IV 4 6.5 16.6 – 22.2 -
App
licat
ion
via
pow
der:
63
mg/
kg
I 4 6.4 14.4 – 17.9 -
II 4 7.0 16.7 – 25.2 -
III 4 6.7 13.1 – 23.7 -
IV 4 7.6 17.2 – 22.4 -
App
licat
ion
via
pow
der:
100
mg/
kg
I 3 8.0 22.2 – 32.2 -
II 4 7.2 10.9 – 26.4 -
III 4 8.0 14.4 – 21.3 -
IV 5 7.9 12.7 – 16.8 -
App
licat
ion
via
disp
ersi
on: 1
0 m
g/kg
I 4 8.0 15.1 – 19.4 -
II 4 7.6 16.4 – 23.5 -
III 5 6.9 10.8 – 23.8 -
IV 5 7.0 10.8 – 23.4 -
App
licat
ion
via
disp
ersi
on: 2
0 m
g/kg
I 4 7.4 8.4 – 18.7 -
II 5 6.9 9.7 – 22.1 -
III 5 6.5 7.4 – 25.6 -
IV 5 7.8 12.6 – 25.3 -

Raw data – Test with plants (chapter 11) 340
Table 242: P25 – Test with plants: root length - Sinapis alba [cm].
Replicate Number of plants
Length of main root biomass
Maximum and minimum length of roots different to main root biomass Remark
Con
trol
I 5 3.4 4.6 – 10.4 -
II 5 3.2 5.7 – 11.9 -
III 5 6.7 8.4 – 13.6 -
IV 4 6.4 11.4 – 14.6 -
App
licat
ion
via
pow
der:
10
mg/
kg
I 4 5.7 8.6 – 15.2 -
II 5 4.7 5.0 – 9.3 -
III 5 4.9 6.0 – 14.2 -
IV 4 4.9 5.4 – 10.2 -
App
licat
ion
via
pow
der:
20
mg/
kg
I 3 5.2 7.7 – 14.4 -
II 5 5.0 7.5 – 13.4 -
III 4 3.2 5.2 – 7.9 -
IV 4 4.5 4.7 – 12.6 -
App
licat
ion
via
pow
der:
30
mg/
kg
I 4 4.6 6.6 – 12.1 -
II 5 3.7 5.7 – 16.8 -
III 4 3.5 11.9 – 15.9 -
IV 4 3.4 4.4 – 14.6 -
App
licat
ion
via
pow
der:
44
mg/
kg
I 4 3.7 5.2- 9.4 -
II 3 3.9 5.4 – 11.4 -
III 5 4.1 3.6 – 9.4 -
IV 5 3.4 7.0 – 9.3 -
App
licat
ion
via
pow
der:
63
mg/
kg
I 2 3.9 4.1 – 6.7 -
II 4 3.6 4.2 – 7.1 -
III 4 4.1 5.2 – 15.1 -
IV 5 3.8 4.4 – 11.4 -
App
licat
ion
via
pow
der:
100
mg/
kg
I 4 4.6 6.1 – 10.1 -
II 5 4.5 5.9 – 12.2 -
III 5 4.2 1.6 – 15.2 -
IV 5 3.9 3.5 – 8.9 -
App
licat
ion
via
disp
ersi
on: 1
0 m
g/kg
I 2 4.2 10.1 – 14.7 -
II 4 4.9 6.1 – 10.1 -
III 5 4.0 0.9 – 8.4 -
IV 3 4.1 4.4 – 13.2 -
App
licat
ion
via
disp
ersi
on: 2
0 m
g/kg
I 5 4.5 6.7 – 12.2 -
II 4 4.5 5.2 – 9.6 -
III 5 4.5 6.4 – 11.2 -
IV 5 3.9 4.6 – 7.2 -

Raw data – Test with plants (chapter 11) 341
Table 243: P25 – Test with plants: root length - Phaseolus aureus [cm].
Replicate Number of plants
Length of main root biomass
Maximum and minimum length of roots different to main root biomass Remark
Con
trol
I 5 11.0 13.0 – 18.0 -
II 5 13.0 3.0 – 9.0 -
III 5 11.5 4.0 – 10.0 -
IV 5 12.5 15.0 – 19.0 -
App
licat
ion
via
pow
der:
10
mg/
kg
I 5 10.5 12.5 – 22.0 -
II 5 11.0 14.0 – 21.0 -
III 5 10.0 13.0 – 22.0 -
IV 5 12.0 15.5 – 21.0 -
App
licat
ion
via
pow
der:
20
mg/
kg
I 5 9.5 14.0 – 21.0 -
II 5 10.0 13.5 – 21.0 -
III 5 12.0 11.5 – 19.0 -
IV 5 11.0 14.0 – 21.0 -
App
licat
ion
via
pow
der:
30
mg/
kg
I 5 10.0 13.0 – 17.0 -
II 5 11.0 11.0 – 27.0 -
III 5 13.0 13.0 – 22.0 -
IV 5 10.5 14.5 -21.0 -
App
licat
ion
via
pow
der:
44
mg/
kg
I 5 9.5 12.0 – 20.0 -
II 5 10.5 13.0 – 21.0 -
III 5 10.5 16.0 – 23.0 -
IV 5 10.5 11.0 – 19.0 -
App
licat
ion
via
pow
der:
63
mg/
kg
I 5 9.5 15.0 – 22.0 -
II 5 10.5 11.0 – 17.0 -
III 5 10.0 18.0 – 22.0 -
IV 5 10.0 16.5 – 22.0 -
App
licat
ion
via
pow
der:
100
mg/
kg
I 4 12.0 14.0 – 18.0 -
II 5 10.5 15.5 – 22.0 -
III 5 11.5 14.5 – 22.0 -
IV 5 10.0 15.0 – 22.0 -
App
licat
ion
via
disp
ersi
on: 1
0 m
g/kg
I 5 10.0 11.0 – 19.0 -
II 5 10.5 11.0 – 22.0 -
III 5 10.0 16.0 – 19.0 -
IV 5 10.5 11.0 – 17.5 -
App
licat
ion
via
disp
ersi
on: 2
0 m
g/kg
I 5 10.5 15.0 – 23.0 -
II 5 9.5 12.0 – 16.5 -
III 5 10.0 14.0 – 25.0 -
IV 5 9.5 15.0 – 19.0 -

Raw data - Test with chironomids: emergence - TiO2 (chapter 12) 342
21.5 Raw data – Emergence test with chironomids – TiO2 (chapter 12)
21.5.1 P25
Table 244: P25 – Chironomid test: quality control/validation of chemical analyses.
Sample description Ti [µg/L] - measured
Ti [µg/L] - nominal
Recovery [%]
Samples of day 0 and day 1 Positive control (aqueous samples with P25) 3.2 mg TiO2/100mL 20197 19177.6 105
3.2 mg TiO2/100mL 20223 19177.6 105 2.6 mg TiO2/100mL 15300 15581.8 98.2 2.6 mg TiO2/100mL 14477 15581.8 92.9 2.6 mg TiO2/100mL 14587 15581.8 93.6 2.6 mg TiO2/100mL 14545 15581.8 93.3 Reference standard CPI Ti 500 µg/L 504.4 500 101 Ti 500 µg/L 505.57 500 101 Ti 500 µg/L 505.23 500 101 Ti 500 µg/L 506.57 500 101 Recalibration standard (commer-cially available Ti standard with soluble Ti)
Ti 500 µg/L 501.03 500 100
Ti 500 µg/L 507.1 500 101 Samples of day 7 Positive control (aqueous samples with P25) 208 mg TiO2/L 128900 125140 103
208 mg TiO2/L 127850 125140 102 26 mg TiO2/L 18385 15582 118 26 mg TiO2/L 18030 15582 116 Reference standard CPI Ti 25 µg/L 24.2 25 96.9 Ti 25 µg/L 24.8 25 99.1 Reference standard (commercially available Ti standard with soluble Ti)
25 µg/L 24.5 25 98.1
25 µg/L 24.1 25 96.4 Samples of day 7 and day 14 Positive control (aqueous samples with P25) 208 mg TiO2/L 127575 125140 102
208 mg TiO2/L 128400 125140 103 26 mg TiO2/L 13605 15581.8 87.3 26 mg TiO2/L 12975 15581.8 83.3 Reference standard CPI Ti 25 µg/L 25.8 25 103 Ti 25 µg/L 25.4 25 101 Reference standard (commercially available Ti standard with soluble Ti)
Ti 25 µg/L 26.6 25 106
Ti 25 µg/L 25.3 25 101
Continued

Raw data - Test with chironomids: emergence - TiO2 (chapter 12) 343
Table 244: P25 – Chironomid test: quality control/validation of chemical analyses. (continued)
Samples of day 28 Positive control (aqueous samples with P25) 208 mg TiO2/L 122650 125140 98.0
208 mg TiO2/L 123050 125140 98.3 26 mg TiO2/L 16455 15582 106 26 mg TiO2/L 16270 15582 104 Reference standard CPI Ti 25 µg/L 22.8 25 91.2 Ti 25 µg/L 23.9 25 95.5 Reference standard (commercially available Ti standard with soluble Ti)
Ti 25 µg/L 24.0 25 96.0
Ti 25 µg/L 24.8 25 99.1
Raw data - Test with chironomids: emergence - TiO2 (chapter 12) 344
Table 245: P25 – Chironomid test: physico-chemical test parameters. Water hardness (TH): 1 mmol corresponds to 100 mg CaCo3 equiv.
Test start Test end O2
% Temp °C
pH TH mmol/l
NH4
mg/L Light lux
O2
% Temp °C
pH TH mmol/l
NH4
mg/L Light lux
Con
trol
1 99.5
20.3
8.19 1.1 0.9
748-850
93.6
20.3
8.08 1.0 8.0
749-798
2 99.3 8.20 1.1 0.9 97.8 8.26 1.0 10.8 3 96.5 8.12 1.3 1.0 94.2 8.22 1.2 10.0 4 96.8 8.04 1.3 0.8 88.3 8.15 1.1 10.0
15 m
g/L
1 97.2 7.93 103.8 8.39 2 99.3 8.16 96.8 8.28 3 97.1 8.15 102 8.36 4 95.8 8.12 99.9 8.34
24 m
g/L
1 97.1 7.90 100.4 8.41 2 98.2 8.07 100.3 8.34 3 99.3 8.27 100.1 8.29 4 95.2 8.04 99.9 8.33
39 m
g/L
1 99.1 8.20 100.1 8.36 2 97.5 8.16 96.4 8.32 3 99.0 8.24 100.1 8.35 4 99.4 8.15 100.2 8.37
63 m
g/L
1 96.0 7.93 97.1 8.27 2 95.7 7.99 100.3 8.36 3 98.6 8.08 98.7 8.25 4 100.0 8.15 99.6 8.35
100
mg/
L
1 96.6 8.05 1.5 0.2 101.1 8.36 1.3 9.2 2 99.9 8.12 99.4 8.33 3 97.5 8.08 68.1 8.28 4 100.4 8.05 96.6 8.32
Con
trol w
ith
nettl
e
1 99.1 8.01 1.2 0.6 104.4 8.65 2.1 10.8 2 91.1 7.98 103.5 8.65 3 100.8 8.02 97.2 8.41 4 99.4 8.08 96 8.44
Con
trol w
ith
nettl
e +
10
0 m
g/L
1 89.4 8.02 101.4 8.64 2 92.9 8.02 104.1 8.70 2.2 8.8 3 92.3 8.05 103.8 8.66 4 87.1 7.97 94.5 8.41
Ves
sels
use
d fo
r ch
emic
al a
naly
sis
K 98.2 7.75 98.7 8.22 1 99.0 7.94 97.5 8.05 2 98.2 7.99 100.8 8.21 3 99.4 8.26 100.2 8.45 4 99.6 8.26 95.4 8.24 5 99.2 8.32 85.8 8.16
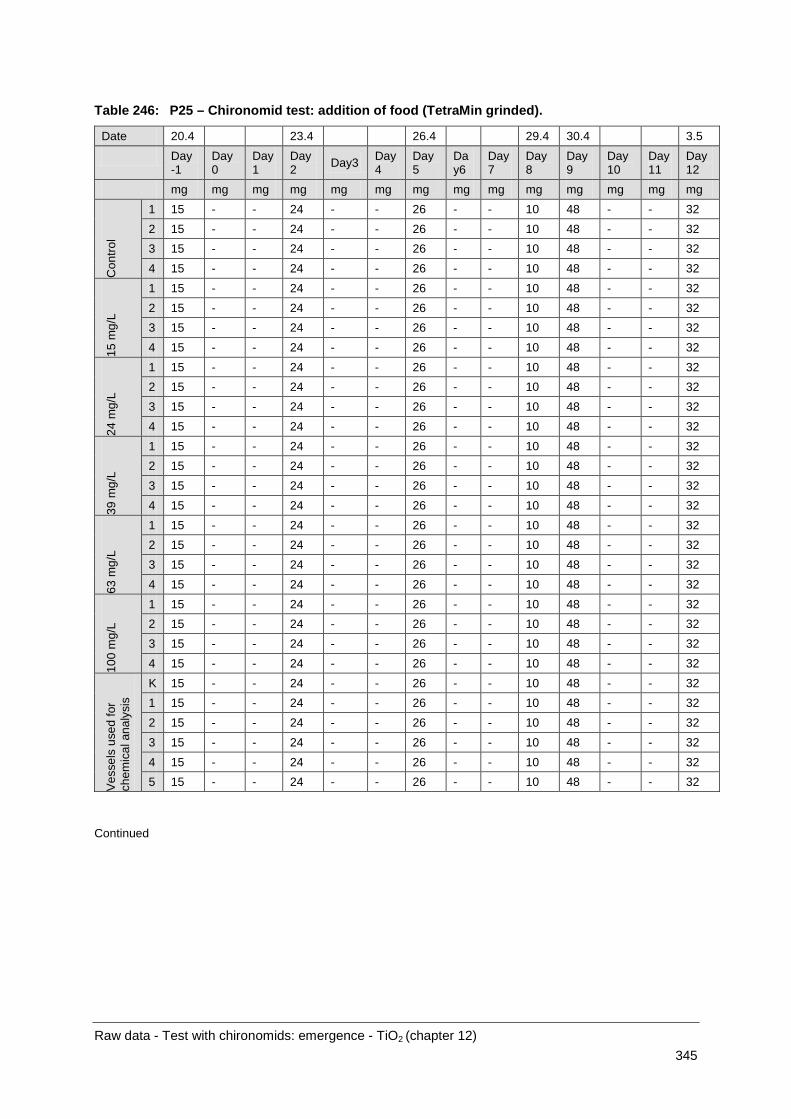
Raw data - Test with chironomids: emergence - TiO2 (chapter 12) 345
Table 246: P25 – Chironomid test: addition of food (TetraMin grinded).
Date 20.4 23.4 26.4 29.4 30.4 3.5 Day
-1 Day0
Day1
Day2 Day3 Day
4 Day5
Day6
Day7
Day8
Day9
Day10
Day11
Day12
mg mg mg mg mg mg mg mg mg mg mg mg mg mg
Con
trol
1 15 - - 24 - - 26 - - 10 48 - - 32 2 15 - - 24 - - 26 - - 10 48 - - 32 3 15 - - 24 - - 26 - - 10 48 - - 32 4 15 - - 24 - - 26 - - 10 48 - - 32
15 m
g/L
1 15 - - 24 - - 26 - - 10 48 - - 32 2 15 - - 24 - - 26 - - 10 48 - - 32 3 15 - - 24 - - 26 - - 10 48 - - 32 4 15 - - 24 - - 26 - - 10 48 - - 32
24 m
g/L
1 15 - - 24 - - 26 - - 10 48 - - 32 2 15 - - 24 - - 26 - - 10 48 - - 32 3 15 - - 24 - - 26 - - 10 48 - - 32 4 15 - - 24 - - 26 - - 10 48 - - 32
39 m
g/L
1 15 - - 24 - - 26 - - 10 48 - - 32 2 15 - - 24 - - 26 - - 10 48 - - 32 3 15 - - 24 - - 26 - - 10 48 - - 32 4 15 - - 24 - - 26 - - 10 48 - - 32
63 m
g/L
1 15 - - 24 - - 26 - - 10 48 - - 32 2 15 - - 24 - - 26 - - 10 48 - - 32 3 15 - - 24 - - 26 - - 10 48 - - 32 4 15 - - 24 - - 26 - - 10 48 - - 32
100
mg/
L
1 15 - - 24 - - 26 - - 10 48 - - 32 2 15 - - 24 - - 26 - - 10 48 - - 32 3 15 - - 24 - - 26 - - 10 48 - - 32 4 15 - - 24 - - 26 - - 10 48 - - 32
Ves
sels
use
d fo
r ch
emic
al a
naly
sis
K 15 - - 24 - - 26 - - 10 48 - - 32 1 15 - - 24 - - 26 - - 10 48 - - 32 2 15 - - 24 - - 26 - - 10 48 - - 32 3 15 - - 24 - - 26 - - 10 48 - - 32 4 15 - - 24 - - 26 - - 10 48 - - 32 5 15 - - 24 - - 26 - - 10 48 - - 32
Continued

Raw data - Test with chironomids: emergence - TiO2 (chapter 12) 346
Table 246: P25 – Chironomid test: addition of food, continued.
Date 5.5. 7.5 10.5 12.5 14.5 17.5 Day
13 Day14
Day15
Day16
Day17
Day18
Day19
Day20
Day21
Day22
Day23
Day24
Day25
Day26
mg mg mg mg mg mg mg mg mg mg mg mg mg mg
Con
trol
1 - 32 - 46.8 - - 16 - 12 - 18 - - 12 2 - 32 - 46.8 - - 24 - 18 - 27 - - 18 3 - 32 - 52 - - 28 - 20 - 27 - - 16 4 - 32 - 41.6 - - 22 - 20 - 30 - - 20
15 m
g/L
1 - 32 - 44.2 - - 24 - 14 - 21 - - 14 2 - 32 - 46.8 - - 30 - 22 - 27 - - 16 3 - 32 - 52 - - 22 - 14 - 6 - - 4 4 - 32 - 46.8 - - 16 - 14 - 15 - - 10
24 m
g/L
1 - 32 - 52 - - 22 - 12 - 15 - - 8 2 - 32 - 46.8 - - 14 - 10 - 12 - - 8 3 - 32 - 36.4 - - 16 - 8 - 9 - - 6 4 - 32 - 44.2 - - 18 - 18 - 27 - - 16
39 m
g/L
1 - 32 - 49.4 - - 30 - 20 - 21 - - 14 2 - 32 - 44.2 - - 30 - 30 - 45 - - 30 3 - 32 - 39.0 - - 10 - 16 - 15 - - 10 4 - 32 - 52 - - 18 - 4 - 3 - - -
63 m
g/L
1 - 32 - 49.4 - - 32 - 20 - 30 - - 20 2 - 32 - 49.4 - - 2 - - - - - - - 3 - 32 - 36.4 - - 16 - 16 - 24 - - 16 4 - 32 - 41.6 - - 22 - 16 - 21 - - 14
100
mg/
L
1 - 32 - 41.6 - - 16 - 10 - 15 - - 10 2 - 32 - 44.2 - - 18 - 18 - 24 - - 16 3 - 32 - 49.4 - - 30 - 24 - 18 - - 10 4 - 32 - 49.4 - - 24 - 20 - 27 - - 18
Ves
sels
use
d fo
r ch
emic
al a
naly
sis
K - 32 - 44.2 - - 18 - 12 - 9 - - 6 1 - 32 - 52 - - 18 - 14 - 15 - - 10 2 - 32 - 49.4 - - 18 - 8 - 6 - - 4 3 - 32 - 41.6 - - 16 - 4 - 6 - - 4 4 - 32 - 46.8 - - 12 - 12 - 18 - - 12 5 - 32 - 52 - - 36 - 36 - 36 - - 14

Raw data - Test with chironomids: emergence - TiO2 (chapter 12) 347
Table 247: P25 – Chironomid test: number of hatched midges and sex.
Date 5.05. 2010
6.05. 2010
7.05. 2010
8.05. 2010
9.05. 2010
10.5. 2010
11.5. 2010
Con
trol
1 - 1 1 - - - 4 2 3 1 1 -
2 - - - - - 1 - 2 1 2 1 -
3 - 1 - - - 1 2 2 2 1 1 -
4 - - 2 - - 1 - 1 3 1 1 -
15 m
g/L
1 - 1 - 2 - 2 2 - 1 - 3 -
2 - - 1 1 - 1 - 1 1 - 1 -
3 - - - - - - 1 6 1 1 1 -
4 - - - 2 - 1 3 4 1 1 - -
24 m
g/L
1 - - - - - 5 - 2 2 - 1 1
2 - 1 - 1 1 1 4 2,1† 2 - - 1
3 - 3 - 3 - 3 1 - 2 - 3 -
4 - 1 - 2 - 3 4 - - 1 - -
39 m
g/L
1 - - 1 1 - - 1 - 1 1 2 -
2 1 - 1 - - 1 - 2 - - - - -
3 - 2 1 2 - 1 3 4 2 - - -
4 - - - - - 3 3 2 2 1 3 1
63 m
g/L
1 - - - 1 - 1 - 1 1 - 3 -
2 - - 1 - 1 8 3 3 3 - 1 -
3 - 2 - 4 2 - 2 2 - - - -
4 - 2 - 2 1 1 1 2 - - 2 -
100
mg/
L
1 - 3 1 - - 1 3 3 1 - 1 -
2 - 1 1 2 - 3 2 - 1 1 - -
3 - - 1 1 - 1 1 1 - - 1 -
4 - - - 1 - 2 2 3 - - - 1
Con
trol w
ith n
ettle
1 - - - - - - - 1 - - - -
2 - - - - - - 1 5 - - 1 1
3 - - 1†, 1 (sex)? 1 1 1 - - - - -
4 - - - - - - - - - - - -
Continued

Raw data - Test with chironomids: emergence - TiO2 (chapter 12) 348
Table 247: P25 – Chironomid test: number of hatched midges and sex. . continued
Con
trol w
ith n
ettle
+
10
0 m
g/L
1 2 1 1 - 1 2 1 - - - - -
2 1 1 - - - - - 1 1 - - -
3 2 1 2 - 6 - - - 1 - - -
4 - 1 - 2 4 - 1 2 - - - -
Ves
sels
use
d fo
r che
mic
al a
naly
-si
s
K 1 (sex?) 1, 1 (sex?) - 2 - 3 2, 1? 2 -
1 - - - - 1, 1? 4, 1, 3 (sex?) - 1 1 (sex?)
2 - - - 1 2, 2 (sex?)
1, 1, 1 (sex?)
2, 1 (sex?) 2 -
3 - - 3, 1? - 1 3 1 3 - 3 -
4 - - 2? 1, 1, 4? 3 - 3 - - -
5 - - - - - - 1 1 - -

Raw data - Test with chironomids: emergence - TiO2 (chapter 12) 349
Table 248: P25 – Chironomid test: number of hatched midges and sex.
Date 12.5.2010 13.5.2010 14.5.2010 15.5.2010 16.5.2010 17.5.2010 18.5.2010
Con
trol
1 1 - - - - - - - - - - - - -
2 2 1 - - 1 - 1 - - - - - 1 -
3 1 - - 2 - - - - - - - - - -
4 - - 3 - 1 - - - - - - - - -
15 m
g/L
1 1 1 - - - - - - - - - - - -
2 3 - 1 1 - - 1 - - - - - - -
3 1 2 3 2 - - - - - - - - - -
4 - 1 - - 2 - - - - - - - - -
24 m
g/L
1 3 - 1 - - - - - 1 - - - - -
2 - 1 - - 1 - - - - - - - - -
3 1 - 1 - - - - - - - - - - -
4 - - - - - - 1? - - - - - - -
39 m
g/L
1 2 1 2 1 - - - - - - - - - -
2 - - - - - - - - - - - - - -
3 - - - - - - - - - - - - - -
4 2 1 1 - - - 1 - - - - - - -
63 m
g/L
1 2 1 - - - - - - - - - - - -
2 - - - - - - - - - - - - - -
3 - - - - - - - - - - - - - -
4 - 1 - - 1 - - - - - - - - -
100
mg/
L
1 2 - - - - - - - - - - - - -
2 - - 1 - - - - - - - - - - -
3 - 2 3 - 3 - - 1 - - - - - -
4 1 - - 1 - - - - - - - - - -
Continued
Ves
sels
use
d fo
r che
mic
al
anal
ysis
K 1 - 2 1 - - - - - - - - - -
1 - 1 2 - - - - - - - - - - -
2 2 1 2 - - - - - - - - - - -
3 3 - - - - - - - - - - - - -
4 - - - - - - - - - - - - - -
5 - - 4 1 1 - 3 - 2 - - - 1 -

Raw data - Test with chironomids: emergence - TiO2 (chapter 12) 350
Table 248: P25 – Chironomid test: number of hatched midges and sex. continued
Date 12.5. 2010
13.5. 2010
14.5. 2010
15.5 2010
16.5. 2010
17.5. 2010
18.5 2010
Con
trol w
ith n
ettle
1 - 1 1 - - - - - - - - - - -
2 1 did not hatch 1 1 - - - - - - - - - -
3 - - - - - - - - - - - - - -
4 - - - - - - - - - - - - - -
Con
trol w
ith n
ettle
+
10
0 m
g/L
1 - - - - - - - - - - - - - -
2 - - - - - - - - - - - - - -
3 1 - - - - - - - - - - - - -
4 - - - - - - - - 1 - - - - -

Raw data - Test with chironomids: emergence - TiO2 (chapter 12) 351
Table 249: P25 – Chironomid test: oxygen concentration [%].
Date 27.4 30.4 3.5 7.5 11.5 14.5
O2
% O2
% O2
% O2
% O2
% O2
%
Con
trol
1 92.1 94.4 93.6 94.4 76.8 96.3 2 90.4 89.7 93.4 83.2 88.0 96.2 3 87.4 95.0 92.8 96.2 81.3 92.1 4 90.2 93.5 90.9 95.2 73.9 86.6
15 m
g/L
1 84.7 98.0 92.2 74.7 85.8 99.9 2 98.0 96.6 94.4 72.7 88.0 94.2 3 99.2 97.5 97.7 85.5 89.0 91.5 4 98.2 97.9 96.0 86.0 92.0 98.3
24 m
g/L
1 93.5 97.8 94.8 72.3 94.4 100.2 2 92.6 89.4 98.3 79.3 89.2 99.4 3 98.5 98.5 98.8 91.4 92.6 100.0 4 97.6 99.4 96.3 84.7 91.2 96.4
39 m
g/L
1 69.6 98.8 78.1 77.3 92.2 98.2 2 96.6 98.1 95.7 81.5 86.6 96.8 3 97.0 99.2 97.2 86.8 94.5 97.0 4 99.0 97.4 95.7 84.7 82.1 98.8
63 m
g/L
1 96.0 99.5 98.3 80.3 83.7 95.1 2 98.3 96.7 95.7 82.7 93.1 100.1 3 98.8 99.9 99.1 81.3 93.4 98.7 4 95.7 96.4 92.1 77.2 90.4 96.2
100
mg/
L
1 98.6 98.2 94.6 70.7 89.1 99.5 2 79.7 98.2 95.0 83.5 90.4 98.7 3 86.3 99.4 91.7 96.9 74.1 90.4 4 100 99.8 97.5 72.3 83.3 97.3
Con
trol w
ith
nettl
e
1 73.3 84.6 90.8 85.1 95.9 101.5 2 95.3 95.5 94.1 99.9 97.8 100.5 3 94.6 94.1 96.4 100 100.9 100.4 4 87.0 89.1 92.4 95.8 94.9 99.9
Con
trol w
ith
nettl
e +
10
0 m
g/L
1 89.6 84.1 92.5 99.6 97.3 98.9 2 80.4 89.4 89.8 97.9 95.3 102.1 3 92.7 92.7 94.6 98.3 100.2 103.1 4 94.1 91.9 92.6 97.7 98.5 101.6
Ves
sels
use
d fo
r ch
emic
al a
naly
sis
K 72.1 87.6 94.2 95.1 80.3 97.1 1 90.0 92.3 77.3 96.4 73.2 92.3 2 63.4 98.7 92.7 99.2 77.3 96.0 3 62.5 99.0 97.7 100 92.3 101.1 4 92.0 95.8 93.5 94.0 88.1 99.9 5 87.6 94.8 93.1 96.8 71.5 92.2

Raw data - Test with chironomids: emergence - TiO2 (chapter 12) 352
Table 250: P25 – Chironomid test: temperature (°C) and pH value.
Date 28.04.2010 5.05.2010 12.5.2010 Temp °C pH Temp °C pH Temp °C pH
Con
trol
1
20.3
8.30
20.5
8.21
20.3
8.34 2 8.31 8.08 8.36 3 8.34 8.12 8.35 4 8.09 8.02 8.27
15 m
g/L
1 8.23 7.97 8.33 2 8.31 8.18 8.34 3 8.37 8.24 8.34 4 8.31 8.19 8.39
24 m
g/L
1 8.31 8.14 8.40 2 8.35 8.24 8.34 3 8.38 8.24 8.33 4 8.37 8.22 8.34
39 m
g/L
1 8.34 8.15 8.39 2 8.37 8.11 8.33 3 8.42 8.19 8.39 4 8.40 8.22 8.25
63 m
g/L
1 8.44 8.24 8.29 2 8.40 8.22 8.36 3 8.43 8.25 8.41 4 8.30 8.11 8.36
100
mg/
L
1 8.34 8.18 8.37 2 8.38 8.18 8.35 3 8.20 7.73 8.25 4 8.34 8.09 8.34
Con
trol w
ith
nettl
e
1 8.12 8.15 8.66 2 8.48 8.51 8.72 3 8.64 8.58 8.78 4 8.58 8.57 8.70
Con
trol w
ith
nettl
e +
10
0 m
g/L
1 8.58 8.57 8.71 2 8.30 8.44 8.67 3 8.46 8.55 8.75 4 8.58 8.55 8.71
Ves
sels
for
che
mic
al
anal
ysis
K 8.53 8.26 8.38 1 8.47 8.05 8.27 2 8.53 8.12 8.27 3 8.52 8.19 8.39 4 8.53 8.20 8.38 5 8.58 7.90 8.23

Raw data - Test with chironomids: emergence - TiO2 (chapter 12) 353
21.5.2 NM-101
Table 251: NM-101 – Chironomid test: quality control / validation of chemical analyses.
Sample de-scription
Ti [µg/L] - measured
Ti [µg/L] - nominal
Recovery [%]
Samples of day 0 and day 1 Recalibration standard (commercially avail-able Ti standard with soluble Ti) 500 µg/L 503.9 500 106
Reference standard CPI 500 µg/L 512.1 500 102 500 µg/L 519.7 500 104 Positive control (aqueous samples with NM-101) 790 mg/L 74680 79000 94.5
790 mg/L 74620 79000 94.5 Samples of day 7 Positive control (aqueous samples with NM-101) TiO2 79 µgTi/L 69920 79000 88.5
TiO2 79 µgTi/L 70190 79000 88.8 TiO2 79 µgTi/L 71320 79000 90.3 TiO2 79 µgTi/L 71540 79000 90.6 Reference standard CPI 25 µg/L 26.39 25 106 25 µg/L 26.25 25 105 Recalibration standard (commercially avail-able Ti standard with soluble Ti) Ti 50 µg/L 51.61 50 103
Ti 50 µg/L 51.61 50 103 Samples of day 14 Positive control (aqueous samples with NM-101) TiO2 79 µgTi/L 68810 79000 87.1
TiO2 79 µgTi/L 69580 79000 88.1 TiO2 79 µgTi/L 68870 79000 87.2 TiO2 79 µgTi/L 69240 79000 87.6 Reference standard CPI 25 µg/L 23.86 25 95.4 25 µg/L 23.1 25 92.4 Recalibration standard (commercially avail-able Ti standard with soluble Ti) Ti 50 µg/L 47.56 50 95.1
Ti 50 µg/L 47.02 50 94.0 Samples of day 28 – aqueous samples Positive control (aqueous samples with NM-101) TiO2 79 µgTi/L 70460 79000 89.2
TiO2 79 µgTi/L 70430 79000 89.2 TiO2 79 µgTi/L 74160 79000 93.9 TiO2 79 µgTi/L 74710 79000 94.6 Reference standard CPI 25 µg/L 24.92 25 99.2 25 µg/L 26.85 25 107 Recalibration standard (commercially avail-able Ti standard with soluble Ti) Ti 50 µg/L 48.97 50 97.9
Ti 50 µg/L 51.89 50 104
Continued

Raw data - Test with chironomids: emergence - TiO2 (chapter 12) 354
Table 251: NM-101 – Chironomid test: quality control / validation of chemical analyses. contin-ued
Samples of day 28 - sediment Recalibration standard (commercially avail-able Ti standard with soluble Ti) Ti 500µg/L 516 500 103
Ti 500µg/L 518 500 104
Ti 500µg/L 538 500 108
Ti 500µg/L 537 500 107
Positive control (soil samples with NM-101) 4500 mg/kg 3819 4500 85 4500 mg/kg 4012 4500 89 4500 mg/kg 4023 4500 89

Raw data - Test with chironomids: emergence - TiO2 (chapter 12) 355
Table 252: NM-101 – Chironomid test: physico-chemical test parameters.
Test start Test end O2
% Temp °C
pH TH mmol/l
NH4
mg/L Light lux
O2
% Temp °C
pH TH mmol/l
NH4
mg/L Light lux
Con
trol
1 104.6 20.3
8.28 1.4 0.9 771-826
109.9 20.3
8.44 1.6 0.8 770
2 106.0 8.37 1.5 0.6 102.2 8.37 1.6 4.9 3 104.8 8.32 1.5 0.9 99.9 8.46 1.6 7.5 4 104.3 8.30 1.3 0.7 106.4 8.46 1.6 0.5
15 m
g/L
1 103.8 8.31 83.1 8.46 2 104.9 8.27 101.4 8.41 3 104.4 8.34 97.0 8.46 4 105.7 8.39 109.6 8.52
24 m
g/L
1 106.9 8.43 111.7 8.53 2 104.6 8.31 101.9 8.49 3 103.9 8.28 97.0 8.36 4 104.4 8.30 106.2 8.40
39 m
g/L
1 104.6 8.25 103.9 8.51 2 105.3 8.29 99.5 8.45 3 104.6 8.28 109.0 8.59 4 103.2 8.27 103.1 8.52
63 m
g/L
1 105.7 8.28 99.0 8.45 2 103.4 8.28 107.4 8.52 3 104.4 8.34 109.4 8.56 4 103.6 8.31 108.3 8.52
100
mg/
L
1 105.2 8.35 104.8 8.52 2 103.7 8.31 1.4 0.7 113.5 8.59 1.7 0.6 3 104.8 8.31 107.3 8.52 4 104.8 8.28 114.3 8.56
Ves
sels
use
d fo
r ch
emic
al a
naly
sis
K 104.8 8.17 1.4 0.8 124.5 8.75 1.6 0.1 1 104.0 8.16 111.2 8.61 2 105.5 8.25 105.8 8.51 3 105.9 8.35 99.6 8.41 4 104.9 8.27 105.7 8.45 5 104.0 8.27 1.4 0.7 112.2 8.75 1.6 0.1
Water hardness (TH): 1 mmol corresponds to 100 mg CaCo3 equivalent.

Raw data - Test with chironomids: emergence - TiO2 (chapter 12) 356
Table 253: NM-101 – Chironomid test: addition of Food (TetraMin grinded).
Date 9.6. 11.6 14.6 16.6 18.6 21.6 Day
-1 Day0
Day1
Day2
Day3
Day4
Day5
Day6
Day7
Day8
Day9
Day10
Day11
Day12
mg mg mg mg mg mg mg mg mg mg mg mg mg mg
Con
trol
1 10 - 21 - - 16 - 18 - 42 - - 32 - 2 10 - 21 - - 16 - 18 - 42 - - 32 - 3 10 - 21 - - 16 - 18 - 42 - - 32 - 4 10 - 21 - - 16 - 18 - 42 - - 32 -
15 m
g/L
1 10 - 21 - - 16 - 18 - 42 - - 32 - 2 10 - 21 - - 16 - 18 - 42 - - 32 - 3 10 - 21 - - 16 - 18 - 42 - - 32 - 4 10 - 21 - - 16 - 18 - 42 - - 32 -
24 m
g/L
1 10 - 21 - - 16 - 18 - 42 - - 32 - 2 10 - 21 - - 16 - 18 - 42 - - 32 - 3 10 - 21 - - 16 - 18 - 42 - - 32 - 4 10 - 21 - - 16 - 18 - 42 - - 32 -
39 m
g/L
1 10 - 21 - - 16 - 18 - 42 - - 32 - 2 10 - 21 - - 16 - 18 - 42 - - 32 - 3 10 - 21 - - 16 - 18 - 42 - - 32 - 4 10 - 21 - - 16 - 18 - 42 - - 32 -
63 m
g/L
1 10 - 21 - - 16 - 18 - 42 - - 32 - 2 10 - 21 - - 16 - 18 - 42 - - 32 - 3 10 - 21 - - 16 - 18 - 42 - - 32 - 4 10 - 21 - - 16 - 18 - 42 - - 32 -
100
mg/
L
1 10 - 21 - - 16 - 18 - 42 - - 32 - 2 10 - 21 - - 16 - 18 - 42 - - 32 - 3 10 - 21 - - 16 - 18 - 42 - - 32 - 4 10 - 21 - - 16 - 18 - 42 - - 32 -
Ves
sels
use
d fo
r ch
emic
al a
naly
sis
K 10 - 21 - - 16 - 18 - 42 - - 32 - 1 10 - 21 - - 16 - 18 - 42 - - 32 - 2 10 - 21 - - 16 - 18 - 42 - - 32 - 3 10 - 21 - - 16 - 18 - 42 - - 32 - 4 10 - 21 - - 16 - 18 - 42 - - 32 - 5 10 - 21 - - 16 - 18 - 42 - - 32 -
Continued

Raw data - Test with chironomids: emergence - TiO2 (chapter 12) 357
Table 253: NM-101 – Chironomid test: addition of Food (TetraMin grinded). continued
Date 9.6. 11.6 14.6 16.6 18.6 21.6 Day
13 Day14
Day15
Day16
Day17
Day18
Day19
Day20
Day21
Day22
Day23
Day24
Day25
Day26
mg mg mg mg mg mg mg mg mg mg mg mg mg mg
Con
trol
1 32 - 56 - - 20 - 8 - 6 - - 4 - 2 32 - 56 - - 22 - 12 - 15 - - 10 - 3 32 - 56 - - 34 - 20 - 24 - - 12 - 4 32 - 50.4 - - 18 - 12 - 15 - - 10 -
15 m
g/L
1 32 - 56 - - 38 - 38 - 39 - - 20 - 2 32 - 56 - - 28 - 4 - 3 - - 2 - 3 32 - 56 - - 38 - 38 - 51 - - 32 - 4 32 - 47.6 - - 18 - 8 - 12 - - 6 -
24 m
g/L
1 32 - 44.8 - - 18 - 4 - 3 - - 2 - 2 32 - 56 - - 36 - 34 - 36 - - 20 - 3 32 - 50.4 - - 20 - 8 - 6 - - 4 - 4 32 - 44.8 - - 16 - 2 - 3 - - 2 -
39 m
g/L
1 32 - 56 - - 36 - 26 - 27 - - 16 - 2 32 - 53.2 - - 30 - 22 - 27 - - 16 - 3 32 - 47.6 - - 22 - 14 - 21 - - 14 - 4 32 - 50.4 - - 24 - 22 - 33 - - 22 -
63 m
g/L
1 32 - 56 - - 36 - 30 - 45 - - 28 - 2 32 - 47.6 - - 14 - 8 - 12 - - 8 - 3 32 - 53.2 - - 24 - 12 - 18 - - 10 - 4 32 - 47.6 - - 14 - 6 - 6 - - 4 -
100
mg/
L
1 32 - 56 - - 20 - 12 - 9 - - 6 - 2 32 - 50.4 - - 20 - 6 - 9 - - 4 - 3 32 - 56 - - 24 - 14 - 18 - - 12 - 4 32 - 44.8 - - 14 - 10 - 9 - - 4 -
Ves
sels
use
d fo
r ch
emic
al a
naly
sis
K 32 - 50.4 - - 24 - 4 - 6 - - 4 - 1 32 - 50.4 - - 20 - 16 - 18 - - 12 - 2 32 - 50.4 - - 18 - 12 - 18 - - 12 - 3 32 - 50.4 - - 18 - 10 - 15 - - 10 - 4 32 - 47.6 - - 14 - 6 - 6 - - 4 - 5 32 - 56 - - 28 - 24 - 33 - - 22 -
Continued

Raw data - Test with chironomids: emergence - TiO2 (chapter 12) 358
Table 253: NM-101 – Chironomid test: addition of Food (TetraMin grinded). continued
Date 23.6 Day
27 Day28
mg mg
Con
trol
1 - - 2 4 - 3 4 - 4 4 -
15 m
g/L
1 6 - 2 - - 3 12 - 4 2 -
24 m
g/L
1 - - 2 8 - 3 - - 4 2 -
39 m
g/L
1 6 - 2 6 - 3 10 - 4 20 -
63 m
g/L
1 16 - 2 8 - 3 8 - 4 2 -
100
mg/
L
1 2 - 2 2 - 3 6 - 4 2 -
Ves
sels
use
d fo
r ch
emic
al a
naly
sis
K 8 - 1 4 - 2 12 - 3 10 - 4 4 - 5 12 -

Raw data - Test with chironomids: emergence - TiO2 (chapter 12) 359
Table 254: NM-101 – Chironomid test: oxygen concentration [%].
Date 31.5 4.6 8.6 11.6 15.6 18.6 22.6
O2
% O2
% O2
% O2
% O2
% O2
% O2
% O2
% O2
% O2
%
Con
trol
1 102.6 2 90.9 3 85.4 4 91.4 92.9
15 m
g/L
1 87.7 2 98.1 90.0 3 99.7 79.8 4 93.5 72.2
24 m
g/L
1 101.2 93.8 2 99.7 90.4 3 82.5 4 95.9 98.1
39 m
g/L
1 101.6 88.2 2 81.8 88.4 3 98.5 4 93.9 90.3
63 m
g/L
1 89.7 2 96.4 86.8 3 102.4 95.9 4 91.1 96.4
100
mg/
L
1 97.7 2 102.6 93.8 101.1 3 96.1 4 94.6 92.2
Ves
sels
use
d fo
r ch
emic
al a
naly
sis 1 103.3 97.8 86.7 96.6 87.0 93.2 106.1
2 102.1 97.5 97.8 92.5 89.1 93.3 94.5 3 102.4 96.0 90.6 92.6 88.7 91.7 92.1 4 104.7 98.0 95.6 95.1 90.5 95.1 94.4 5 102.8 98.7 91.7 93.4 89.6 94.1 96.6

Raw data - Test with chironomids: emergence - TiO2 (chapter 12) 360
Table 255: NM-101 – Chironomid test: temperature (°C) and pH value.
Date 4.6.2010 11.06.2010 18.06.2010 Temp °C pH Temp °C pH Temp °C pH
Con
trol
1
20.3
8.30 20.5
8.00 20.3
8.49 2 8.37 8.07 8.59 3 8.33 8.18 8.49 4 8.34 8.15 8.54
15 m
g/L
1 8.32 8.13 8.42 2 8.34 8.21 8.57 3 8.34 8.25 8.39 4 8.39 8.21 8.54
24 m
g/L
1 8.38 8.31 8.66 2 8.32 7.78 8.43 3 8.30 8.13 8.54 4 8.31 8.11 8.56
39 m
g/L
1 8.29 7.78 8.42 2 8.29 8.24 8.43 3 8.36 8.20 8.61 4 8.35 8.23 8.47
63 m
g/L
1 8.35 8.28 8.19 2 8.35 8.34 8.54 3 8.31 8.33 8.54 4 8.30 8.15 8.54
100
mg/
L
1 8.36 8.26 8.56 2 8.33 8.39 8.56 3 8.32 8.26 8.58 4 8.30 8.31 8.49
Ves
sels
for
chem
ical
ana
lysi
s 1 8.27 8.30 8.51 2 8.30 8.32 8.56 3 8.32 8.26 8.57 4 8.36 8.27 8.61 5 8.36 8.37 8.58

Raw data - Test with chironomids: emergence - TiO2 (chapter 12) 361
Table 256: NM-101 – Chironomid test: number of hatched midges and sex.
Date 11.06.2010 12.06.2010 13.06.2010 14.06.2010 15.06.2010 16.06.2010 17.06.2010
Con
trol
1 - - 1 4 - 1 2 2 3 - 2 1 - -
2 - - 1 4 1 2 1 - 2 1 1 1 2 -
3 - - - - - 2 - 1 - 1 2 4 1 2
4 - 2 1 6 1 - 1 - - - 3 - 2 -
15 m
g/L
1 - - - - - - - 1 - - - - - -
2 - - - 2 1 2 - 1 5 3 3 1 - -
3 - - - - - - - 1 - - - - 1 3
4 - 3 - 2 1 2 - 3 2 1 2 - 2 -
24 m
g/L
1 - 4 - 5 1 - 1 - 2 1 4 - 1 -
2 - - - 1 - - - 1 - - - 1 2 1
3 - 2 1 2 1 3 - 1 2 2 1 1 1 -
4 1 3 - 3 1 2 2 - 3 3 1 - - -
39 m
g/L
1 - - - 1 - 1 - - 1 2 1 1 1 -
2 - 1 - - 1 2 1 - 2 1 1 - 3 -
3 1 2 1 1 1 2 1 - 1 - 2 1 1 -
4 1 1 - 1 1 1 3 - - - 1 - 1 -
63 m
g/L
1 - - - 2 - - - - - - 1 2 - 1
2 - 3 1 5 - 2 1 1 1 - 2 - - -
3 1 - 1 3 1 - - 2 1 2 2 1 1 -
4 - 3 1 2 1 2 4 - - - 2 2 - -
100
mg/
L
1 - - 1 2 2 5 - - 2 2 - - 2 -
2 - 2 - 2 1 1 3 1 2 - 2 3 - 1
3 - - - 4 - 2 1 1 2 1 2 - 3 -
4 - 4 - - - 6 3 - - - 2 - 1 -
Ves
sels
for c
hem
ical
ana
lysi
s
K - 2 - 2 1 1 2 - 3 1 4 2 - -
1 - 2 1 2 - 1 3 1 1 1 - - 1 -
2 - 2 1 1 1 2 4 - 2 1 - - - -
3 - 2 - 3 2 2 2 - 2 - 1 1 - -
4 - 3 - 1 3 1 2 3 - 1 3 - - -
5 - - - 4 - 1 - 1 - 1 1 - 5 -
Continued

Raw data - Test with chironomids: emergence - TiO2 (chapter 12) 362
Table 256: NM-101 – Chironomid test: number of hatched midges and sex. continued
Date 18.06.10 19.06.10 20.06.10 21.06.10 22.06.10 23.06.10 24.06.10
Con
trol
1 1 1 2 - - - - - - - - - - -
2 1 - - - 1 - - - - - - - - -
3 1 1 - - 1 - 2 - - - - - - -
4 1 - - - 1 - - - - - - - - -
15 m
g/L
1 1 5 1 1 2 1 2 1 1 - - - - -
2 - 1 - - - 1 - - - - - - - -
3 - 2 - - - 2 1 - 4 - - - - -
4 - - - - - - 1 - - - - - - -
24 m
g/L
1 1 - - - - - - - - - - - -
2 4 1 2 - 1 - 1 1 - - - - - -
3 2 - 1 - - - - - - - - - - -
4 - - - - - - - - - - - - - -
39 m
g/L
1 3 1 1 - - 1 1 - 2 - - - - -
2 1 1 2 - 1 - 1 - - - - - - -
3 - - 1 - - - - - - - - - - -
4 - - - - - - - - - - - - - -
63 m
g/L
1 - - - - 1 1 - 1 1 - - - - -
2 - - - - - - - - - - - - - -
3 - - - - - - - 1 - - - - - -
4 - 1 - - 1 - - - - - - - - -
100
mg/
L
1 3 - - - - - - - - - - - - -
2 - - - - - - 1 - - - - - - -
3 1 - - - - - - - - - - - - -
4 2 - - - - - 1 - - - - - - -
Ves
sels
for c
hem
ical
ana
lysi
s
K - - - - - - - - - - - - - -
1 2 - - 1 1 - - - - - - - - -
2 - - - - - - - - - - - - - -
3 - - - - - - - - - - - - - -
4 1 - - - - - - - - - - - - -
5 1 - - - - - - - - - - - - -
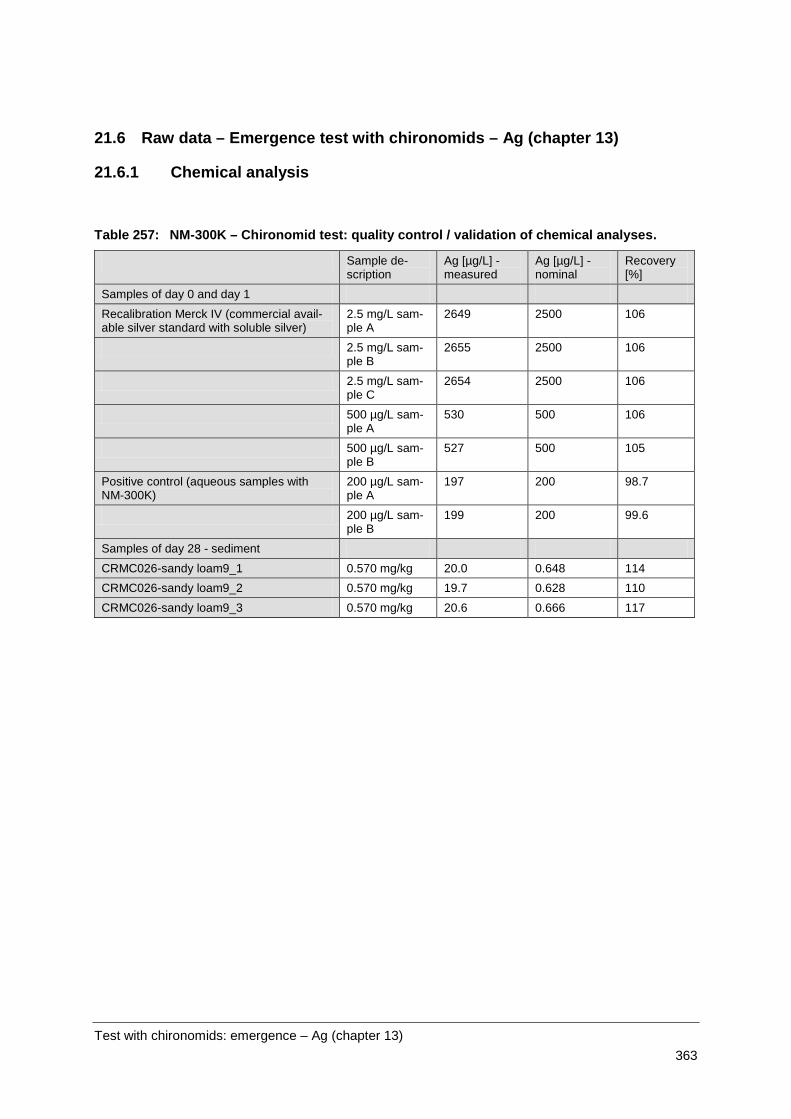
Test with chironomids: emergence – Ag (chapter 13) 363
21.6 Raw data – Emergence test with chironomids – Ag (chapter 13)
21.6.1 Chemical analysis
Table 257: NM-300K – Chironomid test: quality control / validation of chemical analyses.
Sample de-scription
Ag [µg/L] - measured
Ag [µg/L] - nominal
Recovery [%]
Samples of day 0 and day 1 Recalibration Merck IV (commercial avail-able silver standard with soluble silver)
2.5 mg/L sam-ple A
2649 2500 106
2.5 mg/L sam-ple B
2655 2500 106
2.5 mg/L sam-ple C
2654 2500 106
500 µg/L sam-ple A
530 500 106
500 µg/L sam-ple B
527 500 105
Positive control (aqueous samples with NM-300K)
200 µg/L sam-ple A
197 200 98.7
200 µg/L sam-ple B
199 200 99.6
Samples of day 28 - sediment CRMC026-sandy loam9_1 0.570 mg/kg 20.0 0.648 114 CRMC026-sandy loam9_2 0.570 mg/kg 19.7 0.628 110 CRMC026-sandy loam9_3 0.570 mg/kg 20.6 0.666 117

Test with chironomids: emergence – Ag (chapter 13) 364
Table 258: NM-300K – Chironomid test: measured silver concentrations in DGT extracts and calculated estimated average Ag concentration in ma-trix.
Sample
measured extract Ag conc. [µg/L]
extract volume [L]
extracted mass [µg]
extraction factor
calculated mass in DGT section [µg]
Deployment time [h]
sampled DGT area [cm2]
metal ion flux [µg/s*cm2]
DGT boundary thickness [cm]
metal diffusion coefficient [cm2/s]
estimated average Ag conc. in matrix [mg/L]
estimated average Ag conc. in matrix [µg/L]
control A 0.008 0.015 0.00011 0.93 0.00012 48 3.142 2.2607E-10 0.094 1.23E-05 0.0000017 0.0017 control B 0.007 0.015 0.00010 0.93 0.00011 48 3.142 1.9963E-10 0.094 1.23E-05 0.0000015 0.0015 0.3125 mg A 0.011 0.015 0.00016 0.93 0.00017 48 3.142 3.1549E-10 0.094 1.23E-05 0.0000024 0.0024 0.3125 mg B 0.010 0.015 0.00015 0.93 0.00016 48 3.142 2.9282E-10 0.094 1.23E-05 0.0000022 0.0022 0.625 mg A 0.022 0.015 0.00033 0.93 0.00035 48 3.142 6.4731E-10 0.094 1.23E-05 0.0000050 0.0050 0.625 mg B 0.015 0.015 0.00023 0.93 0.00025 48 3.142 4.5184E-10 0.094 1.23E-05 0.0000035 0.0035 1.25 mg A 0.022 0.015 0.00033 0.93 0.00035 48 3.142 6.5355E-10 0.094 1.23E-05 0.0000050 0.0050 1.25 mg B 0.142 0.015 0.00212 0.93 0.00228 48 3.142 4.2065E-09 0.094 1.23E-05 0.0000322 0.0322 2.5 mg A 0.057 0.015 0.00085 0.93 0.00092 48 3.142 1.6856E-09 0.094 1.23E-05 0.0000129 0.0129 2.5 mg B 0.054 0.015 0.00080 0.93 0.00086 48 3.142 1.5911E-09 0.094 1.23E-05 0.0000122 0.0122 5.0 mg A 0.600 0.015 0.00900 0.93 0.00968 48 3.142 1.7824E-08 0.094 1.23E-05 0.0001364 0.1364 5.0 mg B 1.837 0.015 0.02756 0.93 0.02963 48 3.142 5.4572E-08 0.094 1.23E-05 0.0004176 0.4176 10 mg A 2.138 0.015 0.03207 0.93 0.03448 48 3.142 6.3514E-08 0.094 1.23E-05 0.0004860 0.4860 10 mg B 3.339 0.015 0.05009 0.93 0.05385 48 3.142 9.9192E-08 0.094 1.23E-05 0.0007590 0.7590
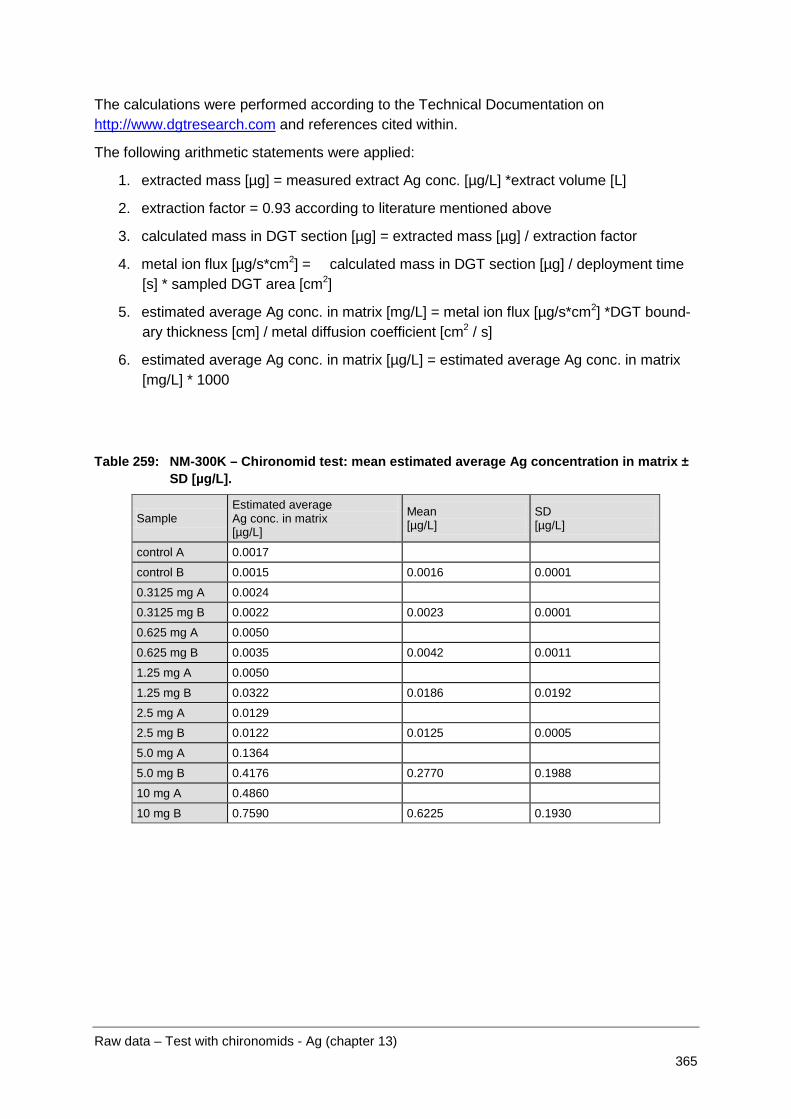
Raw data – Test with chironomids - Ag (chapter 13) 365
The calculations were performed according to the Technical Documentation on http://www.dgtresearch.com and references cited within.
The following arithmetic statements were applied:
1. extracted mass [µg] = measured extract Ag conc. [µg/L] *extract volume [L]
2. extraction factor = 0.93 according to literature mentioned above
3. calculated mass in DGT section [µg] = extracted mass [µg] / extraction factor
4. metal ion flux [µg/s*cm2] = calculated mass in DGT section [µg] / deployment time [s] * sampled DGT area [cm2]
5. estimated average Ag conc. in matrix [mg/L] = metal ion flux [µg/s*cm2] *DGT bound-ary thickness [cm] / metal diffusion coefficient [cm2 / s]
6. estimated average Ag conc. in matrix [µg/L] = estimated average Ag conc. in matrix [mg/L] * 1000
Table 259: NM-300K – Chironomid test: mean estimated average Ag concentration in matrix ± SD [µg/L].
Sample Estimated average Ag conc. in matrix [µg/L]
Mean [µg/L]
SD [µg/L]
control A 0.0017
control B 0.0015 0.0016 0.0001
0.3125 mg A 0.0024
0.3125 mg B 0.0022 0.0023 0.0001
0.625 mg A 0.0050
0.625 mg B 0.0035 0.0042 0.0011
1.25 mg A 0.0050
1.25 mg B 0.0322 0.0186 0.0192
2.5 mg A 0.0129
2.5 mg B 0.0122 0.0125 0.0005
5.0 mg A 0.1364
5.0 mg B 0.4176 0.2770 0.1988
10 mg A 0.4860
10 mg B 0.7590 0.6225 0.1930

Raw data – Test with chironomids - Ag (chapter 13) 366
Figure 58: NM-300K - Test with chironomids: weighed concentration vs. estimated average Ag concentration in matrix obtained from the DGT extracts.

Raw data – Test with chironomids - Ag (chapter 13) 367
21.6.2 Ecotoxicological test
Table 260: Physico-chemical test parameters.
Test start Test end O2
% Temp °C
pH TH mmol/l
NH4
mg/L Light lux
O2
% Temp °C
pH TH mmol/l
NH4
mg/L Light lux
Con
trol
1 95.6
20.3
8.16 1.1 0.4 636 - 682
95.9
20.3
8.45 1.4 8.0 621 - 657
2 95.7 8.15 1.2 0.4 94.7 8.42 1.7 6.0 3 97.3 8.20 1.1 0.5 86.3 8.34 1.4 6.0 4 96.7 8.14 1.2 0.3 87.7 8.32 1.6 6.0
0.31
25 m
g/L 1 95.3 8.08 94.9 8.45
2 95.0 8.07 92.6 8.44 3 93.8 8.00 93.0 8.42 4 95.0 8.05 90.9 8.48
0.62
5 m
g/L
1 95.9 8.11 90.3 8.48 2 96.1 8.15 76.5 8.19 3 94.2 8.12 93.2 8.48 4 92.8 8.05 93.3 8.42
1.25
mg/
L
1 92.6 8.01 69.8 8.26 2 95.4 8.05 85.0 8.32 3 94.8 8.08 92.7 8.44 4 96.8 8.19 93.4 8.40
2.5
mg/
L
1 96.1 8.13 81.7 8.31 2 95.6 8.12 82.6 8.33 3 95.7 8.13 79.7 8.32 4 95.2 8.12 89.8 8.42
5 m
g/L
1 93.4 8.11 93.4 8.45 2 94.5 8.01 94.5 8.48 3 94.2 8.01 94.2 8.48 4 94.0 8.01 94.0 8.48
10 m
g/L
1 97.1 8.22 97.1 8.46 2 95.2 8.15 1.1 0.4 95.2 8.50 1.6 7.0 3 96.3 8.23 96.3 8.50 4 95.8 8.17 95.8 8.48
Ves
sels
use
d fo
r che
mi-
cal a
naly
sis
K 95.8 8.13 1.2 0.4 95.8 8.16 1.5 8.0 1 94.3 8.11 94.3 8.38 2 95.9 8.15 95.9 8.19 3 97.0 8.22 97.0 8.52 4 96.3 8.21 96.3 8.40 5 96.5 8.19 96.5 8.47 6 94.9 8.15 1.1 0.5 94.9 8.49 1.6 7.0
Water hardness (TH): 1 mmol corresponds to 100 mg CaCo3 equivalent.

Raw data – Test with chironomids - Ag (chapter 13) 368
Table 261: NM-300K – Chironomid test: addition of Food (TetraMin grinded).
Date 11.1. 13.1. 14.1. 17.1. 19.1. 21.1. 24.1.
Day -1
Day0
Day1
Day2
Day3
Day4
Day5
Day6
Day7
Day8
Day9
Day10
Day11
Day12
mg mg mg mg mg mg mg mg mg mg mg mg mg mg
Con
trol
1 10 - 5 24 - - 16 - 20 - 42 - - 32 2 10 - 5 24 - - 16 - 20 - 42 - - 32 3 10 - 5 24 - - 16 - 20 - 42 - - 32 4 10 - 5 24 - - 16 - 20 - 42 - - 32
0.31
25 m
g/L 1 10 - 5 24 - - 16 - 20 - 42 - - 32
2 10 - 5 24 - - 16 - 20 - 42 - - 32 3 10 - 5 24 - - 16 - 20 - 42 - - 32 4 10 - 5 24 - - 16 - 20 - 42 - - 32
0.62
5 m
g/L
1 10 - 5 24 - - 16 - 20 - 42 - - 32 2 10 - 5 24 - - 16 - 20 - 42 - - 32 3 10 - 5 24 - - 16 - 20 - 42 - - 32 4 10 - 5 24 - - 16 - 20 - 42 - - 32
1.25
mg/
L
1 10 - 5 24 - - 16 - 20 - 42 - - 32 2 10 - 5 24 - - 16 - 20 - 42 - - 32 3 10 - 5 24 - - 16 - 20 - 42 - - 32 4 10 - 5 24 - - 16 - 20 - 42 - - 32
2.5
mg/
L
1 10 - 5 24 - - 16 - 20 - 42 - - 32 2 10 - 5 24 - - 16 - 20 - 42 - - 32 3 10 - 5 24 - - 16 - 20 - 42 - - 32 4 10 - 5 24 - - 16 - 20 - 42 - - 32
5 m
g/L
1 10 - 5 24 - - 16 - 20 - 42 - - 32 2 10 - 5 24 - - 16 - 20 - 42 - - 32 3 10 - 5 24 - - 16 - 20 - 42 - - 32 4 10 - 5 24 - - 16 - 20 - 42 - - 32
10 m
g/L
1 10 - 5 24 - - 16 - 20 - 42 - - 32 2 10 - 5 24 - - 16 - 20 - 42 - - 32 3 10 - 5 24 - - 16 - 20 - 42 - - 32 4 10 - 5 24 - - 16 - 20 - 42 - - 32
Ves
sels
use
d fo
r che
mi-
cal a
naly
sis
K 10 - 5 24 - - 16 - 20 - 42 - - 32 1 10 - 5 24 - - 16 - 20 - 42 - - 32 2 10 - 5 24 - - 16 - 20 - 42 - - 32 3 10 - 5 24 - - 16 - 20 - 42 - - 32 4 10 - 5 24 - - 16 - 20 - 42 - - 32 5 10 - 5 24 - - 16 - 20 - 42 - - 32 6 10 - 5 24 - - 16 - 20 - 42 - - 32
Continued

Raw data – Test with chironomids - Ag (chapter 13) 369
Table 261: NM-300K – Chironomid test: addition of Food (TetraMin grinded). continued
Date 26.1. 28.1. 31.1 2.2. 4.2. 7.2
Day 13
Day14
Day15
Day16
Day17
Day18
Day19
Day20
Day21
Day22
Day23
Day24
Day25
Day26
mg mg mg mg mg mg mg mg mg mg mg mg mg mg
Con
trol
1 - 32 - 44.2 - - 10 - 4 - 6 - - 2 2 - 32 - 49.4 - - 20 - 14 - 12 - - 6 3 - 32 - 52 - - 24 - 14 - 18 - - 10 4 - 32 - 46.8 - - 20 - 12 - 12 - - 8
0.31
25 m
g/L 1 - 32 - 52 - - 34 - 22 - 12 - - 4
2 - 32 - 52 - - 28 - 8 - 6 - - 2 3 - 32 - 52 - - 26 - 10 - 12 - - - 4 - 32 - 46.8 - - 18 - 6 - 6 - - 2
0.62
5 m
g/L
1 - 32 - 52 - - 18 - 8 - 12 - - 6 2 - 32 - 46.8 - - 32 - 16 - 9 - - 4 3 - 32 - 49.4 - - 18 - 4 - 3 - - - 4 - 32 - 52 - - 24 - 8 - 3 - - -
1.25
mg/
L
1 - 32 - 52 - - 34 - 26 - 12 - - 6 2 - 32 - „ - - 36 - 28 - 21 - - 8 3 - 32 - „ - - 36 - 28 - 30 - - 10 4 - 32 - „ - - 40 - 38 - 39 - - 10
2.5
mg/
L
1 - 32 - „ - - 40 - 40 - 60 - - 38 2 - 32 - „ - - 40 - 40 - 60 - - 38 3 - 32 - „ - - 40 - 40 - 57 - - 28 4 - 32 - „ - - 38 - 34 - 39 - - 22
5 m
g/L
1 - 32 - „ - - - - - - - - - - 2 - 32 - „ - - - - - - - - - - 3 - 32 - „ - - - - - - - - - - 4 - 32 - „ - - - - - - - - - -
10 m
g/L
1 - 32 - „ - - - - - - - - - - 2 - 32 - „ - - - - - - - - - - 3 - 32 - „ - - - - - - - - - - 4 - 32 - „ - - - - - - - - - -
Ves
sels
use
d fo
r che
mi-
cal a
naly
sis
K - 32 - 52 - - 24 - 12 - 9 - - 8 1 - 32 - 52 - - 38 - 36 - 27 - - 14 2 - 32 - 49.4 - - 22 - 10 - 15 - - 6 3 - 32 - 52 - - 32 - 20 - 18 - - 2 4 - 32 - 52 - - 40 - 34 - 33 - - 20 5 - 32 - 52 - - - - - - - - - - 6 - 32 - 52 - - - - - - - - - -

Raw data – Test with chironomids - Ag (chapter 13) 370
Table 262: NM-300K – Chironomid test: oxygen concentration [%]. Date 18.1. 21.1. 25.1. 28.1. 1.2. 4.2.
O2
% O2
% O2
% O2
% O2
% O2
%
Con
trol
1 84.0 87.6 83.5 2 90.7 92.0 83.6 3 88.0 91.2 82.4 4 82.7 95.7
0.31
25 m
g/L 1 89.4 90.6 77.2
2 87.0 87.6 83.2 3 88.5 88.9 65.2 4 86.3 82.5 91.6
0.62
5 m
g/L
1 91.5 94.5 84.3 2 93.2 94.7 67.1 3 91.3 91.4 82.3 91.2 4 85.0 85.7
1.25
mg/
L
1 86.3 86.3 66.4 2 79.5 85.1 69.8 3 90.7 93.4 90.2 4 91.5 95.2 81.0
2.5
mg/
L
1 83.2 89.9 74.2 2 83.6 91.4 75.2 3 77.2 92.8 86.4 4 80.8 89.0 92.6
5 m
g/L
1 96.3 95.6 85.1 2 91.4 91.9 81.7 3 92.8 94.9 88.5 4 91.4 92.3 91.1
10 m
g/L
1 91.7 82.9 81.2 74.4 69.3 90.9 2 82.1 89.2 83.6 67.2 65.3 83.4 3 88.0 91.2 81.9 75.2 64.7 86.4 4 76.3 88.7 80.2 73.7 65.2 92.5
Ves
sels
use
d fo
r ch
emic
al a
naly
sis
1 91.7 82.9 81.2 74.4 69.3 90.9 2 82.1 89.2 83.6 67.2 65.3 83.4 3 88.0 91.2 81.9 75.2 64.7 86.4 4 76.3 88.7 80.2 73.7 65.2 92.5 5 88.8 91.4 85.2 87.0 66.2 90.5 6 91.8 94.7 87.8 79.3 79.3 94.9

Raw data – Test with chironomids - Ag (chapter 13) 371
Table 263: NM-300K – Chironomid test: temperature (°C) and pH value.
Date 21.1.11 28.1.11 4.2.11 Temp °C pH Temp °C pH Temp °C pH
Con
trol
1
20.3
8.17
20.3
8.29
20.3
8.38 2 8.17 8.31 8.45 3 8.17 8.29 8.34 4 8.28 8.28 8.32
0.31
25 m
g/L 1 8.32 8.35 8.35
2 8.29 8.31 8.35 3 8.26 8.32 8.38 4 8.24 8.30 8.44
0.62
5 m
g/L
1 8.35 8.29 8.36 2 8.35 8.34 8.26 3 8.32 8.31 8.45 4 8.24 8.35 8.35
1.25
mg/
L
1 8.17 8.30 8.27 2 8.17 8.33 8.32 3 8.23 8.41 8.32 4 8.28 8.38 8.29
2.5
mg/
L
1 8.30 8.36 8.30 2 8.30 8.32 8.28 3 8.31 8.29 8.30 4 8.30 8.35 8.32
5 m
g/L
1 8.31 8.35 8.41 2 8.24 8.31 8.45 3 8.23 8.39 8.48 4 8.25 8.32 8.50
10 m
g/L
1 8.36 8.39 8.48 2 8.35 8.41 8.44 3 8.36 8.41 8.51 4 8.35 8.41 8.48
Ves
sels
for c
hem
ical
an
alys
is
1 8.23 7.99 8.46 2 8.14 8.00 8.40 3 8.28 8.21 8.41 4 8.32 8.20 8.51 5 8.28 8.32 8.46 6 8.31 8.29 8.66

Raw data – Test with chironomids - Ag (chapter 13) 372
Table 264: NM-300K – Chironomid test: number of hatched midges and sex.
Date 27.1.11 28.1.11 29.1.11 30.1.11 31.1.11 1.2.11 2.2.11 Day 15 16 17 18 19 20 21
Con
trol
1 - - - 3 - 3 - 5 3 1 2 - - 1 2 - - - 1 1 2 1 3 1 1 2 - 1 - 3 - - - - 2 1 - 1 2 2 3 1 - 1 4 - - - 2 - - 1 1 4 2 1 1 2 -
0.31
25 m
g/L 1 - - - - - - 1 - - 2 1 - 3 2
2 - - - - - - - 2 1 3 6 2 1 1 3 - - - - 1 2 - 1 - 3 1 2 5 - 4 - - - 2 - 1 1 2 3 2 4 - 1 1
0.62
5 m
g/L
1 - - - - - 4 1 2 1 3 2 2 1 - 2 - 2 - - - - - 1 - 1 2 1 4 1 3 - - - 1 - 3 - 6 1 - 5 1 1 - 4 - - - - - 2 - 3 1 2 4 3 1 -
1.25
mg/
L
1 - - - - - - - 2 - 1 1 - - 3 2 - - - - - - - 1 - 1 - 2 - 2 3 - - - - - - - - - 2 1 1 1 1 4 - - - - - - - - - - - - - 1
2.5
mg/
L
1 - - - - - - - - - - - - - - 2 - - - - - - - - - - - - - - 3 - - - - - - - - - - - - - - 4 - - - - - - - - - 1 1 - - 1
5 m
g/L
1 - - - - - - - - - - - - - - 2 - - - - - - - - - - - - - - 3 - - - - - - - - - - - - - - 4 - - - - - - - - - - - - - -
10 m
g/L
1 - - - - - - - - - - - - - - 2 - - - - - - - - - - - - - - 3 - - - - - - - - - - - - - - 4 - - - - - - - - - - - - - -
Ves
sels
for c
hem
ical
an
alys
is
K - - - - - 2 - 3 2 1 2 1 2 1 1 - - - - - - - 1 - - - - - 1 2 - - - 1 - 2 - 4 - 2 1 2 2 1 3 - - - - - 1 - 2 - 1 2 2* 1 1 4 - - - - - - - - - - - - - 3 5 - - - - - - - - - - - - - - 6 - - - - - - - - - - - - - -
* One male not completely hatched (organism laid on the water surface).
Continued

Raw data – Test with chironomids - Ag (chapter 13) 373
Table 264: NM-300K – Chironomid test: number of hatched midges and sex. continued
Date 3.2.11 4.2.11 5.2.11 6.2.11 7.2.11 8.2.11 9.2.11 Day 22 23 24 25 26 27 28
Con
trol
1 - - - - - - 1 - - - - - - - 2 3 - - - - - - 1 - - - - - - 3 1 - - - - - 1 - - - - - - - 4 1 - 1 - - - - - - - - - - -
0.31
25 m
g/L 1 1 3 3 - 1 - 1 - - - - - - -
2 1 - 1 - - - - - 1 - - - - - 3 - - 1 - 1 - 1 - 2 - - - - - 4 - - 1 - 1 - - - - - - - - -
0.62
5 m
g/L
1 - - - - - - ** - - - - - - 2 1 1 4 - - - 1 - - - - - - - 3 1 - - - 1 - - - - - - - - - 4 3 - - - 1 - - - - - - - - -
1.25
mg/
L
1 3 2 3 1 1 - - - - - - - - - 2 2 1 2 2 - 1 1 1 - - - - - - 3 - 1 3 - 1 - 4 - - - 1 2 - - 4 - 2 2 2 1 1 4 2 - - 1 - - -
2.5
mg/
L
1 - - - - - - - - - 1 - - - - 2 - - - - - - - - 1 - - - 2 - 3 - - - 1 - - 2 1 1 1 - 1 - 1 4 1 2 - 1 - - 1 1 - - - - - -
5 m
g/L
1 - - - - - - - - - - - - - - 2 - - - - - - - - - - - - - - 3 - - - - - - - - - - - - - - 4 - - - - - - - - - - - - - -
10 m
g/L
1 - - - - - - - - - - - - - - 2 - - - - - - - - - - - - - - 3 - - - - - - - - - - - - - - 4 - - - - - - - - - - - - - -
Ves
sels
for c
hem
ical
an
alys
is
K 1 - 1 - - - - - - - - - - - 1 1 2 2 4 1 - 1 - - - 1 2 1 - 2 - - - - - - 1 - 1 - - - - - 3 1 1 2 - - - 3 2 - - - - - - 4 - - 1 5 1 - - - - - 1 - 1 - 5 - - - - - - - - - - 1 - - - 6 - - - - - - - - - - - - - -
** One larva did not hatch (larva laid on the water surface

Raw data – Test with chironomids - Au (chapter14) 374
21.7 Raw data – Emergence test with chironomids (Au nanoparticles)
21.7.1 Chemical analysis
Day 0, Day 1 Measured value considering the different
wave length for determination measured value * dilution
dilution Au1978 3 Au2082 Au2427 Au1978 3 Au2082 Au2427
µg/L µg/L µg/L µg/L µg/L µg/L
Day 0 – stock suspensions
Control 10 -1.49 1 0.12 1 -3.06 1 -14.9 1 1.22 1 -30.6 1
Dispersant 10 -2.20 1 1.18 1 9.67 1 -22.0 1 11.8 1 96.7 1
NM-330 0.2% 10 5.31 2 9.95 2 0.42 1 53.1 2 100 2 4.2 1
NM-330 2 % 10 75.2 78.0 67.0 752 780 670
NM-330 20% 50 160 163 160 8010 8125 8005
NM-330 100% 200 219 221 205 43840 44100 41040
Day 1
NM-330DIS 10 -0.17 1 2.78 1 -2.48 1 -1.69 1 27.8 1 -24.8 1
NM-330 0.1% 10 3.45 2 4.24 2 1.00 1 34.5 2 42.4 2 10.0 1
NM-330 1 % 10 19.9 25.9 18.4 2 199 259 184 2
NM-330 10 % 10 125 130 119 1251 1299 1190
NM-330 50 % 100 117 120 115 11690 12020 11500
1Limit of detection; 2Limit of determination; 3used for calculation of concentration

Raw data – Test with chironomids - Au (chapter14) 375
Calibration for day 0, day 1 Measured value considering
the different wave length for determination
measured value * dilution Recovery
dilu-tion
nomi-nal
Au1978 1
Au2082 Au2427 Au1978 1
Au2082 Au2427 Au19781
Au2082 Au2427
µg/L µg/L µg/L µg/L µg/L µg/L rec % rec % rec %
nano Gold reference material (value not certified)
NIST 8011 A mg/L
250 51.56 205 211 202 51325 52850 50450 99.5 102.5 97.8
NIST 8011 B mg/L 250 51.56 204 204 201 50975 50900 50300 98.9 98.7 97.6
NIST 8011 A mg/L 250 51.56 204 205 197 51075 51250 49300 99.1 99.4 95.6
NIST 8011 B mg/L 250 51.56 203 204 205 50625 50950 51150 98.2 98.8 99.2
recalibration standard
Standard Au 50 µg/L
50 48.1 51.0 49.2 101 103 96.9
Standard Au 50 µg/L
50 47.0 49.3 51.8 99.5 103 103
Limit of detec-tion
50.4 51.7 48.4
Limit of deter-mination
49.7 51.3 51.3
1 used for calculation of concentration

Raw data – Test with chironomids - Au (chapter14) 376
Day 7 Measured value considering the different
wave length for determination measured value * dilution
dilution Au1978 3 Au2082 Au2427 Au1978 3 Au2082 Au2427
µg/L µg/L µg/L µg/L µg/L µg/L
Day 7
NM-330 0.1% 10 -0.099 1 7.42 2 -4.28 1 -0.986 1 74.2 2 -42.8 1
NM-330 1 % 10 3.89 2 11.9 5.56 2 38.9 2 119 55.6 2
NM-330 10 % 10 22.2 30.0 24.9 2 222 300 249 2
NM-330 50 % 50 91.2 94.5 90.8 4559 4724 4541
1Limit of detection; 2Limit of determination; 3used for calculation of concentration
Calibration for day 7 Measured value considering
the different wave length for determination
measured value * dilution Recovery
dilu-tion
nomi-nal
Au1978 1
Au2082 Au2427 Au1978 1
Au2082 Au2427 Au19781
Au2082 Au2427
µg/L µg/L µg/L µg/L µg/L µg/L rec % rec % rec %
nano Gold reference material (value not certified)
NIST 8011 A mg/L
250 51.56 201 203 203 50325 50625 50675 97.6 98.2 98.3
NIST 8011 B mg/L
250 51.56 200 202 198 49950 50450 49600 96.9 97.8 96.2
NIST 8011 A mg/L
250 51.56 207 205 204 51725 51200 50900 100 99.3 98.7
NIST 8011 B mg/L
250 51.56 202 202 203 50425 50550 50650 97.8 98.0 98.2
recalibration standard
Standard Au 50 µg/L
50 48.1 51.0 49.2 96.2 102 98.4
Standard Au 50 µg/L
50 47.0 49.3 51.8 94.0 98.6 104
Limit of detec-tion
4.29 3.21 7.50
Limit of deter-mination
14.3 10.7 25.0
1used for calculation of concentration

Raw data – Test with chironomids - Au (chapter14) 377
Day 28 Measured value considering the different
wave length for determination measured value * dilution
dilution Au1978 3 Au2082 Au2427 Au1978 3 Au2082 Au2427
µg/L µg/L µg/L µg/L µg/L µg/L
Day 28
NM-330 0.1% 10 0.156 1 4.15 2 -2.81 1 1.556 1 41.5 2 -28.1 1
NM-330 1 % 10 0.242 1 5.14 2^^ -1.81 1 2.42 1 51.4 2 -18.1 1
NM-330 10 % 10 -0.958 1 3.11 2 0.190 1 -9.58 1 31.1 2 2 1
NM-330 50 % 10 25.4 29.0 26.1 254 290 261
1Limit of detection; 2Limit of determination; 3used for calculation of concentration
Calibration for day 28 Measured value considering
the different wave length for determination
measured value * dilution Recovery
dilu-tion
nomi-nal
Au1978 1
Au2082 Au2427 Au1978 1
Au2082 Au2427 Au19781
Au2082 Au2427
µg/L µg/L µg/L µg/L µg/L µg/L rec % rec % rec %
nano Gold reference material (value not certified)
NIST 8011 A mg/L 750 66.2 67.5 70.1 750 49650 50640 52545 96.3 98.2 102
NIST 8011 B mg/L 750 68.7 68.2 69.7 750 51518 51158 52290 99.9 99.2 101
NIST 8011 A mg/L 3750 12.1 11.7 16.8 3750 45525 43838 63075 88.3 85.0 122
NIST 8011 B mg/L
3750 14.6 14.1 11.5 3750 54900 52763 43125 106 102 83.6
recalibration standard
Standard Au 50 µg/L
47.7 46.9 52.7 95.4 93.8 105
Standard Au 50 µg/L
48.0 47.4 48.1 95.9 94.9 96
Standard Au 12.5 µg/L
13.4 11.9 12.5 107 95.3 100
Limit of detec-tion
2.62 1.67 2.07
Limit of deter-mination
8.73 5.58 6.91
1used for calculation of concentration

Raw data – Test with chironomids - Au (chapter14) 378
Day 28 - sediment Measured value considering the different
wave length for determination measured value per kg sediment
dilution Au1978 3 Au2082 Au2427 Au1978 3 Au2082 Au2427
µg/L µg/L µg/L mg/kg mg/kg mg/kg
Control A 3.061 -4.54 1 76.1 4.73 1 -0.148 1 2.484 0.15 1
Control B 3.022 -3.77 1 77.4 7.93 1 -0.125 1 2.562 0.26 1
NM-330 0.1% A 3.058 -2.56 1 68.3 8.25 1 -0.084 1 2.235 0.27 1
NM-330 0.1% B 3.042 -1.88 80.6 10.5 2 -0.062 1 2.648 0.34 2
NM-330 1 % A 3.085 18.7 104 23.9 2 0.606 3.368 0.78 2
NM-330 1 % B 3.030 14.4 98.9 26.5 2 0.475 3.264 0.87 2
NM-330 10 % A 3.022 162 219 182 5.36 7.26 6.03
NM-330 10 % B 3.017 207 276 235 6.85 9.13 7.78
NM-330 50 % A 3.046 906 993 972 29.75 32.59 31.90
NM-330 50 % B 3.046 847 934 923 27.81 30.67 30.29
Limit of detec-tion 3.043 2.71 2.0 10.3 0.089 0.066 0.338
Limit of deter-mination 3.043 9.04 6.68 34.5 0.297 0.220 1.13
1Limit of detection; 2Limit of determination; 3used for calculation of concentration
Calibration for day 28 Measured value considering
the different wave length for determination
measured value * dilution Recovery
dilu-tion
nomi-nal
Au1978 1
Au2082 Au2427 Au1978 1
Au2082 Au2427 Au19781
Au2082 Au2427
µg/L µg/L µg/L µg/L µg/L µg/L rec % rec % rec %
nano Gold reference material (value not certified)
NIST 8011 A mg/L 250 51560 201 202 199 50150 50525 49850 97.3 98.0 96.7
NIST 8011 B mg/L 250 51560 199 204 199 49750 50875 49850 96.5 98.7 96.7
NIST 8011 A mg/L 250 51560 197 201 197 49125 50175 49175 95.3 97.3 95.4
NIST 8011 B mg/L 250 51560 199 200 199 49775 50100 49675 96.5 97.2 96.3
recalibration standard
Standard Au 50 µg/L
250 248 249 242 99.0 99.5 96.7
Standard Au 50 µg/L
250 248 248 204 99.0 99.2 81.7
1used for calculation of concentration

Raw data – Test with chironomids - Au (chapter14) 379
21.7.2 Ecotoxicological test
Table 265: Physico-chemical test parameters: control, NM-330DIS (dispersant).
Test start Test end
O2
%
Temp
°C
pH TH
mmol/l
NH4
mg/L
Light
lux
O2
%
Temp
°C
pH TH
mmol/l
NH4
mg/L
Light
lux
Con
trol
1 99.5
20
7.65 1.1 0.85
531
-
568
86.2
20
8.43 1.4 28
523
-
577
2 96.6 7.30 1.3 0.49 93.4 8.49 1.0 23
3 98.3 7.51 1.2 0.81 96.6 8.52 1.0 24
4 99.4 7.52 1.2 0.82 92.6 8.50 1.1 25
Dis
pers
ant
0.1%
1 98.5 7.60 90.1 8.49
2 96.7 7.42 87.1 8.49
3 99.0 7.47 89.2 8.49
4 96.0 7.43 87.7 8.46
Dis
pers
ant
1.0%
1 95.8 7.49 86.9 8.60
2 95.4 7.50 90.8 8.65
3 99.2 7.66 91.3 8.68
4 98.7 7.54 93.0 8.68
Dis
pers
ant
10%
1 90.1 7.71 89.8 9.26
2 95.6 7.63 94.5 9.37
3 97.7 7.57 92.9 9.33
4 98.3 7.69 92.0 9.32
Dis
pers
ant
50%
1 98.4 7.79 0.7 9.42
2 97.4 7.64 0.3 9.45
3 91.8 7.26 1.4 9.47
4 97.8 7.63 1.3 0.77 2.0 9.43 1.1 0.1
continued
Water hardness (TH): 1 mmol corresponds to 100 mg CaCo3 equivalent.

Raw data – Test with chironomids - Au (chapter14) 380
Table 265: Physico-chemical test parameters: control, NM-330DIS (dispersant). continued
Test start Test end
O2
%
Temp
°C
pH TH
mmol/l
NH4
mg/L
Light
lux
O2
%
Temp
°C
pH TH
mmol/l
NH4
mg/L
Light
lux
Gol
d 0.
1%
1 97.8
20
7.63
531
-
568
94.3
20
8.43
523
-
577
2 96.7 7.61 95.5 8.47
3 98.4 7.73 89.4 7.86
4 90.0 7.34 87.1 8.47
Gol
d 1.
0%
1 94.5 7.64 76.1 8.06
2 97.7 7.75 85.7 8.42
3 98.0 7.72 84.7 8.43
4 94.6 7.72 88.3 8.50
Gol
d 10
%
1 95.8 7.61 87.0 8.48
2 93.2 7.76 89.1 8.50
3 96.2 7.49 80.3 8.40
4 95.0 7.70 87.1 8.50
Gol
d 50
%
1 94.9 7.64 84.4 8.46
2 95.6 7.79 83.7 8.45
3 96.0 7.75 86.9 8.47
4 87.1 7.48 1.3 0.83 84.4 8.38 0.9 27
Ves
sels
use
d fo
r ch
emic
al a
naly
sis 1 91.5 7.41 80.3 8.33
2 95.5 7.57 79.5 8.45
3 88.4 7.34 79.9 8.38
4 93.0 7.37 80.1 8.46
Water hardness (TH): 1 mmol corresponds to 100 mg CaCo3 equivalent.

Raw data – Test with chironomids - Au (chapter14) 381
Table 266: Addition of Food (TetraMin grinded): control, NM-330DIS (dispersant).
Day -1
Day0
Day1
Day2
Day3
Day4
Day5
Day6
Day7
Day8
Day9
Day10
Day11
Day12
mg mg mg mg mg mg mg mg mg mg mg mg mg mg
Con
trol
1 10 - 21 - - 16 - 18 - 36 - - 32 -
2 10 - 21 - - 16 - 18 - 36 - - 32 -
3 10 - 21 - - 16 - 18 - 36 - - 32 -
4 10 - 21 - - 16 - 18 - 36 - - 32 -
Dis
pers
ant
0.1%
1 10 - 21 - - 16 - 18 - 36 - - 32 -
2 10 - 21 - - 16 - 18 - 36 - - 32 -
3 10 - 21 - - 16 - 18 - 36 - - 32 -
4 10 - 21 - - 16 - 18 - 36 - - 32 -
Dis
pers
ant
1.0%
1 10 - 21 - - 16 - 18 - 36 - - 32 -
2 10 - 21 - - 16 - 18 - 36 - - 32 -
3 10 - 21 - - 16 - 18 - 36 - - 32 -
4 10 - 21 - - 16 - 18 - 36 - - 32 -
Dis
pers
ant
10%
1 10 - 21 - - 16 - 18 - 36 - - 32 -
2 10 - 21 - - 16 - 18 - 36 - - 32 -
3 10 - 21 - - 16 - 18 - 36 - - 32 -
4 10 - 21 - - 16 - 18 - 36 - - 32 -
Dis
pers
ant
50%
1 10 - 21 - - 16 - 18 - 36 - - 32 -
2 10 - 21 - - 16 - 18 - 36 - - 32 -
3 10 - 21 - - 16 - 18 - 36 - - 32 -
4 10 - 21 - - 16 - 18 - 36 - - 32 -
Date 23.11 25.11 28.11 30.11 2.12 5.12
continued

Raw data – Test with chironomids - Au (chapter14) 382
Table 266: Addition of Food (TetraMin grinded): control, NM-330DIS (dispersant). continued
Day
13
Day
14
Day
15
Day
16
Day
17
Day
18
Day
19
Day
20
Day
21
Day
22
Day
23
Day
24
Day
25
Day
26
Day
27
mg mg mg mg mg mg mg mg mg mg mg mg mg mg mg
Con
trol
1 32 - 45.6 - - 28 - 14 - 6 - - 2 - 1
2 32 - 40.8 - - 10 - 4 - 6 - - 4 - 2
3 32 - 40.8 - - 6 - 6 - 6 - - 4 - 2
4 32 - 40.8 - - 12 - 6 - 0 - - 0 - 0
Dis
pers
ant
0.1%
1 32 - 48 - - 26 - 14 - 9 - - 2 - 1
2 32 - 45.6 - - 32 - 24 - 12 - - 2 - 0
3 32 - 45.6 - - 24 - 12 - 12 - - 6 - 2
4 32 - 48 - - 34 - 24 - 24 - - 4 - 1
Dis
pers
ant
1.0%
1 32 - 48 - - 30 - 26 - 33 - - 16 - 4
2 32 - 43.2 - - 28 - 24 - 30 - - 16 - 7
3 32 - 48 - - 30 - 18 - 15 - - 4 - 1
4 32 - 43.2 - - 16 - 10 - 9 - - 4 - 2
Dis
pers
ant
10%
1 32 - 45.6 - - 20 - 14 - 18 - - 6 - 3
2 32 - 45.6 - - 18 - 10 - 6 - - 2 - 1
3 32 - 48 - - 28 - 14 - 12 - - 8 - 2
4 32 - 40.8 - - 18 - 6 - 3 - - 2 - 0
Dis
pers
ant
50%
1 32 - 48 - - 40 - 40 -
*
- -
*
-
* 2 32 - 48 - - 40 - 40 - - - -
3 32 - 48 - - 40 - 40 - - - -
4 32 - 48 - - 40 - 40 - - - -
Date 7.12 9.12 12.12 14.12 16.12. 19.12 21.12
* No further feeding as organisms were dead
Continued

Raw data – Test with chironomids - Au (chapter14) 383
Table 266: Addition of Food (TetraMin grinded): control, NM-330DIS (dispersant). continued
Day -1
Day0
Day1
Day2
Day3
Day4
Day5
Day6
Day7
Day8
Day9
Day10
Day11
Day12
mg mg mg mg mg mg mg mg mg mg mg mg mg mg
Gol
d 0.
1%
1 10 - 21 - - 16 - 18 - 36 - - 32 -
2 10 - 21 - - 16 - 18 - 36 - - 32 -
3 10 - 21 - - 16 - 18 - 36 - - 32 -
4 10 - 21 - - 16 - 18 - 36 - - 32 -
Gol
d 1.
0%
1 10 - 21 - - 16 - 18 - 36 - - 32 -
2 10 - 21 - - 16 - 18 - 36 - - 32 -
3 10 - 21 - - 16 - 18 - 36 - - 32 -
4 10 - 21 - - 16 - 18 - 36 - - 32 -
Gol
d 10
%
1 10 - 21 - - 16 - 18 - 36 - - 32 -
2 10 - 21 - - 16 - 18 - 36 - - 32 -
3 10 - 21 - - 16 - 18 - 36 - - 32 -
4 10 - 21 - - 16 - 18 - 36 - - 32 -
Gol
d 50
%
1 10 - 21 - - 16 - 18 - 36 - - 32 -
2 10 - 21 - - 16 - 18 - 36 - - 32 -
3 10 - 21 - - 16 - 18 - 36 - - 32 -
4 10 - 21 - - 16 - 18 - 36 - - 32 -
Ves
sels
use
d fo
r ch
emic
al a
naly
sis 1 10 - 21 - - 16 - 18 - 36 - - 32 -
2 10 - 21 - - 16 - 18 - 36 - - 32 -
3 10 - 21 - - 16 - 18 - 36 - - 32 -
4 10 - 21 - - 16 - 18 - 36 - - 32 -
Date 23.11 25.11 28.11 30.11 2.12 5.12
continued
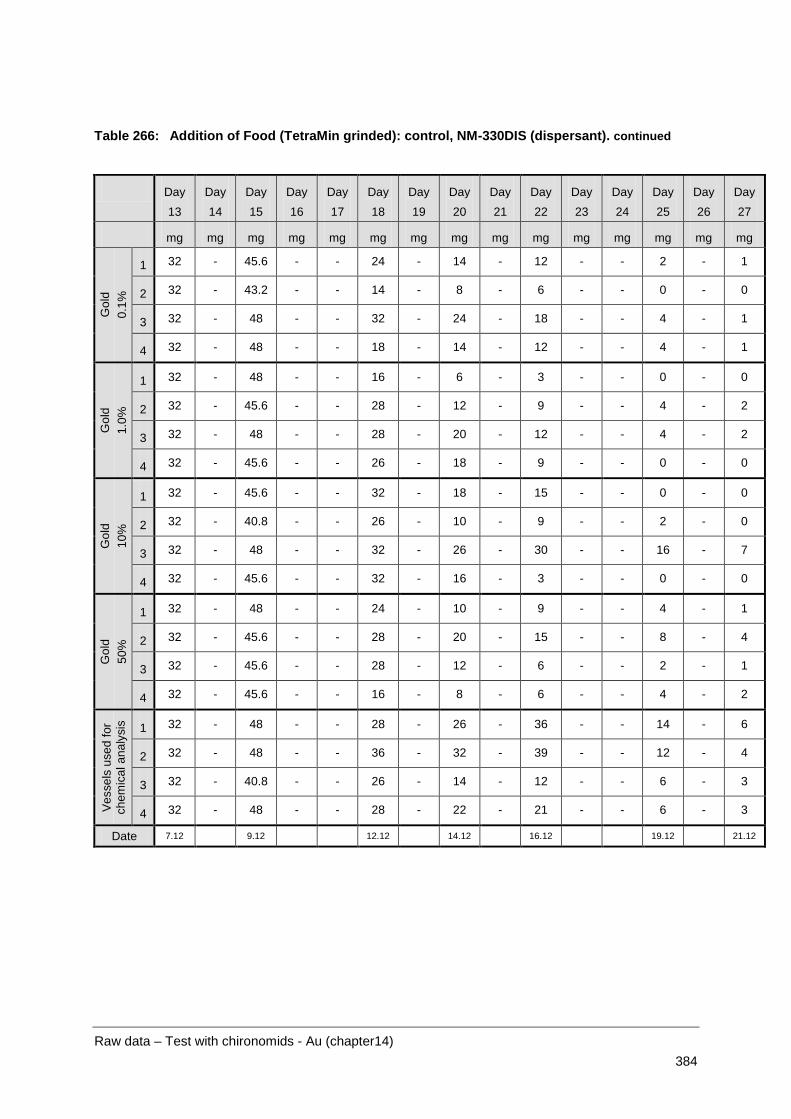
Raw data – Test with chironomids - Au (chapter14) 384
Table 266: Addition of Food (TetraMin grinded): control, NM-330DIS (dispersant). continued
Day 13
Day14
Day15
Day16
Day17
Day18
Day19
Day20
Day21
Day22
Day23
Day24
Day25
Day26
Day27
mg mg mg mg mg mg mg mg mg mg mg mg mg mg mg
Gol
d 0.
1%
1 32 - 45.6 - - 24 - 14 - 12 - - 2 - 1
2 32 - 43.2 - - 14 - 8 - 6 - - 0 - 0
3 32 - 48 - - 32 - 24 - 18 - - 4 - 1
4 32 - 48 - - 18 - 14 - 12 - - 4 - 1
Gol
d 1.
0%
1 32 - 48 - - 16 - 6 - 3 - - 0 - 0
2 32 - 45.6 - - 28 - 12 - 9 - - 4 - 2
3 32 - 48 - - 28 - 20 - 12 - - 4 - 2
4 32 - 45.6 - - 26 - 18 - 9 - - 0 - 0
Gol
d 10
%
1 32 - 45.6 - - 32 - 18 - 15 - - 0 - 0
2 32 - 40.8 - - 26 - 10 - 9 - - 2 - 0
3 32 - 48 - - 32 - 26 - 30 - - 16 - 7
4 32 - 45.6 - - 32 - 16 - 3 - - 0 - 0
Gol
d 50
%
1 32 - 48 - - 24 - 10 - 9 - - 4 - 1
2 32 - 45.6 - - 28 - 20 - 15 - - 8 - 4
3 32 - 45.6 - - 28 - 12 - 6 - - 2 - 1
4 32 - 45.6 - - 16 - 8 - 6 - - 4 - 2
Ves
sels
use
d fo
r ch
emic
al a
naly
sis 1 32 - 48 - - 28 - 26 - 36 - - 14 - 6
2 32 - 48 - - 36 - 32 - 39 - - 12 - 4
3 32 - 40.8 - - 26 - 14 - 12 - - 6 - 3
4 32 - 48 - - 28 - 22 - 21 - - 6 - 3
Date 7.12 9.12 12.12 14.12 16.12 19.12 21.12

Raw data – Test with chironomids - Au (chapter14) 385
Table 267: Oxygen concentration [%]: control, NM-330DIS (dispersant).
O2
%
O2
%
O2
%
O2
%
O2
%
O2
%
O2
%
O2
%
Con
trol
1 87.5 68.0 85.1
2 90.3 83.4
3 84.2 83.4
4 77.0 90.5
Dis
pers
ant
0.1%
1 76.1 73.9
2 88.0 80.8
3 74.1 86.4
4 71.4
Dis
pers
ant
1.0%
1 78.5 55.8 74.6
2 80.0 74.9
3 77.8 89.8
4 71.1
Dis
pers
ant
10%
1 36.1 74.9 74.0
2 74.3 62.3 88.1
3 82.1 71.9 92.2
4 82.3 73.5
Dis
pers
ant
50%
4.6 6.0٭ 1.6 83.6 49.4 1
3.1 1.5٭ 80.9 85.9 2
1.2 0.8٭ 45.8 74.8 3
2.5 1.3٭ 27.1 87.4 4
Date 29.11 30.11 2.12 6.12 9.12 12.12 16.12 20.12
* samples were aerated after the result of the low oxygen concentration was obtained, the samples were aerated;
oxygen concentration was determined again, no improvement was achieved

Raw data – Test with chironomids - Au (chapter14) 386
Table 268: Oxygen concentration [%]: NM-330 (gold nanoparticles in dispersant).
O2
%
O2
%
O2
%
O2
%
O2
%
O2
%
O2
%
O2
%
Gol
d 0.
1%
1 76.5 74.1
2 88.0 85.8
3 70.9 76.0
4 75.1
Gol
d 1.
0%
1 82.3 72.3
2 93.1 82.9
3 69.1 84.2
4 74.6
Gol
d 10
%
1 84.0 67.7
2 95.6 85.6
3 77.9 81.5
4 79.0
Gol
d 50
%
1 84.9 70.0
2 90.4 48.8
3 71.6 87.0
4 73.7
Ves
sels
use
d fo
r ch
emic
al a
naly
sis 1 78.3 87.5 67.3 60.7 4.0 52.6 83.8
2 71.3 90.9 67.0 61.6 66.2 71.1 83.8
3 85.2 91.8 65.5 72.0 65.0 77.6 83.9
4 80.6 80.6 69.7 62.1 65.6 78.1 82.5
Date 29.11 2.12 6.12 9.12 13.12 16.12 20.12

Raw data – Test with chironomids - Au (chapter14) 387
Table 269: Temperature (°C) and pH value: control, NM-330DIS (dispersant).
Date 2.12 9.12 16.12
Temp°C pH Temp°C pH Temp°C pH
Con
trol
1
20
7.93
20
7.08
20
8.50
2 8.13 8.27 8.56
3 8.14 8.32 8.43
4 8.11 8.29 8.43
Dis
pers
ant
0.1%
1 8.06 8.32 8.46
2 8.08 8.33 8.38
3 8.10 8.34 8.44
4 8.11 8.26 8.39
Dis
pers
ant
1.0%
1 8.25 8.48 8.53
2 8.21 8.37 8.50
3 8.25 8.53 8.58
4 8.33 8.49 8.67
Dis
pers
ant
10%
1 8.66 9.19 9.30
2 8.69 9.19 9.33
3 8.71 9.18 9.28
4 8.75 9.16 9.30
Dis
pers
ant
50%
1 6.70 8.97 9.29
2 6.76 8.95 9.35
3 6.72 8.21 9.28
4 6.68 8.86 9.37

Raw data – Test with chironomids - Au (chapter14) 388
Table 270: Temperature (°C) and pH value: NM-330 (gold nanoparticles in dispersant).
Date 2.12 9.12 16.12
Temp°C pH Temp°C pH Temp°C pH
Gol
d 0.
1%
1
20
7.82
20
8.16
20
8.30
2 7.82 8.23 8.36
3 7.90 8.22 8.28
4 7.93 8.30 8.34
Gol
d 1.
0%
1 7.94 8.22 8.39
2 7.98 8.17 8.37
3 7.97 8.16 8.38
4 8.03 8.19 8.30
Gol
d 10
%
1 8.03 8.27 8.34
2 8.06 8.30 8.37
3 8.04 8.11 8.22
4 8.03 8.30 8.39
Gol
d 50
%
1 8.04 8.27 8.37
2 8.04 8.19 8.23
3 8.07 8.23 8.39
4 8.07 8.18 8.43
Ves
sels
use
d fo
r ch
emic
al a
naly
sis 1 8.07 8.11 8.21
2 8.04 8.11 8.34
3 8.04 8.22 8.31
4 8.04 8.10 8.39

Raw data – Test with chironomids - Au (chapter14) 389
Table 271: Number of hatched midges and sex: control, NM-330DIS (dispersant).
Date 8.12 9.12 10.12 11.12 12.12 13.12 14.12
Day 14 15 16 17 18 19 20
Con
trol
1 - - - 1 - 1 1 2 - 1 3 2 1 1
2 - 2 - 1 4 2 3 1 2 - - - 1 2
3 - 2 - 1 1 3 2 2 6 - - - - -
4 - - - 3 - 2 2 4 2 1 2 - 1 -
Dis
pers
ant
0.1%
1 - - - - - 2 3 2 - - 2 1 2 1
2 - 1 - - - - 1 1 - 1 - 2 1 1
3 - - 1 - 1 3 - - 1 2 1 1 3 1
4 - - - - - - 1 2 - - 1 2 1 1
Dis
pers
ant
1.0%
1 - - - - - - 2 2 1 - 2 - - -
2 - - - 2 - 1 2 1 - - 1 1 - -
3 - - - - - 1 3 - 1 - 3 1 2 -
4 - 1 - 1 1 4 - 2 1 2 - 2 - 1
Dis
pers
ant
10%
1 - - - 1 3 2 - - 2 2 1 1 1 -
- 2 1 1 - 2 3 2 1 2 - - ٭ 2
3 - - - - - 2 - 3 - 1 2 1 4 1
4 - 1 - 2 2 3 - 2 - 1 2 3 - 1
Dis
pers
ant
50%
1 - - - - - - - - - - - - - -
2 - - - - - - - - - - - - - -
3 - - - - - - - - - - - - - -
4 - - - - - - - - - - - - -
.One organism hatched (organism laid on the water surface), no identification of sex٭
continued

Raw data – Test with chironomids - Au (chapter14) 390
Table 271: Number of hatched midges and sex: control, NM-330DIS (dispersant). (continued)
Date 15.12 16.12 17.12 18.12 19.12 20.12 21.12
Day 21 22 23 24 25 26 27
Con
trol
1 2 - 2 1 1 - - - - - - - - -
2 - - - - - - - - - - - - - -
3 - 1 - - - - - - - - - - - -
4 3 - - - - - - - - - - - - -
Dis
pers
ant
0,1%
1 2 2 - - - 1 - - 1 - - - - -
- - - 1 - 1 1 1 - - 1٭ 3 - 3 2
3 - 2 - - - - 1 - - - 1 - - -
4 3 - - 1 1 2 2 - 1 - - - 1 -
Dis
pers
ant
1,0%
1 - - 1 1 - - 2 - 1 - 3 1 - -
2 - 1 1 - - - - - 1 1 1 - - -
3 2 - 1 1 2 - - - - 1 1 - - -
4 - 2 - - - - - 1 - - - - - -
Dis
pers
ant
10%
1 1 - - - - - 1 1 1 - - - - -
2 1 - 2 - - - 1 - - - - - - -
3 1 - - 1 - - - - - - - 1 1 -
4 1 1 - - - - - - - - 1 - - -
Dis
pers
ant
50%
1 - - - - - - - - - - - - - -
2 - - - - - - - - - - - - - -
3 - - - - - - - - - - - - - -
4 - - - - - - - - - - - - - -
One dead (organism laid on the water surface), hatching half-finished٭
continued

Raw data – Test with chironomids - Au (chapter14) 391
Table 271: Number of hatched midges and sex: control, NM-330DIS (dispersant). (continued)
Date 22.12
Day 28
Con
trol
1 - -
2 - -
3 - -
4 - -
Dis
pers
ant
0,1%
1 - -
2 - -
3 - -
4 - -
Dis
pers
ant
1,0%
1 1 -
2 1 -
3 - -
4 - -
Dis
pers
ant
10%
1 - -
2 - -
3 - -
4 - -
Dis
pers
ant
50%
1 - -
2 - -
3 - -
4 - -

Raw data – Test with chironomids - Au (chapter14) 392
Table 272: Number of hatched midges and sex: NM-330 (gold nanoparticles in dispersant).
Date 8.12 9.12 10.12 11.12 12.12 13.12 14.12
Day 14 15 16 17 18 19 20
Gol
d 0,
1%
1 - - - 1 - - 2 1 1 3 2 1 - 2
2 - 1 - 1 - 1 3 2 2 3 1 1 1 -
3 - - - - - 1 - 1 1 1 - 1 2 1
- - ٭٭ 1 1 2 3 1 3 1 - - - - 4
Gol
d 1,
0%
1 - - - - - 6 1 1 1 3 2 - 2 1
2 - - - 1 - 1 - 1 1 2 3 2 3 -
3 - - - - - - - 2 1 3 - 2 1 1
4 - - - 1 - 1 - - 1 4 1 2 - 1
Gol
d 10
%
1 - - - 1 - - - 2 - 1 - 1 2 4
1 4 - 3 ٭ 1 - 1 1 2 - 1 - 2
3 - - - - - - - 2 - 2 - - 2 1
4 - - - 1 - - - 2 1 - 2 2 3 1
Gol
d 50
%
1 - - - - 1 2 - 1 1 3 1 1 2 3
2 - - - 1 - - 1 1 1 2 1 1 1 1
3 - - - 1 - 1 1 1 1 1 - 1 3 4
4 - - - 1 - 2 - 2 6 1 1 1 1 1
Ves
sels
use
d fo
r ch
emic
al a
naly
sis 1 - - - - - - - 1 1∞ 2 - - - 1
2 - - - - - - - 2 - - - - 1 1
٭٭٭1 1 1 2 - 2 - - 1 1 3 - - - 3
4 - - - - - 2 - 2 - 2 - - 2 1
continued
.One organism dead (organism laid on the water surface), not hatched, no identification of sex possible ٭
∞ Two organism dead (organism laid on the water surface), not hatched, no identification of sex possible.
.One dead (organism laid on the water surface), hatching half-finished ٭٭
.One dead (organism laid on the water surface) ٭٭٭

Raw data – Test with chironomids - Au (chapter14) 393
Table 272: Number of hatched midges and sex: NM-330 (gold nanoparticles in dispersant).
(continued)
Date 15.12 16.12 17.12 18.12 19.12 20.12 21.12
Day 21 22 23 24 25 26 27
Gol
d 0,
1%
1 2 - - 1 3 - - - - - - - - -
2 - 1 1 - 1 - - - 1 - - - - -
- 1 - - - 1 - 2 - 1 1 3 - ٭1 3
4 1 - 1 1 1 - 1 - - - 1 - - -
Gol
d 1,
0%
1 2 - - - - - 1 - - - - - - -
2 1 1 1 - - - - - 1 - - - - -
3 5 - 1 - 1 - - - - 1 - - - -
- - - - 1 - - - 1 1 - 1 3 ٭٭1 4
Gol
d 10
%
1 1+1
*** 1 - - 1 1 1 - 2 2 2 - - -
2 - 1 - 1 1 - 1 - - - 1 - - -
3 2 - 1 - 1 - - 1 - - - - 1 -
4 6 - 1 - - 1 - - - - - - - -
Gol
d 50
%
1 2 - - - - 1 - - - - 1 - - -
2 3 1 - 1 - - 1 - - - - - - -
3 1 3 - - - - 1 - - - - - - -
4 1 1 - - - - - - - - - - - -
Ves
sels
use
d fo
r ch
emic
al a
naly
sis 1 - 1 - - 3 - 1 1 - - 1 - - -
2 - 2 1 - 1 1 - 4 1 - 2 - - -
3 - 2 1 - - - 1 - - - - - - -
4 1 2 1 - 2 2 - - - - - - - -
One dead (organism laid on water surface), hatching half-finished ٭
** One dead (organism laid on water surface), hatching half-finished
One organism dead (organism laid on water surface), not hatched, no identification of sex possible ٭٭٭ continued
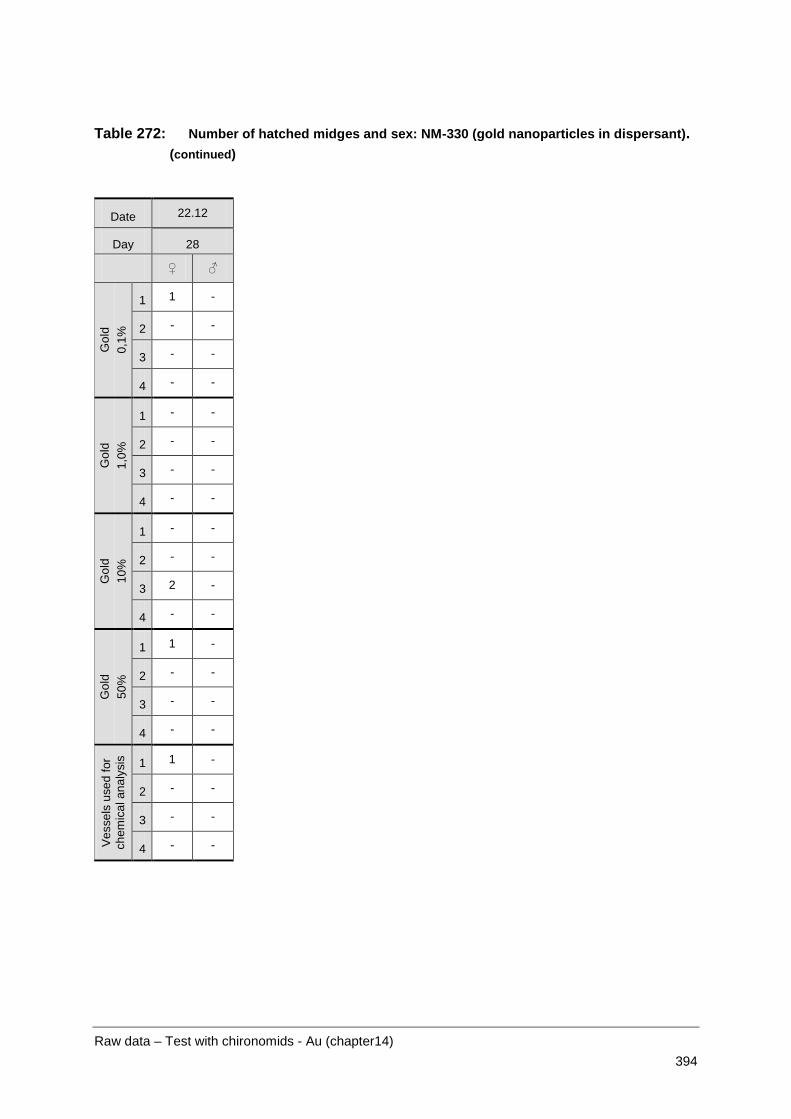
Raw data – Test with chironomids - Au (chapter14) 394
Table 272: Number of hatched midges and sex: NM-330 (gold nanoparticles in dispersant). (continued)
Date 22.12
Day 28
Gol
d 0,
1%
1 1 -
2 - -
3 - -
4 - -
Gol
d 1,
0%
1 - -
2 - -
3 - -
4 - -
Gol
d 10
%
1 - -
2 - -
3 2 -
4 - -
Gol
d 50
%
1 1 -
2 - -
3 - -
4 - -
Ves
sels
use
d fo
r ch
emic
al a
naly
sis 1 1 -
2 - -
3 - -
4 - -

Raw data – Reproduction test with daphnids (chapter 15) 395
21.8 Raw data – Reproduction test with daphnids (chapter 15)
21.8.1 P25 - first test
Table 273: P25 (1st test) – Test with daphnids: Ti concentrations.
Day 0, 7, 14: freshly prepared suspensions; day 2, 9, 16: supernatant after incubation of the sus-pensions for two days in the test vessels
Nominal Ti3372 Recovery Ti3372 Recovery [µg/L] [µg/L] % [µg/L] % Day 0 Day 2 Control 1 --- < LOD --- < LOD --- Control 2 --- < LOD --- < LOD --- 0.05 mg/LTiO2 30.0 20.7 69.1 7.20 24.0 0.05 mg/LTiO2 30.0 20.1 67.2 3.44 11.5 0.1 mg/LTiO2 59.9 --- --- 8.91 14.9 0.1 mg/LTiO2 59.9 38.1 63.6 9.54 15.9 0.5 mg/LTiO2 300 193 64.4 41.1 13.7 0.5 mg/LTiO2 300 196 65.4 46.4 15.5 1.0 mg/LTiO2 599 450 75.1 89.4 14.9 1.0 mg/LTiO2 599 420 70.1 117 19.5 5.0 mg/LTiO2 2997 2570 85.8 75.3 12.6 5.0 mg/LTiO2 2997 2487 83.0 91.7 15.3 20 mg/L stock suspension 11986 10728 89.5 20 mg/L stock suspension 11986 10793 90.0 Medium + TiO2 85 mg/L 83103 90960 109 80140 96.4 Medium + TiO2 85 mg/L 83103 91440 110 79380 95.5 Medium + TiO2 85 mg/L 83103 88300 106 80720 97.1 Medium + TiO2 85 mg/L 83103 90720 109 80160 96.5 Detection limit 5.64 1.67 Quantification limit 18.8 5.58
Continued

Raw data – Reproduction test with daphnids (chapter 15) 396
Table 273: P25 (1st test) – Test with daphnids: Ti concentrations. continued
Nominal Ti3372 Recovery Ti3372 Recovery [µg/L] [µg/L] % [µg/L] % Day 7 Day 9 Control 1 --- < LOD --- < LOD --- Control 2 --- < LOD --- < LOD --- 0.05 mg/LTiO2 30.0 19.2 64.2 1.02 3.40 0.05 mg/LTiO2 30.0 19.1 63.8 0.86 2.86 0.1 mg/LTiO2 59.9 36.0 60.0 2.70 4.51 0.1 mg/LTiO2 59.9 38.2 63.7 1.99 3.33 0.5 mg/LTiO2 300 212 70.7 7.7 2.56 0.5 mg/LTiO2 300 189 63.0 9.3 3.11 1.0 mg/LTiO2 599 434 72.4 18.4 3.07 1.0 mg/LTiO2 599 434 72.4 23.3 3.89 5.0 mg/LTiO2 2997 2285 76.3 130 4.34 5.0 mg/LTiO2 2997 2308 77.0 136 4.55 20 mg/L stock suspension 11986 10045 83.8 20 mg/L stock suspension 11986 10870 90.7 Medium + TiO2 85mg/L 83103 83040 99.9 77500 93.3 Medium + TiO2 85mg/L 83103 82320 99.1 77240 92.9 Medium + TiO2 85mg/L 83103 79960 96.2 78540 94.5 Medium + TiO2 85mg/L 83103 81520 98.1 77240 92.9 Detection limit 4.74 2.06 Quantification limit 15.8 6.88
Continued
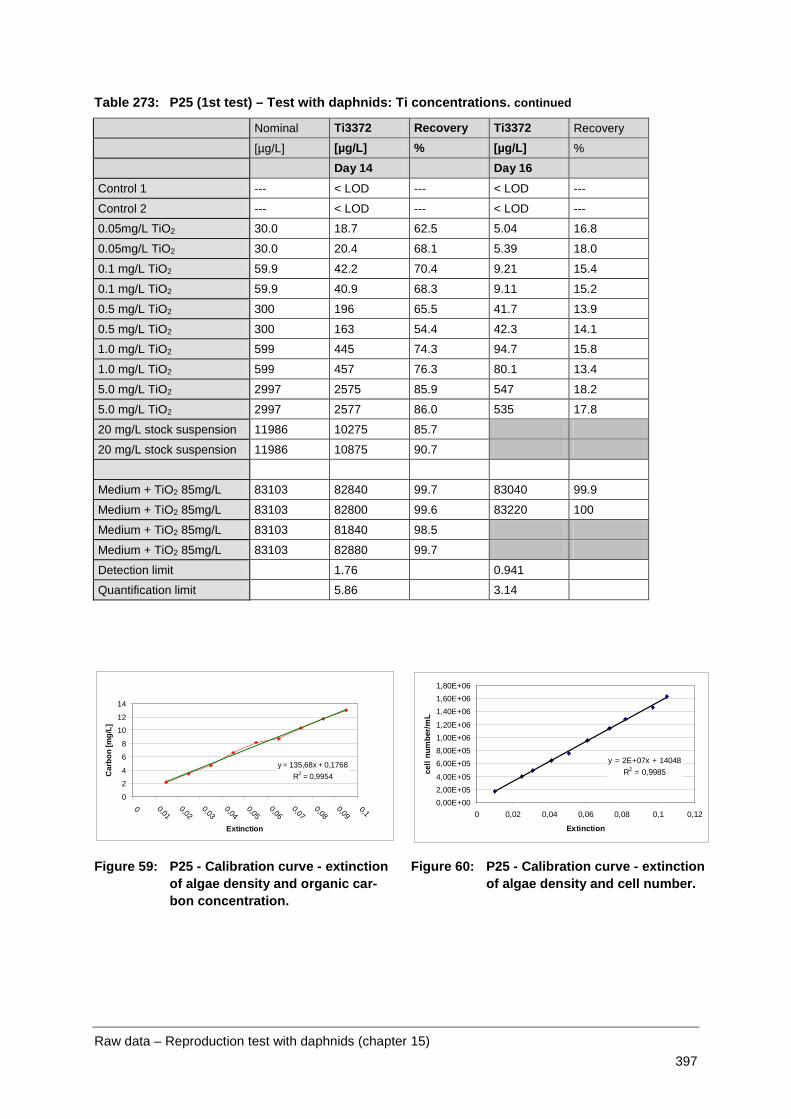
Raw data – Reproduction test with daphnids (chapter 15) 397
Table 273: P25 (1st test) – Test with daphnids: Ti concentrations. continued
Nominal Ti3372 Recovery Ti3372 Recovery
[µg/L] [µg/L] % [µg/L] %
Day 14 Day 16
Control 1 --- < LOD --- < LOD ---
Control 2 --- < LOD --- < LOD ---
0.05mg/L TiO2 30.0 18.7 62.5 5.04 16.8
0.05mg/L TiO2 30.0 20.4 68.1 5.39 18.0
0.1 mg/L TiO2 59.9 42.2 70.4 9.21 15.4
0.1 mg/L TiO2 59.9 40.9 68.3 9.11 15.2
0.5 mg/L TiO2 300 196 65.5 41.7 13.9
0.5 mg/L TiO2 300 163 54.4 42.3 14.1
1.0 mg/L TiO2 599 445 74.3 94.7 15.8
1.0 mg/L TiO2 599 457 76.3 80.1 13.4
5.0 mg/L TiO2 2997 2575 85.9 547 18.2
5.0 mg/L TiO2 2997 2577 86.0 535 17.8
20 mg/L stock suspension 11986 10275 85.7
20 mg/L stock suspension 11986 10875 90.7
Medium + TiO2 85mg/L 83103 82840 99.7 83040 99.9
Medium + TiO2 85mg/L 83103 82800 99.6 83220 100
Medium + TiO2 85mg/L 83103 81840 98.5
Medium + TiO2 85mg/L 83103 82880 99.7
Detection limit 1.76 0.941
Quantification limit 5.86 3.14
y = 135,68x + 0,1768R2 = 0,9954
0
2
4
6
8
10
12
14
0 0,010,02
0,030,04
0,050,06
0,070,08
0,090,1
Extinction
Car
bon
[mg/
L]
y = 2E+07x + 14048R2 = 0,9985
0,00E+002,00E+054,00E+05
6,00E+058,00E+051,00E+061,20E+06
1,40E+061,60E+061,80E+06
0 0,02 0,04 0,06 0,08 0,1 0,12
Extinction
cell
num
ber/m
L
Figure 59: P25 - Calibration curve - extinction of algae density and organic car-bon concentration.
Figure 60: P25 - Calibration curve - extinction of algae density and cell number.

Raw data – Reproduction test with daphnids (chapter 15) 398
Table 274: P25 (1st test) – Test with daphnids: oxygen saturation of the overlaying water. Values of the parallel test vessels throughout test duration [mg/L]: concentrations given as nominal concentrations of TiO2
Date Control 0.05 mg/L 0.1 mg/L 0.5 mg/L 1.0 mg/L 5.0 mg/L aged new aged new aged new aged new aged new aged new
Start 8.6 8.5 8.5 8.4 8.5 8.5
Day 2 8.7 8.0 8.5 7.8 8.4 7.8 8.1 7.8 8.2 8.0 8.1 8.1
Day 5 9.0 7.9 8.3 8.0 8.3 8.1 8.6 8.0 8.4 8.3 9.0 8.0
Day 7 8.7 8.1 8.7 8.0 8.5 8.1 8.6 8.1 8.6 8.1 8.9 8.1
Day 9 8.0 7.9 8.0 7.9 8.1 8.0 8.1 7.5 8.1 8.0 8.2 7.9
Day 12 7.8 8.4 7.8 8.3 7.8 8.3 7.9 8.3 7.8 8.2 7.9 8.1
Day 14 7.5 7.9 7.4 7.9 7.7 7.9 7.5 7.7 7.6 7.9 7.4 7.9
Day 16 8.1 8.4 7.6 8.2 7.3 8.0 7.6 7.9 7.4 7.9 8.0 8.1
Day 19 7.5 8.2 7.5 8.1 7.4 7.1 7.6 8.2 7.4 8.1 7.4 8.1
Day 21 7.8 7.6 7.7 7.6 7.8 7.4
Table 275: P25 (1st test) – Test with daphnids: pH of the overlaying water. Values of the parallel test vessels throughout test duration; concentrations given as nominal con-centrations of TiO2
Date Control 0.05 mg/L 0.1 mg/L 0.5 mg/L 1.0 mg/L 5.0 mg/L aged new aged new aged new aged new aged new aged new
Start 8.5 8.5 8.4 8.5 8.5 8.5
Day 2 8.7 8.5 8.8 8.4 8.7 8.4 8.7 8.4 8.7 8.4 8.7 8.4
Day 5 8.8 8.5 8.8 8.6 8.8 8.6 8.8 8.6 8.8 8.5 8.8 8.5
Day 7 7.8 8.0 8.4 8.3 8.5 8.3 8.6 8.4 8.6 8.4 8.7 8.4
Day 9 8.2 8.0 8.3 8.0 8.3 8.0 8.4 8.0 8.3 8.0 8.4 8.0
Day 12 8.3 8.4 8.4 8.4 8.4 8.4 8.3 8.4 8.3 8.4 8.4 8.4
Day 14 8.2 8.3 8.2 8.3 8.2 8.3 8.3 8.3 8.3 8.3 8.3 8.3
Day 16 8.0 8.0 8.1 8.1 8.1 8.1 8.1 8.1 8.2 8.1 8.2 8.1
Day 19 8.2 8.3 8.3 8.5 8.3 8.5 8.3 8.5 8.3 8.5 8.3 8.5
Day 21 8.3 8.4 8.4 8.5 8.4 8.2
Table 276: P25 (1st test) – Test with daphnids: temperature of the overlaying water [°C]. Measured in the climatic chamber
Day 0 Day 2 Day 5 Day 7 Day 9
20.7 21.0 21.0 21.0 21.1
Day 12 Day 14 Day 16 Day 19 Day 21
21.3 21.2 20.9 20.7 20.7

Raw data – Reproduction test with daphnids (chapter 15) 399
Table 277: P25 (1st test) – Test with daphnids: light intensity [lux]. Measured in the climatic chamber
Day 0 Day 2 Day 5 Day 7 Day 9
585 571 575 592 564
Day 12 Day 14 Day 16 Day 19 Day 21
585 579 563 587 591
Table 278: P25 (1st test) – Test with daphnids: extinction (585 nm) as measure for the density of algae used as feed.
Day 0 Day 2 Day 5 Day 7 Day 9
0.015 0.025 0.035 0.045 0.055
Day 12 Day 14 Day 16 Day 19 Day 21
0.065 0.075 0.090 0.100 ---
Table 279: P25 (1st test) – Test with daphnids: offspring per replicate and day. Concentrations given as nominal concentrations of TiO2
Replicate Control 0.05 mg/L 0.1 mg/L 0.5 mg/L 1.0 mg/L 5.0 mg/L
Day 6
1 0 0 0 0 0 0
2 0 0 0 0 0 0
3 0 0 0 0 0 0
4 0 0 0 0 0 0
5 0 0 0 0 0 0
6 0 0 0 0 0 0
7 0 0 0 0 0 0
8 0 0 0 0 0 0
9 0 0 0 0 0 0
10 0 0 0 0 0 0
Day 7
1 0 0 0 0 0 0
2 0 0 0 0 0 0
3 0 0 0 0 0 0
4 0 0 0 0 0 0
5 0 0 0 0 0 0
6 0 0 0 0 0 0
7 0 0 0 0 0 0
8 0 0 0 0 0 0
9 0 0 0 0 0 0
10 0 0 0 0 0 0
Continued

Raw data – Reproduction test with daphnids (chapter 15) 400
Table 279: P25 (1st test) – Test with daphnids: offspring per replicate and day. continued
Replicate Control 0.05 mg/L 0.1 mg/L 0.5 mg/L 1.0 mg/L 5.0 mg/L
Day 8
1 0 0 0 0 0 0
2 0 0 0 0 0 0
3 0 0 0 0 0 0
4 0 0 8 0 0 0
5 0 0 0 0 0 0
6 0 0 0 0 0 0
7 0 0 0 0 0 0
8 0 0 0 0 0 0
9 0 0 0 0 0 0
10 0 0 13 0 0 0
Day 9
1 0 3 10 2 0 0
2 0 0 0 4 0 0
3 15 0 0 4 0 0
4 0 0 0 0 5 0
5 0 2 0 9 0 0
6 12 0 0 0 0 0
7 0 9 0 0 10 0
8 9 0 0 7 14 0
9 0 9 2 11 0 0
10 0 0 2 5 4 0
Day 10
1 0 0 0 0 12 0
2 0 5 0 0 0 10
3 0 0 15 0 0 12
4 19 0 0 17 0 0
5 19 0 0 0 9 12
6 0 0 13 14 17 12
7 18 0 12 0 0 18
8 0 20 0 0 0 17
9 16 0 0 0 0 8
10 0 0 0 0 0 0
Continued

Raw data – Reproduction test with daphnids (chapter 15) 401
Table 279: P25 (1st test) – Test with daphnids: offspring per replicate and day. continued
Replicate Control 0.05 mg/L 0.1 mg/L 0.5 mg/L 1.0 mg/L 5.0 mg/L
Day 12
1 12 14 18 23 0 12
2 0 0 11 0 12 0
3 19 9 0 17 23 0
4 0 17 20 0 19 15
5 0 17 13 17 7 0
6 24 13 1 0 0 0
7 0 20 0 16 16 0
8 21 0 17 25 27 0
9 0 16 17 17 13 0
10 14 18 12 17 20 12
Day 14
1 22 0 0 0 15 19
2 17 20 22 24 29 21
3 0 19 27 0 0 23
4 27 0 0 27 0 22
5 25 0 26 0 21 26
6 0 0 22 21 24 19
7 24 0 25 23 0 26
8 0 32 0 0 0 19
9 30 0 0 0 26 13
10 20 0 0 0 0 19
Day 16
1 0 23 25 27 0 0
2 21 27 0 22 0 0
3 29 0 33 30 24 0
4 0 28 30 0 27 0
5 0 33 0 24 0 0
6 24 25 0 0 0 0
7 0 31 0 0 26 0
8 30 0 27 29 25 0
9 0 24 24 20 0 0
10 0 29 27 26 23 0
Continued

Raw data – Reproduction test with daphnids (chapter 15) 402
Table 279: P25 (1st test) – Test with daphnids: offspring per replicate and day. continued
Replicate Control 0.05 mg/L 0.1 mg/L 0.5 mg/L 1.0 mg/L 5.0 mg/L
Day 19
1 23 32 27 22 27 22
2 0 19 29 0 25 25
3 30 21 0 30 32 26
4 28 27 31 27 30 21
5 30 33 20 27 26 28
6 28 26 22 27 23 20
7 29 31 25 19 26 25
8 31 34 21 26 27 27
9 33 29 28 27 19 16
10 21 27 32 29 27 18
Day 21
1 1 0 0 3 28 23
2 25 0 26 18 30 30
3 0 25 31 0 0 33
4 32 0 20 27 0 19
5 34 0 28 0 23 29
6 0 0 31 3 24 26
7 27 0 26 29 0 33
8 0 35 0 0 0 28
9 34 0 0 0 25 24
10 31 0 0 0 0 23

Raw data – Reproduction test with daphnids (chapter 15) 403
21.8.2 P25 - second test
Table 280: P25 (2nd test) - Test with daphnids: Ti concentration.
(day 0, 7, 14: freshly prepared suspensions; day 2, 9, 16: supernatant after incubation of the sus-pensions for two days in the test vessels
Nominal Ti3372 Recovery Ti3372 Recovery Ti3372 Recovery [µg/L] [µg/L] % [µg/L] % [µg/L] % Day 0 Day 1
(daily renewal of medium)
Day 2 (renewal of me-dium three times a week)
Control 1 --- < LOD --- < LOD --- < LOD --- Control 2 --- < LOD --- < LOD --- < LOD --- 1.0 mg/LTiO2 599 564 94.0 163 27.2 65.6 10.9 1.0 mg/LTiO2 599 574 95.7 202 33.7 63.3 10.6 5.0 mg/LTiO2 2997 2540 84.8 673 22.4 260 8.67 5.0 mg/LTiO2 2997 2353 78.5 683 22.8 258 8.62 20 mg/L stock suspension 11986 10100 84.3 20 mg/L stock suspension 11986 10170 84.8 Medium + TiO2 85 mg/L 83103 82840 99.7 82840 99.7 82840 99.7 Medium + TiO2 85 mg/L 83103 82800 99.6 82800 99.6 82800 99.6 Detection limit 5.99 5.99 5.99 Quantification limit 20.0 20.0 20.0
Continued

Raw data – Reproduction test with daphnids (chapter 15) 404
Table 280: P25 (2nd test) - Test with daphnids: Ti concentration, continued
Nominal Ti3372 recovery Ti3372 recovery Ti3372 recovery [µg/L] [µg/L] % [µg/L] % [µg/L] % Day 7 Day 8
(daily renewal of medium)
Day 9 (renewal of me-dium three times a week)
Control 1 --- < LOD --- < LOD --- < LOD --- Control 2 --- < LOD --- < LOD --- < LOD --- 1.0 mg/LTiO2 599 513 85.6 254 42.4 230 38.4 1.0 mg/LTiO2 599 509 84.9 254 42.3 230 38.4 5.0 mg/LTiO2 2997 2675 89.3 1124 37.5 826 27.6 5.0 mg/LTiO2 2997 2665 88.9 1131 37.7 828 27.6 20 mg/L stock suspension 11986 10930 91.2 20 mg/L stock suspension 11986 11233 93.7 Medium + TiO2 85mg/L; 1 : 200 83103 85340 103 85340 103 85340 103
Medium + TiO2 85mg/L; 1 : 200 83103 83380 100 83380 100 83380 100
Medium + TiO2 85mg/L; 1 : 200 83103 85200 103 85200 103 85200 103
Medium + TiO2 85mg/L; 1 : 2000 83103 83720 101 83720 101 83720 101
Medium + TiO2 85mg/L; 1 : 2000 83103 83740 101 83740 101 83740 101
Medium + TiO2 85mg/L; 1 : 2000 83103 81660 98.3 81660 98.3 81660 98.3
TiO2 250 µg/L 250 257 103 257 103 257 103 TiO2 250 µg/L 250 257 103 257 103 257 103 TiO2 250 µg/L 250 254 102 254 102 254 102 CPI 100 µg/L 100 101 101 101 101 101 101 CPI 100 µg/L 100 101 101 101 101 101 101 Detection limit 8.09 8.09 8.09 Quantification limit 27.0 27.0 27.0
Continued

Raw data – Reproduction test with daphnids (chapter 15) 405
Table 280: P25 (2nd test) - Test with daphnids: Ti concentration. continued
Nominal Ti3372 recovery Ti3372 recovery Ti3372 recovery [µg/L] [µg/L] % [µg/L] % [µg/L] % Day 14 Day 15
(daily renewal of medium)
Day 16 (renewal of me-dium three times a week)
Control 1 --- < LOD --- < LOD --- < LOD --- Control 2 --- < LOD --- < LOD --- < LOD --- 1.0 mg/LTiO2 599 616 103 295 49.2 464 77.4 1.0 mg/LTiO2 599 620 103 297 49.5 464 77.4 5.0 mg/LTiO2 2997 2978 99.4 1268 42.3 685 22.8 5.0 mg/LTiO2 2997 2961 98.8 1274 42.5 696 23.2 20 mg/L stock suspension 11986 12178 102 20 mg/L stock suspension 11986 12108 101 Medium + TiO2 85mg/L; 1 : 200 83103 85340 103 85340 103 85340 103
Medium + TiO2 85mg/L; 1 : 200 83103 83380 100 83380 100 83380 100
Medium + TiO2 85mg/L; 1 : 200 83103 85200 103 85200 103 85200 103
Medium + TiO2 85mg/L; 1 : 2000 83103 83720 101 83720 101 83720 101
Medium + TiO2 85mg/L; 1 : 2000 83103 83740 101 83740 101 83740 101
Medium + TiO2 85mg/L; 1 : 2000 83103 81660 98.3 81660 98.3 81660 98.3
TiO2 250 µg/L 250 257 103 257 103 257 103 TiO2 250 µg/L 250 257 103 257 103 257 103 TiO2 250 µg/L 250 254 102 254 102 254 102 CPI 100 µg/L 100 101 101 101 101 101 101 CPI 100 µg/L 100 101 101 101 101 101 101 Detection limit 8.09 8.09 8.09 Quantification limit 27.0 27.0 27.0

Raw data – Reproduction test with daphnids (chapter 15) 406
Table 281: P25 (2nd test) – Test with daphnids: oxygen saturation of the overlaying water.
Values of the parallel test vessels throughout test duration [mg/L]; concentrations given as nominal concentrations of TiO2
Date Control 1 mg/L 5 mg/L Control 1.0 mg/L 5.0 mg/L
Medium renewal three times a week Daily medium renewal aged new aged new aged new aged new aged new aged new
Start 9.0 8.6 9.0
Day 1 8.3 8.5 8.3 8.2 8.3 8.4
Day 2 8.7 8.9 8.4 8.5 8.3 8.6 8.7 8.9 8.5 8.3 8.6 8.4
Day 3 8.9 8.3 8.5 8.5 8.7 8.5
Day 4 8.2 8.2 7.5 8.2 8.2 8.2
Day 5 8.6 8.4 8.3 8.5 8.5 8.3 8.7 8.4 8.5 8.4 8.6 8.6
Day 6 9.0 8.8 8.7 8.4 8.5 8.3
Day 7 8.1 8.2 8.0 8.1 8.3 8.3 8.4 8.2 8.6 8.0 8.1 8.0
Day 8 8.1 8.1 8.2 7.8 8.1 8.1
Day 9 8.6 7.6 8.3 8.0 8.4 8.2 8.6 7.6 8.8 8.3 8.6 8.0
Day 10 9.1 8.0 8.4 8.3 8.8 8.5
Day 11 8.6 8.3 8.7 8.2 8.6 8.0
Day 12 8.5 8.3 7.9 7.6 7.9 7.7 8.3 8.3 8.3 8.3 8.3 7.7
Day 13 8.6 8.1 8.5 8.1 8.4 8.3
Day 14 8.3 8.3 8.0 8.2 8.0 8.3 8.4 8.3 8.5 7.9 8.3 8.3
Day 15 9.6 8.5 9.4 8.4 9.4 8.3
Day 16 7.9 7.9 8.6 8.1 8.5 8.3 8.6 7.9 8.8 7.7 8.3 8.3
Day 17 8.6 8.0 8.7 8.2 8.7 8.1
Day 18 8.1 7.8 8.3 8.3 8.4 8.0
Day 19 7.8 8.6 8.2 8.9 7.8 8.7 8.4 8.6 8.9 8.3 8.3 8.8
Day 20 8.9 8.3 9.5 8.2 9.3 8.6
Day 21 9.4 9.3 8.9 10.0 9.6 10.2

Raw data – Reproduction test with daphnids (chapter 15) 407
Table 282: P25 (2nd test) – Test with daphnids: pH of the overlaying water. Values of the parallel test vessels throughout test duration; concentrations given as nominal con-centrations of TiO2
Date Control 1 mg/L 5 mg/L Control 1.0 mg/L 5.0 mg/L
Medium renewal three times a week Daily medium renewal aged new aged new aged new aged new aged new aged new
Start 8.3 8.3 8.3 8.3 8.3 8.3
Day 1 8.4 8.3 8.4 8.3 8.4 8.3
Day 2 8.5 7.9 8.6 8.4 8.6 8.2 8.6 7.9 8.6 8.4 8.4 8.3
Day 3 8.5 8.2 8.6 8.1 8.6 8.1
Day 4 8.4 8.2 8.5 8.2 8.5 8.2
Day 5 8.7 8.0 8.6 8.0 8.6 8.0 8.5 8.0 8.5 8.0 8.5 8.0
Day 6 8.4 8.2 8.5 8.3 8.5 8.2
Day 7 8.7 8.4 8.6 8.4 8.6 8.4 8.6 8.4 8.7 8.4 8.6 8.4
Day 8 8.7 8.2 8.8 8.2 8.7 8.2
Day 9 8.3 8.4 8.7 8.3 8.7 8.3 8.7 8.4 8.8 8.4 8.7 8.4
Day 10 8.8 8.2 8.9 8.2 8.8 8.2
Day 11 8.3 8.1 8.5 8.1 8.5 8.1
Day 12 8.7 8.3 8.5 8.3 8.5 8.3 8.7 8.3 8.7 8.3 8.6 8.3
Day 13 8.5 8.3 8.6 8.3 8.6 8.1
Day 14 8.7 8.5 8.6 8.4 8.7 8.4 8.7 8.5 8.8 8.5 8.7 8.4
Day 15 8.9 8.2 8.9 8.3 8.9 8.3
Day 16 8.7 8.1 8.7 8.3 8.6 8.2 8.4 8.1 8.6 8.1 8.6 8.3
Day 17 8.9 8.5 8.9 8.4 8.9 8.4
Day 18 8.4 8.2 8.6 8.2 8.6 8.2
Day 19 8.6 8.0 8.5 8.2 8.5 8.3 8.7 8.0 9.0 8.2 8.9 8.3
Day 20 8.9 8.3 9.0 8.3 9.0 8.3
Day 21 8.9 8.9 8.8 9.1 8.9 8.1
Table 283: P25 (2nd test) – Test with daphnids: temperature of the overlaying water [°C] in the climatic chamber.
Day 0 Day 2 Day 5 Day 7 Day 9
20.1 19.9 20.6 20.5 20.5
Day 12 Day 14 Day 16 Day 19 Day 21
20.4 20.5 20.3 20.1 20.5
Table 284: P25 (2nd test) – Test with daphnids: light intensity [lux] in the climatic chamber.
Day 0 Day 2 Day 5 Day 7 Day 9
562 581 607 592 560
Day 12 Day 14 Day 16 Day 19 Day 21
572 567 580 567 573
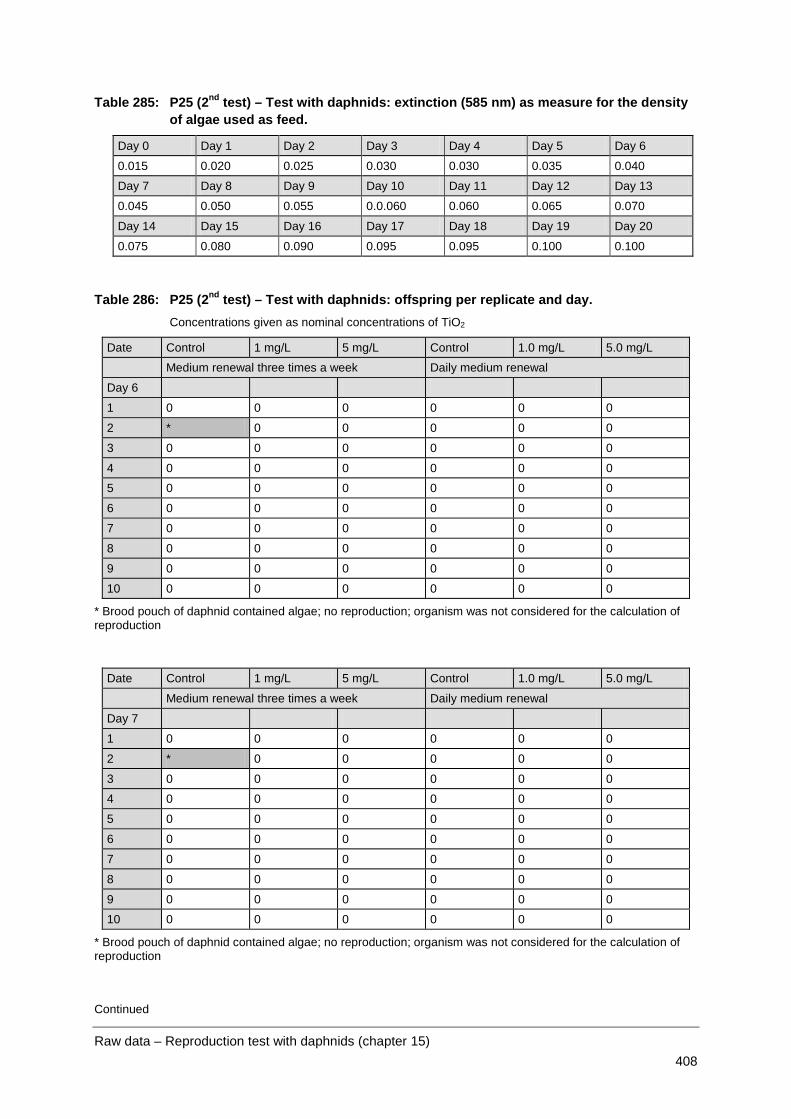
Raw data – Reproduction test with daphnids (chapter 15) 408
Table 285: P25 (2nd test) – Test with daphnids: extinction (585 nm) as measure for the density of algae used as feed.
Day 0 Day 1 Day 2 Day 3 Day 4 Day 5 Day 6
0.015 0.020 0.025 0.030 0.030 0.035 0.040
Day 7 Day 8 Day 9 Day 10 Day 11 Day 12 Day 13
0.045 0.050 0.055 0.0.060 0.060 0.065 0.070
Day 14 Day 15 Day 16 Day 17 Day 18 Day 19 Day 20
0.075 0.080 0.090 0.095 0.095 0.100 0.100
Table 286: P25 (2nd test) – Test with daphnids: offspring per replicate and day. Concentrations given as nominal concentrations of TiO2
Date Control 1 mg/L 5 mg/L Control 1.0 mg/L 5.0 mg/L
Medium renewal three times a week Daily medium renewal
Day 6
1 0 0 0 0 0 0
2 * 0 0 0 0 0
3 0 0 0 0 0 0
4 0 0 0 0 0 0
5 0 0 0 0 0 0
6 0 0 0 0 0 0
7 0 0 0 0 0 0
8 0 0 0 0 0 0
9 0 0 0 0 0 0
10 0 0 0 0 0 0
* Brood pouch of daphnid contained algae; no reproduction; organism was not considered for the calculation of reproduction
Date Control 1 mg/L 5 mg/L Control 1.0 mg/L 5.0 mg/L
Medium renewal three times a week Daily medium renewal
Day 7
1 0 0 0 0 0 0
2 * 0 0 0 0 0
3 0 0 0 0 0 0
4 0 0 0 0 0 0
5 0 0 0 0 0 0
6 0 0 0 0 0 0
7 0 0 0 0 0 0
8 0 0 0 0 0 0
9 0 0 0 0 0 0
10 0 0 0 0 0 0
* Brood pouch of daphnid contained algae; no reproduction; organism was not considered for the calculation of reproduction
Continued

Raw data – Reproduction test with daphnids (chapter 15) 409
Table 286: P25 (2nd test) – Test with daphnids: offspring per replicate and day, continued
Date Control 1 mg/L 5 mg/L Control 1.0 mg/L 5.0 mg/L
Medium renewal three times a week Daily medium renewal
Day 8
1 0 0 0 0 0 0
2 * 0 0 0 0 0
3 0 0 0 0 0 0
4 0 0 0 0 0 0
5 0 0 0 0 0 0
6 0 0 0 0 0 0
7 0 0 0 0 0 0
8 0 0 0 0 0 0
9 0 0 0 0 0 0
10 0 0 0 0 0 0
* Brood pouch of daphnid contained algae; no reproduction; organism was not considered for the calculation of reproduction
Date Control 1 mg/L 5 mg/L Control 1.0 mg/L 5.0 mg/L
Medium renewal three times a week Daily medium renewal
Day 9
1 0 0 0 0 5 0
2 * 0 11 0 0 3
3 0 7 0 0 0 0
4 0 0 0 0 0 0
5 1 0 0 0 0 0
6 0 0 0 7 0 12
7 0 0 0 0 0 2
8 0 0 0 7 6 0
9 0 0 0 0 Organism dead 6
10 0 0 0 0 0 0
* Brood pouch of daphnid contained algae; no reproduction; organism was not considered for the calculation of reproduction
Continued

Raw data – Reproduction test with daphnids (chapter 15) 410
Table 286: P25 (2nd test) – Test with daphnids: offspring per replicate and day, continued
Date Control 1 mg/L 5 mg/L Control 1.0 mg/L 5.0 mg/L
Medium renewal three times a week Daily medium renewal
Day 10
1 0 0 0 0 0 16
2 * 0 0 2 organism dead 0
3 0 0 0 14 0 0
4 0 10 8 16 5 13
5 0 7 0 0 organism dead 13
6 0 0 15 0 13 0
7 9 7 0 7 0 0
8 0 0 0 0 0 16
9 0 14 8 19 - 0
10 0 15 0 4 0 0
* Brood pouch of daphnid contained algae; no reproduction; organism was not considered for the calculation of reproduction
Date Control 1 mg/L 5 mg/L Control 1.0 mg/L 5.0 mg/L
Medium renewal three times a week Daily medium renewal
Day 11
1 8 0 0
2 0 - 0
3 0 0 12
4 0 0 0
5 0 - 0
6 0 0 0
7 0 10 0
8 0 0 0
9 0 - 0
10 0 0 11
Continued

Raw data – Reproduction test with daphnids (chapter 15) 411
Table 286: P25 (2nd test) – Test with daphnids: offspring per replicate and day. continued
Date Control 1 mg/L 5 mg/L Control 1.0 mg/L 5.0 mg/L
Medium renewal three times a week Daily medium renewal
Day 12
1 14 4 0 0 24 0
2 * 6 13 0 - 7
3 17 20 15 0 0 0
4 11 0 0 0 0 0
5 15 0 16 0 - 0
6 21 15 0 20 0 2
7 0 0 3 0 0 0
8 3 11 6 18 12 0
9 13 0 0 0 - 16
10 19 0 13 0 9 0
* Brood pouch of daphnid contained algae; no reproduction; organism was not considered for the calculation of reproduction
Date Control 1 mg/L 5 mg/L Control 1.0 mg/L 5.0 mg/L
Medium renewal three times a week Daily medium renewal
Day 13
1 0 0 19
2 14 - 5
3 27 6 0
4 1 23 27
5 7 - 15
6 0 22 14
7 16 0 0
8 0 0 26
9 17 - 0
10 8 0 0
Continued
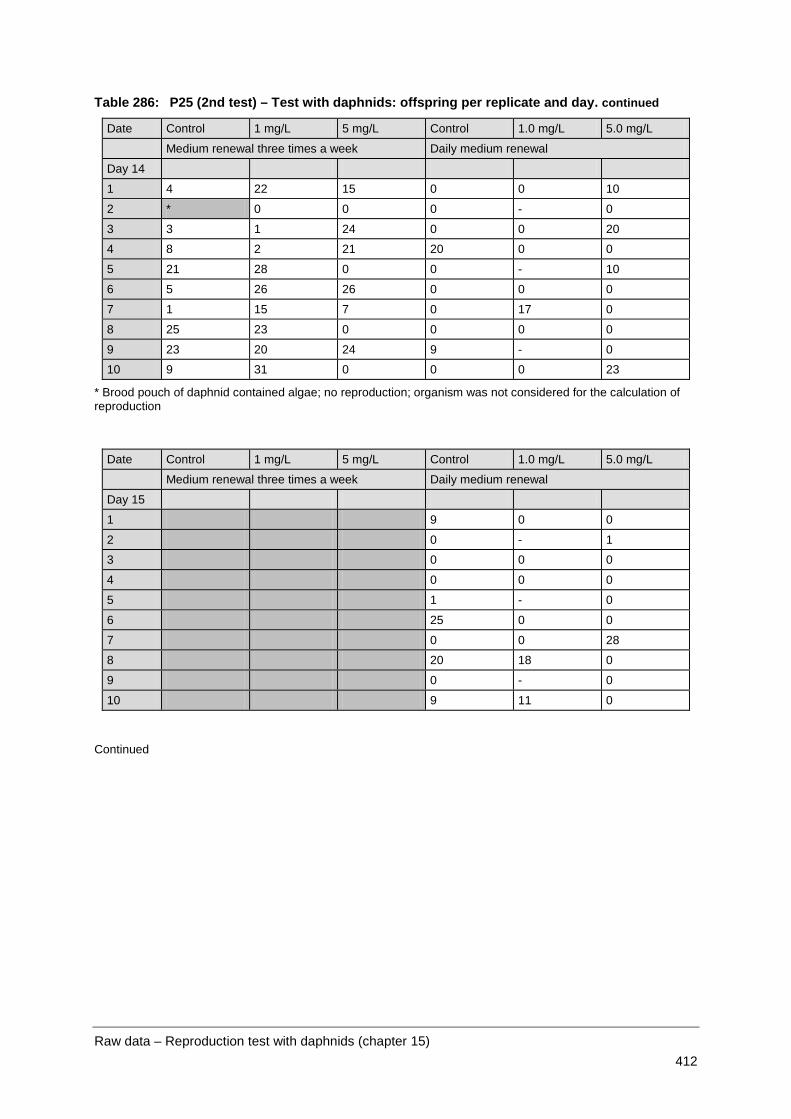
Raw data – Reproduction test with daphnids (chapter 15) 412
Table 286: P25 (2nd test) – Test with daphnids: offspring per replicate and day. continued
Date Control 1 mg/L 5 mg/L Control 1.0 mg/L 5.0 mg/L
Medium renewal three times a week Daily medium renewal
Day 14
1 4 22 15 0 0 10
2 * 0 0 0 - 0
3 3 1 24 0 0 20
4 8 2 21 20 0 0
5 21 28 0 0 - 10
6 5 26 26 0 0 0
7 1 15 7 0 17 0
8 25 23 0 0 0 0
9 23 20 24 9 - 0
10 9 31 0 0 0 23
* Brood pouch of daphnid contained algae; no reproduction; organism was not considered for the calculation of reproduction
Date Control 1 mg/L 5 mg/L Control 1.0 mg/L 5.0 mg/L
Medium renewal three times a week Daily medium renewal
Day 15
1 9 0 0
2 0 - 1
3 0 0 0
4 0 0 0
5 1 - 0
6 25 0 0
7 0 0 28
8 20 18 0
9 0 - 0
10 9 11 0
Continued

Raw data – Reproduction test with daphnids (chapter 15) 413
Table 286: P25 (2nd test) – Test with daphnids: offspring per replicate and day. continued
Date Control 1 mg/L 5 mg/L Control 1.0 mg/L 5.0 mg/L
Medium renewal three times a week Daily medium renewal
Day 16
1 0 0 0 0 21 0
2 * 10 31 17 - 24
3 9 32 0 0 0 0
4 22 0 0 0 1 24
5 30 24 28 12 - 0
6 25 0 0 0 10 17
7 0 22 0 27 0 0
8 0 0 16 0 0 25
9 2 6 0 0 - 0
10 0 0 25 0 0 0
* Brood pouch of daphnid contained algae; no reproduction; organism was not considered for the calculation of reproduction
Date Control 1 mg/L 5 mg/L Control 1.0 mg/L 5.0 mg/L
Medium renewal three times a week Daily medium renewal
Day 17
1 0 0 19
2 0 - 0
3 0 0 23
4 20 22 0
5 0 - 23
6 0 18 0
7 0 0 0
8 0 0 0
9 21 - 0
10 0 0 0
Continued
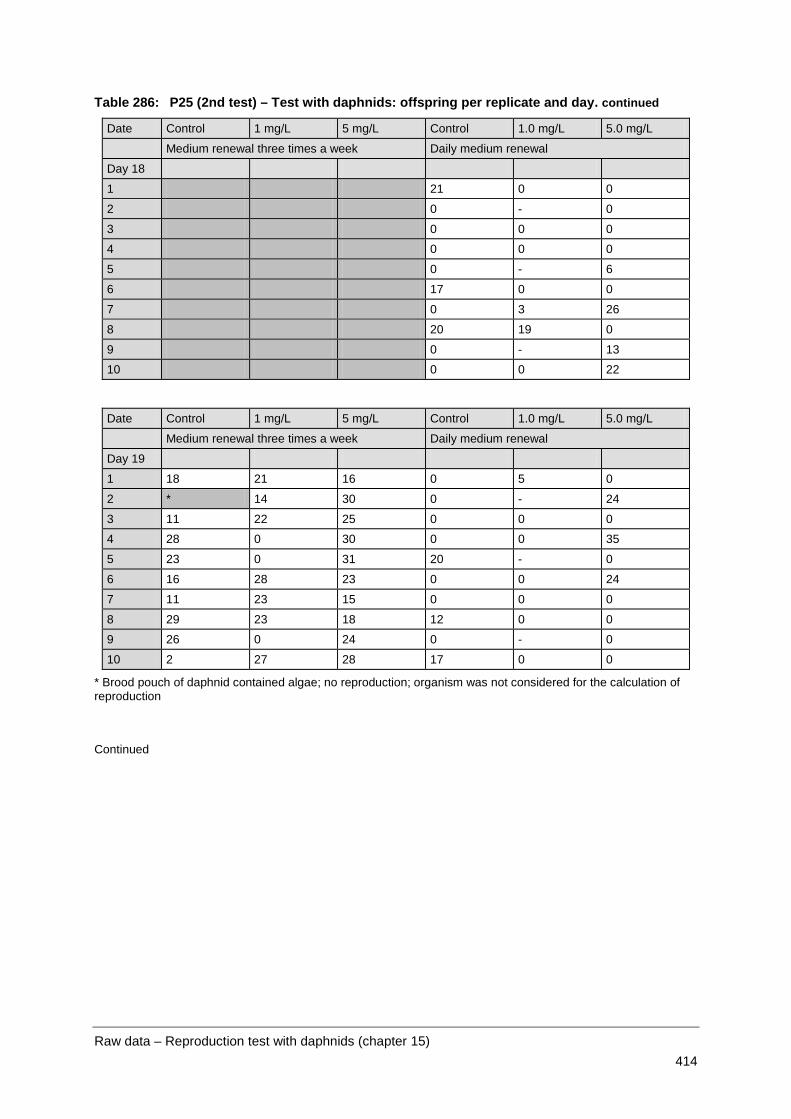
Raw data – Reproduction test with daphnids (chapter 15) 414
Table 286: P25 (2nd test) – Test with daphnids: offspring per replicate and day. continued
Date Control 1 mg/L 5 mg/L Control 1.0 mg/L 5.0 mg/L
Medium renewal three times a week Daily medium renewal
Day 18
1 21 0 0
2 0 - 0
3 0 0 0
4 0 0 0
5 0 - 6
6 17 0 0
7 0 3 26
8 20 19 0
9 0 - 13
10 0 0 22
Date Control 1 mg/L 5 mg/L Control 1.0 mg/L 5.0 mg/L
Medium renewal three times a week Daily medium renewal
Day 19
1 18 21 16 0 5 0
2 * 14 30 0 - 24
3 11 22 25 0 0 0
4 28 0 30 0 0 35
5 23 0 31 20 - 0
6 16 28 23 0 0 24
7 11 23 15 0 0 0
8 29 23 18 12 0 0
9 26 0 24 0 - 0
10 2 27 28 17 0 0
* Brood pouch of daphnid contained algae; no reproduction; organism was not considered for the calculation of reproduction
Continued

Raw data – Reproduction test with daphnids (chapter 15) 415
Table 286: P25 (2nd test) – Test with daphnids: offspring per replicate and day. continued
Date Control 1 mg/L 5 mg/L Control 1.0 mg/L 5.0 mg/L
Medium renewal three times a week Daily medium renewal
Day 20
1 0 23 0
2 17 - 0
3 29 5 2
4 0 0 0
5 0 - 0
6 0 0 0
7 30 0 0
8 0 0 4
9 26 - 0
10 0 0 0
Date Control 1 mg/L 5 mg/L Control 1.0 mg/L 5.0 mg/L
Medium renewal three times a week Daily medium renewal
Day 21
1 23 38 23 0 0 23
2 * 0 0 0 - 0
3 14 0 32 0 0 26
4 3 0 22 26 0 0
5 7 29 0 0 - 0
6 20 23 38 7 0 0
7 22 0 25 0 27 0
8 36 32 0 0 0 0
9 27 19 27 0 - 0
10 4 30 0 0 0 27
* Brood pouch of daphnid contained algae; no reproduction; organism was not considered for the calculation of reproduction

Raw data – Reproduction test with daphnids (chapter 15) 416
21.8.3 P25 – third test
Table 287: P25 (3rd test) – Test with daphnids: oxygen saturation of the overlaying water. Values of the parallel test vessels throughout test duration [mg/L]; concentrations given as nominal concentrations of TiO2
Date Control 1 mg/L 5 mg/L Control 1.0 mg/L 5.0 mg/L
Ultrasonication period: 3 min Ultrasonication period: 30 min aged new aged new aged new aged new aged new aged new
Start 8.1 8.1 8.0 8.1 8.2 7.9
Day 2 10.5 9.8 9.6 8.2 8.9 8.4 10.5 9.8 8.5 8.0 8.6 7.7
Day 5 8.9 8.3 9.2 8.1 9.4 7.8 8.9 8.3 8.6 7.7 7.9 7.0
Day 7 8.4 7.3 8.4 7.2 7.9 7.2 8.4 7.3 7.8 6.3 7.6 6.1
Day 9 8.8 7.6 8.9 8.0 8.9 8.0 8.8 7.6 8.6 7.6 9.2 7.5
Day 12 8.1 7.6 7.9 7.6 8.1 7.6 8.1 7.6 7.9 7.2 8.2 7.0
Day 14 8.5 8.3 9.1 8.2 8.7 8.0 8.5 8.3 8.7 7.5 8.7 7.5
Day 16 8.6 8.2 8.2 7.9 8.5 8.0 8.6 8.2 8.2 7.8 8.4 7.9
Day 19 8.8 8.1 8.9 8.1 9.0 8.1 8.8 8.1 9.2 7.5 9.1 7.5
Day 21 9.6 9.3 9.8 9.6 10.4 9.8
Table 288: P25 (3rd test) – Test with daphnids: pH of the overlaying water. Values of the parallel test vessels throughout test duration; concentrations given as nominal con-centrations of TiO2
Date Control 1 mg/L 5 mg/L Control 1.0 mg/L 5.0 mg/L
Ultrasonication period: 3 min Ultrasonication period: 30 min aged new aged new aged new aged new aged new aged new
Start 8.1 8.1 8.1 8.1 8.0 8.1
Day 2 8.6 8.3 8.6 8.3 8.6 8.3 8.6 8.3 8.6 8.4 8.6 8.4
Day 5 8.7 8.4 8.8 8.4 8.9 8.4 8.7 8.4 8.8 8.4 8.8 8.4
Day 7 8.7 7.7 8.6 7.9 8.6 8.0 8.7 7.7 8.6 8.0 8.7 8.0
Day 9 8.6 8.2 8.6 8.2 8.6 8.2 8.6 8.2 8.5 8.3 8.7 8.2
Day 12 8.4 8.2 8.4 8.4 8.3 8.4 8.4 8.2 8.4 8.1 8.5 8.2
Day 14 8.5 8.4 8.6 8.3 8.5 8.3 8.5 8.4 8.6 8.3 8.6 8.3
Day 16 8.4 8.4 8.4 8.1 8.5 8.1 8.4 8.4 8.4 8.1 8.4 8.2
Day 19 8.3 8.4 8.3 8.5 8.3 8.5 8.3 8.4 8.5 8.4 8.5 8.5
Day 21 8.6 8.7 8.6 8.6 8.8 8.6

Raw data – Reproduction test with daphnids (chapter 15) 417
Table 289: P25 (3rd test) – Test with daphnids: temperature of the overlaying water [°C] in the climatic chamber.
Day 0 Day 2 Day 5 Day 7 Day 9
21.2 20.5 20.9 21.0 20.7
Day 12 Day 14 Day 16 Day 19 Day 21
21.3 20.8 20.9 20.9 21.0
Table 290: P25 (3rd test) – Test with daphnids: light intensity [lux] in the climatic chamber.
Day 0 Day 2 Day 5 Day 7 Day 9
886 867 891 885 861
Day 12 Day 14 Day 16 Day 19 Day 21
842 850 834 847 811
Table 291: P25 (3rd test) – Test with daphnids: extinction (585 nm) as measure for the density of algae used as feed.
Day 0 Day 2 Day 5 Day 7 Day 9
0.015 0.025 0.035 0.045 0.55
Day 12 Day 14 Day 16 Day 19
0.065 0.075 0.090 0.100

Raw data – Reproduction test with daphnids (chapter 15) 418
Table 292: P25 (3rd test) – Test with daphnids: offspring per replicate and day. Concentrations given as nominal concentrations of TiO2
Date Control 1 mg/L 5 mg/L Control 1.0 mg/L 5.0 mg/L
Ultrasonication period: 3 min Ultrasonication period: 30 min
Day 6
1 0 0 0 0 0 0
2 0 0 0 0 0 0
3 0 0 0 0 0 0
4 0 0 0 0 0 0
5 0 0 0 0 0 0
6 0 0 0 0 0 0
7 0 0 0 0 0 0
8 0 0 0 0 0 0
9 0 0 0 0 0 0
10 0 0 0 0 0 0
Date Control 1 mg/L 5 mg/L Control 1.0 mg/L 5.0 mg/L
Ultrasonication period: 3 min Ultrasonication period: 30 min
Day 7
1 0 0 0 0 0 0
2 0 0 0 0 0 0
3 0 0 0 0 0 0
4 0 0 0 0 0 0
5 0 0 0 0 0 0
6 0 0 0 0 0 0
7 0 0 0 0 0 0
8 0 0 0 0 0 0
9 0 0 0 0 0 0
10 0 0 0 0 0 0
Continued

Raw data – Reproduction test with daphnids (chapter 15) 419
Table 292: P25 (3rd test) – Test with daphnids: offspring per replicate and day. continued
Date Control 1 mg/L 5 mg/L Control 1.0 mg/L 5.0 mg/L
Ultrasonication period: 3 min Ultrasonication period: 30 min
Day 8
1 0 0 0 0 0 0
2 0 0 11 0 0 0
3 0 0 0 0 0 0
4 0 0 0 0 0 0
5 0 0 0 0 0 0
6 0 0 0 0 0 0
7 0 0 0 0 0 0
8 0 0 0 0 0 0
9 0 0 0 0 0 0
10 0 0 0 0 0 0
Date Control 1 mg/L 5 mg/L Control 1.0 mg/L 5.0 mg/L
Ultrasonication period: 3 min Ultrasonication period: 30 min
Day 9
1 6 0 2 6 11 9
2 8 8 4 8 9 3
3 12 11 0 12 12 10
4 9 5 10 9 8 5
5 3 8 9 3 9 8
6 0 10 0 0 0 11
7 9 6 4 9 16 0
8 4 3 8 4 12 6
9 8 7 6 8 6 0
10 2 9 0 2 5 5
Continued
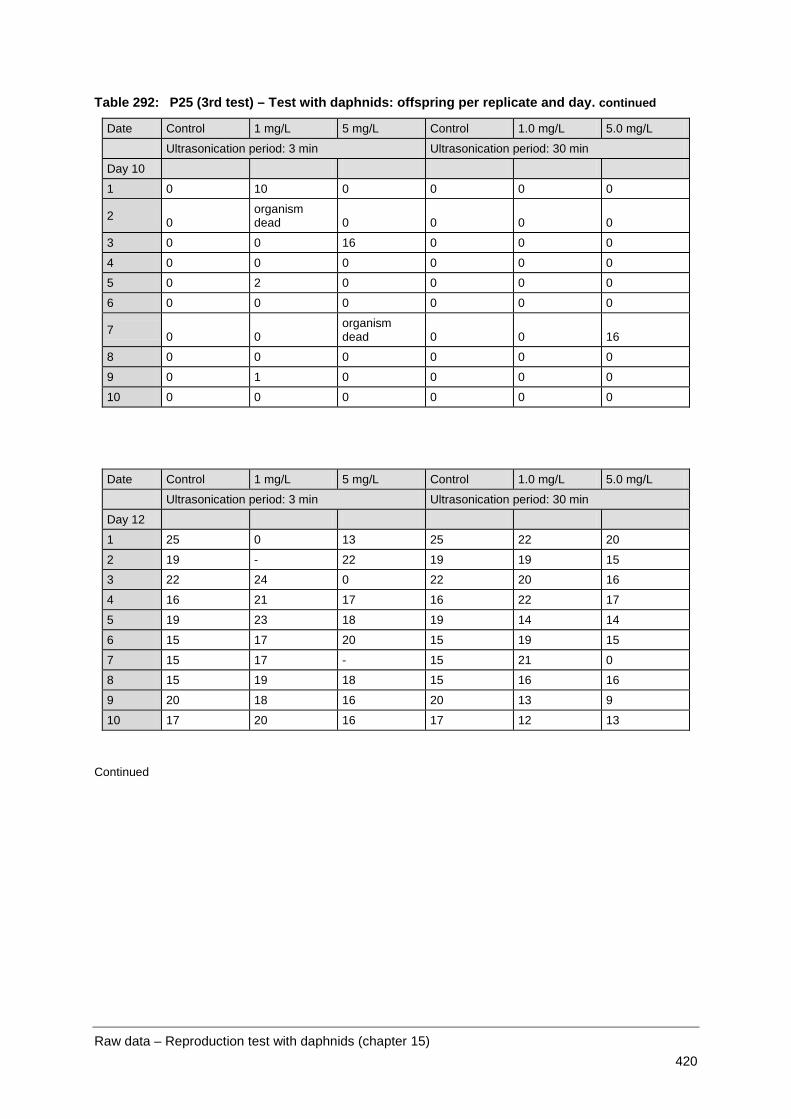
Raw data – Reproduction test with daphnids (chapter 15) 420
Table 292: P25 (3rd test) – Test with daphnids: offspring per replicate and day. continued
Date Control 1 mg/L 5 mg/L Control 1.0 mg/L 5.0 mg/L
Ultrasonication period: 3 min Ultrasonication period: 30 min
Day 10
1 0 10 0 0 0 0
2 0 organism dead 0 0 0 0
3 0 0 16 0 0 0
4 0 0 0 0 0 0
5 0 2 0 0 0 0
6 0 0 0 0 0 0
7 0 0 organism dead 0 0 16
8 0 0 0 0 0 0
9 0 1 0 0 0 0
10 0 0 0 0 0 0
Date Control 1 mg/L 5 mg/L Control 1.0 mg/L 5.0 mg/L
Ultrasonication period: 3 min Ultrasonication period: 30 min
Day 12
1 25 0 13 25 22 20
2 19 - 22 19 19 15
3 22 24 0 22 20 16
4 16 21 17 16 22 17
5 19 23 18 19 14 14
6 15 17 20 15 19 15
7 15 17 - 15 21 0
8 15 19 18 15 16 16
9 20 18 16 20 13 9
10 17 20 16 17 12 13
Continued

Raw data – Reproduction test with daphnids (chapter 15) 421
Table 292: P25 (3rd test) – Test with daphnids: offspring per replicate and day. continued
Date Control 1 mg/L 5 mg/L Control 1.0 mg/L 5.0 mg/L
Ultrasonication period: 3 min Ultrasonication period: 30 min
Day 14
1 0 23 29 0 0 0
2 0 - 0 0 0 0
3 0 0 30 0 0 0
4 0 0 0 0 0 0
5 0 0 0 0 0 0
6 0 0 0 0 0 0
7 0 0 - 0 0 18
8 0 0 0 0 0 0
9 0 0 0 0 0 17
10 0 0 24 0 0 12
Date Control 1 mg/L 5 mg/L Control 1.0 mg/L 5.0 mg/L
Ultrasonication period: 3 min Ultrasonication period: 30 min
Day 16
1 27 0 20 27 27 18
2 31 - 23 31 21 21
3 27 26 5 27 27 25
4 31 31 22 31 26 23
5 36 27 25 36 29 21
6 30 25 30 30 28 20
7 30 21 - 30 32 18
8 30 24 18 30 27 0
9 34 28 19 34 17 0
10 28 32 0 28 22 8
Continued

Raw data – Reproduction test with daphnids (chapter 15) 422
Table 292: P25 (3rd test) – Test with daphnids: offspring per replicate and day. continued
Date Control 1 mg/L 5 mg/L Control 1.0 mg/L 5.0 mg/L
Ultrasonication period: 3 min Ultrasonication period: 30 min
Day 19
1 0 20 1 0 25 0
2 30 - 10 30 33 23
3 31 31 13 31 33 19
4 33 15 26 33 27 24
5 34 25 26 34 24 19
6 28 Organism dead 27 28 31 20
7 27 2 - 27 27 25
8 27 21 25 27 27 21
9 31 26 25 31 27 21
10 29 31 20 29 26 24
Date Control 1 mg/L 5 mg/L Control 1.0 mg/L 5.0 mg/L
Ultrasonication period: 3 min Ultrasonication period: 30 min
Day 21
1 32 27 0 32 0 23
2 0 - 12 0 0 0
3 0 0 19 0 0 0
4 0 0 4 0 0 0
5 0 0 0 0 0 0
6 0 - 0 0 0 0
7 0 23 - 0 0 32
8 0 0 0 0 0 0
9 0 0 0 0 0 23
10 0 1 29 0 17 29

Raw data – Immobilisation test with daphnids (chapter 16) 423
21.9 Raw data – Immobilisation test with daphnids (chapter 16)
21.9.1 NM-330 – pre-test (range finder) Table 293: NM-330 – Acute test with daphnids: number of immobilized daphnids in the pre-test
(range finder). Concentrations given as percentage of NM-330 and NM-330DIS in the test medium
Control NM-330 (gold nanoparticles in dis-persant)
NM-330DIS (dispersant of gold nanoparticles)
1 % 10 % 50 % 1 % 10 % 50 % Incubation period: 24 h
Replicate 1 0 0 0 0 0 3 5 Replicate 2 0 0 0 0 0 4 5 Replicate 3 0 --- --- --- --- --- --- Replicate 4 0 --- --- --- --- --- ---
Immobile daphnids (total)
0 0 0 0 0 7 10
Immobile daphnids (%) 0 0 0 0 0 70 100 Incubation period: 48 h
Replicate 1 0 0 0 0 5 5 Replicate 2 0 0 0 1 5 5 Replicate 3 --- --- --- --- --- --- Replicate 4 --- --- --- --- --- ---
Immobile daphnids (total)
0 0 0 0 1 10 10
Immobile daphnids (%) 0 0 0 0 10 100 100

Raw data – Immobilisation test with daphnids (chapter 16) 424
21.9.2 NM-330 - main test
Table 294: NM-330 – Acut test with daphnids: chemical analysis.
Measured value considering the different wave length for determination
measured value * dilution
dilution Au1978 3 Au2082 Au2427 Au1978 3 Au2082 Au2427
µg/L µg/L µg/L µg/L µg/L µg/L
Test start: 0 h
Control 10 0.423 1 2.76 1 -2.31 1 4.23 1 27.6 1 -23.1 1
NM-330 5% 20 134 136 143 2680 2712 2866
NM-330 10% 50 100 101 106 4985 5045 5310
Test end: 48 h
Control 10 0.670 1 3.30 2 -2.64 1 6.70 1 33.0 2 -26.4 1
NM-330 5% 10 42.7 45.4 37.4 427 454 374
NM-330 10% 10 53.8 56.8 51.5 538 568 515
1Limit of detection; 2Limit of determination; 3used for calculation of concentration
Table 295: NM-330 – Acut test with daphnids: calibration.
Measured value considering the different wave length for determination
measured value * dilution Recovery
dilu-tion
nomi-nal
Au1978 3
Au2082 Au2427 Au1978 3
Au2082 Au2427 Au19783
Au2082 Au2427
µg/L µg/L µg/L µg/L µg/L µg/L rec % rec % rec %
nano Gold reference material (value not certified)
NIST 8011 A mg/L
250 51.56 201 203 203 50325 50625 50675 97.6 98.2 98.3
NIST 8011 B mg/L
250 51.56 200 202 198 49950 50450 49600 96.9 97.8 96.2
NIST 8011 A mg/L
250 51.56 207 205 204 51725 51200 50900 100 99.3 98.7
NIST 8011 B mg/L
250 51.56 202 202 203 50425 50550 50650 97.8 98.0 98.2
recalibration standard
Standard Au 50 µg/L
50 48.1 51.0 49.2 96.2 102 98.4
Standard Au 50 µg/L
50 47.0 49.3 51.8 94.0 98.6 104
Limit of detec-tion
4.29 3.21 7.50 < NG
Limit of deter-mination
14.3 10.7 25.0 < BG
3used for calculation of concentration

Raw data – Immobilisation test with daphnids (chapter 16) 425
Ecotoxicological test
Table 296: NM-330 – Acute test with daphnids: number of immobilized daphnids in the main test. Concentrations given as percentage of NM-330 and NM-330DIS in the test medium
NM-330 (gold nanoparticles in
dispersant)
NM-330DISs (dispersant of gold nanoparticles)
Control 5 % 10 % 0.625 % 1.25 % 2.5 % 5 % 10 % Incubation period: 24 h
Replicate 1 0 0 0 0 0 0 0 5 Replicate 2 0 0 0 0 0 0 4 4 Replicate 3 0 0 0 0 0 0 1 3 Replicate 4 0 0 0 0 0 0 2 4
Immobile daphnids (total)
0 0 0 0 0 0 7 16
Immobile daphnids (%) 0 0 0 0 0 0 35 80 Incubation period: 48 h
Replicate 1 0 0 0 0 1 1 3 5 Replicate 2 1 0 0 0 0 1 5 5 Replicate 3 0 1 1 0 3 1 2 5 Replicate 4 0 0 0 0 2 0 3 5
Immobile daphnids (total)
1 1 1 0 6 3 13 20
Immobile daphnids (%) 5 5 5 0 30 15 65 100

Raw data – Growth test with algae (chapter 17) 426
21.10 Raw data – growth test with algae – Au (chapter 17):
21.10.1 NM-330 – first test
Table 297: NM-330 – Test with algae: number of algae (test concentrations achieved by dilu-tion with ultrapure water).
Time Treatment [%] 0 h Replicate Control 0.63 1.25 2.5 5.00 10 20 40 80
1 19552 20350 17395 16793 14426 12423 6289 3277 0 2 19972 18796 19650 17941 14174 11148 7535 1387 0 3 18880 19244 17661 17325 13880 10812 7087 1779 0 4 19944 5 18613 6 20756 Mean 19619.5 19463.1 18235.3 17352.9 14159.7 11461.3 6970.1 2147.5 0.0 Std.Dev 785.6 800.2 1232.3 574.7 273.4 849.7 631.4 997.9 0.0 CV% 4.0 4.1 6.8 3.3 1.9 7.4 9.1 46.5 24 h Replicate
1 139986 118445 142577 127241 119706 129300 92381 144958 80336 2 135602 135210 143725 122101 130560 115406 81261 144482 68207 3 133137 138627 138487 114342 128964 117465 118796 128417 69790 4 117283 5 122171 6 127843 Mean 129337.1 130761.0 141596.6 121227.8 126409.9 120723.6 97479.0 139285.7 72777.8 Std.Dev 8555.5 10801.6 2753.2 6493.7 5860.5 7498.1 19279.8 9415.3 6593.4 CV% 6.6 8.3 1.9 5.4 4.6 6.2 19.8 6.8 9.1 48 h Replicate
1 740938 567269 670658 597927 607801 579468 390490 293403 60476.2 2 671331 681246 632311 541751 607535 508739 304244 313403 43809.5 3 649888 655882 614398 549538 614874 509342 485294 273011 46302.5 4 547871 5 569314 6 562955 Mean 623716.2 634799.3 639122.3 563071.9 610070.0 532516.3 393342.7 293272.6 50196.1 Std.Dev 76285.2 59842.3 28742.1 30435.6 4162.4 40662.3 90558.9 20196.4 8989.7 CV% 12.2 9.4 4.5 5.4 0.7 7.6 23.0 6.9 17.9 72 h Replicate
1 1974216 1430462 1347619 973473 894468 801120 482255 304286 59019.6 2 1759398 1541793 1196765 887661 899748 657339 353782 316275 43095.2 3 1603193 1365196 1132619 1067045 939076 636919 498403 279300 44313.7 4 1339272 5 1361695 6 1356050 Mean 1565637.3 1445817.0 1225667.6 976059.8 911097.1 698459.4 444813.3 299953.3 48809.5 Std.Dev 261782.5 89294.0 110375.6 89719.8 24373.5 89491.4 79248.2 18864.3 8863.2 CV% 16.7 6.2 9.0 9.2 2.7 12.8 17.8 6.3 18.2

Raw data – Growth test with algae (chapter 17) 427
Table 298: NM-330 – Test with algae: number of algae (test concentrations achieved by dilu-
tion with dispersant).
Time Treatment [%] 0 h Replicate Control 0.63 1.25 2.5 5.00 10 20 40 80
1 21905 13291 15854 13207 9818 6359 1653 0 0 2 1) 16765 14062 12101 11373 7087 2311 0 0 3 19146 12465 13754 13039 10490 6513 1373 0 0 4 19440 5 19804 6 20252 Mean 20109.2 14173.7 14556.5 12782.4 10560.2 6652.7 1778.7 0.0 0.0 Std.Dev 1085.6 2281.6 1134.5 596.2 779.7 383.8 481.7 0.0 0.0 CV% 5.4 16.1 7.8 4.7 7.4 5.8 27.1 24 h Replicate
1 174216 30392 47185 31891 29846 22171 11092 5728 35770 2 1) 32423 31961 28319 28039 20742 13880 5700 46359 3 155490 34986 30924 34272 27843 19706 12241 4916 43810 4 149720 5 155266 6 147353 Mean 156409.0 32600.4 36690.0 31493.9 28576.1 20873.0 12404.3 5448.2 41979.5 Std.Dev 10559.2 2302.1 9103.6 2996.0 1104.1 1237.7 1400.7 461.1 5526.3 CV% 6.8 7.1 24.8 9.5 3.9 5.9 11.3 8.5 13.2 48 h Replicate
1 884832 33964 46947 31429 26092 22311 11289 6723 118782 2 1) 31667 31639 30560 25644 20854 14258 7199 149230 3 823782 34398 30168 37003 26485 19398 11989 6737 133109 4 778473 5 812479 6 788543 Mean 817621.8 33342.7 36251.2 32997.2 26073.8 20854.3 12511.7 6886.1 133706.8 Std.Dev 41712.5 1467.6 9291.8 3496.0 420.5 1456.6 1552.1 271.0 15232.9 CV% 5.1 4.4 25.6 10.6 1.6 7.0 12.4 3.9 11.4 72 h Replicate
1 2155406 31387 40448 28193 25504 18754 9202 5924 101414.57 2 1) 28361 31008 26793 23389 17003 11345 5896 118025.21 3 1963992 31176 28347 31317 23950 16443 11499 5210 109691.88 4 1715406 5 1780966 6 1767605 Mean 1876675.1 30308.1 33268.0 28767.5 24281.0 17399.6 10681.6 5676.9 109710.6 Std.Dev 181919.8 1689.2 6359.0 2315.9 1095.7 1205.5 1284.0 404.5 8305.3 CV% 9.7 5.6 19.1 8.1 4.5 6.9 12.0 7.1 7.6
1) Sample defect

Raw data – Growth test with algae (chapter 17) 428
Table 299: NM-330DIS – Test with algae: number of algae.
Time Treatment [%] 0 h Replicate Control 0.63 1.25 2.5 5.00 10 20 40 80
1 14664 20098 21078 18291 18908 17913 16190 15420 14132 2 16050 21373 19776 18950 18221 16975 16611 16204 15924 3 16008 20602 18824 19608 18697 19314 16961 15840 15098 4 16681 5 14300 6 17059 Mean 15793.7 20690.9 19892.6 18949.6 18608.8 18067.2 16587.3 15821.7 15051.4 Std.Dev 1096.2 641.9 1132.0 658.3 351.6 1177.1 385.7 392.5 897.3 CV% 6.9 3.1 5.7 3.5 1.9 6.5 2.3 2.5 6.0 24 h Replicate
1 171569 121779 113207 78683 48880 33838 31204 29650 31289 2 165756 168641 124090 79188 51653 34090 28627 24426 31541 3 160924 179748 110658 69412 44678 32353 29692 23782 29986 4 166569 5 157059 6 157731 Mean 163268.0 156722.7 115985.1 75761.0 48403.4 33426.7 29841.3 25952.4 30938.4 Std.Dev 5669.0 30767.7 7133.5 5504.4 3511.7 938.4 1295.0 3218.3 834.4 CV% 3.5 19.6 6.2 7.3 7.3 2.8 4.3 12.4 2.7 48 h Replicate
1 995980 723515 509356 191989 85574 47787 30042 22927 30196 2 950238 856289 594454 191751 89790 51176 28711 19958 30210 3 923361 897549 493711 163291 78964 47745 26639 20014 29888 4 979762 5 920378 6 933543 Mean 950543.9 825784.3 532507.0 182343.6 84775.9 48902.9 28464.1 20966.4 30098.0 Std.Dev 31164.5 90938.5 54214.7 16500.2 5457.1 1969.1 1715.1 1698.3 182.1 CV% 3.3 11.0 10.2 9.0 6.4 4.0 6.0 8.1 0.6 72 h Replicate
1 2835938 1061975 567297 227521 98768 60420 38347 21331 29342 2 2725196 1154188 614958 209244 108109 62353 33515 19202 28613 3 2647535 1204230 487703 218263 93992 59482 33291 18936 27647 4 2776078 5 2663838 6 2623389 Mean 2711995.8 1140130.7 556652.7 218342.7 100289.4 60751.6 35051.4 19822.6 28534.1 Std.Dev 82423.4 72161.7 64291.7 9138.9 7180.8 1464.0 2856.6 1312.7 850.1 CV% 3.0 6.3 11.5 4.2 7.2 2.4 8.1 6.6 3.0

Raw data – Growth test with algae (chapter 17) 429
21.10.2 NM-330 – second test
Table 300: NM-330 – Test with algae: number of algae (test concentrations achieved by dilu-tion with ultrapure water).
Time Treatment [%] 0 h Replicate Control 0.63 1.25 2.5 5.00 10 20 40 80
1 14062 12115 12017 8880 9594 4832 854 0 0 2 13487 15196 11863 10084 8557 3585 2003 0 0 3 12689 12549 11625 10854 8725 4776 1261 0 0 4 13431 5 12619 6 12087 Mean 13062.6 13286.6 11834.7 9939.3 8958.9 4397.8 1372.5 0.0 0.0 Std.Dev 721.5 1667.8 197.6 995.3 556.2 704.1 582.4 0.0 0.0 CV% 5.5 12.6 1.7 10.0 6.2 16.0 42.4 24 h Replicate
1 119986 83137 109874 97647 95868 85252 65476 63179 27073 2 121779 115322 105812 92465 102661 79160 51471 69678 29146 3 100322 105546 104132 88221 106653 81947 64790 51359 27381 4 114202 5 110952 6 100966 Mean 111367.9 101335.2 106606.0 92777.8 101727.4 82119.5 60578.9 61405.2 27866.5 Std.Dev 9176.7 16500.5 2952.3 4720.7 5452.5 3049.9 7895.5 9287.6 1118.5 CV% 8.2 16.3 2.8 5.1 5.4 3.7 13.0 15.1 4.0 48 h Replicate
1 582577 421863 536092 460266 461204 370980 273585.4 111638.7 21681 2 579104 571919 508711 418333 446232 351232 201498.6 125182.1 20840 3 465840 544118 501218 399790 462283 361821 231092.4 109495.8 17311 4 494300 5 508501 6 447577 Mean 512983.2 512633.1 515340.8 426129.8 456573.3 361344.5 235392.2 115438.8 19944.0 Std.Dev 56718.2 79829.0 18357.8 30982.8 8971.6 9882.6 36235.3 8505.6 2318.7 CV% 11.1 15.6 3.6 7.3 2.0 2.7 15.4 7.4 11.6 72 h Replicate
1 1350742 1098824 954272 761120 782983 697577 595952.4 186610.6 27073 2 1307493 1182045 941933 648739 680854 670126 426092.4 205616.2 29146 3 1022577 1261148 929160 639216 711947 706821 512773.1 177437 27381 4 970770 5 1092353 6 943109 Mean 1114507.5 1180672.3 941788.0 683025.2 725261.4 691507.9 511606.0 189888.0 27866.5 Std.Dev 174373.2 81171.2 12556.6 67799.9 52350.1 19085.3 84936.0 14372.7 1118.5 CV% 15.6 6.9 1.3 9.9 7.2 2.8 16.6 7.6 4.0

Raw data – Growth test with algae (chapter 17) 430
Table 301: NM-330DIS – Test with algae: number of algae.
Time Treatment [%] 0 h Replicate Control 0.63 1.25 2.5 5.00 10 20 40 80
1 11863 7997 9006 9230 9300 10182 8824 13235 11092 2 12521 8543 9230 7185 10588 10224 9216 11667 12955 3 12479 8852 9188 8053 8319 9314 10322 10546 12577 4 12577 5 11933 6 13711 Mean 12514.0 8464.1 9141.0 8155.9 9402.4 9906.6 9453.8 11816.1 12208.2 Std.Dev 663.5 432.7 119.1 1026.3 1137.9 513.9 777.2 1350.7 984.6 CV% 5.3 5.1 1.3 12.6 12.1 5.2 8.2 11.4 8.1 24 h Replicate
1 115294 15238 15294 17045 15938 16905 40966 82339 66443 2 121863 14202 16148 14104 17185 19356 38291 64692 80462 3 119356 16821 16975 9314 15560 21261 36891 60308 80560 4 113669 5 108067 6 111737 Mean 114997.7 15420.2 16139.1 13487.4 16227.8 19173.7 38716.2 69113.0 75821.7 Std.Dev 5032.7 1319.0 840.4 3902.2 850.1 2183.6 2070.8 11661.9 8122.7 CV% 4.4 8.6 5.2 28.9 5.2 11.4 5.3 16.9 10.7 48 h Replicate
1 578796 27087 11232 17087 24188 28571 101036 340910.4 400630.25 2 611709 28039 13277 14510 26022 37563 94397.8 253263.3 460028.01 3 595546 33403 13319 10770 24034 40392 86582.6 247479 484397.76 4 567983 5 561765 6 574048 Mean 581641.0 29509.8 12609.7 14122.3 24747.9 35508.9 94005.6 280550.9 448352.0 Std.Dev 18680.4 3405.4 1192.9 3176.0 1106.4 6172.3 7234.9 52352.8 43087.1 CV% 3.2 11.5 9.5 22.5 4.5 17.4 7.7 18.7 9.6 72 h Replicate
1 1416289 23529 13543 25798 38894 46751 161036 682549 1146414.6 2 1521779 23908 14594 22129 40812 57185 143431 494355.7 1117675.1 3 1370518 28375 13880 17759 37829 61877 137633 501064.4 1042268.9 4 1362017 5 1365070 6 1405280 Mean 1406825.4 25270.8 14005.6 21895.4 39178.3 55270.8 147366.9 559323.1 1102119.5 Std.Dev 60623.0 2695.3 536.4 4024.7 1511.8 7742.6 12187.9 106769.5 53787.2 CV% 4.3 10.7 3.8 18.4 3.9 14.0 8.3 19.1 4.9

Raw data – Growth test with algae (chapter 17) 431
21.10.3 NM-330 – third test
Table 302: NM-330 and NM-330DIS – Test with algae: number of algae (test concentrations achieved by dilution with ultrapure water).
Time Treatment [%] NM-330 NM-330DIS
0 h Replicate Control 40,00 80,00 Control 40,00 80,00 1 9119 6813 6143 9119 8071 8616 2 9539 8218 5430 9539 7442 7904 3 8491 8029 5786 8491 7631 8050 4 9706 9706 5 9350 9350 6 9078 9078 Mean 9213.8 7686.9 5786.2 9213.8 7714.9 8190.1 Std.Dev 428.4 762.3 356.4 428.4 322.7 376.4 CV% 4.6 9.9 6.2 4.6 4.2 4.6 24 h Replicate
1 52872 44927 34654 52872 11866 11656 2 44990 45472 34927 44990 9413 12537 3 37715 44130 32327 37715 10084 13543 4 32222 32222 5 48491 48491 6 45073 45073 Mean 43560.4 44842.8 33969.3 43560.4 10454.2 12578.6 Std.Dev 7457.5 674.8 1428.7 7457.5 1267.7 944.1 CV% 17.1 1.5 4.2 17.1 12.1 7.5 48 h Replicate
1 311321 230881 157757 311321 9497 12621 2 275115 227379 158407 275115 9832 14969 3 221908 225723 171090 221908 8721 14654 4 210566 210566 5 298155 298155 6 258470 258470 Mean 262589.1 227994.4 162417.9 262589.1 9350.1 14081.1 Std.Dev 40435.0 2633.0 7517.4 40435.0 569.9 1274.6 CV% 15.4 1.2 4.6 15.4 6.1 9.1 72 h Replicate
1 1789602 444130 108281 1789602 9665 13816 2 1676143 431447 113229 1676143 8574 11740 3 1321803 386122 113166 1321803 5136 9560 4 1405157 1405157 5 1789832 1789832 6 1654298 1654298 Mean 1606139.1 7791.8 11705.1 1606139.1 7791.8 11705.1 Std.Dev 197920.3 2363.4 2128.1 197920.3 2363.4 2128.1 CV% 12.3 30.3 18.2 12.3 30.3 18.2


