Nanomechanics: Atomistic Modeling • Introduction • Energy • Kinetics • Kinematics • Damage Mechanics Outline Mark F. Horstemeyer, PhD CAVS Chair Professor in Computational Solid Mechanics Mechanical Engineering Mississippi State University [email protected]
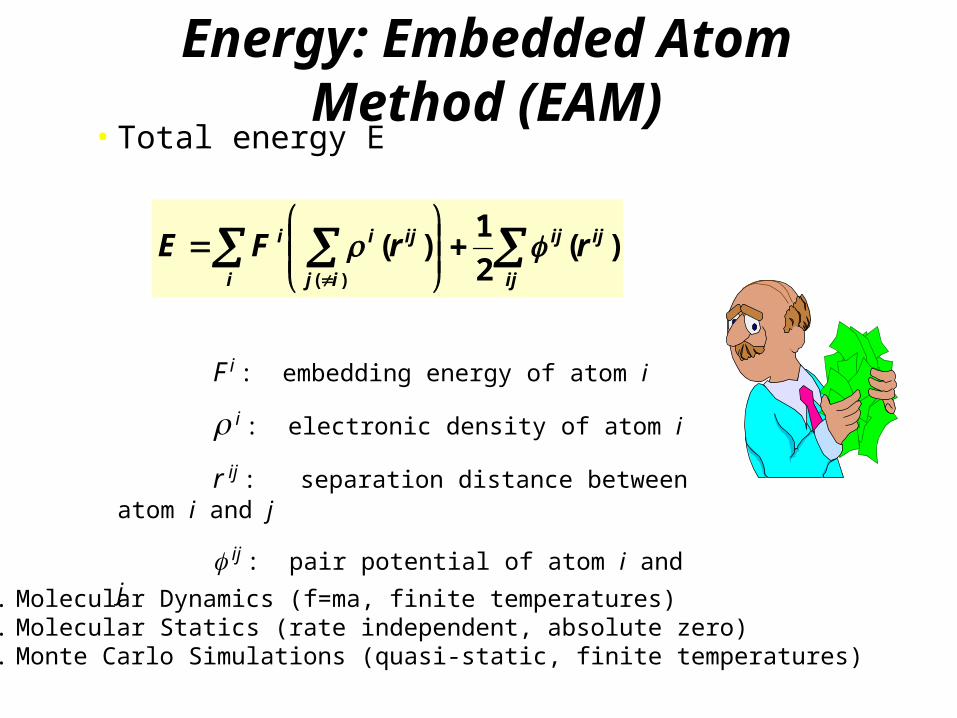
1. Molecular Dynamics (f=ma, finite temperatures)2. Molecular Statics (rate independent, absolute zero)3. Monte Carlo Simulations (quasi-static, finite temperatures)
E F 12 r
f E
ij 1
V mvi v j 1
2V ri f j
Determination of Atomic Stress Tensor(Daw and Baskes, 1984, Phys. Rev)
Embedded Atom Method (EAM) and Modified Embedded Atom Method (MEAM) potentials
Local force determined from energy
Dipole Force Tensor (virial stress) is determined from local forces
Note: the difference between EAM and MEAM is an added degree of angular rotations that affect the electron density cloud . For EAM, this quantity is simply a scalar, but for MEAM it includes three terms that are physically motivated:
free surfaces shear crystal asymmetry
Calc. Expt.Lattice Constant (Å) 3.52 3.52Cohesive Energy (eV) 4.45 4.45Vacancy Formation Energy (eV) 1.59 1.6Elastic Constants (GPa)
C11 246.4 246.5
C12 147.3 147.3
C44 124.8 124.7Surface Energy (mJ/m2) 2060 2380Stacking Fault Energy (mJ/m2) 85 125
EAM Represents the properties of Nickel extremely well
CURRENTLY DEVELOPED MEAM FUNCTIONS COVER MOST OF THE PERIODIC TABLE
Mn
Th U
He
B
Sn
Zn
In
Ga
S
Cd
P
HgBa
Sr
Ca
Bi
Be
La
As
Sb
Mg
Li C N
Si
TiSc
H
O
Pr
Na
K
Al
CoV Fe
Zr
Cr Ni
RuY
Hf
GeCu
RhMoNb
PbRe
Nd TbGd
TlAu
Ag
Dy Ho Er
Pt
Pd
IrWTa
Impurities BCC FCC DIA CUB
Pu
HCP
Atomistic StressClausius, Maxwell Viral Theorem, 1870Maxwell Tensor form of Virial, 1874Rayleigh, 1905Irving-Kirkwood, 1949
Shear stress-strain curve of material blocks at an applied strain rate of 2.4e8/sec with (a) ten thousand atoms and (b) ten million atoms showing microyield 1 at the proportional limit, microyield 2 at 0.2% offset strain, and macroyield.
107 atoms
yield yield
0
1
2
3
4
5
0 0.05 0.1 0.15 0.2 0.25 0.3
shea
r st
ress
(G
Pa)
shear strain
EVOLUTION OF DISLOCATION SUBSTRUCTURE
Strain rate 108/secT = 300K
106 atoms0.16 m x 0.08 m
107 atoms0.5 m x 0.25 m
shea
r st
ress
(G
Pa)
0
2
4
6
8
10
12
14
0 0.05 0.1 0.15 0.2 0.25
2.4e8/sec6.58e9/sec1.53e10/sec5.26e10/sec
shea
r st
ress
(G
Pa)
shear strain
0
2
4
6
8
10
12
14
0 0.05 0.1 0.15 0.2
2.4e8/sec1.53e10/sec
shear strain
LARGER SAMPLES HAVE CONSIDERABLY LESS STRUCTURE IN THE STRESS/STRAIN
CURVES
0
2
4
6
8
10
12
0 0.1 0.2 0.3 0.4 0.5 0.6
single slipdouble slipquadruple slipoctal slippseudopolycrystal
shea
r st
ress
(G
Pa)
shear strain
0
1
2
3
4
5
0 0.1 0.2 0.3 0.4 0.5 0.6re
solv
ed s
hea
r st
ress
(G
Pa)
shear strain
Schmid type plasticity observed at nanoscaleHorstemeyer, M.F. Baskes, M.I., Hughes, D.A., and Godfrey, A. "Orientation Effects on the Stress State of Molecular Dynamics Large Deformation Simulations," Int. J. Plasticity, Vol. 18, pp.
203-209, 2002.
Strain rate 1010/secT = 300K
Yield Stress Depends on Specimen Size Because of Dislocation Nucleation Dominance
0
0.5
1
1.5
2
2.5
3
3.5
4
0 0.01 0.02 0.03 0.04 0.05 0.06 0.07
100,000 atoms1,000,000 atoms
shea
r st
ress
(G
Pa)
shear strain
Strain rate 2.4 x 10⁸/secT= 300K
Horstemeyer, M.F., Plimpton, S.J., and Baskes, M.I."Size Scale and Strain Rate Effects on Yield and Plasticity of Metals," Acta Mater., Vol. 49, pp. 4363-4374, 2001.
0
2
4
6
8
10
12
0 0.05 0.1 0.15 0.2
20000 atoms1384 atoms196 atoms
shea
r st
ress
(G
Pa)
shear strain
A SIMPLE MODEL TO EXPLAIN STRAIN RATE DEPENDENCE
d
dt
mv
1 v c 2eff b
3kT
10b2
vc
1 v c 2
Dislocation is nucleated at a distance x0 from the free surface at a critical stress *
T
Dislocation accelerates according to classical law
eff 0
M I 0
M I 0 0
M I 0 0
Effective stress depends on image stress, Peierls barrier, and orientation
I x0
x * At nucleation there is no net
stress on the dislocation
Yield is defined when b x = 0.2%
T
10-5
0.0001
0.001
0.01
0.1
10-5 0.001 0.1 10 1000 105 107
yiel
d/el
astic
mod
ulus
strain rate
Follansbee (1988) L=0.1 m
Follansbee (1988) L=1 m
Edington (1969) L=1.25 cm
Edington (1969) L=2 mm
Experimental data examining yield stress versus applied strain rate from Follansbee (1988) and Edington (1969) for copper.
Experiment
0
0.05
0.1
0.15
0.001 0.1 10 1000 10 5 10 7 10 9 10 11
yiel
d s
tres
s/el
asti
c m
odu
lus
strain rate (1/sec)
1332 atoms2e4 atoms1e5 atoms
106 atoms107 atoms108 atoms (1.6 microns)exp (Maloy et al. 1995)
Calculations
PREDICTED STRAIN RATE DEPENDENCE OF YIELD STRENGTH IS CONSISTENT
WITH EXPERIMENTS
0
0.02
0.04
0.06
0.08
0.1
0.001 0.1 10 1000 105 107 109 1011
nanoscalemicroscalemacroscale
yie
ld/e
last
ic m
od
ulu
s
strain rate
a
b
c
d
e
f
g h i
Strain Rate and Size Scale Effects
0
1
2
3
4
5
6
7
8
0 0.05 0.1 0.15 0.2
332 atoms23628 atoms
shea
r st
ress
(G
Pa)
shear strain
Size Scale Dependence Observed in Copper Also
0
5
10
15
20
0 0.05 0.1 0.15 0.2 0.25 0.3
100 atoms324 atoms4356 atoms
true
str
ess
(GP
a)
true strain
Size Scale Effect Observed in Tension Also
10-6
10-5
0.0001
0.001
0.01
0.1
1
10-10 10-8 10-6 0.0001 0.01 1
yiel
d s
tres
s/el
asti
c m
odu
lus
size (m)
Volume averaged stress is a function of volume per surface area
large scale experiments
EAM calculations
indentation and torsion
experiments
interfacial forcemicroscopy experiments Conventional theory
predicts that yield stress is independent of sample size Because of their small size, properties of materials to be used in nano-devices are predicted to be vastly different than the properties of materials used in conventional devices
Horstemeyer, M.F. and Baskes, M.I., “Atomistic Finite Deformation Simulations: A Discussion on Length Scale Effects in Relation to Mechanical Stresses,” J. Eng.Matls. Techn. Trans. ASME, Vol. 121, pp. 114-119, 1998.
Horstemeyer, M.F., Plimpton, S.J., and Baskes, M.I."Size Scale and Strain Rate Effects on Yield and Plasticity of Metals," Acta Mater., Vol. 49, pp. 4363-4374, 2001.
Size Scale is related to Dislocation Nucleation (volume per surface area) and strain gradients
• EAM Ni• Expt.
various fcc metals
• Free surface BC
• T = 300 K
0.001
0.010
0.100
1.E-10 1.E-08 1.E-06 1.E-04
volume/surface area (m)
EAM(presentwork)Michalskeand Houston(1998)McElhaneyet al.(1997)Fleck et al.(1994)
• No size scale effects observed– Macroscale torsion experiments, crystal
plasticity, and atomistics show the same plastic spin independent of size scale
– Macroscale internal state variable theory, crystal plasticity, and atomistics show same strain contours independent of size scale
– High rate plastic collapse of same geometry in macroscale experiments show identical result at atomistic results
Crystal plasticity/finite element simulation of torsion single crystal Cu
peaks
oscillation troughs
max CCW rotation
max CW rotation
Plastic Spin
Displ.
Condition/Method wave amplitude ratio
Torsion
experiment (cm) 0.02
finite elements (cm) 0.05
molecular dynamics (solid cylinder)
0.06
molecular dynamics (hollow cylinder)
0.025
Simple Shear
finite elements (cm) 0.25
molecular dynamics (nm) 0.23
peaks
troughs
Plastic Spin is samethroughout lengthscales
A
L
wave amplitude ratio=A/L
STRAIN CONTOURS AT 30% STRAIN - 8x1 Aspect Ratio
ISV
atomistics
crystal plasticity
orientation angle - crystal plasticity
10-6
10-5
0.0001
0.001
0.01
0.1
1
0 2 4 6 8 10
shea
r st
ress
/G
x/y ratio
max crystalline strengthatomistics (8 unit cells)
atomistics (16 unit cells)
atomistics (24 unit cells)
crystal plasticity
macroscale internal state variable theory
Average yield stress for a block of material of varying aspect ratios computed with different modeling methods: a) constant y, varying x; b) constant x, varying y.
(a) (b)
10-5
0.0001
0.001
0.01
0.1
0 2 4 6 8 10
shea
r st
ress
/G
y/x ratio
max crystalline strength
atomistics (8 unit cells)
atomistics (16 unit cells)
atomistics (24 unit cells)
crystal plasticity
macroscale internal state variable theory
60 Å
30 Å
y
xz
13 Å
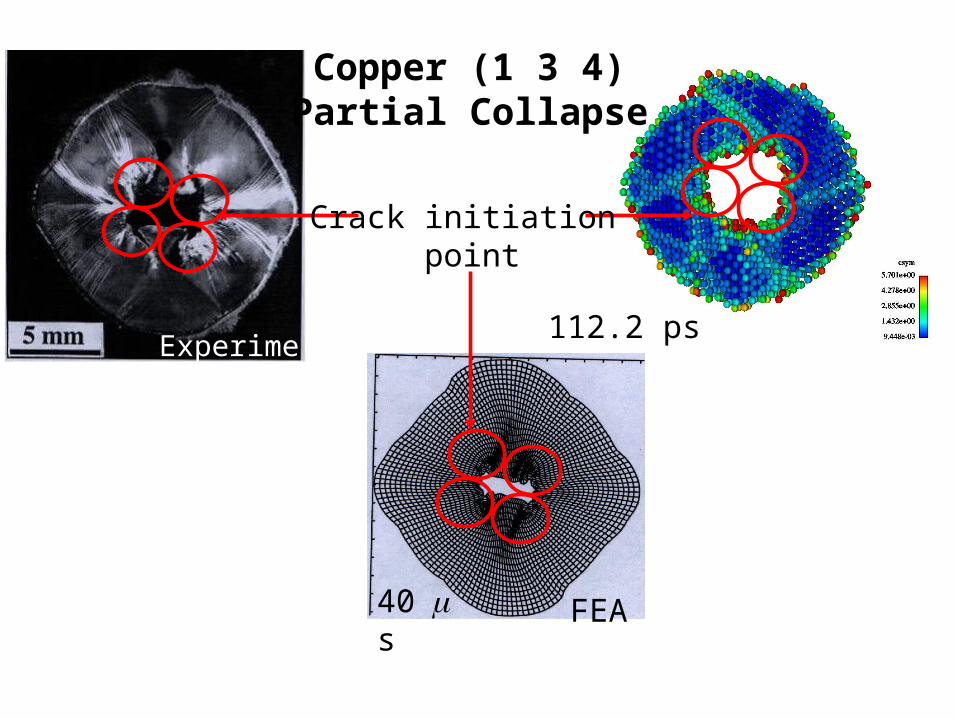
EAM Model, Single-crystal Copper (1 3 4),
Periodic in z (4 unit cells) constant velocity and strain rate of 109 s-1
FEA40s
112.2 psExperimental
Copper (1 3 4)Partial Collapse
Crack initiation point
EAM
219.8 ps
experimental
8.328s (removed at 5.5s)
FEACopper (1 3 4)Fully Collapse
flow localizationpoint
anisotropic inelastic behavior
central curved linesinner boundary
FEA
8.328s (removed at 5.5s)
EAM
Copper (1 3 4)Fully Collapse
EAMExperimental
Size Scale Effect (30Å/18mm)
Copper (1 3 4)
EAMExperimental
outer boundary inner boundary
10.0 s 12.5 s 15.0 s
FEA FEA FEA
172.8 ps230.0 psCopper (0 0 1)
flow localization
Macroscale Modeling of Size Scale Effects
• Observation 1: we observe a size scale effect on stress state
• Observation 2: we do not observe a size scale effect on the geometric, strain, or plastic spin states
• Question: where should the macroscale repository be for the size scale dependence?
• Answer: constitutive relation in dislocation density, not the strain tensor