Noble metal alloy clusters in the gas phase derived from protein templates: unusual recognition of palladium by gold† Ananya Baksi and T. Pradeep * Matrix assisted laser desorption ionization of a mixture of gold and palladium adducts of the protein lysozyme (Lyz) produces naked alloy clusters of the type Au 24 Pd + in the gas phase. While a lysozyme–Au adduct forms Au 18 + , Au 25 + , Au 38 + and Au 102 + ions in the gas phase, lysozyme–Pd alone does not form any analogous cluster. Addition of various transition metal ions (Ag + , Pt 2+ , Pd 2+ , Cu 2+ , Fe 2+ , Ni 2+ and Cr 3+ ) in the adducts contributes to drastic changes in the mass spectrum, but only palladium forms alloys in the gas phase. Besides alloy formation, palladium enhances the formation of specific single component clusters such as Au 38 + . While other metal ions like Cu 2+ help forming Au 25 + selectively, Fe 2+ catalyzes the formation of Au 25 + over all other clusters. Gas phase cluster formation occurs from protein adducts where Au is in the 1+ state while Pd is in the 2+ state. The creation of alloys in the gas phase is not affected whether a physical mixture of Au and Pd adducts or a Au and Pd co-adduct is used as the precursor. The formation of Au cores and AuPd alloy cores of the kind comparable to monolayer protected clusters implies that naked clusters themselves may be nucleated in solution. 1. Introduction Monolayer protected sub-nanometer clusters of noble metals having precise composition are some of the most fascinating materials of current research. 1–5 Intense luminescence, unusual catalysis, and novel physical properties (such as magnetism) have made these systems subjects of passionate research. Despite the discovery of numerous clusters with diverse composition, 6–26 only four clusters, namely, Au 25 (SR) 18 , 7,11 Au 38 (SR) 24 , 23 Au 102 (SR) 40 , 24 and most recently Au 36 (SR) 24 (ref. 26) have been crystallized so far. The possibility of modifying the composition by alloying the core has been explored in several cases. Recently, Au 24 Pd(SR) 18 (ref. 27) and Au 36 Pd 2 (SR) 24 (ref. 28) have been characterized. Along with monolayer protected clusters, analogous systems with macromolecular protection, especially in protein templates, have also been made. 29–48 Bovine serum albumin (BSA), 29–36 lactoferrin (Lf), 37,38 lysozyme (Lyz) 39–44 and some other proteins like insulin 45 are used for these kinds of studies, among which BSA is the most thoroughly studied. Cluster cores composed of Au 25 and Au 13 are most stable in larger proteins like BSA 29 and Lf 37,38 whereas the fairly smaller Au 10 core is being stabilized by Lyz. 43 Analogous clusters of Ag 31 and recently Cu 46 clusters have been investigated, although less commonly. Alloys of Au and Ag 36 with distinct composition have also been prepared in proteins like BSA. Utilization of these clusters using their enhanced luminescence due to F¨ oster resonance energy transfer (FRET) and biocompatibility due to the presence of proteins along with the specic molecular affinity has made them promising for biolabelling applica- tions 30,45 and specic molecular sensing. 40 While protected clusters have been many, the naked analogues of them, i.e. clusters without protection have not been seen in mass spectrometric investigations of gas phase clusters. In other words, while Au 25 (SR) 18 is known to be stable, its gas phase analogue, naked Au 25 , has not been observed. This is true for all the clusters belonging to this category. Creation of clusters with unusual stability in gas phase experiments requires the aggregation and stabilization energy to be removed efficiently. It has been seen recently that this is indeed possible by the use of protein templates in laser desorption and ioniza- tion experiments. 44 These investigations show the formation of gas phase clusters of naked metal cores of magic numbers such as Au 18 + , Au 25 + , Au 38 + and Au 102 + , where cluster formation is proposed to occur in the vicinity of protein, in the gas phase. Such observations suggest the possibility of creating naked alloy cores of specic composition in similar experiments. In this paper, we report the formation of naked alloy cores of specic nuclearity in the gas phase, derived from lysozyme and metal ion-catalyzed enhancement of specic cluster cores. Among a number of metals investigated (Ag, Pt, Pd, Cu, Fe, Ni and Cr), only palladium (Pd) is shown to create alloy cores similar to the ones seen in monolayer protected clusters. A new DST Unit of Nanoscience (DST UNS) and Thematic Unit of Excellence, Department of Chemistry, Indian Institute of Technology Madras, Chennai 600036, India. E-mail: [email protected]; Fax: +91-44 2257-0545 † Electronic supplementary information (ESI) available. See DOI: 10.1039/c3nr04257j Cite this: Nanoscale, 2013, 5, 12245 Received 12th August 2013 Accepted 24th September 2013 DOI: 10.1039/c3nr04257j www.rsc.org/nanoscale This journal is ª The Royal Society of Chemistry 2013 Nanoscale, 2013, 5, 12245–12254 | 12245 Nanoscale PAPER
Received 12th August 2013Accepted 24th September 2013
DOI: 10.1039/c3nr04257j
www.rsc.org/nanoscale
This journal is ª The Royal Society of Ch
Noble metal alloy clusters in the gas phase derived fromprotein templates: unusual recognition of palladium bygold†
Ananya Baksi and T. Pradeep*
Matrix assisted laser desorption ionization of a mixture of gold and palladium adducts of the protein
lysozyme (Lyz) produces naked alloy clusters of the type Au24Pd+ in the gas phase. While a lysozyme–Au
adduct forms Au18+, Au25
+, Au38+ and Au102
+ ions in the gas phase, lysozyme–Pd alone does not form
any analogous cluster. Addition of various transition metal ions (Ag+, Pt2+, Pd2+, Cu2+, Fe2+, Ni2+ and
Cr3+) in the adducts contributes to drastic changes in the mass spectrum, but only palladium forms
alloys in the gas phase. Besides alloy formation, palladium enhances the formation of specific single
component clusters such as Au38+. While other metal ions like Cu2+ help forming Au25
+ selectively, Fe2+
catalyzes the formation of Au25+ over all other clusters. Gas phase cluster formation occurs from protein
adducts where Au is in the 1+ state while Pd is in the 2+ state. The creation of alloys in the gas phase is
not affected whether a physical mixture of Au and Pd adducts or a Au and Pd co-adduct is used as the
precursor. The formation of Au cores and AuPd alloy cores of the kind comparable to monolayer
protected clusters implies that naked clusters themselves may be nucleated in solution.
1. Introduction
Monolayer protected sub-nanometer clusters of noble metalshaving precise composition are some of the most fascinatingmaterials of current research.1–5 Intense luminescence, unusualcatalysis, and novel physical properties (such as magnetism)have made these systems subjects of passionate research.Despite the discovery of numerous clusters with diversecomposition,6–26 only four clusters, namely, Au25(SR)18,7,11
Au38(SR)24,23 Au102(SR)40,24 and most recently Au36(SR)24 (ref. 26)have been crystallized so far. The possibility of modifying thecomposition by alloying the core has been explored in severalcases. Recently, Au24Pd(SR)18 (ref. 27) and Au36Pd2(SR)24 (ref.28) have been characterized. Along with monolayer protectedclusters, analogous systems with macromolecular protection,especially in protein templates, have also beenmade.29–48 Bovineserum albumin (BSA),29–36 lactoferrin (Lf),37,38 lysozyme (Lyz)39–44
and some other proteins like insulin45 are used for these kindsof studies, among which BSA is the most thoroughly studied.Cluster cores composed of Au25 and Au13 are most stable inlarger proteins like BSA29 and Lf37,38 whereas the fairly smallerAu10 core is being stabilized by Lyz.43 Analogous clusters of Ag31
and recently Cu46 clusters have been investigated, although less
ematic Unit of Excellence, Department of
adras, Chennai 600036, India. E-mail:
-0545
tion (ESI) available. See DOI:
emistry 2013
commonly. Alloys of Au and Ag36 with distinct composition havealso been prepared in proteins like BSA. Utilization of theseclusters using their enhanced luminescence due to Fosterresonance energy transfer (FRET) and biocompatibility due tothe presence of proteins along with the specic molecularaffinity has made them promising for biolabelling applica-tions30,45 and specic molecular sensing.40
While protected clusters have been many, the nakedanalogues of them, i.e. clusters without protection have notbeen seen in mass spectrometric investigations of gas phaseclusters. In other words, while Au25(SR)18 is known to be stable,its gas phase analogue, naked Au25, has not been observed. Thisis true for all the clusters belonging to this category. Creation ofclusters with unusual stability in gas phase experimentsrequires the aggregation and stabilization energy to be removedefficiently. It has been seen recently that this is indeed possibleby the use of protein templates in laser desorption and ioniza-tion experiments.44 These investigations show the formation ofgas phase clusters of naked metal cores of magic numbers suchas Au18
+, Au25+, Au38
+ and Au102+, where cluster formation is
proposed to occur in the vicinity of protein, in the gas phase.Such observations suggest the possibility of creating naked
alloy cores of specic composition in similar experiments. Inthis paper, we report the formation of naked alloy cores ofspecic nuclearity in the gas phase, derived from lysozyme andmetal ion-catalyzed enhancement of specic cluster cores.Among a number of metals investigated (Ag, Pt, Pd, Cu, Fe, Niand Cr), only palladium (Pd) is shown to create alloy coressimilar to the ones seen in monolayer protected clusters. A new
Nanoscale, 2013, 5, 12245–12254 | 12245
Nanoscale Paper
cluster core is also observed with Pd. The results reiterate thepossibility of creating stable unprotected alloy cluster nucleiusing macromolecular templates. The presence of Pd ions inthe system catalyzes the formation of Au38
+ when incubatedfor 48 hours. Peak positions remain essentially the same in thecase of positive and negative ion modes. We have also studiedthe effect of ionization method on the number of metal ionattachments to protein and found that the observed affinity isdifferent when the ionization method is changed from ESI toMALDI. Similar peaks are observable whether Au and Pdadducts are mixed together to get the precursor or Pd2+ salt isdirectly added to the Au–Lyz adduct. Specic metal ions canenhance formation of Au25
+. Here we propose a plasma reac-tion in the gas phase between ions and molecules in theplasma. The deposition of such clusters on active substratescan create novel catalysts for examining elementary catalyticprocesses.
2. Experimental2.1. Materials
Tetrachloroauric acid trihydrate (HAuCl4$3H2O) was preparedin our laboratory starting from pure gold. Lysozyme, extractedfrom chicken egg white (>90% purity), and sinapic acid used asa MALDI MS matrix were purchased from Sigma Aldrich.Palladium chloride (PdCl2) was purchased from Rankem. All thechemicals were used without further purication. Deionizedwater was used throughout the experiment.
2.2. Synthesis of metal adducts
When metal ions are added to the protein solution, they aretaken up by the amino acids of the protein and form adducts orcomplexes. In the case of addition of Au3+ to protein, it resultsin the formation of an Au+–protein adduct as seen in X-rayphotoelectron spectroscopy.38 Further reduction of this goldbound protein complex under basic conditions produces solu-tion phase luminescent quantum clusters.29 Here we haverestricted our study up to the complex formation step. Solutionphase cluster formation has been studied elsewhere.43 Themetal–protein adducts were prepared in two different ways:
(a) Au–Lyz and Pd–Lyz adducts were prepared by mixing Lyzand the specic metal salts to get a nal concentration of 1.5mM Lyz and 5 mM in terms of metal ions and incubating themixture for 2 hours. The resulting adducts were mixed togetherin different concentration ratios (Au : Pd ¼ 1 : 3, 1 : 1 and 3 : 1)and incubated for 4 hours and the resultant product was sub-jected to MALDI MS analysis. These samples are labeled as Au–Pd mixed adducts. The best result was obtained for the 3 : 1Au : Pd mixed adduct.
(b) For the other case, rst, the Au–Lyz adduct was preparedas above mentioned by mixing Au3+ and Lyz followed by incu-bating the mixture. To this adduct, different volumes of PdCl2were added directly to get Au–Lyz : PdCl2 ratios of 5 : 1, 5 : 2,5 : 3, and 5 : 4. The resultant mixture was further incubated forfour hours and subjected to MALDI MS study. These samplesare labeled as Au–Pd co-adducts.
12246 | Nanoscale, 2013, 5, 12245–12254
2.3. Spectrometric analysis and instrumentation
MALDI MS analysis. Experiments were conducted in amatrixassisted laser desorption ionization time-of-ight (MALDI TOF)spectrometer. For this, an Applied Biosystems Voyager-De ProMALDI TOF instrument was used. The spectra were collected inthe m/z range of 2000–100 000 using a N2 laser at 337 nm. Foracquiring each spectrum, a minimum of 100 laser shots werered and the data were averaged. Laser power was kept at aslightly higher value than the threshold power for this system(threshold laser power for these systems is about 1800 in termsof the instrumental unit, we have kept the power at 2200). Theminimum delay time used was 10 ns and the maximum was1500 ns for a delay time-dependent experiment. For all otherexperiments, the delay time was kept at 1000 ns. The samplesprobed were protein–metal conjugates or adducts of speciccomposition. Laser induced desorption–ionization and associ-ated chemistry produced naked clusters in the gas phase.Instrumental resolution was Dm/z ¼ 2 Da in the range investi-gated. All the compositions were compared with their isotopepatterns. Sinapic acid was used as a matrix for these experi-ments. To 10 mg of sinapic acid, 1 mL of 0.1% triuoroaceticacid (TFA) and an acetonitrile mixture (3 : 1) were added. Forspotting, 100 mL of matrix was mixed well with 5 mL of thesample to be analyzed and spotted to get a dry droplet. Thesame procedure was repeated at least for three different sets foreach sample (prepared separately) to check the reproducibility.All the instrument parameters are listed below for linear posi-tive mode and are applicable for the specic instrument used:
Instrument mode: linear, positiveDelay time: 1000 ns (minimum is 10 ns)Laser intensity: 2200 (instrumental unit)Mass range (Da): 2000–100 000Low mass gate (Da): 500Calibrated for the matrix: Sinapic acidVoltages:Accelerating: 2000 VGrid: 87 (0.0–99.9% is the instrument range)Grid wire: 0.03 (0.000–0.300% is the range)ESI MS analysis. For the solution phase study, electrospray
ionization mass spectrometry (ESI MS) was carried out. For thisexperiment, an Applied Biosystems 3200 QTRAP LC/MS/MS wasused. Spectra were collected in the m/z range of 500–1700 anddata were averaged for 100 scans. Declustering and entrancepotentials were optimized at 50 and 10 V, respectively. Asprepared Au, Pd and mixed adducts were used for this purpose.All the spectra were collected in positive ion mode. 10 mL of TFAwas added to 1 mL of these solutions to enhance ionization.Spectra were deconvoluted using Magtran soware to get singlycharged species from a series of multiply charged spectra (forLyz, the parent spectrum contains +9 to +12 charge states in them/z window investigated).
XPS analysis. XPS analysis was done using an Omicron ESCAprobe spectrometer and polychromatic Mg Ka (hn ¼ 1236.6 eV)was used as the ionization source. Curves were smoothed andtted using the CasaXPS soware. For this analysis, a 3 : 1 Au–Pd mixed adduct of Lyz was used.
This journal is ª The Royal Society of Chemistry 2013
Paper Nanoscale
SEM/EDAX analysis. Scanning Electron Microscopy (SEM)and Energy Dispersive Analysis of X-ray (EDAX) images werecollected using an FEI QUANTA-200 SEM instrument.
3. Results and discussion3.1. Gas phase gold–palladium alloy formation
For our study, we have used a small protein lysozyme (Lyz,molecular weight 14.3 kDa) as the template for gas phase alloycluster formation. It contains 129 amino acid residues amongwhich eight are cysteines forming 4 disulphide bonds. Theoverall size of the protein is around 4 nm and contains 49%helical structure. The structure and position of the cysteinesand disulphide bonds are presented in Fig. S1.† This helicalstructure is greatly affected by the breakage of disulphide bondsand an overall 28% loss in helicity was observed in a previousstudy upon cluster formation.43 Unlike other proteins, the Lyzmass spectrum is dominated by its monomer as well as aggre-gates. For example, Lyz+ appears at 14.3 kDa, whereas Lyz2
+,Lyz3
+, and Lyz4+ appear at 28.6, 42.9, and 57.2 kDa, respectively.
Once metal ions like Au3+ are added to the system, amino acidsreduce Au3+ to Au+ and metal–protein adducts form. Adductsform when Pd2+ too is added to the system. These transitionmetals have higher affinity towards sulphur; therefore it isobvious that an M–S bond will be formed. By this process, thedisulphide bond has to break to accommodate multiple metalions inside the protein. For the Au3+ addition, we have seen amaximum of 10 Au attachments to protein,44 which implies thatthere are other binding sites also present in the system likecarboxyl or amine groups. When both Au and Pd adducts aremixed together as described in 2.2, they form a mixed adduct.These adducts are subjected to MALDI MS analysis and thecorresponding mass spectra were collected. Fig. 1 compares the
Fig. 1 MALDI MS study of Au and Au–Pd adducts of Lyz in the positive ion modein the range of 2000–100 000 Da. The 3000–10 000 Da region has beenexpanded in the inset. Au–Pd adducts show distinctly different features comparedto Au-alone adducts, due to the formation of alloys. The assigned peaks matchwell with the theoretical values.
This journal is ª The Royal Society of Chemistry 2013
positive ion MALDI MS spectra of the Au adduct of Lyz withthose of mixed Au and Pd adducts and parent Lyz. In the fullmass range, Lyz shows a series of peaks attributed to Lyz+, Lyz2
+,Lyz3
+, etc. In the lower mass region (m/z 2000–11 000), thespectrum is dominated by the +2 charge state, no other chargestate or fragments were observed. As before, the Au adductshows bare cluster cores with a specic number of atoms likeAu18
+, Au25+, Au38
+ and Au102+.44 These peaks appear with
additional features separated by one gold atom and they may berepresented as Au18�n
+, Au25�n+, etc. (n ¼ 0, 1, 2,.). In all of the
clusters, the cores try to achieve electronic stability by accruingelectrons from ligands and this is shown in the form of sulfuraddition peaks for specic clusters like Au18S4
+.In the mass spectrum of the Au–Pd adduct, besides the
peaks observed for Au, new peaks attributed to alloys are alsoobserved. These are particularly seen in the case of cluster ionsof Au18 and Au25. While the cluster region of Au38 does notshow any alloy formation, the peak intensity is greatlyenhanced in comparison to the Au adduct. The spectra in theAu18 and Au25 region show markedly different distributions.While Au18
+ and Au25+ were the most intense features in the
parent adduct, the alloy ions exhibit a completely differentintensity pattern possibly due to their different stability. Allthe assigned peaks match well with their calculated spectra asrepresented in the inset of Fig. 1. In the Au18
+ region, a seriesof peaks appear in an envelope starting from Au16Pd
+ andcontinue up to Au19Pd
+. The very next peak appears withanother Pd attached to it. In this envelope, Au20Pd2S
+ is themost intense peak. Aer Au22PdS
+, this envelope overlaps withthe Au25
+ region. Starting from Au23Pd+, the envelope
continues with Pd attachment with a few sulfur additions.Unlike in the solution phase, where Au24Pd(SR)18 is found tobe the most stable,27 Au27Pd
+ shows the highest intensity inthe gas phase, although neighboring peaks do not vary muchin terms of abundance. This implies nearly equal stability ofthe alloy cores in that region in the gas phase.
Interestingly, the Au38 region does not show any Pd attach-ment. Although it is possible to get Au36Pd2(SR)2428 by dopingPd to Au38 in the solution phase, using a protein template, it isnot easy to get the same core in the gas phase as protein allowsAu38
+ to acquire structural and electronic stability as alreadydiscussed above. One extra envelope appears aer the Au38region which was not present in the case of the Au adduct. Here,Au47PdS2
+ is having the maximum intensity. Other peaks withPd doping have also been observed, although the intensities donot differ much. It should be noted that Au47
+ is not a magicnumber core neither by the number of core atoms nor by theelectron count and it was not observed with the Au–Lyz adduct.So the presence of Pd helps in the formation of metastablecluster cores in the gas phase through the interaction withprotein. The same sample was analyzed in linear negative modetoo. Peak positions remain essentially the same in negative ionmode although there is slight change in their intensity distri-bution. No new peak appears in this case (Fig. S2†).
We have also conducted a laser intensity-dependent study tocheck whether there is any role of laser intensity in the forma-tion of these clusters. The threshold laser intensity is the
Nanoscale, 2013, 5, 12245–12254 | 12247
Fig. 2 MALDI MS study of the effect of metal ions on the gas phase alloyformation. 3d, 4d and 5d metal ions, known to form alloys with gold, are chosenfor this study. All the concentration ratios of Au and M-adducts are the same.Mixed adducts of gold and individual metal have been used for this study. Only Pdshows distinct alloy formation, which has been highlighted.
Nanoscale Paper
minimum intensity where we can see the appearance of thespecic peaks. It is oen a practice to keep the experimentallaser intensity slightly higher than the threshold intensity toavoid laser induced damage and at the same time get goodquality data. In our case, threshold laser intensity was found tobe 1800 in terms of the instrumental unit (details of experi-mental parameters are given in the Experimental section underthe MALDI MS analysis sub-section). At the minimum laserintensity (i.e., threshold intensity) also we can see the samepeaks as described above for the 3 : 1 Au : Pd mixed adduct. Wehave slowly increased the intensity to 2600 with an increment of200 step size (Fig. S3†). Peak positions remain the same as wellas the intensity distribution for all the laser intensities studied.The best spectrum was observed with a laser intensity of 2200and the same was used for all the other studies.
Formation of specic cores can be explained in terms of theenhanced stability of such cores in the gas phase. Au25 and Au38systems are known to have magic number stability through aclosed shell electronic structure. Magic number conguration(n*) requires a certain number of delocalized electrons like n*¼2, 8, 18 (20), 34 (40), 58, 92, etc. For example, Au38 contains38 delocalized electrons and hence is not a magic number. Toachieve magic number stability, it has to lose 4 electrons whichis possible by interacting with the protein. The key observationfrom a theoretical calculation reported before44 predicts thatthese clusters formed in the gas phase namely, Au25
+, Au38+, etc.
do not have a magic number to begin with but require theremoval of n–n*¼ 5, 4 electrons, respectively to achieve it.44 Thisis possible through the interaction with the cystines (dimericcysteine). We have calculated the interaction with only thecystine part of the protein, as simulating the whole protein isreally difficult. When one cystine (S–S bond) breaks on thecluster surface, two cysteines form and the cluster core loses twoelectrons by this process. For the Au38
+ system, it requiresinteraction with two cystines to lose 4 electrons and become a34 electron system giving magic number stability. By thisprocess, a HOMO–LUMO gap of DHL ¼ 0.48 eV opens up(whereas for the neutral Au38 cluster, DHL ¼ 0.0 eV) and thecluster gets electronic stabilization. This is also reected intheir calculated structures.
From this part of the study, it can be concluded that Pdforms an alloy with gold in the gas phase and it also facilitatesthe emergence of metastable clusters in the gas phase. It isnoted that very small gas phase Au–Pd alloys have been repor-ted.49,50 Incorporation of a single Pd to Au cluster core enhancesits catalytic activity tremendously.49
3.2. Unusual recognition of palladium by gold in the gasphase
As discussed in the previous section, Pd is recognized by Au inthe gas phase. There are several metals known to form alloyswith gold in the bulk as well as in the nanosize regime, like Ag,Cu, Pt, etc. In Fig. 2, we present the mass spectra with differentmetal ions spanning the 3d, 4d and 5d elements which aretypically known to form alloys with gold. As we can see, only inthe case of Pd, distinct alloy formation is noticed and in this
12248 | Nanoscale, 2013, 5, 12245–12254
spectrum we mark a region with a black rectangle to show thedifference. Au–Lyz andM–Lyz (M¼ Ag, Pt, Pd, Cu, Ni, Cr and Fe)adducts were mixed together in a 3 : 1 ratio and a MALDI MSstudy was carried out. With the addition of the Pt–Lyz adduct,nearly all the peak positions remain the same but the envelopechanges and the Au18S4
+ region becomes more intense than theAu25
+ region. The Au19S4+ peak splits into two, separated by
100 mass units (Fig. S4†). The peak at m/z 3839 can be assignedas Au19S3
+ and the next peak at m/z 3935 can be attributed toAu19S6
+, considering no alloy formation with Pt. Since atomicweights of Pt and Au are very close, it is difficult to decidewhether any alloy formation has happened or not in this case.Ag is well known to form both solution phase AgQC and AuAgalloy clusters in proteins and also with monolayer protection.But the gas phase reactivity does not match with the expectedsolution phase interaction as Ag does not form an alloy with Auunder similar conditions. Several gas phase Au–Ag alloys havebeen reported previously.51–53 Very small cores like AumAgn (m +n ¼ 3, 5)51 as well as bigger cores like AumAgn (m + n ¼ 19–45)53
are also studied in the context of gas phase reactivity likebinding activity with O2 and CO for conversion to CO2. But inthe case of our gas phase cluster synthesis using proteintemplates, without any reducing agent, no alloy formation wasobserved. The Au25
+ intensity gets enhanced in the presence ofAg to a greater extent than Au alone but the peak positionsremain the same (Fig. S5†). Therefore, we can catalytically
This journal is ª The Royal Society of Chemistry 2013
Paper Nanoscale
enhance the formation of Au25+ in the gas phase from the protein
template by incorporating Ag in the system. Copper is also knownto form an alloy with gold and recently Negishi's group could dopeamaximum of ve copper atoms in the Au25(SR)18 system.54 In thegas phase, however, a drastic change was found in the overallspectrum upon Cu addition. As Cu has a high affinity towardssulphur, it occupies Au binding sites in Lyz. This effect is reectedin themain protein peak also where only a few Au attachments areobserved. In the inset of Fig. S6,† a monomer of the Au–proteinadduct and the Au–Cu adduct of Lyz is compared. It is clear that inthe case of the Au–Cu adduct, the number of Au attachments isless (amaximum of 10 Au attachments are seen for the Au adduct,whereas only two Au attachments are seen for the Au–Cu adduct).The same thing is also reected in the aggregatesmarked by greendotted circles. Interesting changes occur in the lower mass regionwhere gas phase clusters form. The mass spectrum indicates thatexclusively Au25
+ species form in that range and the shape of theenvelope changes (Fig. S6 inset (b)†). So by adding Cu to the gasphase Au precursor, we can selectively get Au25
+ prior to themixture of clusters. In the presence of 3d transitionmetals like Ni,Cr and Fe, the intensity of the Au25
+ region enhances relative toAu18
+ and Au38+ regions, compared to the Au-alone case (Fig. S7–
S9†). Therefore, catalytic enhancement of Au25+ is possible by
using these metal ions. This effect is maximum in the case of Feaddition where the intensity of Au18S4
+ and Au38+ regions remains
the same but the intensity of the Au25+ region increases to a
greater extent compared to Ni and Cr. In all the cases, the Au18S4+
intensity decreases. No alloy formation was observed in any ofthese cases. This study concludes that Pd is the only metalrecognized (selected) by Au in gas phase alloy formation. If weconsider electrochemical potential for Au, Pd, Pt, Ag and Cu,standard reduction potentials are as follows:
Cu2+ + e� / Cu+, E 0 ¼ 0.159 V
Cu+ + e� / Cu, E 0 ¼ 0.520 V
Ag+ + e� / Ag, E 0 ¼ 0.7996 V
Pd2+ + 2e� / Pd, E 0 ¼ 0.915 V
Pt2+ + 2e� / Pt, E 0 ¼ 1.188 V
Au3+ + 2e� / Au+, E 0 ¼ 1.36 V
Au+ + e� / Au, E 0 ¼ 1.83 V
From these electrode potentials, it is clear that Au3+ can beeasily reduced to an intermediate Au+–protein complex. It is thisAu+–complex that forms the Au clusters in the gas phase whichare in the Au(0) state. Both Pd2+ and Pt2+ have reductionpotentials next to Au+ and it is likely that Pd2+ and Pt2+ can bereduced to Pd0 and Pt0 in the gas phase. But as Pt and Au massnumbers are almost the same, we cannot exactly tell if there isany alloy formation or not with Pt. But Pd and Au mass differ-ence is nearly 90 amu and it is rather easy to distinguish Pdadded alloy cluster peaks from the original Au cluster peaks.
This journal is ª The Royal Society of Chemistry 2013
3.3. Difference in metal ion binding
From the previous discussion, it is clear that only Pd is recog-nized by gold in the gas phase. If we see carefully, the bindingtendency of these metal ions is completely different from eachother. To verify our argument, we have performed a detailed ESIMS and MALDI MS study for each metal adduct of protein,namely, Au, Ag, Pd, and Pt. The same protein to metal ratio (Lyz1.5 mM and M ion 5 mM) was used to avoid concentration-dependent issues. As we have shown before, with all theconcentration of Au3+ used, we can see only upto 3 Au attach-ments to the protein. As there are only 8 cysteines in the proteinand Au binding is strongly dependent on the number ofcysteine residues and hence aer a certain Au3+ concentrationbinding sites are saturated. When these adducts were examinedusing MALDI MS, a maximum of 10 Au attachments wereobserved and bare clusters were formed as already described.This decrease in the number of Au attachments in the solutionphase mass spectrum (ESI MS) can be attributed to charge-induced dissociation of the high charge states (+8 to +12 arenormally observable for Lyz and Lyz2 in positive mode ESIMS).43,44 Binding of Ag ions to protein is completely differentfrom Au (Fig. S10†). For both monomer and dimer regions, a +8charge state shows the maximum number of Ag attachments(more than 12 Ag attachments are observed). Another inter-esting observation is that for this specic charge state, twoconsecutive Ag bound peaks have the same intensity. These 8 Agattachments can be justied considering 8 cysteines and similarintensity patterns can be due to the breakage of 4 cystine bonds.Once one cystine bond is broken, two Ag can be attached to twodifferent sulphur ends with equal probability and hence thesame intensity for two consecutive Ag bound peaks. So, Ag canbe attached to cysteines as well as –COOH or NH2 groups (asmore than 8 Ag are attached) but the binding affinity isdifferent. When the same sample is used for MALDI MS anal-ysis, it shows no Ag attachment to it, which implies that Ag isloosely bound to the protein and at the experimental conditionsused, it desorbs from the template and we cannot see anyattachment. We have not seen any gas phase bare Ag clustereither, unlike in the case of Au (Fig. S11†). For the Pd–Lyzadduct, we see multiple peaks separated by Pd in the ESI MSanalysis. A maximum of 8 Pd attachments can be seen clearly inthis case (Fig. S12†). As Pd has multiple isotopes, the peaks arebroader but due to poor resolution, clear isotope distribution isnot seen for that charge state. The same sample shows only asingle Pd attachment in MALDI MS analysis (Fig. S13†) but nogas phase Pd clusters were observed. When Pt–Lyz adducts werestudied using ESI MS analysis, a maximum of 6 Pt attachmentswere observed (Fig. S14†). Strangely, odd numbered Pt attachedpeak intensities are very poor compared to the even numberedPt attached peaks which again proves indirectly the breakage ofS–S bonds in cystines. Unlike in other metal ions, Pt showsnearly the same number of attachments in MALDI MS alsowhere we see a broad peak separated by 8 Pt from the parentprotein peak and the free protein peak is not observed in thiscase. Dimer, trimer, etc. comprise a multiple of 8 Pt as observedfor Au. The peak position remains the same whether we use
Nanoscale, 2013, 5, 12245–12254 | 12249
Nanoscale Paper
additional NaOH or NaBH4 (Fig. S15†). This conrms strongbinding affinity of Pt towards Lyz. From these studies, it isconrmed that metal ion binding affinities are different foreach system and the observed spectrum depends strongly onthe ionization method used (ESI or MALDI).
3.4. Solution phase studies of Au–Pd mixed adducts
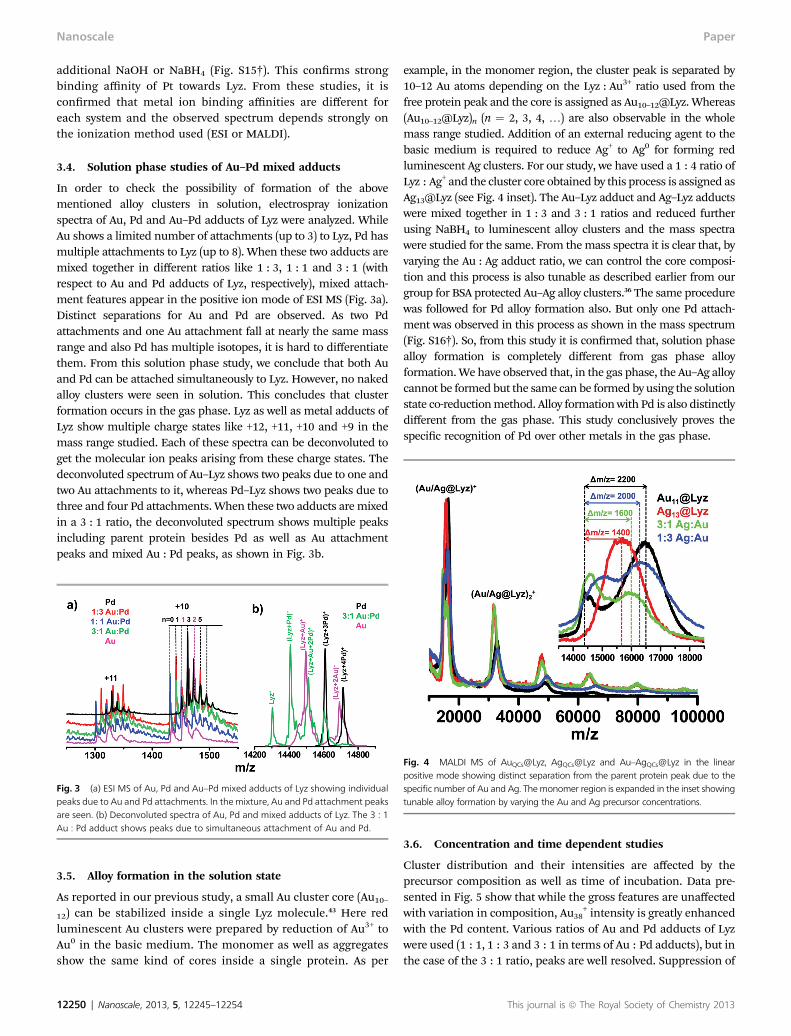
In order to check the possibility of formation of the abovementioned alloy clusters in solution, electrospray ionizationspectra of Au, Pd and Au–Pd adducts of Lyz were analyzed. WhileAu shows a limited number of attachments (up to 3) to Lyz, Pd hasmultiple attachments to Lyz (up to 8). When these two adducts aremixed together in different ratios like 1 : 3, 1 : 1 and 3 : 1 (withrespect to Au and Pd adducts of Lyz, respectively), mixed attach-ment features appear in the positive ion mode of ESI MS (Fig. 3a).Distinct separations for Au and Pd are observed. As two Pdattachments and one Au attachment fall at nearly the same massrange and also Pd has multiple isotopes, it is hard to differentiatethem. From this solution phase study, we conclude that both Auand Pd can be attached simultaneously to Lyz. However, no nakedalloy clusters were seen in solution. This concludes that clusterformation occurs in the gas phase. Lyz as well as metal adducts ofLyz show multiple charge states like +12, +11, +10 and +9 in themass range studied. Each of these spectra can be deconvoluted toget the molecular ion peaks arising from these charge states. Thedeconvoluted spectrum of Au–Lyz shows two peaks due to one andtwo Au attachments to it, whereas Pd–Lyz shows two peaks due tothree and four Pd attachments. When these two adducts aremixedin a 3 : 1 ratio, the deconvoluted spectrum shows multiple peaksincluding parent protein besides Pd as well as Au attachmentpeaks and mixed Au : Pd peaks, as shown in Fig. 3b.
Fig. 3 (a) ESI MS of Au, Pd and Au–Pd mixed adducts of Lyz showing individualpeaks due to Au and Pd attachments. In themixture, Au and Pd attachment peaksare seen. (b) Deconvoluted spectra of Au, Pd and mixed adducts of Lyz. The 3 : 1Au : Pd adduct shows peaks due to simultaneous attachment of Au and Pd.
Fig. 4 MALDI MS of AuQCs@Lyz, AgQCs@Lyz and Au–AgQCs@Lyz in the linearpositive mode showing distinct separation from the parent protein peak due to thespecific number of Au and Ag. Themonomer region is expanded in the inset showingtunable alloy formation by varying the Au and Ag precursor concentrations.
3.5. Alloy formation in the solution state
As reported in our previous study, a small Au cluster core (Au10–12) can be stabilized inside a single Lyz molecule.43 Here redluminescent Au clusters were prepared by reduction of Au3+ toAu0 in the basic medium. The monomer as well as aggregatesshow the same kind of cores inside a single protein. As per
12250 | Nanoscale, 2013, 5, 12245–12254
example, in the monomer region, the cluster peak is separated by10–12 Au atoms depending on the Lyz : Au3+ ratio used from thefree protein peak and the core is assigned as Au10–12@Lyz. Whereas(Au10–12@Lyz)n (n ¼ 2, 3, 4, .) are also observable in the wholemass range studied. Addition of an external reducing agent to thebasic medium is required to reduce Ag+ to Ag0 for forming redluminescent Ag clusters. For our study, we have used a 1 : 4 ratio ofLyz : Ag+ and the cluster core obtained by this process is assigned asAg13@Lyz (see Fig. 4 inset). The Au–Lyz adduct and Ag–Lyz adductswere mixed together in 1 : 3 and 3 : 1 ratios and reduced furtherusing NaBH4 to luminescent alloy clusters and the mass spectrawere studied for the same. From themass spectra it is clear that, byvarying the Au : Ag adduct ratio, we can control the core composi-tion and this process is also tunable as described earlier from ourgroup for BSA protected Au–Ag alloy clusters.36 The same procedurewas followed for Pd alloy formation also. But only one Pd attach-ment was observed in this process as shown in the mass spectrum(Fig. S16†). So, from this study it is conrmed that, solution phasealloy formation is completely different from gas phase alloyformation.We have observed that, in the gas phase, the Au–Ag alloycannot be formed but the same can be formed by using the solutionstate co-reductionmethod. Alloy formationwith Pd is also distinctlydifferent from the gas phase. This study conclusively proves thespecic recognition of Pd over other metals in the gas phase.
3.6. Concentration and time dependent studies
Cluster distribution and their intensities are affected by theprecursor composition as well as time of incubation. Data pre-sented in Fig. 5 show that while the gross features are unaffectedwith variation in composition, Au38
+ intensity is greatly enhancedwith the Pd content. Various ratios of Au and Pd adducts of Lyzwere used (1 : 1, 1 : 3 and 3 : 1 in terms of Au : Pd adducts), but inthe case of the 3 : 1 ratio, peaks are well resolved. Suppression of
This journal is ª The Royal Society of Chemistry 2013
Fig. 5 (a) Concentration dependent study of different Au : Pd adducts of Lyz.The 3 : 1 Au : Pd adduct of Lyz shows good intensity and resolvable peak sepa-ration. (b) Time dependent study of the 3 : 1 Au : Pd adduct of Lyz showingcatalytic enhancement of Au38
+ over incubation time.
Paper Nanoscale
other clusters and enhancement of Au38+ are also seen upon
increasing the time of incubation to 48 hours. A catalyticenhancement of Au38
+ is inferred from the spectra.
3.7. Direct addition of PdCl2
To check whether the preformed M-protein adduct is necessaryfor alloy formation, we designed our experiment in a slightlydifferent way. To verify the role of the Pd precursor in the alloy
Fig. 6 Effect of direct PdCl2 addition to Au–Lyz adducts probed by MALDI MSwith different Au–Lyz : PdCl2 ratios (as mentioned on the traces). With minimumPdCl2 addition, alloy forms as observed in the Au18
+ region but the Au25+ region
remains unchanged. In the case of the highest Au–Lyz : PdCl2 ratio, alloy forma-tion is observed with a few sulfur attachments.
This journal is ª The Royal Society of Chemistry 2013
formation process, PdCl2 was added directly to the Au–Lyz adductand the product was examined in MALDI MS. For this study,PdCl2 was directly added to Au–Lyz in various ratios (Au–Lyz : PdCl2 ¼ 5 : 1, 5 : 2, 5 : 3 and 5 : 4). Gas phase alloy forma-tion was observable with minimum PdCl2 addition also in theAu18
+ region (Fig. 6), where starting from Au16PdS+ to Au19PdS
+,peaks appear with equal Au spacing. Aer Au19PdS
+, the next peakis separated by Pd and assigned as Au19Pd2S
+. In this case also, wefound Au20Pd2S
+ to be the most intense peak in the Au18+ region
as seen in the case of the Au–Pdmixed adduct discussed in 3.1. Inthe Au25
+ region, we have a single Pd attachment to the core as wehave seen for the previous case. A small hump appears just aerthe Au25
+ peak, separated bym/z 106 and attributed to Au25Pd+. It
is clear that alloy cores remain the same in terms of theirnuclearity for both the cases. Therefore, it can be said that Lyz canuptake Pd simultaneously in the presence of Au also. From theprotein template, both the metals come to the gas phase and thealloy was formed. This study again proves gas phase associationof Au and Pd to form alloy clusters.
3.8. XPS and EDAX analyses
Once metal salts are added to the protein, amino acid residuesreduce metal ions and the protein itself gets oxidized. In the caseof Au3+ addition to protein, Au3+ gets reduced to Au1+ by theamino acids under normal conditions as previously reported forAu clusters synthesized in Lf. We have used the Au–Pd mixedadduct for XPS analysis. In our case also we found that the Au 4f7/2 binding energy appears at 85.0 eV (Fig. 7A) in the proteinconjugate conrming that most of the Au3+ is reduced to Au1+ bythe protein. But for Pd, the 3d5/2 binding energy is at 337.1 eV(Fig. 7B) corresponding to Pd2+. Therefore, amino acids ofprotein cannot reduce Pd2+ to Pd0 or any intermediate oxidationstate in this process. The presence of all possible elements isproved by the survey spectrum as well as by SEM EDAX (Fig. 7).From this study, we determined the atomic ratios of Au : S : Pd tobe 1 : 3.6 : 0.6 and the expected ratio is 1 : 2.4 : 1 on the basis ofcomponents used. From the EDAXmapping, it is conrmed that,Au and Pd are taken up together by the protein.
3.9. Mechanism of alloy formation and delay timedependence
While the cluster is being formed, there is a need to remove theheat of aggregation from the system. This is oen practicedusing the macromolecular template. Protein being a largemolecule has a high number of degrees of freedom and can actas a heat reservoir to allow cluster growth in the gas phase. Lyzis a very small protein having only 8 Cys residues. So it isunlikely that Au38
+ or Au47PdS2+ will form inside a single
molecule of Lyz. From XPS study, we have conrmed that, Au0
or Pd0 does not exist in the solution under normal reactionconditions. Therefore, we propose involvement of plasma inthis reaction. Gaseous plasma is produced by heating thesample with laser. This plasma contains ions, molecules,aggregates, protein molecules, Lyz–Au adducts, Lyz–Pd adductsas well as mixed adducts and electrons. Under gaseous plasmaconditions, conformation of the adducts will not be the same
Nanoscale, 2013, 5, 12245–12254 | 12251
Fig. 7 SEM-EDAX of the 3 : 1 Au : Pd adduct of Lyz, showing the presence of all possible elements. The inset (i) shows the EDAX mapping of the object shown in theSEM image at the top. (A) and (B) are XPS spectra of Au–Lyz and Pd–Lyz adducts showing that Au3+ is reduced to Au1+ after adduct formation with protein, whereasPd2+ remains in the same oxidation state.
Nanoscale Paper
like in the solution phase. Constituents will interact with eachother to form larger aggregates. Bare cluster formation andstabilization requires interaction with the protein molecules.This can happen through several unimolecular reactions like:
Aun+ + Aum / Aun+m
+, m ¼ 0, 1, 2, .; n ¼ 1, 2, 3, . (1)
[Lyz–Aum]+ + Aun / [Lyz–Aum+n]
+,
m ¼ 0, 1, 2, .; n ¼ 1, 2, 3, . (2)
[Lyz–Aun]+ + Lyz–Aum / [Lyz–Aun+k]
+ + [Lyz–Aum–k],
k(<m) ¼ 1, 2, .; n, m ¼ 1, 2, 3, . (3)
Eqn (3) involves intermolecular metal ion transfer. We knowthat, when the small Au cluster core nucleates, it attracts otherAu atoms or ions towards itself through aurophilic interactionsand starts growing. For solution phase cluster growth also wesee intermolecular metal ion transfer, which is reected in theregeneration of free protein upon longer incubation time.38,43
The same kind of reactions can be written for Pd also. Here wenote that, we did not see free Pd clusters in the gas phase in ourexperimental conditions. Although, Pdn clusters are known to existin the gas phase and their reactivity is also studied.55 Au and Pdions and adducts are formed simultaneously inside the plasmaand can interact with each other to form alloys. Here we note that,we did not see more than two Pd attachments in any case.
Fig. 8 MALDI MS spectra of delay time dependent bare cluster formation ofAu+@Lyz. There is no signature of any new cluster core formation with varyingdelay times. The inset shows an expanded view of m/z 3000 to 9000. Withchanging delay times no new peak appears.
Aun+ + Pdm / AunPdm
+, m ¼ 0, 1, 2, .; n ¼ 1, 2, . (4)
Aun + Pdm+ / AunPdm
+, m ¼ 0, 1, 2, .; n ¼ 1, 2, . (5)
[Lyz–Aum]+ + Pdn / [Lyz–AumPdn]
+,
m ¼ 0, 1, 2, .; n ¼ 1, 2, . (6)
12252 | Nanoscale, 2013, 5, 12245–12254
[Lyz–Aun]+ + Lyz–Pdm / [Lyz–AunPdk]
+ + [Lyz–Pdm–k],
k(<m) ¼ 1, 2,.; n, m ¼ 1, 2,.(7)
Besides these, there can be several reactions in which anionsand electrons can participate. Similar kinds of mechanisms canbe extended for negative ions also as the same clusters form inthe negative mode. In the case of laser irradiation, it is alwaysseen that the C–S bond breaks and MnSm aggregates form. In
This journal is ª The Royal Society of Chemistry 2013
Paper Nanoscale
our study, we observed cluster cores with sulfur attachment(Au20Pd2S
+, Au47PdS2+, etc.) which again proves involvement of
proteins in cluster formation as there is no other source forsulphur in the system.
This kind of plasma reactions can also happen with largeprotein aggregates due to the delayed extraction of the ionizedspecies. The nite time lag between laser desorption/ioniza-tion and extraction of ions is referred to as the delay time.Normally, for smaller molecules, a shorter delay time isenough to efficiently extract all the ions to the detector but forlarger molecules, like proteins, a longer delay time is generallyused. To check the delay time dependence on the gas phasecluster formation, we have performed the experiment with theAu–Lyz adduct. If we allow the plasma to react longer, we mayget larger cluster cores or a certain cluster core may form inhigh abundance. However, we saw that there is actually notmuch delay time dependence as both the cluster cores as wellas protein are small. With varying delay time, the peak posi-tions remain essentially the same. In Fig. 8 delay timedependent-MALDI MS spectra are plotted for the Au+@Lyzadduct and from these spectra, it is evident that no new peaksappear. In the inset, m/z 3000–9000 has been expanded. In thisregion alone, the peak intensities change with delay time.Thus we conclude that the delay time used for the reaction issufficient for inter- and intra-molecular reactions to occurwithin the plasma.
4. Conclusions
The data presented show the existence of naked clusters ofspecic composition. Incidentally at least one of the clustercores found, namely Au24Pd
+ is known to exist in the mono-layer protected clusters. Besides these alloy clusters, thepresence of Pd in the condensed phase enhanced the forma-tion of one component clusters such as Au38
+. The resultspoint to the catalytic stabilization of certain cluster nuclei. Itis seen that Pd is the most important metal recognized by thenaked Au clusters while other metals do not show alloyformation under such conditions. Although formation ofselective clusters like Au25
+ is observed in the case of Cu2+
addition, the presence of silver enhances the formation ofAu25
+ while Pt2+ enhances Au18S4+. Other metal ions used in
this study like Fe2+, Ni2+, and Cr3+ catalyze the formation ofthe Au25�n
+ envelope. Fe2+ is catalyzed most efficiently amongthe three ions. Clusters are formed from metal adducts in theproteins in which gold is in the 1+ state while Pd in the 2+state. Unusual recognition of Pd as evidenced by the enhancedformation of Au38
+ and selective formation of Pd containingalloys of the kind Au20Pd2S
+, Au27Pd+, and Au47PdS2
+ suggeststhe participation of palladium in the growth process.Although Ag is not recognized by Au in the gas phase, it ispossible to create luminescent Au–Ag alloy clusters, withtunable composition, in solution. We suggest that naked alloyclusters of this kind derived from macromolecular templatesmay be deposited on active substrates and used for modelcatalysis. Microscopy and spectroscopy of such naked clustersformed in the gas phase will be interesting.
This journal is ª The Royal Society of Chemistry 2013
Acknowledgements
A.B. and T.P. thank the Department of Science and Technology,Government of India for continuous support of our researchprogram on nanomaterials. A.B. thanks the Council of Scienticand Industrial Research (CSIR) for fellowship. A.B. thanks Mr.M.S. Bootharaju for XPS and Ms Shridevi S. Bhat for SEM-EDAXanalysis.
References
1 P. L. Xavier, K. Chaudhari, A. Baksi and T. Pradeep, NanoRev., 2012, 3, 14767 and the references cited there in.
2 J. Zheng, C. Zhang and R. M. Dickson, Phys. Rev. Lett., 2004,93, 077402.
3 J. Zheng, P. R. Nicovich and R. M. Dickson, Annu. Rev. Phys.Chem., 2007, 58, 409–431.
4 R. Jin, Nanoscale, 2010, 2, 343–362.5 Catalysis by Gold, ed. G. C. Bond, C. Louis and D. T.Thompson, World Scientic, 2006.
6 M. Zhu, E. Lanni, N. Garg, M. E. Bier and R. Jin, J. Am. Chem.Soc., 2008, 130, 1138–1139.
7 M. Zhu, C. M. Aikens, F. J. Hollander, G. C. Schatz and R. Jin,J. Am. Chem. Soc., 2008, 130, 5883–5885.
8 Y. Shichibu, Y. Negishi, T. Tsukuda and T. Teranishi, J. Am.Chem. Soc., 2005, 127, 13464–13465.
9 E. S. Shibu, M. A. H. Muhammed, T. Tsukuda andT. Pradeep, J. Phys. Chem. C, 2008, 112, 12168–12176.
10 Y. Negishi, K. Nobusada and T. Tsukuda, J. Am. Chem. Soc.,2005, 127, 5261–5270.
11 M. W. Heaven, A. Dass, P. S. White, K. M. Holt andR. W. Murray, J. Am. Chem. Soc., 2008, 130, 3754–3755.
12 A. Dass, J. Am. Chem. Soc., 2009, 131, 11666–11667.13 Z. Wu, J. Suhan and R. Jin, J. Mater. Chem., 2009, 19, 622–626.14 L. A. Angel, L. T. Majors, A. C. Dharmaratne and A. Dass, ACS
Nano, 2010, 4, 4691–4700.15 J. Akola, K. A. Kacprzak, O. Lopez-Acevedo, M. Walter,
H. Gronbeck and H. Hakkinen, J. Phys. Chem. C, 2010, 114,15986–15994.
16 O. Toikkanen, V. Ruiz, G. Ronnholm, N. Kalkkinen,P. Liljeroth and B. M. Quinn, J. Am. Chem. Soc., 2008, 130,11049–11055.
17 H. Qian, M. Zhu, U. N. Andersen and R. Jin, J. Phys. Chem. A,2009, 113, 4281–4284.
18 Y. Pei, Y. Gao and X. C. Zeng, J. Am. Chem. Soc., 2008, 130,7830–7832.
19 O. Lopez-Acevedo, H. Tsunoyama, T. Tsukuda, H. Hakkinenand C. M. Aikens, J. Am. Chem. Soc., 2010, 132, 8210–8218.
20 J. Kim, K. Lema, M. Ukaigwe and D. Lee, Langmuir, 2007, 23,7853–7858.
21 V. L. Jimenez, D. G. Georganopoulou, R. J. White,A. S. Harper, A. J. Mills, D. Lee and R. W. Murray,Langmuir, 2004, 20, 6864–6870.
22 R. L. Donkers, D. Lee and R. W. Murray, Langmuir, 2008, 24,5976.
23 H. Qian, W. T. Eckenhoff, Y. Zhu, T. Pintauer and R. Jin, J.Am. Chem. Soc., 2010, 132, 8280–8281.
Nanoscale, 2013, 5, 12245–12254 | 12253
Nanoscale Paper
24 P. D. Jadzinsky, G. Calero, C. J. Ackerson, D. A. Bushnell andR. D. Kornberg, Science, 2007, 318, 430–433.
25 Y.-K. Han, H. Kim, J. Jung and Y. C. Choi, J. Phys. Chem. C,2010, 114, 7548–7552.
26 C. Zeng, H. Qian, T. Li, G. Li, N. L. Rosi, B. Yoon,R. N. Barnett, R. L. Whetten, U. Landman and R. Jin,Angew. Chem., Int. Ed., 2012, 51, 13114–13118.
27 Y. Negishi, W. Kurashige, Y. Niihori, T. Iwasa andK. Nobusada, Phys. Chem. Chem. Phys., 2010, 12, 6219–6225.
28 Y. Negishi, K. Igarashi, K. Munakata, W. Ohgake andK. Nobusada, Chem. Commun., 2012, 48, 660–662.
29 J. Xie, Y. Zheng and J. Y. Ying, J. Am. Chem. Soc., 2009, 131,888–889.
30 M. M. A. Habeeb, P. K. Verma, S. K. Pal, A. Retnakumari,M. Koyakutty, S. Nair and T. Pradeep, Chem.–Eur. J., 2010,16, 10103–10112.
31 A. Mathew, P. R. Sajanlal and T. Pradeep, J. Mater. Chem.,2011, 21, 11205–11212.
32 C. V. Durgadas, C. P. Sharma and K. Sreenivasan, Analyst,2010, 136, 933–940.
33 D. Hu, Z. Sheng, P. Gong, P. Zhang and L. Cai, Analyst, 2010,135, 1411–1416.
34 C. Guo and J. Irudayaraj, Anal. Chem., 2011, 83, 2883–2889.35 H.-W. Li, K. Ai and Y.Wu,Chem. Commun., 2011, 47, 9852–9854.36 J. S. Mohanty, P. L. Xavier, K. Chaudhari, M. S. Bootharaju,
N. Goswami, S. K. Pal and T. Pradeep, Nanoscale, 2012, 4,4255–4262.
37 P. L. Xavier, K. Chaudhari, P. K. Verma, S. K. Pal andT. Pradeep, Nanoscale, 2010, 2, 2769–2776.
38 K. Chaudhari, P. L. Xavier and T. Predeep, ACS Nano, 2011, 5,8816–8827.
39 H. Wei, Z. Wang, L. Yang, S. Tian, C. Hou and Y. Lu, Analyst,2010, 135, 1406–1410.
40 Y.-H. Lin and W.-L. Tseng, Anal. Chem., 2010, 82, 9194–9200.
12254 | Nanoscale, 2013, 5, 12245–12254
41 W.-Y. Chen, J.-Y. Lin, W.-J. Chen, L. Luo, D. E. Wei-Guangand Y.-C. Chen, Nanomedicine, 2010, 5, 755–764.
42 T.-H. Chen and W.-L. Tseng, Small, 2012, 8, 1912–1919.43 A. Baksi, P. L. Xavier, K. Chaudhari, N. Goswami, S. K. Pal
and T. Pradeep, Nanoscale, 2013, 5, 2009–2016.44 A. Baksi, T. Pradeep, B. Yoon, C. Yannouleas and
U. Landman, ChemPhysChem, 2013, 14, 1272–1282 and thereferences cited there in.