Nanotechnology business incubation: Case studies from Indonesia M. Ikhlasul Amal 1) Research Center for Metallurgy and Material Indonesian Institute of Sciences 2) Indonesian Society for Nano Presented at: Stakeholder Workshop on Critical Aspects of Nanotechnology R&D Management Manila, 25 July 2014
Transcript
Nanotechnology business incubation: Case studies from Indonesia
M. Ikhlasul Amal 1)Research Center for Metallurgy and Material
Indonesian Institute of Sciences 2)Indonesian Society for Nano
Presented at: Stakeholder Workshop on Critical Aspects of Nanotechnology R&D Management
Manila, 25 July 2014
Indonesia: The Biggest Archipelago
• Land Area : 1.904.443 km2
• Sea Area : 3.116.163 km2
• Total Area : 5.020.606 km2
• Coastal Line : 81.000 km
• Population : 242 million people (4th biggest population)
• Language : Indonesian (Bahasa Indonesia)
• 3rd largest democratic country (after India and US) Source: Ministry of Trade
Facts of Indonesia : Key Statistics Snapshot GDP PPP (purchasing power parity) : USD 1,2 T
GDP PPP per capita : USD 4944
Economic Growth : 5,4 %
Investment Growth : 27,3 %
Foreign Debt ratio : 26,1 %
Inflation rate : 8,3 %
Investment Ranking 2013 : Moody’s Baa3
(medium grade, with some speculative elements and
moderate credit risk)
Fitch BBB –
(medium class, which are satisfactory at the moment)
S&P BB +
Population : 240 m (4th most population)
60% under 39 years old
Unemployment Rate
: 6,7 %
Source: Ministry of Trade
Potential & Main products from Indonesia
4 Source: Ministry of Trade
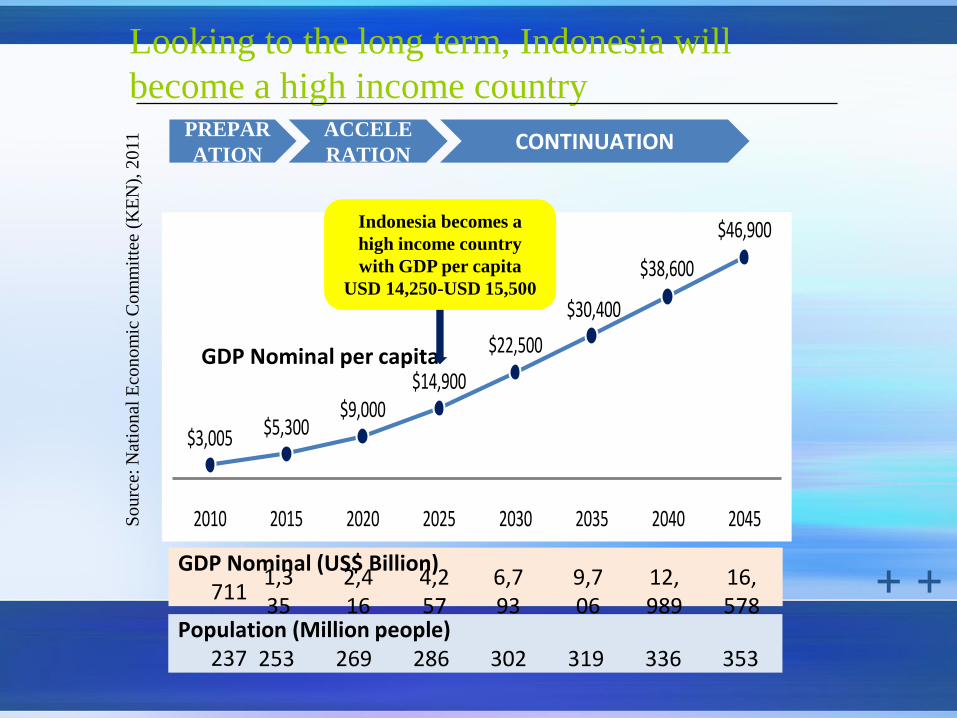
Looking to the long term, Indonesia will
become a high income country
$3,005 $5,300$9,000
$14,900
$22,500
$30,400
$38,600
$46,900
2010 2015 2020 2025 2030 2035 2040 2045
GDP Nominal (US$ Billion) 711
4,257
9,706
16,578
Population (Million people) 237
PREPAR
ATION
ACCELE
RATION CONTINUATION
6,793
2,416
1,335
12,989
286 319 353 302 269 253 336
GDP Nominal per capita
Indonesia becomes a
high income country
with GDP per capita
USD 14,250-USD 15,500
So
urc
e: N
atio
nal
Eco
no
mic
Co
mm
itte
e (K
EN
), 2
011
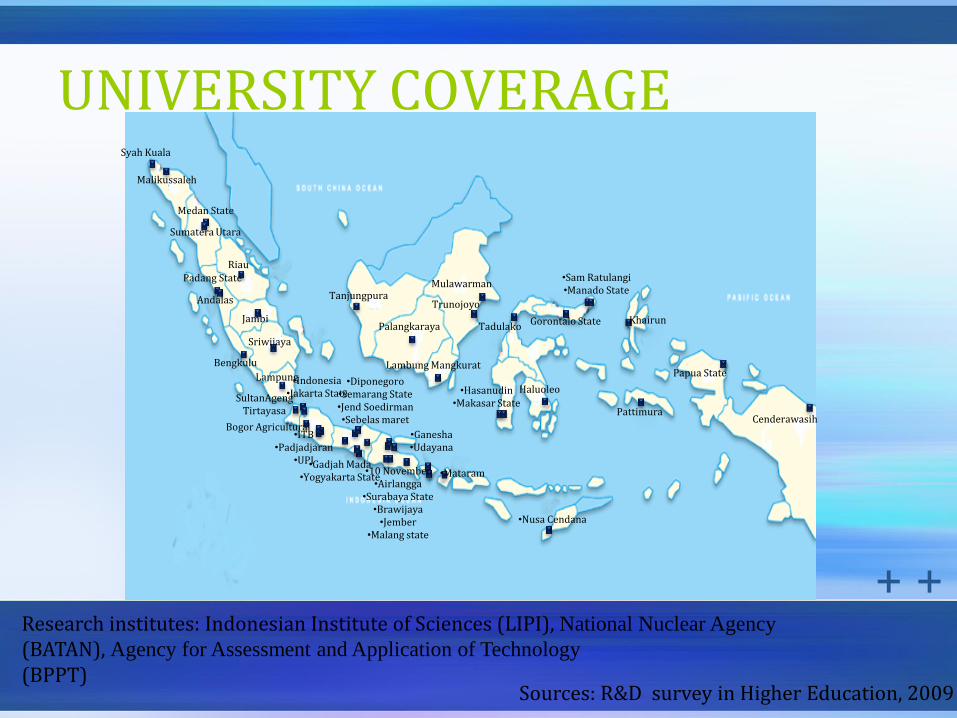
UNIVERSITY COVERAGE Syah Kuala
Malikussaleh
Medan State
Sumatera Utara
Riau Padang State
Andalas
Jambi
Bengkulu
Sriwijaya
Lampung
SultanAgeng Tirtayasa
•Indonesia •Jakarta State
Bogor Agricultural •ITB
•Padjadjaran •UPI •Gadjah Mada •Yogyakarta State
•Diponegoro •Semarang State •Jend Soedirman •Sebelas maret
•10 November •Airlangga
•Surabaya State •Brawijaya
•Jember •Malang state
•Ganesha •Udayana
•Mataram
•Nusa Cendana
Tanjungpura
Palangkaraya
Lambung Mangkurat
Mulawarman
Trunojoyo
•Sam Ratulangi •Manado State
Gorontalo State Tadulako
Haluoleo •Hasanudin •Makasar State
Khairun
Pattimura
Papua State
Cenderawasih
Sources: R&D survey in Higher Education, 2009
Research institutes: Indonesian Institute of Sciences (LIPI), National Nuclear Agency
(BATAN), Agency for Assessment and Application of Technology
(BPPT)
Total: 42,083 R&D personnel
Under Diplom
a 3%
Diploma
1%
Bachelor
12%
Master 58%
Doctor 26%
By Degree of Education, 2009
Researcher
91%
Supporting Staff
4%
Technician 5%
By Position, 2009
MAIN FINDINGS: R&D PERSONNEL
Sources: R&D survey in Higher Education, 2009
25,046
10,867
27,261
HigherEducation
ManufacturingIndustry
Government
R&D Personnel by Sector, 2009
22,228
7,588
11,114
1,401 2,135
7,572
1,238 1,144
8,575
Higher Education ManufacturingIndustry
Government
Position of R&D Personnel by Sector , 2009
Researcher Technician Supporting Staf
R&D PERSONNEL
Researcher
65%
Technician
18%
Supporting Staf
17%
Personnel by type of R&D Man Power, 2009
PhD 16%
Master 51%
Bachelor
25%
Non degree
8%
Number of Researcher by Qualification, 2009
Source: Estimation from R&D survey in University sector (2009), Industry sector (2008), and Government sector (2006)
NATIONAL STRATEGIC POLICY
DIRECTION FOR SCIENCE AND
TECHNOLOGY 2015-2019
Source: Indonesia Ministry of Research and Technology (2013)
S&T Development Direction
Competitiveness
& Independency
Ultimate Goal: Welfare
S & T
Human Resources
Education
Social Culture
Source: Indonesia Ministry of Research and Technology (2013)
Beneficiary of Technological Development
Lakitan, B, (2013), Connecting all the dots: Identifying the “actor level” challenges in establishing effective
innovation system in Indonesia, Technology in Society 35 (2013) 41–54
State-
owned
Company SMEs
Multinational
Companies
Subsidiary
companies
Foreign
Technology
Domestic/Natio
nal Technology
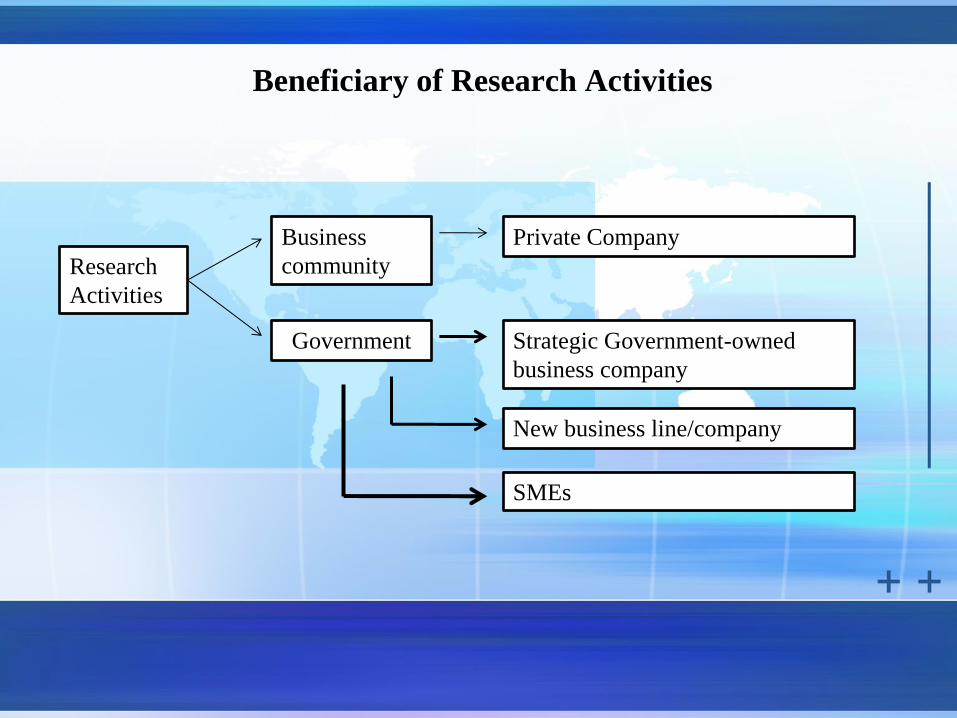
Beneficiary of Research Activities
Research
Activities
Business
community
Government Strategic Government-owned
business company
New business line/company
SMEs
Private Company
Main Priorities Identification 2015-2019
Source Focus area
Act no 17 2007
(RPJPN)
1. Food security
2. Energy
3. Transportation technology and management
4. ICT
5. Security and Defense technology
6. Health and drug technology
7. Advanced materials
Ministry of Research
and Technology Decree
16 /M/Kp/II/2013
1. Food and agriculture
2. Natural science
3. Social science
4. Pro-Poor Technology
5. Health, molecular biology, biotechnology, medicine
6. Material for industry and advanced material
7. Energy, new and renewable energy
8. Nuclear energy and its supervision
9. Aviation and space
10.Security and defense technology
11.Ocean technology
12.Design and engineering technology
13.Geoscience and climate science
14.Green Technology
15.Transportation management and technology
16. ICT
Analysis of main priorities 2015-2019
Agriculture
Pro-Poor Technology
Molecular biology, biotechnology, &
medicine
Material for Industry
New and renewable technology
Nuclear and its supervision
Aviation and Space technology
Ocean technology
Designn and Engineering
Geoscience and climate change
Green technology
Basic science strengthening for technology
development
Eco
no
mic
co
mp
etitiv
eness
Food
Security
Energy
ICT
Transportatio
n technology
and
management
Security and
Defense
Technology
Health and
drugs
Advanced
So
cia
l scie
nce
stre
ngth
enin
g to
su
pp
ort
tech
no
logy a
cce
pta
nce a
nd
ap
plic
atio
n
National Strategic Policy
Direction for Science and Technology Indicators
(2015-2019)
15
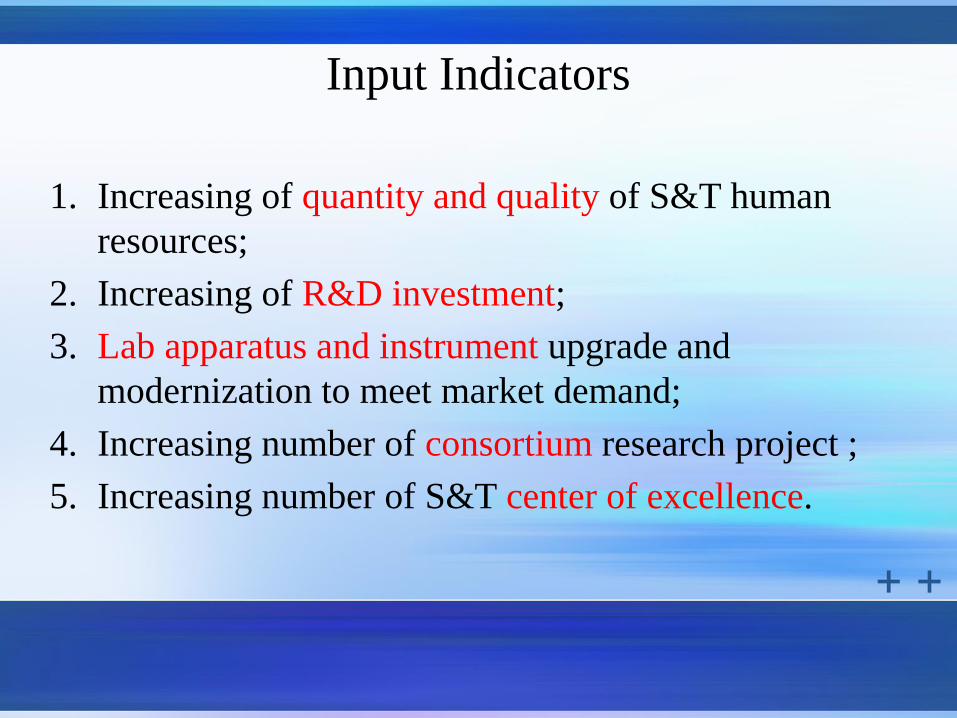
Input Indicators
1. Increasing of quantity and quality of S&T human
resources;
2. Increasing of R&D investment;
3. Lab apparatus and instrument upgrade and
modernization to meet market demand;
4. Increasing number of consortium research project ;
5. Increasing number of S&T center of excellence.
Output Indicators
1. Short and medium terms are measured by scientific
competitiveness, number of patents, and
commercializable research results.
2. Long term benefit and impact is measured by
a. Economic values: license, spin-off start up
companies.
b. Indonesia competitive index.
Business Incubator Policy
• Presidential decree no. 27 year 2013:
Entrepreneurship incubator development.
• Objectives:
– To create and to develop new businesses that have
economic value and highly competitive;
– To optimize the empowerment of human resources in
developing the economy by the utilization of science and
technology.
Innovation system (1)
• Innovation system:
Network between stockholders, a place to interact and to develop
innovative life.
• Innovation system strengthening:
coordination network, partnership and mutual relationship
strengthening between stakeholders to apply innovation toward
synergism.
• National Innovation System and Regional Innovation System
Strengthening
• Toward to: 1. S&T institution
2. S&T human resource
3. S&T network
19
Innovation system (2)
20
Needs &
problems
Technology
Packages
Technology
development
Technology
User
Fasilitator
Intermediator
Regulator
[Benyamin Lakitan 2012]
Adoption Relevancies
Prototype Incubation
(Technology business) Mass production
Invention process Innovation process
Technology Push
Market Pull
Invention & Innovation Process
Pre -
Incubation
1
Incubation
2
Post
Incubation
3
Matchmaking Technology
Transfer Mass Production
En
trep
ren
eur
Inn
ovati
ve
En
trep
ren
eur
Academician, business, and government matchmaking Synergy and partnership(Workshop, FGD, etc) InTIM on-line (Technology Push / Market Pull) Financial
Infrastructure : Room etc Non Physic : Trial Production, Training, Mentoring, Alpha Test, Beta Test
Mass Production Techno Park Accesibility
Incubation Program
BUSINESS INCUBATION
STORIES
Technology Solution and Innovation
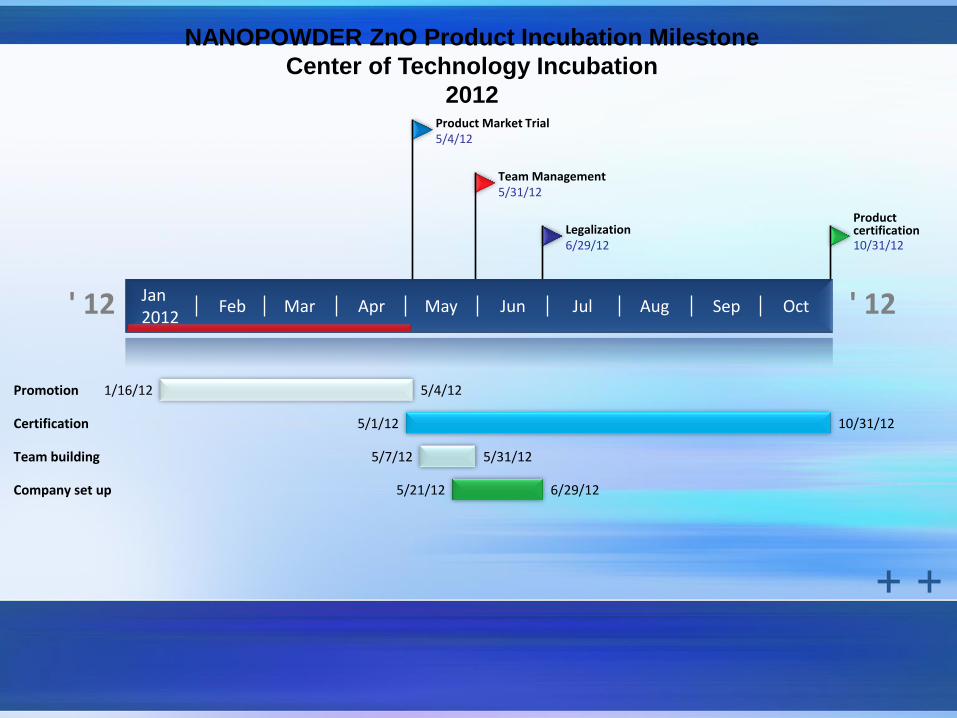
NANOPOWDER ZnO Product Incubation Milestone
Center of Technology Incubation
2012
' 12 Jan 2012
Feb Mar Apr May Jun Jul Aug Sep Oct ' 12
Product certification 10/31/12
Legalization 6/29/12
Team Management 5/31/12
Product Market Trial 5/4/12
Promotion 1/16/12 5/4/12
Certification 5/1/12 10/31/12
Team building 5/7/12 5/31/12
Company set up 5/21/12 6/29/12
Incubation of Nano ZnO
2010
Pro
du
ct
Deve
lop
men
t
Prototype Trial
Step 1
Prototype
Step 2
Up Scaling
• Optimization
• Production trial
• Product analysis
and evaluation
Step 3
Commercialization
• Product certification
• Marketing
• Team management
• Legalization Step 4
Mass production
• Market establishment
• Business development
• Investment accessible
2013
Timeline
15-30 Kg/year
2011
Yield ZnO 99,90 %
Size: 80 – 250 nm
Capacity 900 kg/year
Sold 163 kg for 6
months
2012
Up Scaling: 6 ton/year
SINAS Research consortium 2013
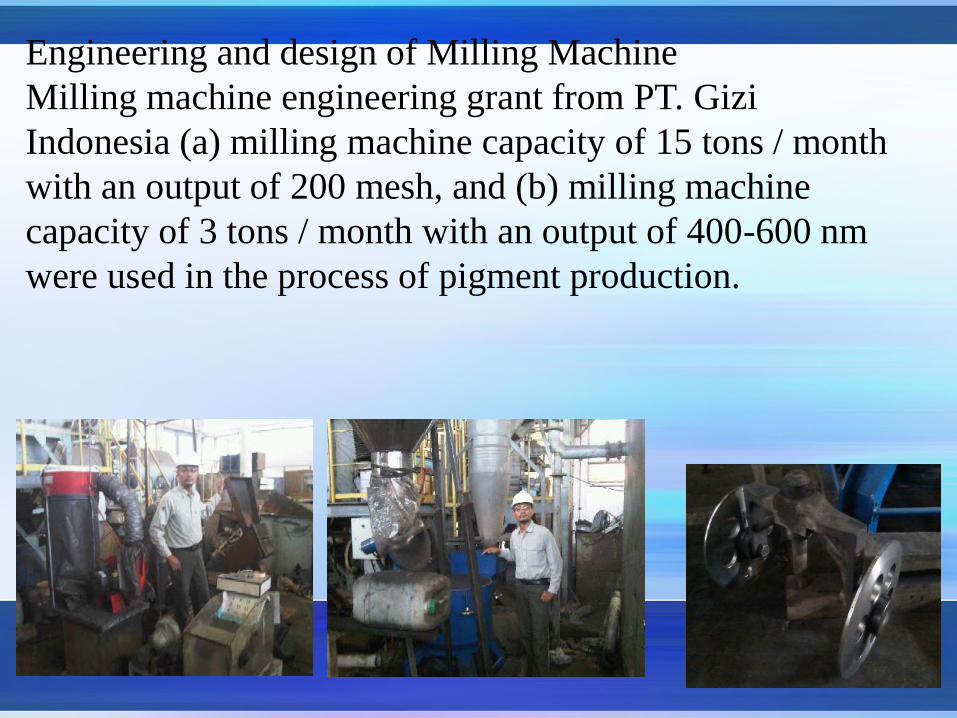
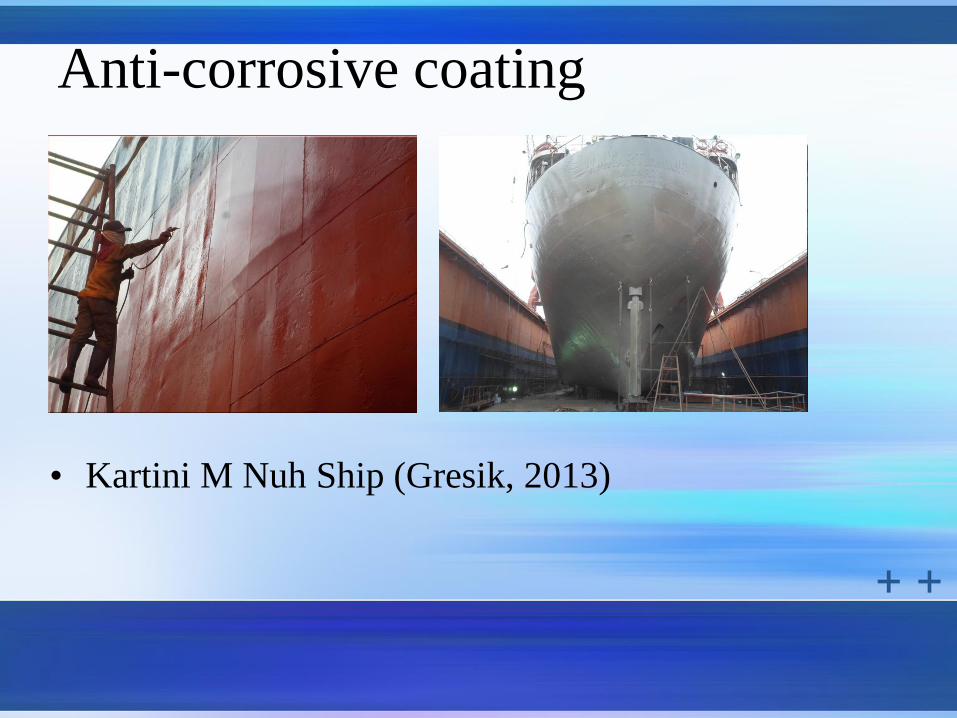
Engineering and design of Milling Machine
Milling machine engineering grant from PT. Gizi
Indonesia (a) milling machine capacity of 15 tons / month
with an output of 200 mesh, and (b) milling machine
capacity of 3 tons / month with an output of 400-600 nm
were used in the process of pigment production.
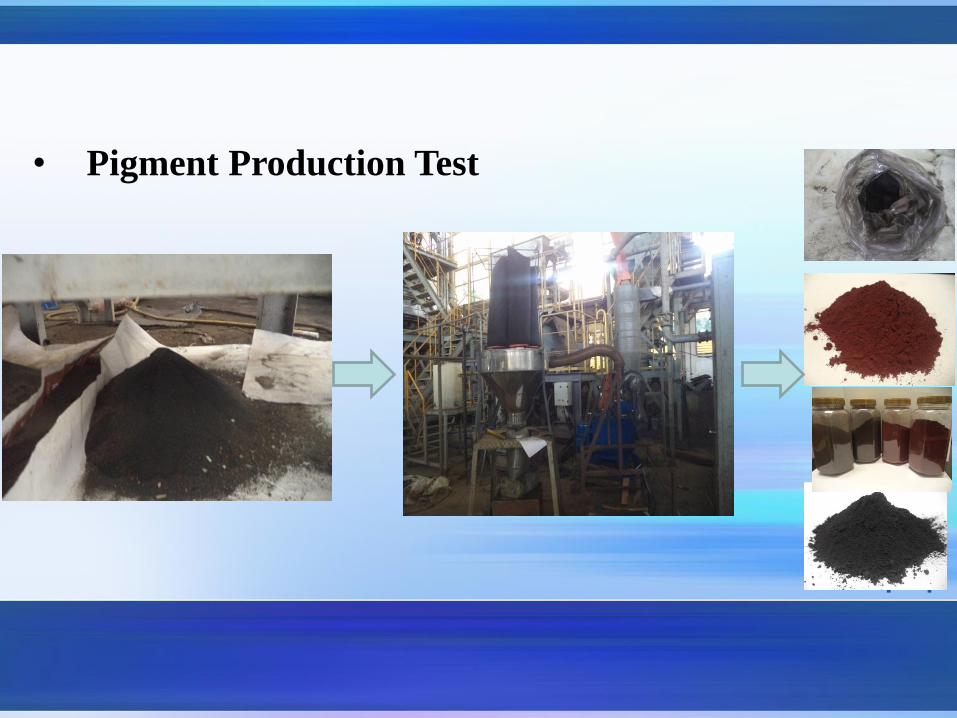
• Pigment Production Test
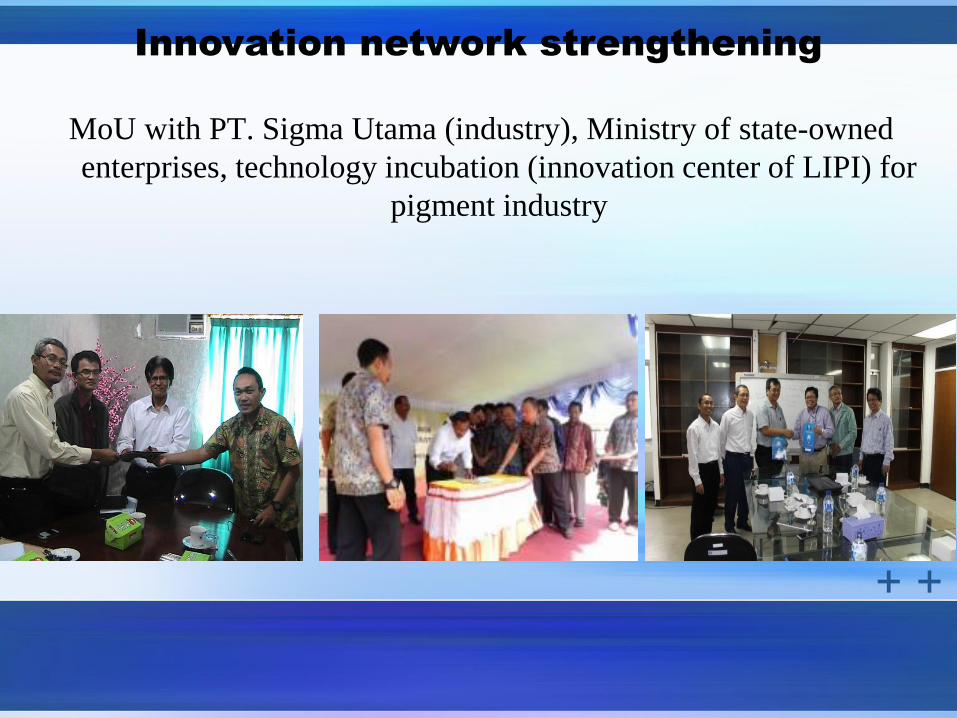
MoU with PT. Sigma Utama (industry), Ministry of state-owned
enterprises, technology incubation (innovation center of LIPI) for
In a Yogyakarta suburb, a small blue-walled factory is being prepared to
make the pellets, starting mid-year when essential laboratory equipment
arrives. Up to 10 workers will be trained to producing around 100,000 units
a year for a start.
If reality matches the hype, the pellets, and other products made using the
same technology, could nudge Indonesia closer to joining the world’s
leading pharmaceutical suppliers, the US, China and India.
It’s called Gama-CHA. It’s a material that helps fractured bones graft. At
present the application is mainly in dental work, though later it could be
used to repair other bones, particularly the spinal column. It can be used by
dentists, though most interest is likely to come from oral surgeons.
It’s made from carbonate apatite — a calcium-phosphate mineral — and it’s
being developed by PT Swayasa Prakarsa.
This commercial business is owned by Gadjah Mada University (UGM)
through a subsidiary of its holding company PT Gama Multi. Swayasa
Prakarsa has been set up using a Rp 67 billion (US$5.9 million) loan from
UGM, whose engineering and nano-biomedicine research group has been
creating the technology.
Prof. Dr. Ika Dewi Ana
(Gajah Mada State Univeristy)
Problems of Incubators in Indonesia
• Lack of Operational Facilities, especially for in-wall
tenants;
• Most of Incubators managed less professionally;
• Less selective in selecting Tenants;
• Limited fund for seed capital;
• Commitment and support from Universities and
government are limited.
Recommendations
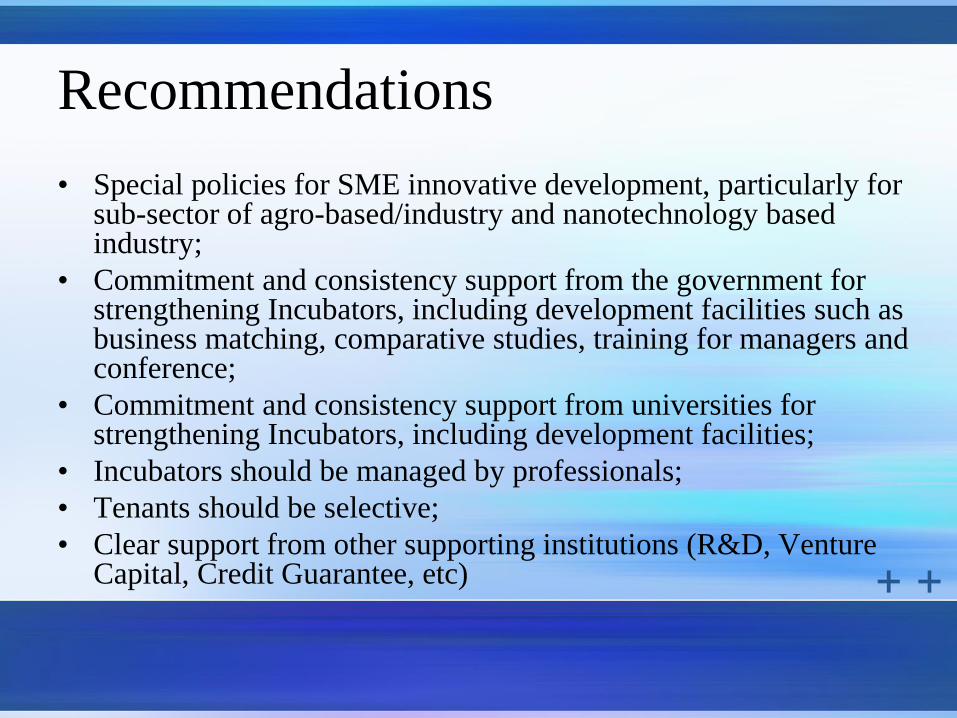
• Special policies for SME innovative development, particularly for sub-sector of agro-based/industry and nanotechnology based industry;
• Commitment and consistency support from the government for strengthening Incubators, including development facilities such as business matching, comparative studies, training for managers and conference;
• Commitment and consistency support from universities for strengthening Incubators, including development facilities;
• Incubators should be managed by professionals;
• Tenants should be selective;
• Clear support from other supporting institutions (R&D, Venture Capital, Credit Guarantee, etc)
Conclusions
• Incubator is one of the tools for development of
Knowledge-based entrepreneurs;
• Universities as “center of excellence” should become
the leader in incubator development;
• Public-private partnership should be promoted in