Nanotextile Bio-sensors for Mobile Wireless Wearable Health Monitoring of Neurological and Cardiovascular Disorders Pratyush Rai 1 , Sechang Oh 1 , Prashanth Shyamkumar 1 , Mouli Ramasamy 1 , Robert E. Harbaugh 4 and Vijay K. Varadan 1,2,3,4 1 Department of Electrical Engineering, University of Arkansas, Fayetteville, AR 72701 2 Department of Biomedical Engineering, University of Arkansas, Fayetteville, AR 72701 3 Global Institute of Nanotechnology, 700 Research Center Blvd, Fayetteville, AR 72701 4 Department of Neurosurgery, Pennsylvania State University, Hershey, PA 17033 Corresponding Author: [email protected]Abstract Health and long term care is a growth area for wearable heath moni- toring systems. Wearable diagnostic and therapeutic systems can contribute to timely point-of-care for patients with chronic health conditions, especially chronic neurological disorders, cardiovascu- lar diseases and strokes that are leading causes of mortality world- wide. Diagnostics and therapeutics for patients under timely point- of-care can save thousands of lives. However, lack of access to minimally-intrusive monitoring systems makes timely diagnosis dif- ficult and sometimes impossible. Existing ambulatory recording equipment are incapable of performing continuous remote patient monitoring because of the inability of conventional silver-silver- chloride-gel-electrodes to perform long-term monitoring, non-reus- ability, lack of scalable-standardized wireless communication plat- forms, and user-friendly design. Recent progress in nanotextile biosensors and mobile platforms has resulted in novel wearable health monitoring systems for neurological and cardiovascular dis- orders. This chapter discusses nanostructured-textile-based dry elec- trodes that are better suited for long-term measurement of electro- cardiography (ECG), electroencephalography (EEG), electrooculog- raphy (EOG), electromyography (EMG) and bioimpedance with very low baseline noise, improved sensitivity and seamless integration into garments of daily use. It discusses the bioelectromagnetic prin- ciples of the origin and propagation of bioelectric signals and nanosensor functioning, which provide a unique perspective on the development of novel wearable systems that harness their po- tential. Combined with state-of-the-art embedded wireless network devices to communicate with smartphones, laptops or directly to remote servers through a mobile network (GSM,4G-LTE,GPRS), they can function as wearable wireless health- diagnostic systems that are more intuitive to use. INSTITUTE OF SMART STRUCTURES AND SYSTEMS (ISSS) JOURNAL OF ISSS J. ISSS Vol. 3 No. 1, pp. 28-77, March 2014. REVIEWARTICLE Available online at www.isssonline.in/journal/03paper04.pdf 28 Keywords: Textile nanosensor, smart textile, wireless, bioelectromagnetism, ECG, EEG, EOG, EMG, cardiovascular disorder, neurological disorder
Transcript
Nanotextile Bio-sensors forMobile Wireless Wearable HealthMonitoring of Neurological andCardiovascular Disorders
Pratyush Rai1, Sechang Oh1, Prashanth Shyamkumar1,Mouli Ramasamy1, Robert E. Harbaugh4 and Vijay K.Varadan1,2,3,4
1Department of Electrical Engineering, University ofArkansas, Fayetteville, AR 727012Department of Biomedical Engineering, University ofArkansas, Fayetteville, AR 727013Global Institute of Nanotechnology, 700 Research CenterBlvd, Fayetteville, AR 727014Department of Neurosurgery,Pennsylvania State University, Hershey, PA 17033Corresponding Author: [email protected]
AbstractHealth and long term care is a growth area for wearable heath moni-toring systems. Wearable diagnostic and therapeutic systems cancontribute to timely point-of-care for patients with chronic healthconditions, especially chronic neurological disorders, cardiovascu-lar diseases and strokes that are leading causes of mortality world-wide. Diagnostics and therapeutics for patients under timely point-of-care can save thousands of lives. However, lack of access tominimally-intrusive monitoring systems makes timely diagnosis dif-ficult and sometimes impossible. Existing ambulatory recordingequipment are incapable of performing continuous remote patientmonitoring because of the inability of conventional silver-silver-chloride-gel-electrodes to perform long-term monitoring, non-reus-ability, lack of scalable-standardized wireless communication plat-forms, and user-friendly design. Recent progress in nanotextilebiosensors and mobile platforms has resulted in novel wearablehealth monitoring systems for neurological and cardiovascular dis-orders. This chapter discusses nanostructured-textile-based dry elec-trodes that are better suited for long-term measurement of electro-cardiography (ECG), electroencephalography (EEG), electrooculog-raphy (EOG), electromyography (EMG) and bioimpedance with verylow baseline noise, improved sensitivity and seamless integrationinto garments of daily use. It discusses the bioelectromagnetic prin-ciples of the origin and propagation of bioelectric signals andnanosensor functioning, which provide a unique perspective onthe development of novel wearable systems that harness their po-tential. Combined with state-of-the-art embedded wireless networkdevices to communicate with smartphones, laptops or directly toremote servers through a mobile network (GSM,4G-LTE,GPRS), theycan function as wearable wireless health- diagnostic systems thatare more intuitive to use.
INSTITUTE OF SMART STRUCTURES AND SYSTEMS (ISSS) JOURNAL OF ISSS
J. ISSS Vol. 3 No. 1, pp. 28-77, March 2014. REVIEW ARTICLE
Available online at www.isssonline.in/journal/03paper04.pdf 28
Public spending on health and long term carein Organization for Economic Co-operation andDevelopment (OECD) member countries andBRIICS (Brazil, Russia, India, Indonesia, China,South Africa) is 6% of the GDP and is projected toincrease up to 14% in the next 50 years [de laMaisonneuve et al., 2013]. Chronic diseasediagnosis and treatment are the primary causes forthis increase. Patients suffering from chronicdiseases need to repeatedly visit one hospital, whichcan be expensive. As a solution to this, remotePoint-of-Care (POC) systems and Remote PatientMonitoring (RPM) systems can be used. Remotepatient monitoring for point-of-care facilitates themonitoring of a patient’s health condition at local orremote places without the need for hospitaladmissions or visits. In the case of high risk patients,it can provide the patient with real time feedbackfrom a medical center.
Wearable nanosensor systems in the form ofsmart clothing, equipped with wirelesscommunication technology, provide real-timemedical data to health professionals for earlydiagnosis, planning therapeutic intervention andfollowing up on the effect of planned therapy.Techniques such as electrocardiography (ECG),electroencephalography (EEG), electrooculography(EOG), electromyography (EMG) and electricalimpedance tomography are relevant to POC forcardiovascular disease, neurological disorders,cancer and strokes.
Intelligent wearable sensor systems withsimple installation, minimal maintenance and userinvolvement can be the best method for ubiquitoushealth monitoring. They combine the high sensitivityof nanosensors with cost effective and lightweighttextiles. Long term real-time health monitoring isuseful in chronic diseases for event detection, onsetof critical episodes, and disease managementthrough diagnostics and therapeutics [CDC, 2013].Unobtrusive wearable health monitoring is foundto be effective in the prevention and early diagnosisof neurological and cardiovascular disease by non-invasively monitoring a person’s vital signs andphysiological data [Jorg, 2003].
In this chapter, nanotextile-based wirelessbiosensor systems have been described. Over the
past few decades, advancements in pervasiveinformation and communication technologies,coupled with microelectronics and systemsdevelopment have provided an opportunity for theintegration of electronics with functional textiles.The confluence of these two fields has radicallytransformed the norms of computing and embeddedsystems into soft textile interfaces [Marculescu etal., 2003]. In the section on Smart textile for healthmonitoring, the concept of a textile as a healthmonitoring platform is explained along with adiscussion on newly developed nano and micro scalefiber structures, composite materials and coatingsthat integrate with textile fabrics to create smarttextiles. The Section on Electrical signals frombrain and heart offers a brief development of theprevalent models used to describe the relationshipbetween the activity of a single neural cell or cardiacmyocyte and the characteristic bioelectric signalsmeasured at the level of the skin-electrode interface(EEG, ECG, EOG and EMG), and a comparisonbetween planar textile electrodes andnanostructured electrodes. In the section onMonitoring and Diagnosis, we describe thebioelectric signals of diagnostic value for bothneurological and cardiological disorders.
The section on monitoring systems talksabout the different types of wireless protocols thatare used in the current state –of the- art for wirelesssensor systems. Finally, in the sectionsNeurological Disorder monitoring by WearableWireless Nano- Bio- Textile sensors,Cardiovascular Health Monitoring andBiofeedback system for therapeutics, numerousapplications have been showcased to demonstratethe cutting edge of textile-based wearable healthmonitoring technology for neurological andcardiovascular health disorders.
2. Smart textiles for Health Monitoring
Current technologies for measuring andrecording biopotential signals discussed in thesection on Monitoring systems are suitable forbedside monitoring, with the exception of the Holtermonitor. POC diagnostics and therapeutics requiresystems capable of ambulatory and/or remotemonitoring. Such systems will allow patients andhigh risk individuals to stay in their homes and followtheir routine, while the continuous monitoring of their
Pratyush Rai et al.
Journal of ISSS 29
30
neural and/or cardiac functions can be performedremotely. The key to the successful adoption ofremote health care is invisibility, i.e. sensors that donot interfere with the quotidian activities of theindividuals, and, at the same time, efficiently monitorparameters critical to neural and cardiac health.
2.1 Textile Platform for Nano- biosensors
Textile based sensor systems are flexiblesensors that are made of textiles or have the suitabletexture and flexibility to embed or integrate intotextiles of daily use. The resultant functionalizedtextiles are called e-textiles or smart textiles. Theyare distinct from wearable computing systemsbecause they emphasize the seamless integrationof the textiles with sensors and sensor electronics.Textiles are preferred for the integration ofbiomedical sensors because they are the mostnatural materials to use next to the human body.Thus, they facilitate unobtrusive observation, wherethey simply sense and record the physiologicalsignals of the subject without any kind of activeinteraction with the subject.
Textile based nano-biosensor systems can beintegrated with compact textile integrated wirelesselectronics, with the help of woven or printedconnections, for remote wireless health diagnostics[Rai et al., 2012]. It eliminates the use of stick onglue based electrodes and can be worn without thehelp of medical personnel; therefore, it is a desirablediagnostic system in hospitals as well as in remotelocations.
Smart textiles have been an area of focus forspace exploration, biomedical and consumerelectronics communities for their potential tosignificantly augment the Body Area Network(BAN) which is also known as the internet of things[Bergey et al., 1971; David et al., 1972; Khosla,2012]. Xiaoming Tao describes Smart Textiles as aclass of smart materials and structures that senseand react to environmental conditions or stimuli.Smart textiles can be divided into threesubcategories. Passive smart textiles can only senseenvironmental conditions and stimuli. Active smarttextiles can sense and react to environmentalconditions and stimuli. Very smart textiles can sense,react and adapt to environmental conditions andstimuli. In addition to these types, intelligent textilescan cause predictable effects or phenomena by
interacting with the environment and the wearer[Tao, 2000; Zhang, 2001; Pejis, 2005]. By thisdefinition, nanotextile- based wireless biosensorsystems are wearable smart nanosystems.
The Smallest units of the textile are fibres orfilaments. Innumerable combinations of these unitscan result in many textile materials with varyinglength, cross-sectional areas and shapes, andsurface roughness. The intelligent functionality canbe introduced into the textile at different levels. Atthe fibre level, a coating can be applied or threadscan be added to make a composite textile. TheFibres of different types can be arranged at randomor in a strictly organized way in yarns or fabric toform even 3D structures. These structures can bemetallized or functionalized to fabricate a conductivetextile electrode and other functional surfaces withmicro or nanorod, micro or nanocoil arrays.
Smart textiles (fabric) can be made frommaterials ranging from traditional cotton, polyesterand nylon to advanced Kevlar with integratedfunctionalities. However, in the scope of the presentreview, fabrics with electrical conductivity are ofinterest. There are two kinds of smart textiles(fabric) products that have been developed andstudied for health monitoring fabrics with textile-based sensor electronics [Park et al., 1999; Parket al., 2007; Coosemans et al., 2006; Lee et al.,2009; Alzadi et al., 2012] and fabrics that enveloptraditional sensor electronics [Trainer, Smartex].Pioneering research work, done by Jayaraman andco-workers, showed that weaving can be used toincorporate electrically conductive yarn into thefabric to obtain a textile that can be used as a“Wearable Motherboard”. It can connect multiplesensors on the body, such as wet gel ECGelectrodes, to the signal acquisition electronics [Parket al., 1999; Park et al., 2007]. Later researchershave shown that conductive yarns can beinstrumental in the fabrication 4 of textile- basedsensors made of fabric [Coosemans et al., 2006;Lee. Y et al., 2009] or metallic meshes [Alzadi etal., 2012] coated with silver or conductive metalcores woven into the fabric [Rattfalt et al., 2007].
2.2 Nanostructured Textile
Naturally occurring fibers have diameters inthe order of microns, and the smallest diameter isof silk fibers (10μm). It is a common conception
Nanotextile bio-sensors for Mobile Wireless Wearable Health Monitoring of Neurological and Cardiovascular Disorders
INSTITUTE OF SMART STRUCTURES AND SYSTEMS
INSTITUTE OF SMART STRUCTURES AND SYSTEMS (ISSS JOURNAL OF ISSS
J. ISSS Vol. 1 No. 1, pp. 1-10, Sept 2012. REGULAR PAPER
Journal of ISSS 31
that textiles made of fibers with diameters in thenanometer scale can be deemed the textiles fit fornanosensor applications. These textiles, integratedinto the fabric, can serve as different componentsof smart sensor systems.
Based on the degree of integration, thecombination of electronics and textiles can bedivided into embedded electronics, textronics andfiberonics 5. Embedded electronics uses textiles asa platform for building in readily available off-the-shelf electronics (e.g., Phillips illuminative LEDshirts and Lifeshirt by VivoMetrics [Aarts et al.,2003]). These can be nanosensor chips made withstate of the art nanofabrication techniques. In suchsmart textiles, the electronics have to bedisconnected prior to washing because they cannotendure washing.
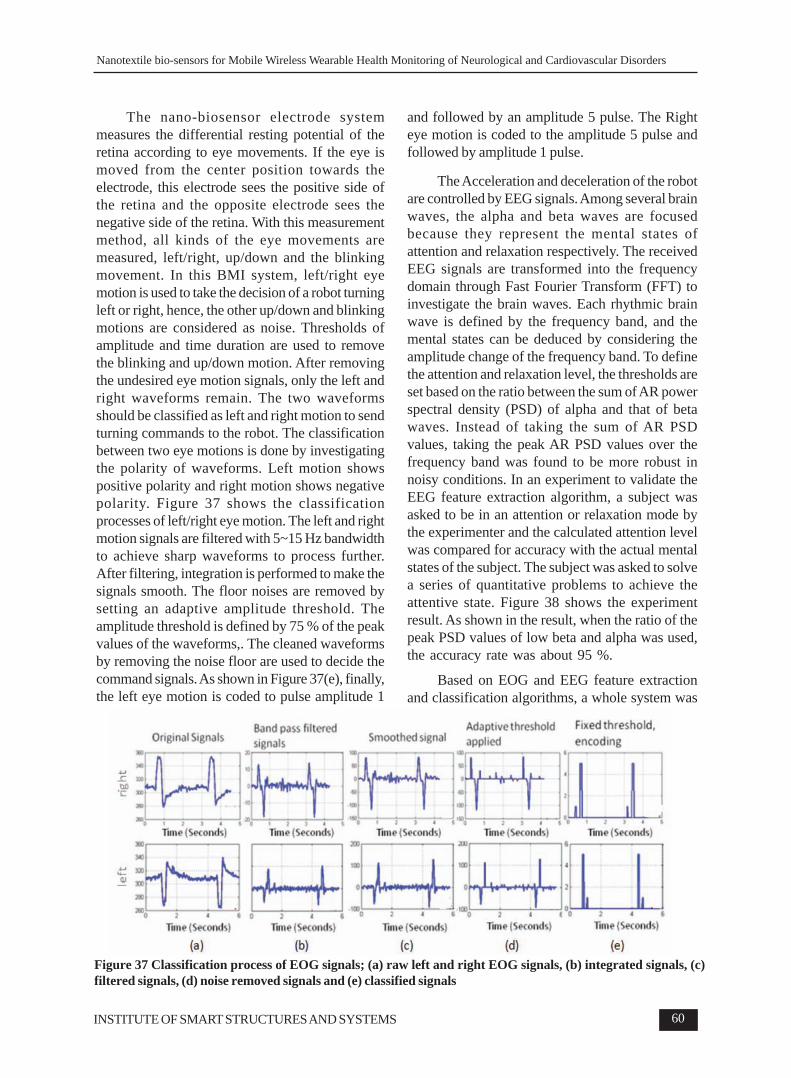
Textronics uses electronic componentsmanufactured by using textile materials and textileproduction techniques. Nanocomposites andnanoparticles can be incorporated in to the textileto form sensitive layers and sensor connects.Mazzoldi et al and De Rossi et al have developedpolypyrrole on Lycra and carbon-filled6 rubberbased printable sensors for the measurement ofposture, movement and respiration. These textronicsbased suits have been demonstrated for monitoringrehabilitation, studying ergonomics, virtual realityand ambulatory monitoring [Mazzoldi et al., 2002;De Rossi et al., 2003]. Due to the limitation ofmaterials and fabrication techniques, complexelectronic components such as microprocessors,cannot be fabricated as textronics and should stillbe embedded in textiles. The research done byClemens et al. [Clemens et al., 2003] attempts tointegrate basic electronic building blocks, such assemiconductor electronics, in yarns for thefabrication of transistors on textile. This fiberonicstechnology can help in the full inclusion ofmicroprocessors and nano-biosensors in futuretextiles.
Textronics has the potential for creating textileswith new attributes, while keeping them flexible andwashable. For textronic technology, knowledge ofand access to textile production is necessary. Thereare many textile production techniques that can beused to build electronic components. A commonly-used concept for making textile-based sensors and
electronics is weaving or knitting conductive threadinto the garment fabric. Jacquard loop weaving canweave conductive yarn into specific patterns formaking conductive tracks, contacts and antennas[Gimpel, et al., 2004 ]. Plain and circular knitting,warp knitting or crocheting can be used for theknitting of conductive yarns into textile electrodesand strain sensors (e.g. GOW trainer [GOWTrainer], Numetrex by Adidas [Jorg, 2003,Numetrex], Wearable Wellness System fromSmartex s.r.l. Pisa Italy [Smartex]). TheEmbroidery of conductive yarns into textiles canbe useful in making wearable keyboards [Post etal., 1997] and antennas [Catrysse, 2004].
2.3 Nanotextured Textiles as ElectronicSensors
Smart textiles can serve as a platform forelectrophysiological sensors that require being incontact with the body. Studies have shown thattextile-based sensor electrodes are as reliable asconventional silver-silver chloride gel-basedelectrodes for the detection of ECG signals [Rai etal., 2012; Pantelopoulos et al., 2008; Pacelli, 2006].
Textiles as substrates can supportnanostructures grown on them [Lim, 2010],embedded as composite [Vigneshwaran et al.,2006], embedded/mounted as nanomaterials baseddevices [Dhawan et al., 2006; Varadan et al.,2010; Varadan et al., 2011] or nanomaterials-basedcoating and dyes [Maharani et al., 2010; Locher etal., 2006]. Conductive fabrics can be obtained byweaving conductive yarn into fabrics [Dhawan etal., 2004], coating conductive layers on a fabricsurface by chemical processes such aspolymerization [Xue et al., 2005], electroless plating[Jiang et al., 2006] electroplating [Brenov et al2006], or physical processes such as vacuum sputterdeposition [Wang, 2007; Yeon, 2004]. TheIncorporation of nanofibers in to the textile is alsopossible by drawing out nano-filaments using anelectrospining technique [Holme, 2005].Alternatively, pre-extruded nanofibers can bedeposited with the help of electrodeposition. In eithercase, the nanofibers form a mat or a web thatrenders the textile substrate as nanotextured. Thesetextile surfaces have a large surface area andsurface to volume ratio. The large surface areaimproves the absorption or adsorption property of
Pratyush Rai et al.
32
the textile substrate to make them useful as sensorlayers for gas sensors [Tonezzer et al., 2012],biological sensors [Naik, 2004], chemical sensors[Munirathinam et al., 2013], biomedical textiles[Sahoo et al., 2006], water purifiers [Barhate etal., 2007] and electrodes for biopotentialmeasurement [Oh et al., 2013].
Free-standing aligned nanostructures can beobtained on a textile electrode surface by using thetraditional technique of flocking. It uses an electricfield or pneumatic force to drive down millions ofindividual fibers that have a static charge on them.The electric field, in particular, aligns the chargedfibers vertically and the static charge ensures thatthey are apart from each other. The verticallyaligned fibers are driven down on to a flexiblesurface, such as a textile or polymer substrate, andpretreated with adhesive for the fibers to get planted[Rai et al., 2013].Synthetic long chain polymerssuch as polyester, nylon, polyimide and polyaramidare melt- blown or solution blown, or extruded andspun into fibers on a spinneret. The techniques fordrawing out the fibers can be modified to obtainfibers with diameters in the order of nanometers(40-2000 nm). These processes can obtain fibersthat are only as wide as the single layer crystalmade of polymer chains [Reneker et al., 1996].The conventional synthetic polymer fiber spinningtechnology has been improved to produce compositefiber. A mixture of two polymers, that are mutuallyimmiscible, can be drawn in to fibers by extrusionsuch that one polymer forms long fibers in a matrixof the other. A cross-section of such a fiber showsthat 60-1500 islands of one polymer fibers aredistributed in a sea of the other polymer, thus givingthe impression of islands in the sea [Baker, 1992].Composite fibers are best suited because they canbe flocked as microfibers and then bundled. Islandpolymer nanofibers can be released by dissolvingthe sea polymer (Figure 1). This is followed by themetallization of the structures with silver by theelectroless plating method.
The surface of sensor electrodes can havenanoscale and mesoscale free- standing conductivestructures. This contributes to increasing theeffective surface area of the electrodes and highaspect ratio nano/mesoscale structures canovercome the obstruction due to a rough skinsurface and body hair (Figure 2). A good skin-
Figure 1 Nanostructured electrode surface
electrode interface with these nanostructuredsensor electrodes is instrumental in the detectionof electrophysiological signals emanating from thebrain and heart to the skin surface. Figure 3 showsthat the next step would be to understand theprinciples behind the signals generated by the brainand heart. This understanding should then beextended to the skin-electrode interface to studythe effects of nanostructured sensor electrodes onthe monitoring of signals that are important for thediagnosis of neurological and cardiovasculardisorders.
Figure 2 2-electrode configuration for recording skin-electrode impedance (Z) such that Z = V/i because V1>>V2, V3.
Figure 3 Comparison of impedance spectroscopy onplane textile electrode, microstructured electrode andnanostructured electrode with Ag/AgCl gel electrodeas standard. Testing was performed on forearm of youngadult.
Nanotextile bio-sensors for Mobile Wireless Wearable Health Monitoring of Neurological and Cardiovascular Disorders
INSTITUTE OF SMART STRUCTURES AND SYSTEMS
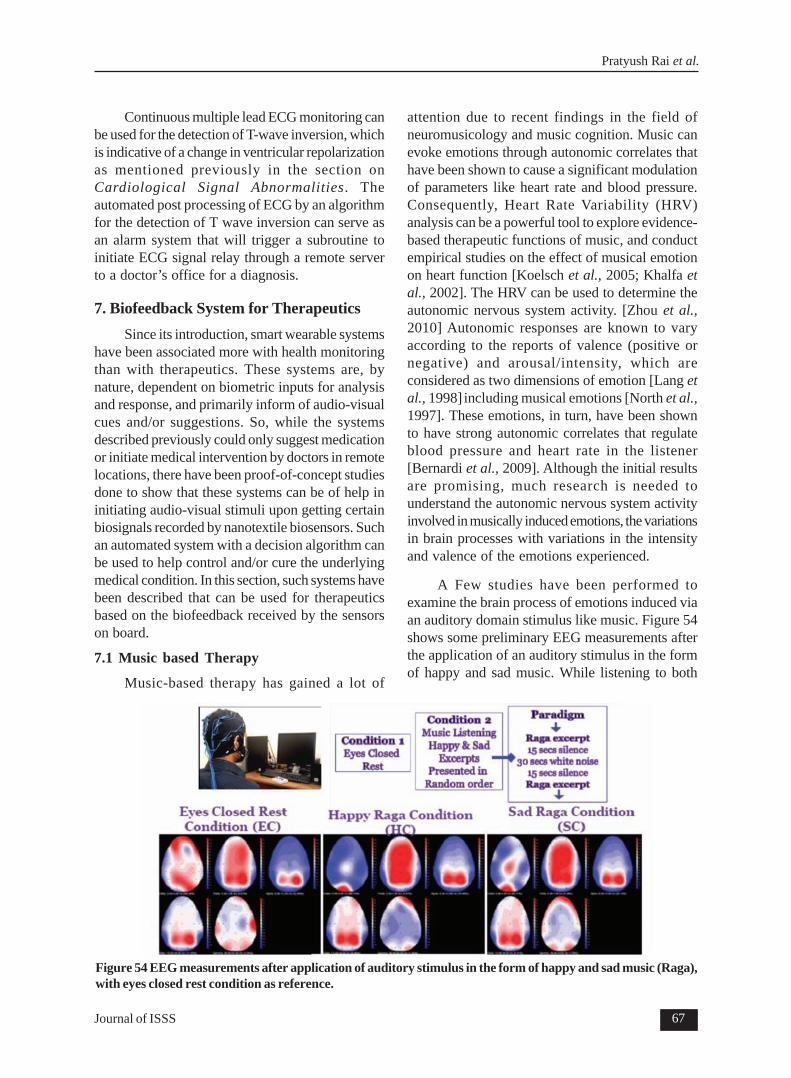
INSTITUTE OF SMART STRUCTURES AND SYSTEMS (ISSS JOURNAL OF ISSS
J. ISSS Vol. 1 No. 1, pp. 1-10, Sept 2012. REGULAR PAPER
Journal of ISSS 33
3. Electrical Signals from Brain and Heart
Nanotextile-based biosensors for EEG, EOG,EMG and ECG detect bioelectromagnetic signalsgenerated by the brain, muscles and heart, whilebeing in contact with the skin. In this section, thebioelectromagnetism involved in the origin andpropagation of bioelectric signals of interest i.e.EEG, EOG, EMG and ECG have been presented.This will lay the ground work for an electromagnetictheory of a skin-electrode interface to explain thesuperiority of nanostructured electrodes over planeand microstructured electrodes, thus, emphasizingthe potential for the development of novel systemsthrough a ground-up understanding of the signalsources i.e. neurons of brain tissue and myocytesof heart tissue, respectively.
3.1 Neurological anatomy andelectrophysiology
The Brain is the central organ of the nervoussystem, which reaches every part of the body. It isresponsible for sensory functions such as vision,touch, hearing, taste and smell. The Brain is thecenter of cognitive functions such as logical thinking,speech, language, and creativity (Figure 5). Mostof the volume of the brain is made up of thecerebrum covered with the cerebral cortex, whichis a thick layer of neural tissue. It is divided intofour lobes, namely the frontal lobe, parietal lobe,temporal lobe and occipital lobe. Within each lobe,
and areas related to spatiotemporal reasoning arestrong on the right side [Kandel et al., 2000]. TheCerebrum sits on top of the brainstem, which is abundle of cranial nerves that connect the brain tomotor and sensory systems in the rest of the body.It also plays an important role in the regulation ofcardiac, respiratory functions, the sleep cycle andfacial movements. The Cerebellum is situatedbehind the brainstem and below the cerebrum. Italso has a cortical layer with a horizontally furrowedsurface called the cerebellar cortex. This part ofthe brain plays an important role in motion control.Though it does not initiate the impulse for motion, itreceives and integrates inputs from sensory systemsand the spinal cord to fine- tune motor activities[Gray, 2008].
3.1.1 Electroencephalogram (EEG)
An Electroencephalogram can be defined asa recorded electric field of the human brain. It canbe attributed to phenomena which are largelyclassified into three categories: spontaneous activity,evoked potentials and bioelectric events producedby single neurons. Spontaneous activity implies allthe neural activities that occur continuously in theliving individual and is measured on the scalp or onthe brain surface. The respective components arethe most prominent features of EEG signals, withamplitude of about 100μV on the scalp and 1-2 mVon the brain surface. The signal frequencybandwidth is between 1Hz and 50 Hz. Evokedpotentials arise in response to a stimulus (auditory,visual, electrical etc.). The relevant EEG signalamplitudes are below the noise threshold. Hence,they are discernible only after averaging the signalsin response to a train of stimuli to improve the signalto noise ratio. Single- neuron bioelectric events canbe recorded by using the micro/nano electrodesimplanted in the brain. It is of particular importancein monitoring the activity of neural clusters to detectthe asynchronous firing of neurons, which is usedas biofeedback by pace-making devices.
Bioelectromagnetism of nerve cell actionpotential
A nerve cell has three parts (Figure 5): a cellbody soma, numerous short dendrites and a singlelong nerve fiber axon. The nerve cell body is similarto that of any other cell with a nucleus,
Figure 4 Anatomy of brain: Cerebral Lobes. Cerebellumand Brainstem
there are numerous areas, each associated with aparticular function. The Cerebrum is separated intotwo hemispheres by a groove called the mediallongitudinal fissure. The left and right hemispherescontain almost similar cortical areas. However,some areas show strong lateralization; especially,areas related to language are strong on the left side
Pratyush Rai et al.
34
mitochondria, endoplasmic reticulum and otherorganelles. The short dendrites receive impulsesfrom one or more neighboring nerve cells andtransfer them to the soma. The effect of theseimpulses can be excitatory or inhibitory. The axonfiber transfers signals from the soma to other nervecells or muscle cells. The axon communicates withthe adjacent nerve cell or muscle cell through asynapse. The neural impulse passes unidirectionallyfrom an axonal presynaptic terminal to postsynapticterminals on the cell through chemicalneurotransmitters.
The membrane of nerve cells is a bilayer filmmade of ambiphillic phosphoglycerides. The cellmembrane has macromolecular pores, whichselectively allow sodium, potassium and chloride ionsto flow through them. The difference between intracellular ion concentration and extra cellularconcentrations results in a resting trans-membranepotential V
m, where V
i is the inner surface potential
and Vo is the outer surface potential of the
membrane.
Vm
= V
i -V
o(1)
The Resting trans-membrane potential isnormally negative (-70 mV). This is made possibleby ionic concentration gradients of Na+ and K+ ions.The extracellular concentration of Na+ is 10 timeshigher than intracellular concentration, whereas theintracellular concentration of K+ is 30 times higherthan the extracellular concentration (Figure 6). If anerve cell is stimulated, can depolarize by changeof in a positive direction or hyperpolarize by changeof in a negative direction with respect to3. Thus,deeming the stimulus as excitatory or inhibitory,respectively [Gray, 2008].
The Excitation of a nerve cell is possible onlyif the stimulation impulse exceeds the threshold
Figure 5 Nerve cell structure
potential value of 20mV, i.e. Vm
at least, changesfrom -70mV to -50mV. At this point, the ionicpermeability of cell membrane for a sodium ionchanges very rapidly to allow a flow of sodium ionsfrom the outside to the inside. This makes V
i more
positive to the point where Vm
reaches 20 mV, whichis followed by a rapid change in the permeability ofpotassium. This allows the potassium ion to movefrom the inside to the outside, thus bringing V
i back
to its resting value. The duration of this Vm
impulseis ~1 ms. This is followed by the restoration of intraand extracellular ionic concentrations by the actionof a Na-K pump, which is another macromolecularpore in the membrane [Gray, 2008].
The stimulus voltage results in a traveling actionpotential from one nerve to another or to a musclecell following the path -dendrites-soma-axon-. Theaction potential is produced by the ion transport ofNa+, K+ and Cl- through the membrane. It dependsmainly on the ratio of the ion concentration insideand outside the membrane, voltage across themembrane and the membrane permeability of eachionic species. Under the quasi-static assumption,the ion concentration ratio and the membranepermeability are represented by Nernst voltage atV
n temperature T (°K) in Equation (2), where R is
the universal gas constant ci,n
and c
o,n are ionic
concentrations of the nth species, is the mole ofelectrons transferred during the reaction of nth
species and F is Faraday’s constant. The drivingforce for the transportation, thus of nth ionic species,is given by (V
m -
V
n).
(2)
Figure 6 Action Potential: Sodium and potassiumconductance (G
Na and G
K), their sum (G
m) and membrane
voltage (Vm) during a propagating nerve impulse
Nanotextile bio-sensors for Mobile Wireless Wearable Health Monitoring of Neurological and Cardiovascular Disorders
INSTITUTE OF SMART STRUCTURES AND SYSTEMS
INSTITUTE OF SMART STRUCTURES AND SYSTEMS (ISSS JOURNAL OF ISSS
J. ISSS Vol. 1 No. 1, pp. 1-10, Sept 2012. REGULAR PAPER
Journal of ISSS 35
The EEG signal arises from the field createdby localized depolarization i.e. excitatorypostsynaptic potential (EPSP) or localized hyper-polarization i.e. inhibitory postsynaptic potential(IPSP). Though the stimulus potential originates atthe synaptic terminals and the resultant pulse(current) travels along the neural axon fibers,electrophysiological models consider the potentialsource with a volumetric distribution and aconducting medium that extend continuously inthree-dimensional space. They are referred to asthe volume source and the volume conductor.
The Bioelectric activity of nerve cells andmuscle cells due to the conversion of energy fromthe chemical to the electric form gives rise to anon-conservative current. This bioelectric sourceconsists of electric current dipoles formed by chargeseparation. Hence, the impressed current density
is similar to the volume dipole moment
density of the volume source, where is zerooutside of the active cells. An infinite homogeneousconductor is a simple approximation of a volumeconductor. The total current density can be given
by Equation (3). The primary sources establish
electric field and resultant return current .
The return current avoids a charge buildup.
(6)
(7)
This solution can be extended to aninhomogeneous volume conductor, considered ascomposed of a finite number of homogeneous
(8)
(9)
(3)
(4)
(5)
Under quasi-static conditions, any change inthe source results in a redistribution of chargesacross the membrane. This is expressedmathematically as follows;
This Poisson’s equation in Vcan be solvedto get
regions. The head as a volume conductor consistsof the brain, cerebrospinal fluid, skull and scalp, notto mention that the brain tissue can be divided intogray matter, white matter and other tissue. Eachpth homogeneous region (uniform conductivity σ andunit volume dv
p) has a boundary S
p, which satisfies
the conditions of the continuity of electric potentialV (6) and the normal component of current density(7). Subscripts 1 and 2 represent either side ofboundary S
p.
Following the same steps as shown inEquations (3), (4) and (5) [Geselowitz, 1964], thenew expression for V is
The first term on the right hand side is thecontribution of the volume source because of the
non-electric energy source . The second term
contribution of a surface source is the summationdipole elements that represent ionic double layers,described by Equations (6) and (7). Since neuraltissue is composed of a very large number of smallnerve cells, can be summed up as a volume dipolemoment density function.
In an electrophysiological measurement, V canbe measured. Thus, Equation (8) describes aproblem where the field and the volume conductorare known, but the volume source is unknown. Suchproblems are called Inverse Problems [Malmivuoet al., 1995]. This pertains to clinically measuredEEG, where the neurologists seek to determine thesource of the measured bioelectric signal (EEG). ASimilar principle obtains with otherelectrophysiological signals such as ECG, EOG andEMG. Though it is possible to evaluate the source
function in the case of ECG and EMG, it has
not been completely feasible in EEG because of
Pratyush Rai et al.
36
the complexity of the brain structure and itselectrophysiological behavior. Quantitative EEG islargely based on an examination of lead patterns tocalculate the sensitivity distribution of lead andestimate the statistically most probable sourceconfiguration i.e. neurological conditions. However,clinical EEG diagnostics is typically based on therecognition of typical signal patterns that are knownto be associated with neurological conditions [Fineet al., 2002].
3.2 Cardiovascular Anatomy andElectrophysiology
The human heart is a muscular organconsisting of four chambers: two upper chambersknown as the atria and two lower chambers knownas the ventricles, which are separated by amuscular septum into the right and left atria andventricles respectively (Figure 7(a)). Oxygendepleted blood from the peripheral organs arereturned to the right atrium through the Superiorand inferior venacava. The contraction of the rightatrium then forces blood into the right ventriclethrough a unidirectional heart valve known as thetricuspid valve. The Right ventricle then contractsand pumps blood into the pulmonary artery whichtakes the blood to the right and left lungs to exchangethe carbon dioxide in the blood for fresh oxygen.Meanwhile, freshly oxygenated blood from the lungsis brought to the left atrium by the pulmonary vein.The left atrium then contracts and forces the bloodinto the left ventricle through a unidirectional valvecalled the mitral or bicuspid valve. The Contractionof the left ventricle forces the blood through thesemilunar valve into the aorta which then branchesout to several arteries and supplies fresh blood toall the cells in the body. The major blood vesselsinvolved in the supply of blood to the cardiac tissueare the Left and Right Coronary arteries that branchoff from the aorta as shown in Figure 7 (b).
Figure 7 (a) A diagram of the internal anatomy of theheart with the impulse conduction pathway (b) Illustratesthe blood vessels involved in the circulation of blood tothe heart muscles.
3.2.1 Origin of Cardiac Electrophysiology –Cardiac Action Potential
Cardiac muscle cells or myocytes have aresting potential varying between -80mV and -90mV. The resting (transmembrane) potential (TP)difference is between the intracellular fluid and theextracellular fluid. This potential difference ismaintained by the selectively permeable cellmembrane that in turn, maintains the difference inthe sodium, potassium, calcium, chloride andpotassium ion concentrations between the two fluids.The TP is regulated predominantly by Sodium andPotassium ion concentrations. The cell membranehas voltage-activated channels that transport ionsinto or out of the cell when triggered by a voltageimpulse. As the voltage- gated channels on the cellmembrane are activated or deactivated by a voltageimpulse travelling across the cell, thetransmembrane potential varies with time. Figure 8illustrates the time variation of the transmembranepotential in a single cardiac myocyte upon the arrivalof an impulse.
Figure 8 Transmembrane potential variations over timefor a single cardiac myocyte.
The transmembrane potential variation duringthe conduction of an impulse is called actionpotential. Upon the arrival of a positive impulse thatshifts the TP above -70mV, a threshold voltage,rapid depolarization and the movement of TPtowards positive potentials occurs. This is due tothe opening of the Sodium gated channels and therapid influx of sodium ions. Following this, potassiumand chloride ion channels open and cause the TP todrop a little towards 0mV. This dip is denoted asPhase 1. In Phase 2, the influx of sodium ions, alongwith some Calcium ions and the efflux of Potassiumions are in equilibrium and the TP is maintained at aconstant value. Phase 3 is the repolarization stepwhen TP moves towards the resting TP. In this
Nanotextile bio-sensors for Mobile Wireless Wearable Health Monitoring of Neurological and Cardiovascular Disorders
INSTITUTE OF SMART STRUCTURES AND SYSTEMS
INSTITUTE OF SMART STRUCTURES AND SYSTEMS (ISSS JOURNAL OF ISSS
J. ISSS Vol. 1 No. 1, pp. 1-10, Sept 2012. REGULAR PAPER
Journal of ISSS 37
phase, the Potassium ions are rapidly exchangedfor sodium ions inside the cells to restore the initialionic balance at the resting TP. The Calcium ionchannels also reduce their conductance during thisphase. Phase 4 is the resting TP condition. The cellprocesses from Phase 0 result in an increasedintracellular Calcium ion concentration in the muscletissue which initiates the release of energy by thebreaking down of adenosine triphosphate (ATP)molecules and conformational changes in proteinsthat result in muscle contraction. The couplingbetween the Ca ion and its role in muscle contractionare discussed in greater detail elsewhere [Reisner,2007].
3.2.2 Cardiac Impulse Conduction Physiology
The heart has a small group of cells calledsinuatrial nodes located in the right atrium that arecapable of generating impulses periodically. Theseimpulses maintain the contraction rhythm of theheart and their direction of propagation maintainsthe progression of contraction i.e. the atria contractfirst, then the ventricles. It is often referred to asthe natural pacemaker of the heart as it directlyregulates the heart rate. Impulses are fed to thesinuatrial node by the Vagus nerve andparasympathetic and sympathetic nervoussystems.
At the beginning of the cardiac cycle, thesinuatrial node generates an impulse which is carriedto the atrioventricular node or the Bundle of Histhrough the internodal pathway, which is made of afiber of specially modified muscle cells. The atriacontract as the impulse is conducted through theinternodal pathway. From the atrioventricular node,the conduction pathways split into the left bundlebranch and the right bundle branch. The left bundlebranch conducts the cardiac impulse along the leftventricle, while the right bundle branch conductsthe impulse along the left ventricle. Both bundlebranches end in Purkinje fiber cells which are treeshaped and spread the cardiac impulse along theentire surface of the ventricles. Figure 7(a)illustrates the electrical conduction pathway fromthe sinuatrial node to the Purkinje fibers.
3.2.3 Electrocardiograph (ECG) andBioelectromagnetic origin and Dipole Theoryfor ECG
The electrocardiogram (ECG) is a simple non-
invasive test to observe the variations in biopotentialsoriginating from the heart, through electrode sensorsplaced on the surface of the skin. The ECGwaveform acquired from a derived Lead IIelectrode placement system is shown in Figure 9,which clearly depicts the classical components ofthe ECG waveform. The waveform characteristicsof the ECG include the P wave, QRS complex, Tand U waves.
Figure 9 ECG waveform with the characteristic P wave,QRS complex, T and U waves.
The P wave represents the wave ofdepolarization that spreads from the Sino-Atrialnode throughout the atria, and is usually 0.08 to 0.1seconds in duration. The QRS complex representsventricular depolarization. The isoelectric periodfollowing the QRS complex is the time at whichthe entire ventricle is depolarized and roughlycorresponds to the plateau phase of the ventricularaction potential. The T wave represents ventricularrepolarization and is longer in duration thandepolarization. It is followed by a U wave whoseorigin is not well understood. There are three popularhypotheses: (a) late repolarization of Purkinje fibers,(b) late repolarization in the left ventricle, and (c)after-potentials causing variations in normal
Pratyush Rai et al.
38
potentials. In normal subjects, U waves have thesame polarity as T waves.
The Dipole Theory for ECG
The ECG is electrical activity observed at thesurface of the skin. The most widely followedtheory that bridges the origin of cardiac activity andthe ECG is the dipole theory [Geselowitz, 1964].The derivations presented in this chapter are basedon the material in [Reisner, 2007].
The development of this theory can be dividedinto three fundamental steps:
1. A model for Cell membrane conduction ofaction potential– Cable Model.
2. A Representation for the electrical activitypropagated from one cell to its neighbor –Dipole Cardiac Vector.
3. A model for the transduction of this electricalactivity from the heart to the surface of thetorso – Derivation of ECG from the Dipolevector.
Cable Model
The cable model is used to describe thetransmembrane potential variations and the currentsflowing both inside and outside the myocardial cell.Figure 10 illustrates the electrical circuit equivalentof the cell membrane.
Figure 10 The circuit model for currents and voltagesat the cell membrane.
Vo and i
o are the extracellular voltage and
current at a given instance. Vi and i
i are the
intracellular voltage and current at a given instance.M represents the lumped properties over a lengthΔχ. r
o and r
i are the resistances per unit length, of
the extracellular and intracellular fluids, respectively.
is the current flowing through the membraneper unit length. The TP is given by V
m = V
i - V
o
along the membrane. Based on this model, we canarrive at a relationship between the rate of changeof TP with respect to position and the ionic current.
(10)
(11)
(12)
(13)
(14)
(15)
(16)
(17)
Dipole Cardiac Vector
At the interface between a depolarizedmyocardial cell and the neighboring resting cell, thereis a transmembrane current that follows to negatethe difference in the TP between them. This ioniccurrent flow can be depicted as shown in Figure 11.
(18)
(19)
On the assumption that the travelling actionpotential has a constant velocity (c) and shape withinthe myocardium we have,
Figure 11 Propagation of transmembrane current atthe interface between a resting myocyte and adepolarized myocyte.
Nanotextile bio-sensors for Mobile Wireless Wearable Health Monitoring of Neurological and Cardiovascular Disorders
INSTITUTE OF SMART STRUCTURES AND SYSTEMS
INSTITUTE OF SMART STRUCTURES AND SYSTEMS (ISSS JOURNAL OF ISSS
J. ISSS Vol. 1 No. 1, pp. 1-10, Sept 2012. REGULAR PAPER
Journal of ISSS 39
This current flowing between a depolarizedand a resting myocyte forms a current dipole. Thevector associated with this dipole is the dipolemoment as shown below in Figure 12 by thehypothetical, spherical interface between adepolarized and a resting myocyte.
(23)
(24)
the level of the skin. For the sake of simplicity, therelation between the dipole vector and surfacepotential at the skin is derived for a single instant oftime. By expressing the dipole moment as a functionof time, a real time expression for ECG can bederived with ease.
The following assumptions are made in thederivation
1. The torso is a linear, isotropic, homogeneous,spherical conductor of radius R and
conductivity .
2. The heart’s activity is represented by the timevarying Cardiac Dipole vector.
Within the spherical torso, linearity dictates,
(22)
(25)
(26)
(27)
Figure 12 Unit dipole produced by the current flowingthrough a hypothetical spherical interface between adepolarized and a resting myocyte.
(21)
(20)
The magnitude of the dipole moment isgiven by,
Where is the unit dipole moment vector,
represents the direction of the dipole moment
and unit increment in a cross sectional area of thecardiac myocyte. dl is the length of a unit dipolevector. and are several orders of magnitude smallerthan the length spanned by the electrodes on thetorso. Therefore, it is acceptable to represent themas infinitesimal increments.
The Values for , ri, r
o and dl can be
estimated and verified experimentally, yielding aquantitative value for the dipole moment vector.
The heart as a source of the potential, however,is the resultant summation of all individual dipolemoments originating from the cardiac myocyte.Given by,
Derivation of ECG from Dipole Vector
According to the dipole theory, the potentialdifference measured across two points on the torsois the geometric projection of the cardiac vector onthe line vector connecting the two points. The aimtherefore, is to derive the relationship between theCardiac Dipole vector and the surface potentials at
Where is the electric field and Φ is theelectric potential. Since the net charge generationthrough the cardiac cycle is 0,
This is a Laplacian equation which is solvedin spherical coordinates with the following boundaryconditions,
1. No current is allowed to flow out of the body.
Therefore, at r = R (radius of torso)
2. Condition established in the dipole cardiac
vector derivation.
The solution that satisfies the boundaryconditions is written as a sum of two functions
At the surface of the sphere i.e. the skin onthe torso, r = R
Pratyush Rai et al.
From (26),
40
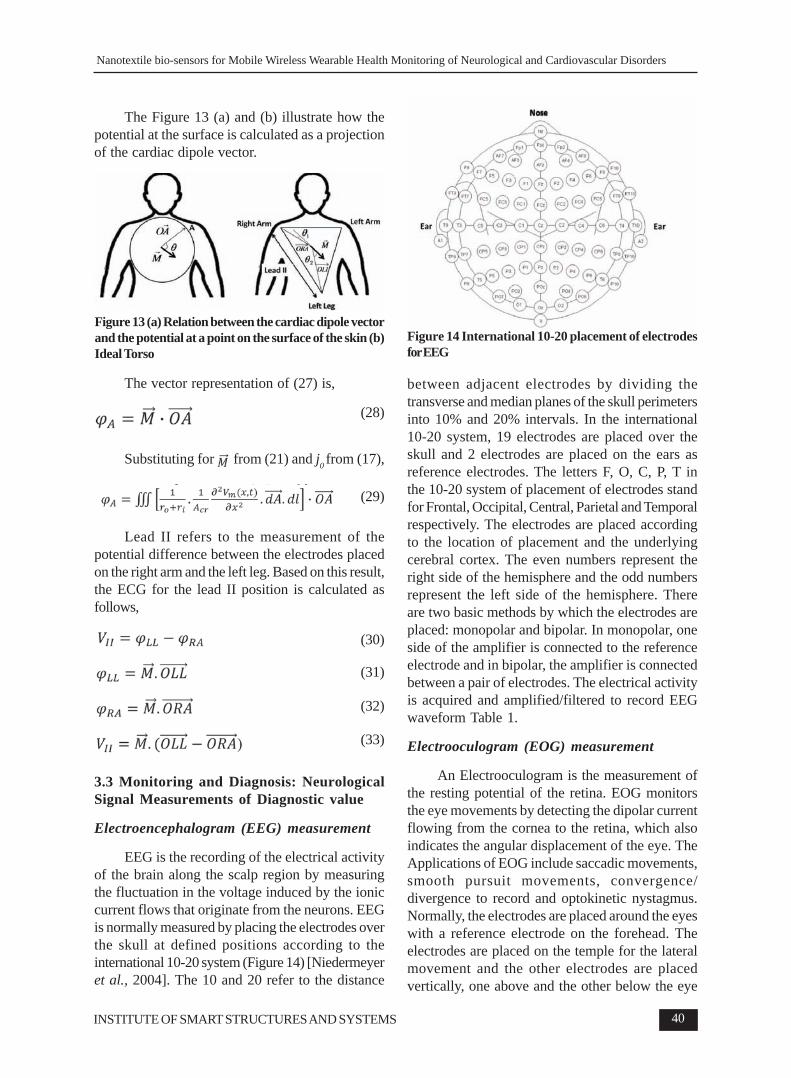
The Figure 13 (a) and (b) illustrate how thepotential at the surface is calculated as a projectionof the cardiac dipole vector.
(28)
The vector representation of (27) is,
Figure 13 (a) Relation between the cardiac dipole vectorand the potential at a point on the surface of the skin (b)Ideal Torso
Substituting for from (21) and j0 from (17),
(29)
Lead II refers to the measurement of thepotential difference between the electrodes placedon the right arm and the left leg. Based on this result,the ECG for the lead II position is calculated asfollows,
(30)
(31)
(32)
(33)
3.3 Monitoring and Diagnosis: NeurologicalSignal Measurements of Diagnostic value
Electroencephalogram (EEG) measurement
EEG is the recording of the electrical activityof the brain along the scalp region by measuringthe fluctuation in the voltage induced by the ioniccurrent flows that originate from the neurons. EEGis normally measured by placing the electrodes overthe skull at defined positions according to theinternational 10-20 system (Figure 14) [Niedermeyeret al., 2004]. The 10 and 20 refer to the distance
between adjacent electrodes by dividing thetransverse and median planes of the skull perimetersinto 10% and 20% intervals. In the international10-20 system, 19 electrodes are placed over theskull and 2 electrodes are placed on the ears asreference electrodes. The letters F, O, C, P, T inthe 10-20 system of placement of electrodes standfor Frontal, Occipital, Central, Parietal and Temporalrespectively. The electrodes are placed accordingto the location of placement and the underlyingcerebral cortex. The even numbers represent theright side of the hemisphere and the odd numbersrepresent the left side of the hemisphere. Thereare two basic methods by which the electrodes areplaced: monopolar and bipolar. In monopolar, oneside of the amplifier is connected to the referenceelectrode and in bipolar, the amplifier is connectedbetween a pair of electrodes. The electrical activityis acquired and amplified/filtered to record EEGwaveform Table 1.
Electrooculogram (EOG) measurement
An Electrooculogram is the measurement ofthe resting potential of the retina. EOG monitorsthe eye movements by detecting the dipolar currentflowing from the cornea to the retina, which alsoindicates the angular displacement of the eye. TheApplications of EOG include saccadic movements,smooth pursuit movements, convergence/divergence to record and optokinetic nystagmus.Normally, the electrodes are placed around the eyeswith a reference electrode on the forehead. Theelectrodes are placed on the temple for the lateralmovement and the other electrodes are placedvertically, one above and the other below the eye
Figure 14 International 10-20 placement of electrodesfor EEG
Nanotextile bio-sensors for Mobile Wireless Wearable Health Monitoring of Neurological and Cardiovascular Disorders
INSTITUTE OF SMART STRUCTURES AND SYSTEMS
INSTITUTE OF SMART STRUCTURES AND SYSTEMS (ISSS JOURNAL OF ISSS
J. ISSS Vol. 1 No. 1, pp. 1-10, Sept 2012. REGULAR PAPER
Journal of ISSS 41
Electrical Activity Frequency of occurrence Characteristics
Beta Activity 13-30 Hz Frontal and parietal lobe Normal activity present when the eyes are openor closed. Some drugs increase the amount ofbeta activity in the EEG
Alpha Activity 8-13 Hz Occipital lobe Also a normal activity when present in wakingadults. It is only seen when the eyes are closedand should disappear or reduce in amplitudewhen the eyes are open
Theta Activity 4-8 Hz Back and Central It can be classed as both a normal andareas of the brain abnormal activity depending on the age and state
of the patient. In adults it is normal if the patientis drowsy. However it can also indicate braindysfunction if it is seen in a patient who is alertand awake.
Delta Activity 0.5-4 Hz It is only normal in an adult patient if they are ina moderate to deep sleep. If it is seen at anyother time. It would indicate brain dysfunction.Abnormal activity may be seen in all or somechannels depending on the underlying brainproblem. It can be shown to the depressedperson
Spike and Wave Random frequency < 60 Hz Number of other waveforms, which are moreActivity specific to certain conditions. For example spike
and wave activity indicates a seizure disorder.Other epileptic conditions may be diagnosed ifspikes or sharp waves are seen
Table 1: EEG and its characteristics
(Figure 15) to measure the vertical movement ofthe eyes [Niedermeyer et al., 2004].
Figure 15 Standard electrode placements for EOG formonitoring vertical (V) and horizontal (H) eye movementand EMG for reliable detection of muscle tone REMsleep
Electromyography (EMG) measurement
EMG depends on the firing action potential ofthe numerous motors present in the muscles. Theelectrodes placed on the skin over the muscle detectthe electrical activity of the muscles of the underlyingtissues (Figure 15). It is difficult to correlate thewaveform with the specific muscle from which itis generated, but this difficulty can be alleviated bythe proper placement of the electrodes. The musclefibers which are present near the electrodes willhave a greater impact on the waveforms, whereasthe muscles at a distance will have less impact withrespect to signal strength. This dependence of thequality of EMG on the distance of the muscles andelectrodes is mainly caused due to the impedancebetween the tissues. Therefore, placing theelectrodes at a distance will provide varying andmore generalized signals, and placing the electrodesat short intervals gives a signal which is morespecific to the muscles over which the electrodesare placed. However, it becomes nearly impossible
Pratyush Rai et al.
42
to identify the specific muscles generating the signalbecause of the interference from noise and motionartifacts. The electrodes are generally placed inparallel with the dominant muscles, since thisminimizes signal cancellation and maximizesbiofeedback sensitivity [Wolpaw et al., 2002].
Neurological Signal Abnormalities
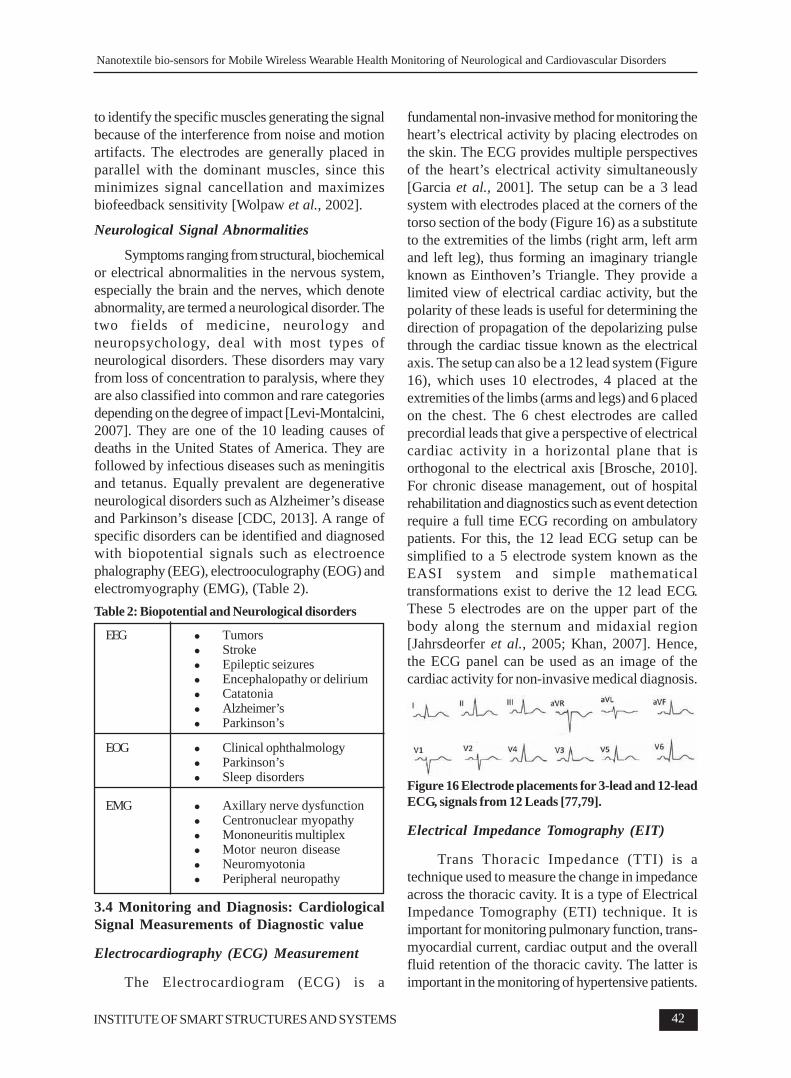
Symptoms ranging from structural, biochemicalor electrical abnormalities in the nervous system,especially the brain and the nerves, which denoteabnormality, are termed a neurological disorder. Thetwo fields of medicine, neurology andneuropsychology, deal with most types ofneurological disorders. These disorders may varyfrom loss of concentration to paralysis, where theyare also classified into common and rare categoriesdepending on the degree of impact [Levi-Montalcini,2007]. They are one of the 10 leading causes ofdeaths in the United States of America. They arefollowed by infectious diseases such as meningitisand tetanus. Equally prevalent are degenerativeneurological disorders such as Alzheimer’s diseaseand Parkinson’s disease [CDC, 2013]. A range ofspecific disorders can be identified and diagnosedwith biopotential signals such as electroencephalography (EEG), electrooculography (EOG) andelectromyography (EMG), (Table 2).
3.4 Monitoring and Diagnosis: CardiologicalSignal Measurements of Diagnostic value
fundamental non-invasive method for monitoring theheart’s electrical activity by placing electrodes onthe skin. The ECG provides multiple perspectivesof the heart’s electrical activity simultaneously[Garcia et al., 2001]. The setup can be a 3 leadsystem with electrodes placed at the corners of thetorso section of the body (Figure 16) as a substituteto the extremities of the limbs (right arm, left armand left leg), thus forming an imaginary triangleknown as Einthoven’s Triangle. They provide alimited view of electrical cardiac activity, but thepolarity of these leads is useful for determining thedirection of propagation of the depolarizing pulsethrough the cardiac tissue known as the electricalaxis. The setup can also be a 12 lead system (Figure16), which uses 10 electrodes, 4 placed at theextremities of the limbs (arms and legs) and 6 placedon the chest. The 6 chest electrodes are calledprecordial leads that give a perspective of electricalcardiac activity in a horizontal plane that isorthogonal to the electrical axis [Brosche, 2010].For chronic disease management, out of hospitalrehabilitation and diagnostics such as event detectionrequire a full time ECG recording on ambulatorypatients. For this, the 12 lead ECG setup can besimplified to a 5 electrode system known as theEASI system and simple mathematicaltransformations exist to derive the 12 lead ECG.These 5 electrodes are on the upper part of thebody along the sternum and midaxial region[Jahrsdeorfer et al., 2005; Khan, 2007]. Hence,the ECG panel can be used as an image of thecardiac activity for non-invasive medical diagnosis.
Figure 16 Electrode placements for 3-lead and 12-leadECG, signals from 12 Leads [77,79].
Electrical Impedance Tomography (EIT)
Trans Thoracic Impedance (TTI) is atechnique used to measure the change in impedanceacross the thoracic cavity. It is a type of ElectricalImpedance Tomography (ETI) technique. It isimportant for monitoring pulmonary function, trans-myocardial current, cardiac output and the overallfluid retention of the thoracic cavity. The latter isimportant in the monitoring of hypertensive patients.
Nanotextile bio-sensors for Mobile Wireless Wearable Health Monitoring of Neurological and Cardiovascular Disorders
INSTITUTE OF SMART STRUCTURES AND SYSTEMS
INSTITUTE OF SMART STRUCTURES AND SYSTEMS (ISSS JOURNAL OF ISSS
J. ISSS Vol. 1 No. 1, pp. 1-10, Sept 2012. REGULAR PAPER
Journal of ISSS 43
The set up uses 4 electrodes placed in thesub-clavicle, sub-axillar, anterior or posteriorpositions (Figure 17). A constant current is appliedto 2 electrodes and the resulting voltage is recordedacross the other 2 electrodes. The electrode pairsare placed across the thoracic cavity from eachother to capture a change in conductivity due to theventilation of the lungs or cardiac function. Thissystem is also capable of acquiring an impedanceimage of the thoracic region by using an electrodearray (16 electrodes or more) placed all around thethoracic cavity. Each set of 4 electrodes acts as aperspective (angle) for scanning the bioimpedance.
Figure 17 Electrical Impedance Tomography (EIT) ofthoracic cavity to lung function
The 4 electrode system includes theelectrodes, a current driver (source), a voltagerecording unit and a phase-sensitive demodulator.The phase demodulator records voltage values whilein phase with the current source and at a phasedelay of 90° to extract the resistance and reactancevalues of the bioimpedance. The Applied current is1/10th of the current threshold for causing anysensation on the skin. The Input current frequencyis kept around 50 kHz. At this frequency, theimpedance characteristics of the tissue are similar
to those at D.C. That is, the current travels inextracellular space but the electrode-skinimpedance is much lower than that at D.C. Hence,there is less instrumentation error due to baselinenoise and impedance mismatch. However,measurements taken across a frequency spectrumcan help in rectifying any phase effects [Holder,2005].
Early systems such as the Sheffield Mark 1used a single impedance measurement circuit anda multiplexer to link with the array of electrodes.More recent systems use devoted circuits for eachelectrode set. While the former is portable but slow,the latter is fast but bulky. Two types of electrodesare commonly used for this system, silver-silverchloride gel electrodes and the conductive gel filledgold cup electrode.
In theory, the EIT system should be free ofimpedance at the electrode-skin interface. Inpractice, skin preparation (abrasion) is used forreducing impedance at the electrode-skin interface.Still, the system experiences a change in impedanceat the interface. During thoracic impedancemonitoring for longer periods of time, the conductivegel may dry up and increase electrode-skinimpedance. Dry textile based nano-biosensorelectrodes have a contact impedance less than thatof the plain dry electrodes; hence, they can be agood alternative to gel- based electrodes for longterm monitoring.
Cardiological Signal Abnormalities
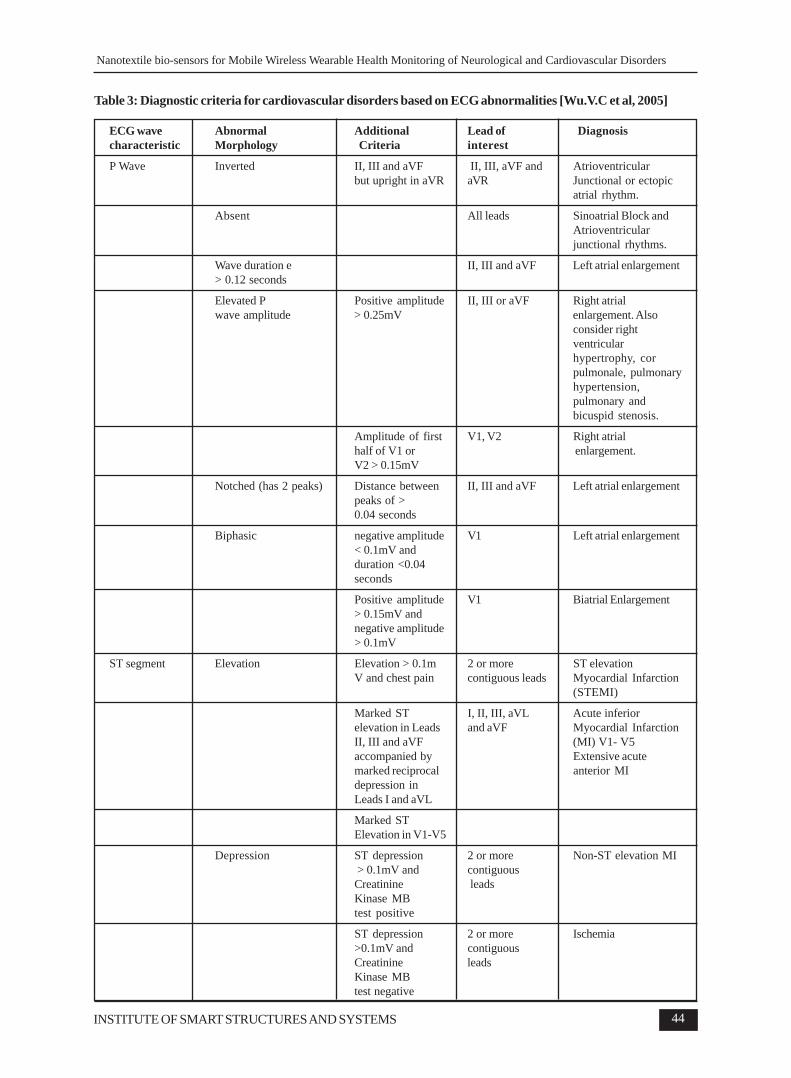
Cardiovascular disorders can be diagnosed byidentifying ECG abnormalities and computing theirfrequency of occurrence. This is accomplished bythe following diagnostic criteria that are mentionedin Table 3.
Apart from the well-defined diagnostic criteriamentioned above, there are a few approaches thatare being researched to eventually be included instandard clinical practice. Ventricular Arrhythmiasare abnormalities in the cardiac conductionphysiology or anatomy originating in the Ventriclesof the heart. From a cardiac patient care perspective,they are a cause of immediate concern becausethey can lead to fatal outcomes like Sudden CardiacArrest (SCA) leading to Sudden Cardiac Death(SCD) and Acute Myocardial Infarction (AMI).
Pratyush Rai et al.
44
ECG wave Abnormal Additional Lead of Diagnosischaracteristic Morphology Criteria interest
P Wave Inverted II, III and aVF II, III, aVF and Atrioventricularbut upright in aVR aVR Junctional or ectopic
atrial rhythm.
Absent All leads Sinoatrial Block andAtrioventricularjunctional rhythms.
Wave duration e II, III and aVF Left atrial enlargement> 0.12 seconds
Elevated P Positive amplitude II, III or aVF Right atrialwave amplitude > 0.25mV enlargement. Also
ST segment Elevation Elevation > 0.1m 2 or more ST elevationV and chest pain contiguous leads Myocardial Infarction
(STEMI)
Marked ST I, II, III, aVL Acute inferiorelevation in Leads and aVF Myocardial InfarctionII, III and aVF (MI) V1- V5accompanied by Extensive acutemarked reciprocal anterior MIdepression inLeads I and aVL
Marked STElevation in V1-V5
Depression ST depression 2 or more Non-ST elevation MI > 0.1mV and contiguousCreatinine leadsKinase MBtest positive
ST depression 2 or more Ischemia>0.1mV and contiguousCreatinine leadsKinase MBtest negative
Table 3: Diagnostic criteria for cardiovascular disorders based on ECG abnormalities [Wu.V.C et al, 2005]
Nanotextile bio-sensors for Mobile Wireless Wearable Health Monitoring of Neurological and Cardiovascular Disorders
INSTITUTE OF SMART STRUCTURES AND SYSTEMS
INSTITUTE OF SMART STRUCTURES AND SYSTEMS (ISSS JOURNAL OF ISSS
J. ISSS Vol. 1 No. 1, pp. 1-10, Sept 2012. REGULAR PAPER
Journal of ISSS 45
Q wave Duration > 0.0 4 Lead III and a VL II, III and aVF Inferior MI, possible seconds, amplitude > 0.7mV, - hypertrophicAmplitude >0.3mV Lead I amplitude Cardiomyopathy,
> 0.15mV Wolff-Parkinson-White Syndrome
V1- V4 Anterior MI
V5-V6 Lateral MI,HypertrophicCardiomyopathy.
I, aVL, V5, V6 Anterolateral MI
R wave Voltage amplitude criteria < 0mV or > 0.6mV V1-V6 Anterior MI, Lefton V1, d” 0.02mV Ventricularin V2, < 0.1mV in Hypertrophy,V3 Left Bundle Branch
Block if QRS duration>0.12 seconds,Emphysema
T wave Peaked V1 - V6 Hyperkalemia
V1 and V2 Posterior MI
Inversion with Inversion in I,II,aVR, V3 - V6 Ischemiaabnormal Q waves or Lead I, II and V3> 0.1mV ST elevation to V6, upright in aor depression VR
Inversion with normal Deep Inversion V2 - V5 Ischemia or PosteriorST segment > 0.5mV MI
II, III, aVF and Ischemia or PosterioraVR MI
Several Leads Cardiomyopathy
Minor inversion Non-specific -< 0.5mV maybe Ischemia,
Electrolyte depletion,Alcohol abuse,cardiomyopathy,Myocarditis or others
QRS complex QRS duration A secondary R wave I, V1, V2, V5, V6 Right Bundle Branch> 0.12 seconds. in V1 or V2, Slurred Block (RBBB)
S wave in V5, V6and Lead I withduration > 40ms. Swave is longer induration than thepreceding R wave inLeads V6 and I
Broad Monophasic I, aVL, V5, V6 Left Bundle BranchR wave notched or Block (LBBB)slurred in Lead I,aVL, V5 or V6,Late intrinsicoiddeflection in LeadsI, V5, V6 greaterthan 0.05 seconds.
Low Amplitude < 0.5mV in Leads All Leads Obesity, PericardialI,II, III, aVF, Effusion, Constrictive
PR Interval Duration > 0.2 seconds II, V1 First degreeatrioventricular block,
Duration < 0.11 seconds II, V1 Wolff-Parkinson-White Syndrome,AtrioventricularJunctional Rhythm,Lown-Ganong-Levinesyndrome.
The T wave, QT interval and the ST segment ofthe ECG are known to be indicative of therepolarization of the ventricles of the heart during acardiac cycle. Consequently, among ECG analysiscriteria, T wave alternans (TWA) and T waveinversion (TWI) have gained significant researchinterest as means to predict the likelihood ofVentricular Arrhythmias.
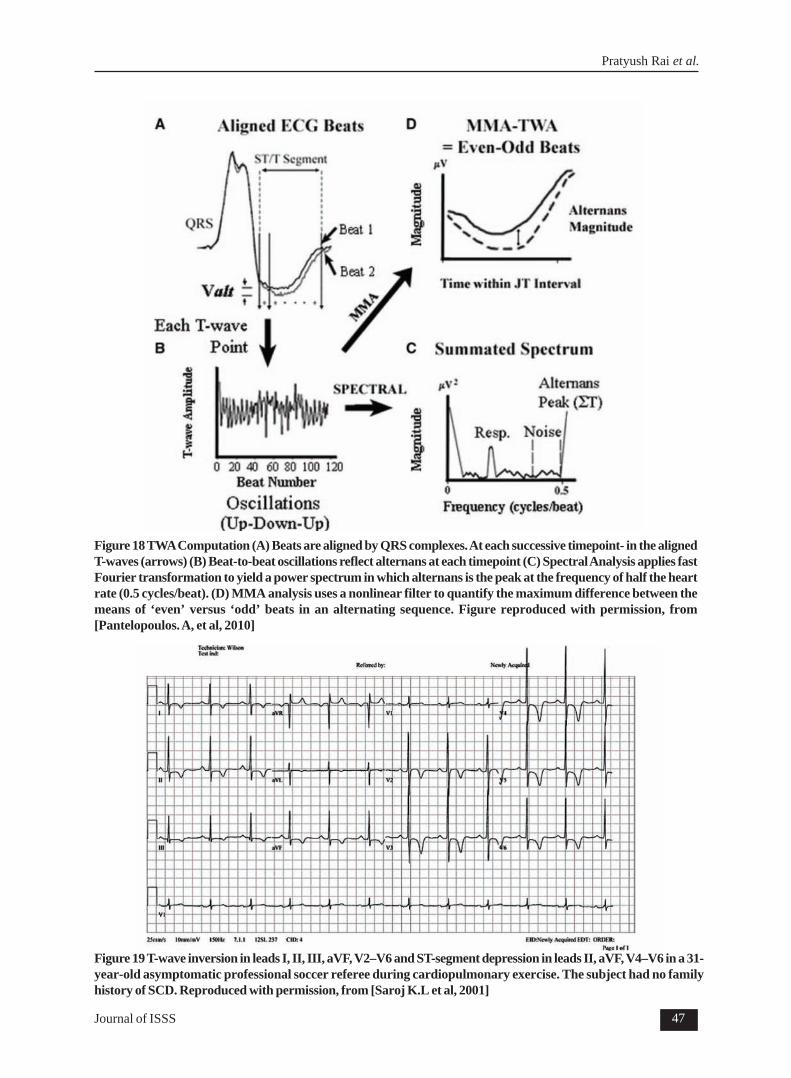
T-wave Alternans (TWA) - T wave alternansis the beat-to-beat variation of T wave morphologyand amplitude. Several clinical studies have tried todetermine the significance of using TWA analysisto detect abnormalities that may lead to VentricularArrhythmias, as well as to establish metrics toperform risk stratification for cardiovascularpatients with prior cardiac episodes. The statisticalsignificance of TWA in predicting ventriculararrhythmias has been established in patients acrossseveral diagnoses [Gehi et al., 2005]. Studies havealso shown the significance of the predictive valueof TWA analysis in post myocardial infarctionpatients [Maeda et al., 2009], risk of SCD[Merchant et al., 2012], congestive heart failure[Klingenheben, 2000], ischemic cardiomyopathy[Chow et al., 2006] and Chagas disease [Ribeiroet al., 2011]. Figure 18 shows an example of a TWAanalysis performed in [Cox et al., 2007]
T-wave Inversion (TWI) - TWI is the reversalin polarity of the normal T wave which is upright inmost ECG leads. TWI has been associated withcardiovascular as well as cerebrovascularabnormalities [Catanzaro et al., 2008]. TWIcoupled with QT interval changes and dialysateCalcium concentrations have also been associatedwith an increased risk of SCD among patients who
have recently undergone Hemodialysis [Catanzaroet al., 2008; Herzog et al., 2008; Pum et al., 2013;Wu et al., 2005]. Moreover, TWI has gainedsignificant research interest because of its highincidence in young athletes [Wilson et al., 2012]and soldiers [Eckart et al., 2004]. TWI is a knowndiagnostic criterion for HypertrophicCardiomyopathy (HCM). HCM is known tosignificantly increase a patient’s susceptibility to aSCA leading to SCD when the patient is exposedto exertion through cardiovascular exercises.Consequently, T wave characteristics are animportant criterion used in prescreening for athletesin sports and soldiers in military recruitment. As anexample, Figure 19 shows the asymptomatic TWIin a Football referee [Wilson et al., 2012].
QT interval dispersion: Sudden cardiacdeath and fatal arrhythmia are the major causes ofdeath among dialysis patients. According to theUnited States Renal Data System (USRDS)database, the mortality rate among dialysis patients(hemodialysis or peritoneal dialysis) is 230 per 1000.SCD and arrhythmias account for 25% of thesedeaths [Herzog et al., 2008]. Dialysis patients whohave pre-existing heart condition(s) are at anincreased risk of sudden death due to disturbancesin electrolyte metabolism. QT dispersion is definedas the difference between the longest and shortestQT intervals extracted from ECG signals fromsingle lead or multiple leads up to the complete setof 12 leads. A heart rate corrected QT interval isgiven by Bazett’s formula
QT dispersion
reflects the differences in the heart dipole vector(previous section) projects and abnormalities of T-
Nanotextile bio-sensors for Mobile Wireless Wearable Health Monitoring of Neurological and Cardiovascular Disorders
INSTITUTE OF SMART STRUCTURES AND SYSTEMS
INSTITUTE OF SMART STRUCTURES AND SYSTEMS (ISSS JOURNAL OF ISSS
J. ISSS Vol. 1 No. 1, pp. 1-10, Sept 2012. REGULAR PAPER
Journal of ISSS 47
Figure 18 TWA Computation (A) Beats are aligned by QRS complexes. At each successive timepoint- in the alignedT-waves (arrows) (B) Beat-to-beat oscillations reflect alternans at each timepoint (C) Spectral Analysis applies fastFourier transformation to yield a power spectrum in which alternans is the peak at the frequency of half the heartrate (0.5 cycles/beat). (D) MMA analysis uses a nonlinear filter to quantify the maximum difference between themeans of ‘even’ versus ‘odd’ beats in an alternating sequence. Figure reproduced with permission, from[Pantelopoulos. A, et al, 2010]
Figure 19 T-wave inversion in leads I, II, III, aVF, V2–V6 and ST-segment depression in leads II, aVF, V4–V6 in a 31-year-old asymptomatic professional soccer referee during cardiopulmonary exercise. The subject had no familyhistory of SCD. Reproduced with permission, from [Saroj K.L et al, 2001]
Pratyush Rai et al.
48
wave loop morphology. This makes it a directmeasure of the regional heterogeneity of myocardialrepolarization, which has the predisposition to re-entry arrhythmias.It is known that potassium,calcium, magnesium and metabolic acidosis areimportant factors for the overall electrical stabilityof the myocardium to ensure normal cellularexcitability, impulse propagation and regularventricular recovery. Large amounts of or rapidremoval of potassium, low calcium dialysate,intracellular magnesium overload, iron overload andrapid bicarbonate gain (metabolic acidosis) are thefactors that increase QT dispersion in dialysispatients [Wu et al., 2005].
4. Monitoring Systems
4.1 Commercially Svailable Monitoring andRecording Systems – Neurological andCardiovascular
All ECG, EEG, EOG and EMG monitoringsystems in the market are mostly defined by thetype of signal acquisition and storage system theyuse. The recording and acquisition of signals is doneby a multichannel desktop recording, display andmonitoring system, or its handheld version, a portabledata logging device Holter monitor. A majority ofsystems can be classified into these two categories.Modern multichannel desktop recording systemscan connect to the physician’s office from a remotelocation with the help of Ethernet connectivity or
by a wireless network to a nearby workstation foreasier workflow. Further advancement has allowedthe inclusion of automatic triggers that can alertthe nursing staff in the hospital but it is still confinedto the hospital bed. The Holter monitoring systemis the only commercially available multiple leadambulatory measurement system and it performsonly data logging. A list of noteworthycommercialized ECG recording technologies hasbeen listed in Table 4.
In recent years, these monitors have beenequipped with an event recording functionality thatallows for automatic or manual logging of the time-of -the- event onset, while continuously recordingthe ECG signals. In addition to this, the Holter canbe interfaced with wireless electronics to achieveambulatory monitoring. This measure haschallenges such as a short battery life and a largedata volume for transmission.
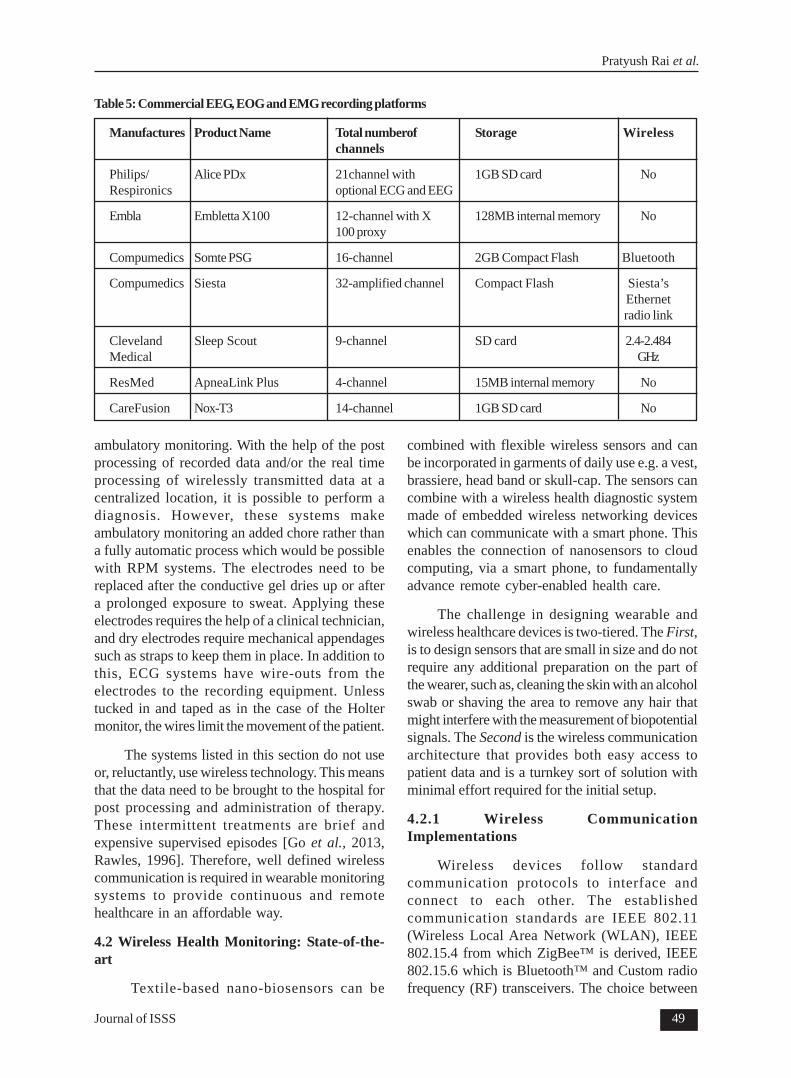
Most EEG recordings for diagnostic purposesare performed in hospitals or other clinical settings.Commercially available ambulatory or out- of-hospital recording platforms for EEG, EOG andEMG are primarily intended for sleep studies thatneed to be performed at home. A brief list isprovided in Table 5.
A survey of existing monitoring and diagnosticsindicates that there are a few systems for ECG,EEG, EOG and EMG, which facilitate at- home and
Table 4: Commercial ECG recording platforms
Manufactures Product Name Total numberof Storage Wirelesschannels
Phillips Page writer TC50 EKG 12 channels of ECG USB memory stick(upto 16 GB) No
GE Healthcare MARS Ambulatory 3-12 channels of ECG 1 GB internal and optical NoECG System (SEER 12, DVD storage SEER light)
ResMed ApneaLink Plus 4-channel 15MB internal memory No
CareFusion Nox-T3 14-channel 1GB SD card No
ambulatory monitoring. With the help of the postprocessing of recorded data and/or the real timeprocessing of wirelessly transmitted data at acentralized location, it is possible to perform adiagnosis. However, these systems makeambulatory monitoring an added chore rather thana fully automatic process which would be possiblewith RPM systems. The electrodes need to bereplaced after the conductive gel dries up or aftera prolonged exposure to sweat. Applying theseelectrodes requires the help of a clinical technician,and dry electrodes require mechanical appendagessuch as straps to keep them in place. In addition tothis, ECG systems have wire-outs from theelectrodes to the recording equipment. Unlesstucked in and taped as in the case of the Holtermonitor, the wires limit the movement of the patient.
The systems listed in this section do not useor, reluctantly, use wireless technology. This meansthat the data need to be brought to the hospital forpost processing and administration of therapy.These intermittent treatments are brief andexpensive supervised episodes [Go et al., 2013,Rawles, 1996]. Therefore, well defined wirelesscommunication is required in wearable monitoringsystems to provide continuous and remotehealthcare in an affordable way.
4.2 Wireless Health Monitoring: State-of-the-art
Textile-based nano-biosensors can be
combined with flexible wireless sensors and canbe incorporated in garments of daily use e.g. a vest,brassiere, head band or skull-cap. The sensors cancombine with a wireless health diagnostic systemmade of embedded wireless networking deviceswhich can communicate with a smart phone. Thisenables the connection of nanosensors to cloudcomputing, via a smart phone, to fundamentallyadvance remote cyber-enabled health care.
The challenge in designing wearable andwireless healthcare devices is two-tiered. The First,is to design sensors that are small in size and do notrequire any additional preparation on the part ofthe wearer, such as, cleaning the skin with an alcoholswab or shaving the area to remove any hair thatmight interfere with the measurement of biopotentialsignals. The Second is the wireless communicationarchitecture that provides both easy access topatient data and is a turnkey sort of solution withminimal effort required for the initial setup.
4.2.1 Wireless CommunicationImplementations
Wireless devices follow standardcommunication protocols to interface andconnect to each other. The establishedcommunication standards are IEEE 802.11(Wireless Local Area Network (WLAN), IEEE802.15.4 from which ZigBee™ is derived, IEEE802.15.6 which is Bluetooth™ and Custom radiofrequency (RF) transceivers. The choice between
Pratyush Rai et al.
50
wireless protocols for the development of awearable wireless health monitoring platformlargely deals with the complexity of theconnection, power consumption and the scalabilityof the application from a single to a multiple usersystem.
WLAN, Wi-Fi based systems and Wi-Fi-Bluetooth integrated systems have beendemonstrated [Yu et al., 2006] but Wi-Fi consumesas much as four times the power consumed byBluetooth and hence is not an energy efficientsolution. ZigBee™ is an attractive protocol as faras connection stability, link layer retransmit in thecase of data loss and a large range of networkconfigurations are concerned, but the data rate ismuch lower than that of Bluetooth™. Moreover,ZigBee™ is not available on standard portabledevices. Custom RF transceivers do not havelimitations on the data rate and consume less powerthan Bluetooth™ but additional hardware isnecessary to connect than to standard devices.Thus, Bluetooth™ is ideally suited for pervasivewireless healthcare devices because of the newultra low power connection profiles, high data ratesof up to ~3Megabits per second (Mbps) andstandard availability on all portable electronicdevices.
The ultimate goal for all communicationarchitectures is to provide a means of storing thelarge quantity of real time patient healthcare datain a remote server and providing emergencywarning mechanisms wherein abnormal data isautomatically identified and a warning is sent tohospitals, physicians and the patient as well. Basedon these requirements the solutions proposed thusfar have been:-
1. A Custom RF transceiver sends data to a PCwith a plug in RF transceiver and the PCprocesses and uploads the data [Huang et al.,2009].
2. The ZigBee™ based approach which issimilar to custom RF in that connectivity is toa PC or a customized receiver module thathas a Wi-Fi-ZigBee™ combination chip thatdirectly uploads to a server [Varadan et al.,2010]. This has the potential of a scale up in asetting such as home and local area network(LAN) hotspots.
3. A Bluetooth™ based smart phone relay withlocal signal processing and data relay througha Global System for Mobile Communication(GSM)/General Packet Radio Service (GPRS)[Lee et al., 2007]. This solution trulyfacilitates wearable health monitoring systemsapplications.
4.2.2 Sensor to Wireless Module Connectivity
The integration of sensors and the signalconditioning and wireless modules in wearableplatforms can be achieved through three strategies.
1. Connecting the sensors through wires to asmall module that incorporates signalconditioning, amplification circuits as well asa wireless transceiver.
2. Connecting each sensor to a small wirelessmodule that acts as an independent node –Body area Network (BAN)
3. Integration of various sensors on a garmentand using conductive threads and yarn to carrypower and signals from the sensors to a smallsignal conditioning and wireless transceivermodule.
Wired
This is the first generation of portablehealthcare devices in which systems for POCmonitoring consisted of wired sensors that thepatient needed to mount manually (Figure 20).
Figure 20 Schematic of sensors using wires to connectto a single amplifier, signal conditioning and RadioFrequency Transceiver module
Complete health monitoring needs multiplesensors: bioelectric signals like electrocardiogram(ECG), Electromyogram (EMG), Electroence
Nanotextile bio-sensors for Mobile Wireless Wearable Health Monitoring of Neurological and Cardiovascular Disorders
INSTITUTE OF SMART STRUCTURES AND SYSTEMS
INSTITUTE OF SMART STRUCTURES AND SYSTEMS (ISSS JOURNAL OF ISSS
J. ISSS Vol. 1 No. 1, pp. 1-10, Sept 2012. REGULAR PAPER
Journal of ISSS 51
phalogram (EEG), Electrooculogram (EOG), lightabsorption based sensors for pulse oximetry,pressure flow sensors for air flow measurement,and strain sensors for respiration effortmeasurement. Each sensor has to be wired throughregular insulated wire or shielded wires in the caseof biopotential signals. The wireless communicationmodule uses custom data transmission hardwareand software that does not easily integrate into apatient’s quotidian life—an individual has to carrya special device for data collection. This approachis not user- friendly. Although a significantimprovement in terms of portability is achieved, thesensors used in a majority of these systems are notwearable. Figure 20 shows a schematic of thesewired sensors.
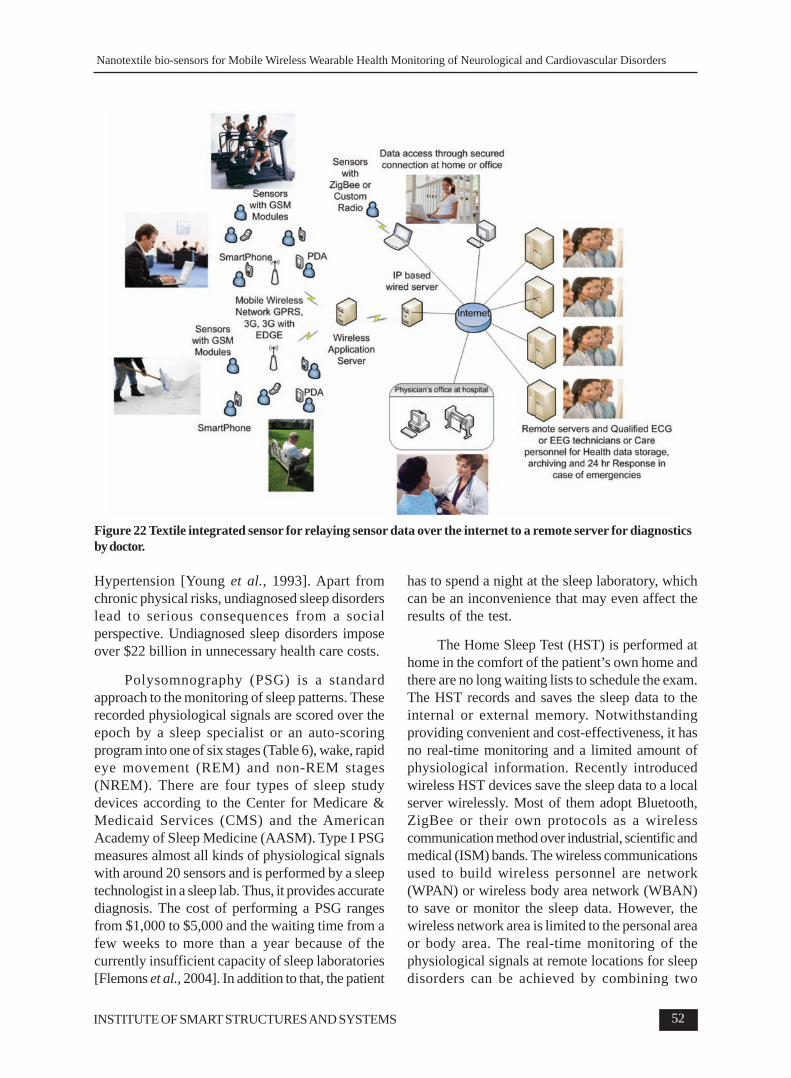
Body Area Network (BAN) Concept forHealthcare Devices
BAN is a network of independentwireless nodes that span the personal space of auser Figure 21. Various wireless protocols havebeen used to implement BAN. The state of the artstandards in BAN in wearable sensor systems isdiscussed in detail in [Pantelopoulos et al., 2010].The ultimate objective is to have independentsensors for physiological signals likeElectrocardiogram (ECG), Electroencephalogram(EEG), Electrooculogram (EOG), Electromyogram(EMG), Pulse rate, Blood oxygen saturation (PulseOximetry and Photoplethysmography), temperatureand respiration that have wireless transmitterssending data to a single receiving station which maybe a Personal Digital Assistant (PDA), a tabletPersonal Computer (PC), a PC, a smartphone or acustom receiver unit. The various wirelesscommunication protocols used are BluetoothTM,ZigBee and custom communication protocols forlow power transmission of data. The truestembodiment of this concept will have all body- worn
sensors (slaves) communicating with a singlereceiver unit (the master) and transmitting time-synchronized data in real-time. Figure 22 presentsa schematic of the concept.
This section presents textile- based wearablenano-biosensor systems that can measureneurological signals and identify anomalies for thediagnosis of targeted neurological disorders. Theseintended applications include chronic disordermonitoring, monitoring for safety and rehabilitation,and for improved quality of life.
A range of specific disorders can be identifiedand diagnosed with bio potential signals such aselectroencephalography (EEG), electrooculography(EOG) and electromyography (EMG), because oftheir rooted significance and origin. By measuringand analyzing these bio potential signals, certainneurological disorders can be detected or diagnosed.Several applications such as sleep disorders,drowsiness and brain machine interface based onthese bio potential signals detected by textile basedanalog nano- sensors are described in the followingsections.
5.1 Wireless Telemedicine System forDiagnosing Sleep Disorders – The HomeSleep Test (HST)
Sleep disorders are related to sleep patternsand are characterized by disturbances in theamount, quality or timing of sleep. There are about88 recognized sleep disorders. According to theInternational Classification of Sleep Disorders, thesleep disorders are classified as dyssomnias,parasomnias, sleep disorders associated with otherdisorders, proposed sleep disorders [Levi-Montalcini, 2007]. According to the NationalInstitutes of Health (NIH), 50 to 70 millionAmericans suffer from sleep disorders and sleepdeprivation [Shen et al., 2006]. The short-termeffects of sleep disorder are morning headaches,excessive daytime sleepiness, short-term memoryloss and depression. The cumulative long-termeffects are associated with heart failure, stroke/transient ischemic attack, Type 2 Diabetes, andFigure 21 Illustrates the concept of Body Area Network
of wearable sensors incorporated in band-aid
Pratyush Rai et al.
52
Hypertension [Young et al., 1993]. Apart fromchronic physical risks, undiagnosed sleep disorderslead to serious consequences from a socialperspective. Undiagnosed sleep disorders imposeover $22 billion in unnecessary health care costs.
Polysomnography (PSG) is a standardapproach to the monitoring of sleep patterns. Theserecorded physiological signals are scored over theepoch by a sleep specialist or an auto-scoringprogram into one of six stages (Table 6), wake, rapideye movement (REM) and non-REM stages(NREM). There are four types of sleep studydevices according to the Center for Medicare &Medicaid Services (CMS) and the AmericanAcademy of Sleep Medicine (AASM). Type I PSGmeasures almost all kinds of physiological signalswith around 20 sensors and is performed by a sleeptechnologist in a sleep lab. Thus, it provides accuratediagnosis. The cost of performing a PSG rangesfrom $1,000 to $5,000 and the waiting time from afew weeks to more than a year because of thecurrently insufficient capacity of sleep laboratories[Flemons et al., 2004]. In addition to that, the patient
has to spend a night at the sleep laboratory, whichcan be an inconvenience that may even affect theresults of the test.
The Home Sleep Test (HST) is performed athome in the comfort of the patient’s own home andthere are no long waiting lists to schedule the exam.The HST records and saves the sleep data to theinternal or external memory. Notwithstandingproviding convenient and cost-effectiveness, it hasno real-time monitoring and a limited amount ofphysiological information. Recently introducedwireless HST devices save the sleep data to a localserver wirelessly. Most of them adopt Bluetooth,ZigBee or their own protocols as a wirelesscommunication method over industrial, scientific andmedical (ISM) bands. The wireless communicationsused to build wireless personnel are network(WPAN) or wireless body area network (WBAN)to save or monitor the sleep data. However, thewireless network area is limited to the personal areaor body area. The real-time monitoring of thephysiological signals at remote locations for sleepdisorders can be achieved by combining two
Figure 22 Textile integrated sensor for relaying sensor data over the internet to a remote server for diagnosticsby doctor.
Nanotextile bio-sensors for Mobile Wireless Wearable Health Monitoring of Neurological and Cardiovascular Disorders
INSTITUTE OF SMART STRUCTURES AND SYSTEMS
INSTITUTE OF SMART STRUCTURES AND SYSTEMS (ISSS JOURNAL OF ISSS
J. ISSS Vol. 1 No. 1, pp. 1-10, Sept 2012. REGULAR PAPER
Journal of ISSS 53
wireless communication standards or using themobile communication network. The concept ofcombining two wireless communication standardsis extending WPAN/WBAN to WAN. Therefore,one wireless communication standard is for buildingWPAN/WAN and the other wireless standards arefor WAN.
The sections hereafter describe the wirelessHST devices which support the real-time monitoringof sleep data at remote places by using a combinationof wireless communication standards.
System Description
The system mainly consists of sensors, awireless sensor electronic unit, a wireless receiverunit and a monitoring unit. The system measures 5biopotential signals to evaluate the sleep stages; 2xEOG, 1x EMG and 2x EEG. The receiver unit adoptstwo wireless communication standards, Wi-Fi andZigbee. The combination of two wireless standardsin the receiver unit allows us to build WPAN andextend the WPAN to WLAN/WAN. The sensorelectronic unit sends the sensed 5-channel signals
2x EOG, 1x EMG and 2x EEG to the receiver unitthrough a Zigbee network. The receiver unit thenretransmits to the monitoring unit or remote serverthrough the Wi-Fi network. Figure 23 shows thedata flow of the system [Varadan et al., 2010].
Physiological Wake Stage Stage 1 Stage 2 Stage 3 Stage 4 StageCharacteristic NREM NREM NREM NREM REM
EEG Parieto- Alpha Sleep Delta Delta Thetaoccipital waves spindles waves of waves of waves; sawalpha waves decrease to (approximately 2 Hz or less 2 Hz or tooth(8-13 Hz) less than 12-14 Hz) measuring less waves; betamore than 50% of and K 75 uV or measuring rhytms50% of the epoch: complexes more 75 uV orthe mixed theta lasting at occupying morewith fronto- (4-8 Hz) least 0.5 sec; 20-50% of occupyingcentral beta and beta delta waves the epoch > 50% ofrhythms rhythms of 2 Hz or the epoch(> 13 Hz) occur, less measuring
EMG Elevated Elevated Mildly Mildly Mildly to Markedlybut less than decreased decreased moderately decreased toin awake stage decreased absent
Table 6 Biopotentials in sleep disorders according to the Rechtschaffen and Kales standard [Wessberg. J, et al,2000]
Figure 23 Data flow of the wireless telemedicine systemfor diagnosing sleep disorders
As dry electrodes, nanostructured textile-based electrodes or gold nanowire electrodes canbe used instead of a conductive gel to overcomethe drawbacks of wet silver-silver chlorideelectrodes as mentioned previously i.e. Figure 24shows both the dry electrodes. The main functionsof the wireless sensor electronic unit are dataacquisition, data processing, and data flow
Pratyush Rai et al.
54
management and data transmission. The wirelesssensor electronic unit consists of an amplifiermodule, a data acquisition/process module and aZigbee wireless module.
The raw physiological signals from the sensorsare very weak, ranging from micro-volts to milli-volts, and are contaminated by noises, especially50/60 Hz power line interference. Therefore, thesignals need to be amplified and filtered to improvethe signal to noise ratio. The biopotential signals forsleep studies are differential signals. The bodyimpedance and contact impedance between the skinand the electrodes might vary under different skinconditions leading to impedance mismatches.Therefore, an amplifier should have a high commonmode rejection ratio (CMRR) and high inputimpedance to maintain signal integrity. The amplifiermodule has 5-channels for 2x EOG, 1x EMG and2x EEG. The gain and bandwidth of each channelwere tuned according to the AASM manual [Iberet al., 2007]. The amplified signals are digitizedusing an analog to digital converter (ADC) on themicroprocessor.
Finally, the signals are transmitted to thereceiver unit by the Zigbee module. The output ofthe ADC is transferred to the ZigBee modulethrough a Universal Asynchronous Receive/Transmit (UART) interface. The data from themicroprocessor are transmitted to the wirelessreceiver unit through ZigBee. The data receivedby the receiver unit are reconstituted as packetswith a sequential hex code including a node number,
sampling rate, the number of channels and the dataaccording to the defined communication protocol.These packets are saved in the data buffertemporarily and transmitted when a data request isreceived from a PC or a remote server. The ZigBeeinterface routinely checks the wireless connectionbetween the sensor electronic unit and the receiverunit, and then transmits the sleep data to the receiverunit. This is done to ensure recovery from lostwireless connections. The wireless sensor electronicunit uses a 3.7V poly lithium battery as a powersupply (Figure 25).
Figure 25 (a) block diagram and (b) image of the wirelesssensor electronic unit
While the function of the sensor electronic unitis to build the wireless personnel area network withZigBee, the role of the receiver unit is to extendthe ZigBee network to the wireless local areanetwork with Wi-Fi. The sleep data needs to bemonitored at remote places. Therefore, the networkshould be extended to use Internet through Wi-Fibecause ZigBee is not as prevalent as Wi-Fi. Theprocessor board in the receiver unit consists of twowireless modules, the ZigBee and Wi-Fi module, a16 MB SDRAM as a buffer for sensor data, a 64MB NAND Flash memory for the storage ofprograms, a 32-bit microcontroller and an Ethernetcontroller. The receiver includes the ZigBee andWi-Fi module management and the servermanagement based on TCP/IP [Varadan et al.,2010]. Figure 25 shows the block diagram andimage of the wireless receiver unit and Figure 26shows the data flow in the wireless receiver.
Two electrodes were placed on the left lowerand right upper side of the eyes to measure 2-channel EOG. One of the electrodes was placedon the chin to measure EMG and to detect thegrinding of teeth or mouth movement. The last twoelectrodes were placed on C3 and O2 positions onthe scalp according to the international 10-20system. The reference electrode to measure thedifferential biopotential signals was placed on theleft ear lobe. Figure 27 shows an image of a subject
Nanotextile bio-sensors for Mobile Wireless Wearable Health Monitoring of Neurological and Cardiovascular Disorders
INSTITUTE OF SMART STRUCTURES AND SYSTEMS
INSTITUTE OF SMART STRUCTURES AND SYSTEMS (ISSS JOURNAL OF ISSS
J. ISSS Vol. 1 No. 1, pp. 1-10, Sept 2012. REGULAR PAPER
Journal of ISSS 55
under a sleep study with the proposed system andthe GUI of the monitoring utility program developedusing MATLAB (Matworks, Inc, Natick, MA,USA).
consciousness and Alpha waves with wakefulrelaxation with eyes closed. By opening and closingthe eyes alternately, the changes of brain wavescan be observed. The EEGs from the C3 and O2positions show that alpha waves are dominant whenthe eyes are closed. The EEG from position O2shows stronger alpha waves than from position C3even though both the channels of the amplifier areset to the same gain. It verifies that the alpha wavespredominantly originate from the occipital lobeduring wakeful relaxation with closed eyes.
In a case study on a human subject from 10pm to 4 am, 5-channel signals were monitored andrecorded in real-time [Varadan et al., 2010]. TheEEG signals are plotted in Figures 29-31. Based onthe criteria specified in TABLE 6, a transitionbetween sleep stages can be seen in the EEG datafrom C3 and O2. This shows that a wirelesstelemedicine system for diagnosing sleep disorderscan address the need for the efficient extension ofthe network to provide remote monitoring in real-time. The dry electrodes and a scalable WPAN-WLAN wireless technology will foster moreconvenient and accurate diagnosis of sleepdisorders.
5.2 Drowsiness Monitoring: A Textile BasedNano-biosensor System Head band with GSM
Wireless wearable textile based nano-biosensor systems can also be useful in improving
Figure 26 Data flow in the wireless receiver unit
Figure 27 Experimental test set-up for the system withZigbee and Wi-Fi; (a) image of a subject underexperiment and (b) GUI of the monitoring utility program
Figure 28 shows the measured and recordedbiopotential signals using this system. In the caseof EOG, five different types of eye motion, blinking,left, right, up and down movement of eyeballs, canbe detected to emulate REM and the wakeful sleepstage. The left and right EOGs show an oppositepolarity of slope due to the placement of theelectrodes over the reference electrode. EMGreflects the movement of the chin. The EEGacquisition performance can be verified bydiscerning between beta waves and alpha waves.Beta waves are associated with normal waking
Figure 28 Monitored EOG, EMG, EEG from the wirelesstelemedicine system for sleep study
Pratyush Rai et al.
56
safety. This application addresses a condition thatinterferes with human performance and can becomean occupational hazard. Drowsiness is defined asthe onset of sleep or the precursor for sleep. Forinstance, the transition state from wakefulness tosleep under undesired circumstances (in mostcases) is defined as drowsiness. It can also bereferred to as an intervening process inconcentration and attention. Additionally, fatigue ordrowsiness is also referred to as the psychologicaldisability which results from various sources andorigins [Saroj et al., 2001]. Drowsy driving is oneof the most common reasons for road accidents.National Highway Traffic Safety Administration(NHTSA) estimates that approximately 25% ofpolice-reported crashes involve some form of drivinginattention - the driver is distracted, asleep orfatigued, or otherwise “lost in thought” [Ranney et
Figure 29 This epoch illustrates the beginning oftransition from Stage 1 to Stage 2. Vertex sharp wavesare very prominent. In the beginning of the epoch, thetaand alpha waves are dominant. In the middle of the epoch,there is a K complex. End of the epoch, delta waves lessthan 2 Hz are shown.
Figure 30 This epoch illustrates the Stage 3. Acceptablehigh amplitude, slow wave activity occupies between20% and 50%.
Figure 31 This epoch illustrates a transition betweenStage 2 and Stage REM. In the beginning of the epoch,there is sleep spindle followed by a K complex. Followingthe K complex are saw-tooth waves which herald theappearance of REM. The last half of epoch showsrelatively low voltage, mixed frequency.
al., 2000; ETSC, 2001]. The 100-Car NaturalisticStudy [Neale et al., 2005] recorded the activitiesof 241 drivers over the course of 12 -13 monthsand found that 78% of the crashes and 65% ofnear crashes had one form of inattention as acontributing factor.
The Monitoring of people like securitypersonnel, drivers, shift based workers and custodialworkers who need to stay awake during the normalsleep cycle, and the prevention of people from fallingasleep on wheels to avert accidents requiresdrowsiness monitoring systems. The PsychomotorVigilance Test (PVT) [Robertson et al., 2004],Epworth Sleepiness Scale, Maintenance ofwakefulness test (MWT), Karolinska SleepinessScale (KSS), video monitoring, subjective reportsand behavioral approaches are some of the testsperformed to assess the quality of sleep from whichan inference can be derived about attentivenessduring a task [Nilson et al., 1997].
These systems rely on biopotential signalapproaches to discriminate between sleepiness andwakefulness. Primarily, biopotentials like ECG,EOG and EMG are collected through the electrodesby establishing a skin-electrode contact. Methodslike sample entropy and phase synchronization areused in this process of discriminating between sleep/wakefulness. However, a real time and accuratemonitoring system to detect drowsiness and classifysleepiness/wakefulness or drowsiness/alertnessbecomes highly essential for continuous monitoring
Nanotextile bio-sensors for Mobile Wireless Wearable Health Monitoring of Neurological and Cardiovascular Disorders
INSTITUTE OF SMART STRUCTURES AND SYSTEMS
INSTITUTE OF SMART STRUCTURES AND SYSTEMS (ISSS JOURNAL OF ISSS
J. ISSS Vol. 1 No. 1, pp. 1-10, Sept 2012. REGULAR PAPER
Journal of ISSS 57
if the system has to avert road collisions.[Ramasamy et al., 2013; Lin et al., 2005; Jap etal., 2009]
Considering the preceding parameters asfactors of a reliable and a real time monitoring unit,a flexible headband equipped with sensors and aGSM wireless transmitter that can communicatewith a receiver at a remote location was built (Figure32). A Textile based nano-biosensor is placed insuch a way that it is in contact with the foreheadfor monitoring the frontal cortex of the brain. Thesensor was designed to detect raw biopotentialsignals, which are a combination of EEG and EOG[Ramasamy et al., 2013]. The amplifier and an A/D converter circuit feeds the digitized signal to aGSM module, which can send data to a remoteserver for real time monitoring and detection of aperson’s level of drowsiness. The usage of the GSMmodule provides an advantage over thecommunication distance as it covers longerdistances as compared to Bluetooth and ZigBee.This attribute is important in applications forpersonnel with high risk or field jobs.
The back end of the module consists ofsoftware at the receiver end which is programmedto extract the features from the EEG and EOGsignals. Specific features from which sleep can bedetected are extracted in the software and it popsout a warning signal when the driver falls asleep.The rate of eye blinks from the EOG signal and thepeak values from Autoregressive Power SpectralDensity (AR-PSD) of the brain signal in the alphafrequency band are correlated to estimate thecondition of the person. The receiver side softwareis programmed to perform feature extraction, AR-PSD of the signal, and improving the signal qualityto adapt the processing strategy and parametricanalysis. These separate results are then correlatedin the main server program of the softwareaccording to the decision criteria, which are basedon the initial set of experiments [Ramasamy et al.,2013].
Initial experiments, as shown in Figure 33, areconducted to get ARPSD values fixing the decisioncriteria. It shows that the measured values clearlyindicate that closed eyes have the highest and openeyes have the lowest value. Similarly, Figure 34shows the average values obtained over a series oftest cycles.
Figure 32 (a) Front and top view of the headband (b)front and backside of the processing module
This system correlates the EEG and EOGsignals to facilitate the interlinking of eye blinks andthe discrimination of alpha and beta waves. In theEEG signal, alpha wave dominance is present whena person is relaxed and beta waves are dominantwhen the person is attentive. Similarly, an assumptionthat a person falling asleep will have a slower eyeblink rate than an attentive or a normal person isalso made. Subsequently, the pace at which the eyesblink is measured, where the difference in pace andwaveform during slow and normal blinks is analyzed.Correlating all these features extracted from EEGand EOG is finally used to estimate the condition ofthe person. [Ramasamy et al., 2013]
Figure 33 AR-PSD values depicting open eyes, normalblinking, closed eyes and slow blinking.
Upon a comparison of the test results of theflexible head band system on a real time drivingsimulator and PVT (Table 7), it was observed thatan increase in the number of hours of sleepdrastically worsened the reaction time of each
Pratyush Rai et al.
58
subject in any given cycle of a PVT test. Similarly,the number of times drowsiness was detected inthe period of the PVT test proves that the flexiblehead band system detects greater drowsiness asthe number of hours of sleep deprivation increased.Therefore, a correlation between the PVT andflexible head band system was derived. Hence, itwas evident that the flexible headband systemequipped a with textile- based nano sensor providedeffective drowsiness and alertness discrimination.It is also evident from the analysis that the numberof times drowsiness was detected increased when
the reaction time of the subject increased.
5.3 Wearable Brain Machine Interface
Wearable nano-biosensor systems can be usedin potential applications for interfacing the humanmind with devices to operate them with thought andother neurological signals as cues. A brain machineinterface (BMI) is a communication system thattranslates human thought into signals to controldevices such as a computer application or aneuroprosthesis [Wolpaw et al., 2002]. A BMIenables the brain to communicate with the external
Figure 34 Cumulative results of (a) Peaks observed during normal blinks, close eye and slow blinks from EOGsignal (b) AR-PSD values during open eye, closed eye, normal blinks and slow blinks from the EEG signal
Condition Observation of Test 1 Test 2 Percentage ofthe test subject drowsiness
calculated
Normal Head band: Number 2409 milli seconds 2397 milli 12%of times drowsiness secondswas detected out of24PVT reaction time
20 hours sleep Head band: Number 12533 milli seconds 14578 milli 54.16%deprived of times drowsiness seconds
was detected outof 24PVT reaction time
28 hours sleep Head band: Number 21675 milli seconds 19654 milli 83.25%deprived of times drowsiness seconds
was detected out of24PVT reaction time
Table 7: Comparison of test results of the flexible head band system and PVT
Nanotextile bio-sensors for Mobile Wireless Wearable Health Monitoring of Neurological and Cardiovascular Disorders
INSTITUTE OF SMART STRUCTURES AND SYSTEMS
INSTITUTE OF SMART STRUCTURES AND SYSTEMS (ISSS JOURNAL OF ISSS
J. ISSS Vol. 1 No. 1, pp. 1-10, Sept 2012. REGULAR PAPER
Journal of ISSS 59
world by deciphering the brain’s activity. Hence,the assisting devices or systems using a BMIimprove the quality of life in disabled people. Inaddition, a BMI has been proposed to replacehumans with robots in the performance ofdangerous tasks like explosives handling/diffusing,hazardous materials handling, firefighting etc.
Previous research projects have demonstratedthe feasibility of a BMI with the invasive methodby implanting intracranial electrodes in the motorcortex of monkeys [Chapin et al., 1999; Wessberget al., 2000; Serruya et al., 2002; Taylor et al.,2002; Nicolelis, 2003]. Though an invasive BMI canuse good quality brain signals, it is expensive andthe implanting surgery may lead to undesirable sideeffects. A noninvasive BMI usingelectroencephalogram (EEG) signals are preferablefor humans. EEG signals represent the electricalactivity of millions of neurons in the brain. EEG hasvarious properties and it can be used as a basis fora BMI: rhythmic brain activity, event-relatedpotentials (EPRs), event-related desynchronization(ERD) and event-related synchronization (ERS)[Bashashati et al., 2007]. Different rhythmic brainactivities are shown depending on the level ofconsciousness. The brain waves are classifiedaccording to the frequency band: Delta (0.5-4 Hz),Theta (4-8 Hz), Alpha (8-13 Hz), Beta (13-30 Hz)and Gamma (30-100 Hz). These rhythms areaffected by different actions and thoughts, forexample, the thinking of movement attenuates orchanges a typical brain rhythm. The fact thatthoughts affect brain rhythms highlight the rhythmicbrain activities that can be used for the BMI.
In general, the implementation of a BMI basedon EEG signals requires the measurement of EEG,preprocessing, feature extraction, classification anddevice control. To measure EEG signals, textilebased nano-biosensor electrodes are placed on theright places, typically according to the international10-20 system. The preprocessing includesamplification, filtration and A/D conversion. In thefeature extraction stage, certain features can beextracted from the preprocessed and digitized EEGsignals in the frequency or time domain. Theextracted features are the input of the classifier.The classifier can calculate the probabilities for theinput belonging to each class. The signals are simplyclassified by threshold detection by the classifier.
The output of the classifier is the input for the devicecontrol. The device control transforms theclassification to a particular action of the device.
The wearable wireless brain-machineinterface, shown in Figure 35, was designed tocontrol a robot wirelessly [Oh et al., 2012;Shyamkumar et al., 2012]. The BMI controls themovement of the robot based on EEG and EOGsignals. The EEG and EOG signals are capturedwith textile based nano-biosensor electrodesattached to a headband at positions across theforehead. This electrode placement is not aconventional placement meant forElectrooculogram (EOG) measurements. It waschosen because the signal response to the left andright movement of the eyes was strong enough touse as a command signal. Classified rhythmic brainwaves are used to control the acceleration anddeceleration or stopping of the robot by setting thethreshold. The classified EOG signals from the leftand right movements of the eye balls control theleft and right direction changes of the robot.
Figure 35 Data flow of the wearable brain machineinterface
The wireless transmitter module consists of ahigh gain biopotential amplifier to enhance the weakmicrovolt scale biopotential signals, a microcontrollerthat performs the analog to digital conversion and aBluetooth module (Figure 36). The power sourceis a 250 mAh poly-lithium battery. The bio-potentialamplifier is a three- stage amplifier with an overallgain of 65.44 dB and a 3dB bandwidth of 1.45Hzto 40 Hz set using active RC and Butterworth filters[Oh et al., 2012; Shyamkumar et al., 2012].
Figure 36 Images of the wearable sensing transmitter:(a) conductive textile electrode sensors on the headband,(b) top view of the wearable sensing transmitter snappedon the headband and (c) snap button male and femalebetween module and the headband
Pratyush Rai et al.
60
The nano-biosensor electrode systemmeasures the differential resting potential of theretina according to eye movements. If the eye ismoved from the center position towards theelectrode, this electrode sees the positive side ofthe retina and the opposite electrode sees thenegative side of the retina. With this measurementmethod, all kinds of the eye movements aremeasured, left/right, up/down and the blinkingmovement. In this BMI system, left/right eyemotion is used to take the decision of a robot turningleft or right, hence, the other up/down and blinkingmotions are considered as noise. Thresholds ofamplitude and time duration are used to removethe blinking and up/down motion. After removingthe undesired eye motion signals, only the left andright waveforms remain. The two waveformsshould be classified as left and right motion to sendturning commands to the robot. The classificationbetween two eye motions is done by investigatingthe polarity of waveforms. Left motion showspositive polarity and right motion shows negativepolarity. Figure 37 shows the classificationprocesses of left/right eye motion. The left and rightmotion signals are filtered with 5~15 Hz bandwidthto achieve sharp waveforms to process further.After filtering, integration is performed to make thesignals smooth. The floor noises are removed bysetting an adaptive amplitude threshold. Theamplitude threshold is defined by 75 % of the peakvalues of the waveforms,. The cleaned waveformsby removing the noise floor are used to decide thecommand signals. As shown in Figure 37(e), finally,the left eye motion is coded to pulse amplitude 1
Figure 37 Classification process of EOG signals; (a) raw left and right EOG signals, (b) integrated signals, (c)filtered signals, (d) noise removed signals and (e) classified signals
and followed by an amplitude 5 pulse. The Righteye motion is coded to the amplitude 5 pulse andfollowed by amplitude 1 pulse.
The Acceleration and deceleration of the robotare controlled by EEG signals. Among several brainwaves, the alpha and beta waves are focusedbecause they represent the mental states ofattention and relaxation respectively. The receivedEEG signals are transformed into the frequencydomain through Fast Fourier Transform (FFT) toinvestigate the brain waves. Each rhythmic brainwave is defined by the frequency band, and themental states can be deduced by considering theamplitude change of the frequency band. To definethe attention and relaxation level, the thresholds areset based on the ratio between the sum of AR powerspectral density (PSD) of alpha and that of betawaves. Instead of taking the sum of AR PSDvalues, taking the peak AR PSD values over thefrequency band was found to be more robust innoisy conditions. In an experiment to validate theEEG feature extraction algorithm, a subject wasasked to be in an attention or relaxation mode bythe experimenter and the calculated attention levelwas compared for accuracy with the actual mentalstates of the subject. The subject was asked to solvea series of quantitative problems to achieve theattentive state. Figure 38 shows the experimentresult. As shown in the result, when the ratio of thepeak PSD values of low beta and alpha was used,the accuracy rate was about 95 %.
Based on EOG and EEG feature extractionand classification algorithms, a whole system was
Nanotextile bio-sensors for Mobile Wireless Wearable Health Monitoring of Neurological and Cardiovascular Disorders
INSTITUTE OF SMART STRUCTURES AND SYSTEMS
INSTITUTE OF SMART STRUCTURES AND SYSTEMS (ISSS JOURNAL OF ISSS
J. ISSS Vol. 1 No. 1, pp. 1-10, Sept 2012. REGULAR PAPER
Journal of ISSS 61
Figure 38 Experiment results of ratio the peak of theAR PSD value of low beta and alpha waves
implemented to control the robot. The speed of therobot was controlled by the attention and relaxationlevel extracted from EEG signals in the straightsection and the changing direction of the robot wascontrolled by the left and right eye motions in thecurved section.
6. Cardiovascular Health Monitoring
It is evident from Table 3 that ECG waveformscan be used in a number of diagnostic criteria thatcover abnormalities in heart function, congenitalconditions, predicting the onset of critical heartattacks (cardiovascular), strokes (cerebrovascular)or the autonomous nervous system.
Coronary heart disease, cardiovasculardiseases and strokes are the leading causes ofmortality in The United States of America as wellas around the world. According to statistics byCenters of Disease Control and Prevention (CDC),cardiovascular or cerebrovascular disease was themost prominent cause of death in the United Statesof America. It was the cause of death in more casesthan cancer, accidental injury, diabetes andinfectious diseases [Go et al., 2013]. Hence, anaverage American is more likely to die of a heartattack or a stroke than of cancer, accidental injury,diabetes or deadly infections such as HIV.
The point- of- care techniques suitable forambulatory or out–of- hospital monitoring are non-invasive electrophysiological techniques:electrocardiogram (ECG) and electrical impedancetomography (EIT). Both techniques measureelectrical activity and the properties of thecardiovascular system for long periods of time todetect abnormalities. In current medical practice,
they are considered preliminary testing techniques.Any abnormalities detected in these tests areconfirmed by in-hospital techniques:Echocardiogram, Cardiac Catheterization,Computed Tomography (CT) scan, MagneticResonance Imaging (MRI).
In the present form, ECG and EIT techniquesuse bulky instrumentation and constrictiveconductive gel electrode based sensor systems thatare not suitable for very long monitoring. Smarttextile technology incorporates a textile-based dryand glueless sensor system in textiles of daily usesuch as vests, brassieres and under garments. Thenanostructured surface of dry textile electrodes,discussed in this study, have improved sensorcontact with the skin to match the performance ofa conductive gel- based sensor system. In the point-of-care system of the future, ECG and EIT willserve as reliable diagnostic and monitoring tools forthe detection of cardiovascular events in preventivemedication and disease management. Incombination with state of the art wirelesstechnology, they will be able to establish a remotecommunication link between patient and doctor fortelemedicine prescriptions and/or quick medicalintervention in the case of an emergency.
6.1 e-Nanoflex: Smartphone Enabled Band aidSensor
This application is a quintessential example ofthe implementation of textile based ECG nano-biosensors that can interface with smartphonetechnology. It has been demonstrated as a band aidnamed e-Nanoflex, which is made of a nano-biosensor with a Bluetooth™ module forcommunication with a smartphone [Varadan et al.,2011].
Hardware System
The e-Nanoflex prototype was designed forthe acquisition of ECG. A pair of nano-biosensorelectrode pads was mounted on a wound dressingplaster to facilitate easy testing. The application wasdemonstrated with an electrode pair made of goldnanowire electrodes on a flexible Titanium foil asreported in [Yoon et al., 2008] and textile-basednano-biosensors described in the section onNanotextured textiles as electronic sensors(Figure 39).
Pratyush Rai et al.
62
The ECG is a differential signal i.e. the signalis perceived as the difference in potential betweentwo points on the skin in which one of the electrodesacts as a reference for the other. An amplifier wasused to enhance the signal strength because thesignal strength of ECG, at the level of the skin, is ofthe order of hundreds of microvolts. The Keyattributes of the amplifier designed were a largecommon mode rejection ratio (CMRR), small inputoffset voltage and low input power consumption.The amplifier is designed in multiple stages. Theinstrumentation amplifier provides the first highimpedance stage with a gain of 10 to avoid theamplifier’s saturation due to an impedancemismatch. Analog filters with a pass band between0.2 Hz and 70 Hz make sure the mismatch is notseen by the later high gain stages. Two more stagesof non-inverting amplifiers are used to improve thesignal quality. The amplified analog signal is thendigitized by the ADC on the microprocessor at afixed sampling rate of 200Hz. The microprocessorthen communicates with the Bluetooth module usingthe Universal Asynchronous Receiver/Transmitter(UART) interface. The Bluetooth modulecontinuously sends the data from themicroprocessor to the data logging unit and thereceived data are then stored or processed by thehost microprocessor of the smartphone. Thisapplication can be extended to a personal computerwith a Bluetooth™ receiver [Led et al., 2013].
The type of connection between Bluetoothdevices, also known as profile, is chosen based onthe kind of data that need to be sent from one deviceto another. For this application, the data are a series
of digits which is the output from themicroprocessor. The Serial Port Profile (SPP) waschosen because it supports the continuoustransmission of data. The module basicallybroadcasts the SPP service, and any Bluetoothdevice, like a phone or a Bluetooth enabled PC thatcomes within range can securely connect to thisdevice on that profile and start receiving the data ifthe correct passkey is entered.
One of the drawbacks of the SPP is that incase the data transmitted are not received by thedata logging device, the data are not retransmittedautomatically. This problem has been considered indetail in [Noueihed et al., 2010]. The additionalretransmit feature has to be implemented in thesoftware to improve the reliability of an SPPconnection. Alternatively, the introduction of aspecial profile for health devices called the HealthDevices Profile (HDP), by the Bluetooth SpecialInterest Group (SIG) is expected to be more robustand suitable for this application than SPP.
ECG signal acquisition
This band aid type e-Nanoflex can be usedfor the measurement of single ECG leads. A LeadI ECG signal obtained from the sensor wasplotted on a Smartphone in real time as shown inFigure 40. The frequency content of ECG isbetween 0.2 Hz and 70 Hz. The sampling rate wasfixed at 200 Hz to satisfy the Nyquist-Shannonsampling theorem. A digital band pass filter with abandwidth of 0.2 Hz to 70 Hz was implemented onthe data logging device to improve the signal to noise
Figure 39 (a) Scanning electron microscope image of vertical gold nanowires (b) Shows the gold nanowire electrodepackaged in a medical plaster
Nanotextile bio-sensors for Mobile Wireless Wearable Health Monitoring of Neurological and Cardiovascular Disorders
INSTITUTE OF SMART STRUCTURES AND SYSTEMS
INSTITUTE OF SMART STRUCTURES AND SYSTEMS (ISSS JOURNAL OF ISSS
J. ISSS Vol. 1 No. 1, pp. 1-10, Sept 2012. REGULAR PAPER
Journal of ISSS 63
the section on Cardiological SignalAbnormalities. The band aid sensor system canbe potentially used for monitoring QT intervaldispersion, which is prevalent in dialysis patientsat risk of SCD. The system is simple to applyand does not interfere with the dialysis set up.Its adaptability to Bluetooth for a smartphone orPC makes it applicable in hospital dialysis as wellas in POC for ambulatory dialysis.
The data from the e-Nanoflex sensors canalso be sent to a remote server through the 3G
ratio. The three limb lead signals were obtainedfrom commercial wet Ag/AgCl electrodes, MooreMedical LLC., and from gold nanowire electrodeas shown in Figure 41. The signals from the twoelectrodes are observably similar.
Band aid type e-Nanoflex can be placed atdifferent positions relative to the heart to get differentperspectives of the heart (Figure 42). Differentpositions enhance individual components of the ECGwaveform, thus making each position relevant tothe diagnosis of ECG abnormalities mentioned in
Figure 41 Three limb lead ECG acquired from e-Nanoflex sensor using(a) Commercial Ag/AgCl electrode (b) Gold Nanowire Electrode
Figure 40 Shows Lead I ECG datadisplayed in real time on a Smartphone
Figure 42 Different positions of band aid type e-Nanoflex and the ECG signal associated with it.
Pratyush Rai et al.
64
network. The data were tagged with the currentGPS location and the time. In the case of anemergency, a message with recorded data, currentlocation and time can be sent to the emergencyresponse team. The snapshot in Figure 43 showsthe location of the user and also the data receivedfrom the sensor as recovered from the server.
6.2 e-Vests
The textile integrated sensor systemsdescribed in the previous sections are sensorelements that are inlaid between two layers of fabricor the fabric itself is functionalized to act as a sensor.The textile platform in this application is an innervest that can incorporate nano-biosensors such asa gold nanowire electrode [Yoon et al.,2008 ] or ananostructured textile electrode [Reneker et al.,1996], or composite piezoelectric films [Laukhinaet al., 2010; Castellanos et al., 2008]. It can alsoincorporate an infrared emitter-detection system forplethysmography and temperature sensors. The e-vest system is an implementation of a multichannelwearable wireless textile based nano-biosensor thatmonitors ECG and blood pressure.
System Description
Figure 44 shows the overall system whichconsists of four components. Firstly, a compressioninner vest referred to as an e-vest, with textileelectrode sensors and printed connection traces thatconnect the electrodes to a sensor electronicsmodule (SEM). Secondly, there is aphotoplethysmography arm band that has Near IRLEDs and photodiodes, which are connected to theSEM through conductive traces printed from theleft arm. Thirdly, an SEM that consists of anamplifier and filter circuits, a microcontroller and a
ZigBee wireless radio module. Lastly, a softwareprogram runs on a PC, which receives and plotsincoming data from the person wearing it.
The photoplethysmography arm bandconsists of two arrays of Near IR Photodiodesand a central array of three photodiodes. Thisassembly was described in detail in [Rai et al.,2012]. The electrodes and the arm band areconnected to the SEM through conductive tracesprinted on the vest. The conductive traces weremade using conductive inks. The arm band isremovable and simply snaps on to the vest throughfour snap buttons (Figure 45).
Figure 43 Snapshot of ECG data stored from the userand the corresponding location from where the data wassent.
Figure 44 schematic showing overall system foracquisition of ECG through e-vest
Figure 45 e-vest and the photoplethysmography armband
The inks were formulated with conductivesilver nanoparticle fillers in an elastic acrylic- basedbinder. The snap buttons were used for connectionsbetween the e-vest, the arm band, and the SEMafter wearing the e-vest without any assistance.Screen printing, which is textile manufacturingcompatible, was used to transfer the ink tracesfollowing the desired pattern for the conductiveconnecting traces. The removable SEM and armband makes the e-vest washable.
Sensor Electronics Module (SEM)
The amplifier which is a part of the SEMconsists of 4 channels. Three channels are for thebipolar limb leads- Lead I, Lead II and Lead III.
Nanotextile bio-sensors for Mobile Wireless Wearable Health Monitoring of Neurological and Cardiovascular Disorders
INSTITUTE OF SMART STRUCTURES AND SYSTEMS
INSTITUTE OF SMART STRUCTURES AND SYSTEMS (ISSS JOURNAL OF ISSS
J. ISSS Vol. 1 No. 1, pp. 1-10, Sept 2012. REGULAR PAPER
Journal of ISSS 65
The fourth channel amplifies the potential differenceacross the photodiode which detects the reflectedIR waves from the brachial artery. The amplifiersused in the SEM had a pass band of 0.2Hz to 70Hzand a mid- band gain of 50 dB for the three ECGchannels. The gain was increased to 55dB for thephotoplethysmography sensors for a band of 0.2Hzto 15Hz. The amplified signals from the amplifierare digitized using the onboard microcontroller fortransmission (Figure 46).
threads. Figure 48 shows a picture of the e-bra, theeNanoflex module used for data acquisition andwireless transmission, and the simple signal displayinterface that plots the data received from theeNanoflex module.
Figure 46 (a) Schematic of the SEM (b) actual SEMused in e-vest system.
The choice of a ZigBee radio module wasmotivated because of two desired functions. First,it has to support data rates higher than 9600 bps,because 4 channels of digitized ECG and BP signalshave to be transmitted in real-time. Second, itprovides communication ranges as high as possiblefor applications in sports, military expeditions andhigh risk work environments such as fire fighting(Figure 47).
Figure 47 (a) subject wearing military fatigues (b) e-vest with arm band worn under the military fatigues.
6.3 e-Bras
The systems incorporated in the inner vestsfor men can also be integrated in inner garmentsfor women such as a brassiere. The various sensorslisted in the previous section can be incorporated inthe e-bra and the signals from the sensors broughtto the eNanoflex [Varadan et al., 2011] modulethrough printed conductive traces or conductive
Figure 48 Shows the e-bra worn by one of the testsubjects, the eNanoflex module and the Smartphonedisplay interface
Multichannel data acquired
The data acquired by the e-vest can betransmitted wirelessly to a PC. The data receivedby the PC is then filtered using an adaptive filteralgorithm to minimize the effect of motion on theECG signal baseline [Kwon et al., 2013]. The dataacquisition and adaptive filter was developed usingMATLAB (Mathworks, Natick, MA). However,the same can be achieved on a JAVA platform andcan be deployed on a smartphone. Figure 49(a)shows the original 3 ECG signals Lead I, Lead II,and Lead III. It also plots the pulse waveform, the
Figure 49 (a) Real-time data plotted on the laptop (b) thee-vest worn by the test subject (c) the e-bra worn by thetest subject.
Figure 50 Simultaneous plot of ECG Lead II and Pulsewave depicting the derivation of PTT
Pratyush Rai et al.
66
heart rate, and the estimated systolic and diastolicblood pressure. 49 (b) shows the actual e-vest, armband and SEM module. The derived pulse transittime PTT values (Figure 50) are then used toestimate the systolic and diastolic blood pressurevalues based on the calibration equations previouslyobtained in [Rai et al., 2012]. Other sensor systemscan be incorporated to develop wearableapplications to monitor respiration, temperature andthe blood oxygen level.
sequence formed by concatenating the differencein heart rate between consecutive beats (Figure 51).It is calculated as the inverse of the difference inthe intervals between consecutive R-peaks. The Rpeak detection algorithm used for the calculationof the RR interval (RRI) was as given in [Pan etal., 1985]. An Autoregressive (AR) powerspectrum estimation technique was used to obtainthe power spectrum density (PSD) plot of the RRIsequence. The characteristic LF and HF peaks wereobserved [Malik et al., 1996]. Figure 52 shows aplot of the RR interval series plotted against beatsand the AR PSD computed from the RRI seriesfor the standing-up case. Figure 53 shows the samefor supine ECG. AR PSDs in both figures show aclassic shift in the power distribution between LFand HF components with respect to total power.Thus, these implementations of e-vest and e-brasystems can be used for the tracking of chronicconditions related to autonomous nervous regulationof cardiac activity.
Figure 51 R-R interval calculations from ECG.
The Post processing of ECG can also calculateheart rate variability (HRV), which is a prognosticand diagnostic tool. HRV is described as the
Figure 52 (a) Plot of the RR interval series against beat number (b) Plot of the AR PSD computed from the RRIseries for the Standing case.
Figure 53 (a) Plot of the RR interval series against beat number (b) Plot of the AR PSD computed from the RRIseries for supine position.
Nanotextile bio-sensors for Mobile Wireless Wearable Health Monitoring of Neurological and Cardiovascular Disorders
INSTITUTE OF SMART STRUCTURES AND SYSTEMS
INSTITUTE OF SMART STRUCTURES AND SYSTEMS (ISSS JOURNAL OF ISSS
J. ISSS Vol. 1 No. 1, pp. 1-10, Sept 2012. REGULAR PAPER
Journal of ISSS 67
Continuous multiple lead ECG monitoring canbe used for the detection of T-wave inversion, whichis indicative of a change in ventricular repolarizationas mentioned previously in the section onCardiological Signal Abnormalities. Theautomated post processing of ECG by an algorithmfor the detection of T wave inversion can serve asan alarm system that will trigger a subroutine toinitiate ECG signal relay through a remote serverto a doctor’s office for a diagnosis.
7. Biofeedback System for Therapeutics
Since its introduction, smart wearable systemshave been associated more with health monitoringthan with therapeutics. These systems are, bynature, dependent on biometric inputs for analysisand response, and primarily inform of audio-visualcues and/or suggestions. So, while the systemsdescribed previously could only suggest medicationor initiate medical intervention by doctors in remotelocations, there have been proof-of-concept studiesdone to show that these systems can be of help ininitiating audio-visual stimuli upon getting certainbiosignals recorded by nanotextile biosensors. Suchan automated system with a decision algorithm canbe used to help control and/or cure the underlyingmedical condition. In this section, such systems havebeen described that can be used for therapeuticsbased on the biofeedback received by the sensorson board.
7.1 Music based Therapy
Music-based therapy has gained a lot of
attention due to recent findings in the field ofneuromusicology and music cognition. Music canevoke emotions through autonomic correlates thathave been shown to cause a significant modulationof parameters like heart rate and blood pressure.Consequently, Heart Rate Variability (HRV)analysis can be a powerful tool to explore evidence-based therapeutic functions of music, and conductempirical studies on the effect of musical emotionon heart function [Koelsch et al., 2005; Khalfa etal., 2002]. The HRV can be used to determine theautonomic nervous system activity. [Zhou et al.,2010] Autonomic responses are known to varyaccording to the reports of valence (positive ornegative) and arousal/intensity, which areconsidered as two dimensions of emotion [Lang etal., 1998] including musical emotions [North et al.,1997]. These emotions, in turn, have been shownto have strong autonomic correlates that regulateblood pressure and heart rate in the listener[Bernardi et al., 2009]. Although the initial resultsare promising, much research is needed tounderstand the autonomic nervous system activityinvolved in musically induced emotions, the variationsin brain processes with variations in the intensityand valence of the emotions experienced.
A Few studies have been performed toexamine the brain process of emotions induced viaan auditory domain stimulus like music. Figure 54shows some preliminary EEG measurements afterthe application of an auditory stimulus in the formof happy and sad music. While listening to both
Figure 54 EEG measurements after application of auditory stimulus in the form of happy and sad music (Raga),with eyes closed rest condition as reference.
Pratyush Rai et al.
68
happy and sad music, there was an increase in Alphawave power in the right hemisphere of the brain.There was also an increase in Delta, Theta andGamma waves, but the extent of increase wasgreater during the happy music condition than inthe sad music condition.
The textile- based nano-biosensor system forECG monitoring, such as the e-vest and e-bra, canbe used for recording ECG while listening to music.The plots in Figure 54 show the periodogram of theHRV signals for each type of music that was playedduring the recording. ECG data for two minutes,and one minute after the application of the stimulusmusic were used for a HRV analysis. The HRVanalysis performed on this data shows that theemotion elicited by the type of music playing canmodulate the autonomic regulation of the heart rate.A similar approach can be taken for EEG monitoringnanotextile biosensors. Music- based biofeedbacktherapy can be a potential treatment method toimprove sensorimotor, language and cognitivedomains of functioning via music. It can beespecially helpful in invoking neuroplasticity for therehabilitation of TBI patients. [Hegde, 2014]
7.2 Neural Activity based BiofeedbackTherapy for Autism Spectrum Disorder
Autism Spectrum Disorder (ASD) coversneurological disorders that involve impededdevelopment of social behavior, and the acquisitionof skills and language development. All theseactivities require the ability of mimicry by which
children imitate and learn the appropriate forms ofthe aforementioned attributes. The ability to mimicis associated with a class of neurons called themirror neurons found in the insula and anteriorcingulate cortex of the brain, which are responsiblefor the interpretation of complex human intentions.The functioning of these neurons can be observedby monitoring Mu waves in those regions using EEG.Mu waves are synchronized patterns of electricalactivity involving large numbers of neurons in thepart of the brain that controls voluntary functions.In normal subjects, the Mu waves are suppressedwhen the voluntary function has been executed,whereas in ASD subjects, the suppression does nothappen because no function was executed.
Conventional EEG measurement systems usegel based gold cup electrodes, attached to the scalpwith adhesive. It is obtrusive and the wires stickingout of the electrodes to signal acquisition systemsmake them impractical for use in sensitive subjectslike infants and children with ASD. Alternatively,nanotextile biosensors can be incorporated with askull cap and baseball cap that are commonly usedfor infants and children. Textile based multi-electrode EEG, EOG and EMG monitoring systemswith embedded electronics for data acquisition andwireless transmission can be seamlessly integratedinto these items for the continuous detection of Muwaves (Figure 55). Textile electrodes at positionsC3, CZ, C4 according to the 10-20 internationalsystem can detect Mu waves. The textile- basedsystem is ergonomic and can enable early diagnosis
Figure 55 Shows the Periodogram of the HRV and High Frequency/Low Frequency power ration for ECG data for(a) No Music (b) Peppy (c) Happy (d) Sad Music
Nanotextile bio-sensors for Mobile Wireless Wearable Health Monitoring of Neurological and Cardiovascular Disorders
INSTITUTE OF SMART STRUCTURES AND SYSTEMS
INSTITUTE OF SMART STRUCTURES AND SYSTEMS (ISSS JOURNAL OF ISSS
J. ISSS Vol. 1 No. 1, pp. 1-10, Sept 2012. REGULAR PAPER
Journal of ISSS 69
in infants and planning therapy for ASD patients.[Sahi et al., 2013]
Biofeedback can be used for therapeuticpurposes for Autism Spectrum Disorder (ASD) byoperant conditioning. By giving stimuli in the formof repetitive audio/visual cues to emulate a voluntaryfunction (waving hand, saying hello, and open –closefist) and monitoring the change in Mu waveintensity, the system can condition the subject. Theaudio-visual loop can be controlled by the embeddedlogic that breaks the loop only upon detecting Muwave occurrence and suppression, after which itwill choose another cue from the audio-visual libraryon the system. This system can help in ASDdiagnostics by monitoring Mu waves for detectinganomalies in the brain wave patterns of mirrorneurons [Ramachandran et al., 2006]. Theautomated system can be used at home underparental guidance, while keeping the therapistupdated at remote locations through the internet
8. Conclusions
Wearable textile- based nano-biosensorsystems with mobile platforms are a new class ofunobtrusive continuous health monitoring withsignificant benefits for neurological andcardiovascular patients or high risk patients. Thebasic science behind the functioning of textile- basednano-biosensors show that there is a better flow ofsignal i.e. electrical current through the skin-
electrode interface than through the silver-silverchloride gel electrode. The bioelectromagneticprinciples of the origin and propagation of bioelectricsignals i.e. EEG, EOG, EMG and ECG show thatthe measured electric potential is representative ofthe cumulative electrical activity of the sources ofthese signals, i.e. the neurons of brain tissue andthe myocytes of heart tissue. This means that thetextile- based nano-biosensors can measurebioelectric signals better than the silver-silverchloride gel electrode. The dry electrodes can beused for long term monitoring because they do notface the problem of the drying of the gel and theyare reusable in the form of a wearable garment.The textile- based wearable nano-biosensorsystems discussed in this review can measureneurological signals and identify anomalies for thediagnosis of targeted neurological andcardiovascular disorders. These disorders rangefrom chronic conditions to safety to rehabilitationand an improved quality of life. Thebioelectromagnetism principles of neural and cardiacbioelectric signals and the performance of textile-based nano-biosensors provides a uniqueperspective on the development of novel wearablesystems that harness the potential of textile basednano-biosensors and wireless platforms forunderstanding the neural and cardiac function inand out of hospital setting in unprecedented detail.The sensor systems can be used for the diagnosticsand therapeutics of neurological disorders such asautistic spectrum disorder, traumatic brain injury(TBI), and neuroprosthetics. They can be used forhighly specialized cardiac monitoring such as vectorcardiography (VCG), impedance cardiography(ICG) or tomography, tumor detection, and theprevention of sudden cardiac death by the detectionof T-wave alternans.
Acknowledgments
One of the authors, Vijay K. Varadan wouldlike to extend his gratitude to 289 Dr. Vasudev K.Aatre for his constant and continuing support,encouragement, and mentorship 290 during thecourse of his research work in acoustics,electromagnetics, smart materials and sys- 291tems, and health care. This research was conductedwith the endowment for smart textiles for 292 healthcare, from Global Institute for Nanotechnology inEngineering and Medicine Inc., 700 293 ResearchCenter Blvd., Fayetteville, AR 72701.
Figure 55 EEG, EOG and EMG are acquired on the skinthrough conductive textile electrodes. The acquisitionof EEG through the hair on the head was made possibleby using nano- structured conductive electrode withlong pillars of conductive textile to serve this purpose.
Pratyush Rai et al.
70
References:
Aarts, E., Marzano, S., “The New Everyday-Visions onAmbient Intelligence,” 101 Publishers, Rotterdam,The Netherlands. (2003)
Alzadi, A., Zhang, L., Bajwa, H., “Smart Textile BasedWireless ECG System,” Proc. IEEE Systems,Applications and Technology Conference (LISAT)2012, pp. 1-5. (2012)
Barhate, R.S., Ramakrishna, S., “Nanofibrous filteringmedia: Filtration problems and solutions from tinymaterials,” J. Membrane Science, Vol. 296, pp. 1-8.(2007)
Bashashati. A, Fatourechi. M, Ward. R.K, Birch. G.E, “Asurvey of signal processing algorithms in brain-computer interfaces based on electrical brainsignals,” J. Neural Eng., vol. 4, pp. 32-57, 2007.
Bergey, G.E., Squires, R.D., Sipple, W.C.,“Electrocardiogram Recording with PastelessElectrodes,” IEEE Transactions on Bio-medicalEngineering, Vol, BME-18 (3), pp. 206-211. (1971)
Brevnov, D.A., “Electrodeposition of Porous Silver Filmson Blanket and Patterned Aluminum-Copper Films,”L. Electrochem. Soc., Vol. 153 (4), pp. C249-C253.(2006)
Brosche, T.A.M., “EKG Handbook,” Jones and Bartlett,Sudbury, M.A., Section 10, pp.87-98. (2010)
Castellanos, J; Navas-Gonzalez, R; Ochoteco, E; Vidal-Verdu, F; , “Evaluation of a low cost piezorresistivematerial for high resolution tactile sensors,”Integration Issues of Miniaturized Systems - MOMS,MOEMS, ICS and Electronic Components (SSI),2008 2nd European Conference & Exhibition on ,vol., no., pp.1-3, 9-10 April 2008.
Catrysse, M., “Wireless power and data transmissionfor implantable and wearable monitoing systems,”PhD Thesis, K. U. Leuven. (2004)
CDC, “10 Leading Causes of Death by Age Group, UnitedStates 2005-2010,” National Vital Statistics System,National Centre for Health Statistics, Centres forDisease Control (CDC). (2005-2010)
CDC, National Center for Chronic Disease Preventionand Health Promotion, “Chronic Disease Preventionand Health Promotion,” http://www.cdc.gov/chronicdisease/index.htm (2013)
Chapin. J, Moxon. K, Markowitz. R, Nicolelis. M, “Real-time control of a robot arm using simultaneouslyrecorded neurons in the motor cortex,” NatureNeurosci., vol. 2, pp. 664–670, 1999.
Chow T, Kereiakes DJ, Bartone C, Booth T, Schloss EJ,Waller T, Chung ES, Menon S, Nallamothu BK, ChanPS. “Prognostic utility of microvolt T-wavealternans in risk stratification of patients withischemic cardiomyopathy.”, J Am Coll Cardiol. 2006May 2;47(9):1820-7.
Clemens, F., et al., “Computing Fibers: A Novel Fiber forIntelligent Fabrics?” Advanced EngineeringMaterials, Vol. 5 (9), pp. 692-687. (2003)
Coosemans, J., Hermans, B., Peurs, R., “Integratingwireless ECG in textiles,” Sensors and Actuators A,130-131, 48-53 (2006).
Cox V, Patel M, Kim J, Liu T, Sivaraman G, NarayanSM.,”Predicting arrhythmia-free survival usingspectral and modified-moving average analyses ofT-wave alternans.”, Pacing Clin Electrophysiol. 2007Mar;30(3):352-8.
D. Marculescu, R. Marculescu, N.H. Zamora, P.S. Marbell,P.K. Khosla, S. Park, S. Jayaraman, S. Jung, C.Lauterbach, W. Weber, T. Kirstein, D. Cottet, J. Grzyb,G. Troster, M. Jones, T. Martin, Z. Nakad, “ElectronicTextile: A Platform for Pervasive Computing,” Proc.of IEEE, Vol. 91 (12), pp.1995-2018. (2003)
de la Maisonneuve, C., Martins, J.O., “Public spendingon health and long-term care: a new set ofprojections,” OECD Economic Policy Papers, no. 6.(2013) http://www.oecd.org/economy/public-
Nanotextile bio-sensors for Mobile Wireless Wearable Health Monitoring of Neurological and Cardiovascular Disorders
INSTITUTE OF SMART STRUCTURES AND SYSTEMS
INSTITUTE OF SMART STRUCTURES AND SYSTEMS (ISSS JOURNAL OF ISSS
J. ISSS Vol. 1 No. 1, pp. 1-10, Sept 2012. REGULAR PAPER
Journal of ISSS 71
spending-on-health-and-long-term-care.htm
De Rossi, D., Carpi, F., Lorussi, F., Mazzoldi, A., Paradiso,R., Scilingo, E.P., Tognetti, A., “Electroactive Fabricsand Washable Biomonitoring Devices,” AUTEXResearch Journal, Vol. 3(4), pp. 180-185. (2003)
Dhawan, A., Muth, J., F., Kekas, D., J., Ghosh, T., K.,“Optical nano-textile sensors based on theincorporation of semiconducting andmetallic nanoparticles into optical fibers,”Smart Nanotextiles. Symposium (MaterialsResearch Society Symposium Proceedings, 920, 121-126. (2006)
Eckart RE, Scoville SL, Campbell CL, Shry EA, StajduharKC, Potter RN, Pearse LA, Virmani R., “Sudden deathin young adults: a 25-year review of autopsies inmilitary recruits.”, Ann Intern Med. 2004 Dec7;141(11):829-34.
European Transport Safety Council, “The Role of DriverFatigue in Commercial Road Transport Crashes”,2001
Fine, E.J., Ionita, C.C., Lohr, L., “The history of thedevelopment of the cerebellar examination,”Seminars in Neurology, Vol. 22 (4), pp. 375-384. (2002)
Flemons. W, Douglas. J, Kuna. T, Rodenstein. O,Wheatley. J, “Access to diagnosis and treatment ofpatients with suspected sleep apnea,” AmericanJournal of Respiratory Care Medicine, vol. 169(2),pp. 668-672, 2004.
Garcia, T.B., Holtz, N.E., “12-lead ECG: The art ofinterpretation,” Jones and Bartlett, Sudbury, M.A.(2001)
Gehi AK, Stein RH, Metz LD, Gomes J. “Microvolt T-Wave Alternans for the Risk Stratification ofVentricular Tachyarrhythmic Events: A Meta-Analysis.” J Am Coll Cardiol. 2005;46(1):75-82.
Geselowitz D.B. “Dipole theory in Electrocardiography.”,Am. J . Cardiol. 1964 Sep; 14:301-6. (1964)
Gimpel, S., et.al., “Textile-based Electronics SubstrateTechnology,” Journal of Industrial Textiles, Vol.33(3), pp. 179-189. (2004)
Go A.S, Mozaffarian D, Roger VL, Benjamin EJ, Berry JD,Borden WB, Bravata DM, Dai S, Ford ES, Fox CS,Franco S, Fullerton HJ, Gillespie C, Hailpern SM,Heit JA, Howard VJ, Huffman MD, Kissela BM,Kittner SJ, Lackland DT, Lichtman JH, Lisabeth LD,
Magid D, Marcus GM, Marelli A, Matchar DB,McGuire DK, Mohler ER, Moy CS, Mussolino ME,Nichol G, Paynter NP, Schreiner PJ, Sorlie PD, SteinJ, Turan TN, Virani SS, Wong ND, Woo D, TurnerMB; American Heart Association StatisticsCommittee and Stroke StatisticsSubcommittee.”Heart disease and stroke statistics—2013 update: a report from the American HeartAssociation.”,Circulation. 2013 Jan 1;127(1):e6-e245.
Gray, H., “Anatomy of the Human Body,” 40th Ed.,Churchill Livingstone, Elsevier. (2008) ISBN 978-0-443-06684-9
H. Jorg, “My Heart,” European Community 6thFramework Programme, 2003-2008.www.cordis.europa.eu
Hegde, S., “Music based cognitive remediation therapyfor patients with traumatic brain injury,” Frontiers inNeurology, Vol. 5 (34), (2014)
Herzog CA, Mangrum JM, Passman R.,”Sudden cardiacdeath and dialysis patients”, Semin Dial. 2008 Jul-Aug;21(4):300-7.
Holder D.S, “Electrical Impedance Tomography:Methods, History and Applications,”, Institute ofPhysics, Series in medical Physics and BiomedicalEngineering, London. (2005)
Holme, I., “Nanotechnologies for Textiles, Clothing, andFootwear,” Textile Magazine, Vol. 32 (1), pp. 7-11.(2005)
Huang. J; Wang. L; Chen. L; Zhang YT; , “A low powerwearable transceiver for human bodycommunication,” Engineering in Medicine andBiology Society, 2009. EMBC 2009. AnnualInternational Conference of the IEEE , vol., no.,pp.3802-3805, 3-6 Sept. 2009.
Iber, S. Ancoli-Israel, A. Chesson, S. Quan, “The AASMManual for the Scoring of Sleep and AssociatedEvents: Rules, Terminology, and TechnicalSpecifications,” Amer. Acad. Sleep Med,Westchester, IL, 2007.
Jahrsdeorfer, M., Guiliano, K., Stephens, D., “Clinicalusefulness of the EASI 12-lead continuouselectrocardiographic monitoring system,” CriticalCare Nurse, Vol. 25(5), pp. 28-37. (2005)
Jap BT, Lal. S, Fischer. P, Bekiaris. E, “Using EEG spectralcomponents to assess algorithms for detectingfatigue”, Expert Systems with Applications Vol.36
Pratyush Rai et al.
72
Issue 2, pp. 2352-2359, 2009
Jiang, S.Q., Newton, E., Yuen, C.W.M., Kan, C.W.,“Chemical Silver Plating on Cotton and PolyesterFabrics and its Application on Fabric Design,” TextileResearch Journal, Vol. 76 (1), pp. 57-65. (2006)
Khalfa, S., Isabelle, P., Jean-Pierre, B., Manon, R. “Event-related skin conductance responses to musicalemotions in humans.” Neurosci Lett, 328(2), 145-149(2002).
Khan. G. M, “Rapid ECG Interpretation”, Humana Press;3rd edition (2007), p25-297.
Khosla, A., “Smart garments in chronic diseasemanagement: progress and challenges,” Proc. SPIEVol. 8548, Nanosystems in Engineering and Medicine,85482O. (2012)
Klingenheben T, Zabel M, D’Agostino RB, Cohen RJ,Hohnloser SH.”Predictive value of T-wave alternansfor arrhythmic events in patients with congestiveheart failure.”,Lancet. 2000 Aug 19;356(9230):651-2.
Koelsch, S., Siebel, W. A., “Towards a neural basis ofmusic perception.” Trends Cogn Sci, 9(12), 578-584(2005).
Kwon, H., Oh, S., Varadan, V.K., “Motion artifact removalalgorithm by ICA for e-bra: a women ECGmeasurement system,” Proc. SPIE 8691, Nano- Bio-and Info_tech Sensors and Systems 2013, 86910A.(2013)
Lang, P. J., Bradley, M. M., Cuthbert, B. N., “Emotionand motivation: measuring affective perception.” JClin Neurophysiol, 15(5), 397-408(1998).
Laukhina, E.; Pfattner, R.; Mas-Torrent, M.; Rovira, C.;Veciana, J.; Laukhin, V.; , “Flexible Film-BasedSensors Structured with a High PiezoresistiveOrganic Molecular Conductor as an ActiveComponent,” Sensor Device Technologies andApplications (SENSORDEVICES), 2010 FirstInternational Conference on , vol., no., pp.4-9, 18-25July 2010
Led, S., Martinez-Espronceda, M., Redondo, J., Baquero,A., Serrano, L., Cabezas, L., Niegowski, M.,“Wearable electrocardiogram (ECG) recorder for aMobile Point-of-Care based on recent
Lee RG; Chen KC; Hsiao CC; Tseng CL; , “A MobileCare System With Alert Mechanism,” InformationTechnology in Biomedicine, IEEE Transactions on ,vol.11, no.5, pp.507-517, Sept. 2007
Lee, Y., D., Chung, W., Y., “Wireless sensor network basedwearable smart shirt for ubiquitous health andactivity monitoring,” Sensors and Actuators B, 140,390-395 (2009).
Lim, Z., H., Chia, Z., X., Kevin, M., Wong, A., S., W., Ho,G., W., “A facile approach towards ZnO nanorodsconductive textile for room temperaturemultifunctional sensors,” Sensors and Actuators B:Chemical, 151 (1), 121-126. (2010)
Lin CT; Wu RC, “EEG-based drowsiness estimation forsafety driving using independent componentanalysis”, Circuits and Systems I: Regular Papers,Vol. 52, Issue 12, pp. 2726 - 2738, Dec. 2005
Locher, I., Klemm, M., Kirstein, T., Troster, G., “Designand Characterization of Purely Textile PatchAntennas,” Vol. 29 (4), pp. 777-788. (2006)
M. Ramasamy, S. Oh, V. K. Varadan and RobertHarbaugh2,3 “Textile based Nanosensors andWireless Mobile Communication Platform for RealTime Driver Alertness Monitoring” SmartNanosystems in Engineering and Medicine Vol 2,Issue 2, May, 2013.
Maeda S, Nishizaki M, Yamawake N, Ashikaga T, ShimadaH, Asano M, Ihara K, Murai T, Suzuki H, Fujii H,Sakurada H, Hiraoka M, Isobe M.”Ambulatory ECG-based T-wave alternans and heart rate turbulencepredict high risk of arrhythmic events in patientswith old myocardial infarction.”,Circ J. 2009Dec;73(12):2223-8.
Maharani, D., K., Kartini, I., Aprilita, N., H., “Nanosilica-Chitosan Composite Coating on Cotton Fabrics,”Third Nanoscience and NanotechnologySymposium 2010, 1284, 87-91. (2010)
Malik. M, Bigger. J.B, Camm. A.J, Kleiger.R.E, Malliani.A, Moss.A.J, Schwartz.P.J,”Heart rate variability:Standards of measurement, physiologicalinterpretation, and clinical use” Eur Heart J (1996)17 (3): 354-381
Nanotextile bio-sensors for Mobile Wireless Wearable Health Monitoring of Neurological and Cardiovascular Disorders
INSTITUTE OF SMART STRUCTURES AND SYSTEMS
INSTITUTE OF SMART STRUCTURES AND SYSTEMS (ISSS JOURNAL OF ISSS
J. ISSS Vol. 1 No. 1, pp. 1-10, Sept 2012. REGULAR PAPER
Journal of ISSS 73
Malmivuo, J., Plonsey, R., “Bioelectromagnetism:Principles and Applications of Bioelectric andBiomagnetic Fields,” Chapter 2, Oxford UniversityPress, New York. (1995) ISBN 0-19-505823-2
Mazzoldi, A., De Rossi, D., Lorussi, F., Scilingo, E.P., andParadiso, R., “Smart Textiles for Washable MotionCapture Systems,” AUTEX Research Journal, Vol.2(4), pp. 199-203. (2002)
Merchant FM, Ikeda T, Pedretti RF, Salerno-Uriarte JA,Chow T, Chan PS, Bartone C, Hohnloser SH, CohenRJ, Armoundas AA.”Clinical utility of microvolt T-wave alternans testing in identifying patients at highor low risk of sudden cardiac death.” Heart Rhythm.2012 Aug;9(8):1256-64.e2.
Naik, A., “Future impact of nanotechnology in textileresearch,” Proc. II Int. Symposium in TextileEngineering Natal Brazil, pp. 7-11. (2004)
Neale, V. L., Dingus, T. A., Klauer, S.G., Sudweeks, J.,Goodman, M., “An Overview of the 100-CarNaturalistic Study and Findings,” ESV Paper 05-0400,June 2005.
Nicolelis. M, “Brain-machine interfaces to restore motorfunction and probe neural circuits,” Nature Rev.Neurosci., vol. 4, pp. 417–422, 2003.
Niedermeyer E., da Silva F.L. (2004).Electroencephalography: Basic Principles, ClinicalApplications, and Related Fields. Lippincot Williams& Wilkins. ISBN 0-7817-5126-8
Nilson. T, Nelson T.M, Carlson D., “Development ofFatigue Symptoms During Simulated Driving”,Accidents Analysis &Prevention Vol. 29, No 4. pp.479-488.1997
North, A. C., Hargreaves, D. J., “Liking, arousal potential,and the emotions expressed by music.” Scand JPsychol, 38(1), 45-53(1997).
Noueihed. J, Diemer. R, Chakraborty. S, Biala. S,“Comparing Bluetooth HDP and SPP for MobileHealth Devices,” Body Sensor Networks (BSN), 2010International Conference on , vol., no., pp.222-227,7-9 June 2010
Oh, T.I., Yoon, S., Kim, T.E., Wi, H., Kim, K.J., Woo, E.J.,
Sadleir, R.J., “Nanofiber Web Textile Dry Electrodesfor Long-Term Biopotential Recording,” IEEE Trans.Biomedical, Circuits and Systems, Vol. 7(2), pp. 204-211. (2013)
Oh. S, Kumar. P.S, Kwon. H, Varadan.V.K, “Wireless brain-machine interface using EEG and EOG: brain waveclassification and robot control,” SPIE Proceedings,vol. 8344, 2012.
Pacelli, M., Caldani, L., Paradiso, R., “TextilePiezoresistive Sensors for Biomechanical VariablesMonitoring,” Proc. 28th Ann. Int. Conf. IEEE EMBS2006, pp. 5358-5361. (2006)
Pantelopoulos, A., Bourbakis, N., “A survey on wearablebiosensor systems for health monitoring,”30thAnnual Int. Conf. of the IEEE, EMBS 2008, pp. 4887-4890. (2008)
Pantelopoulos. A, Bourbakis N. G., “A Survey on WearableSensor-Based Systems for Health Monitoring andPrognosis.”, IEEE Transactions on Systems Manand Cybernetics—part c: applications and reviews,40(1), (2010)
Park, S, Gopalsamy, C., Rajamanickam, R., Jayaraman, S.,“The Wearable MotherboardTM : An InformationInfrastructure or Sensate Liner for MedicalApplications,” Studies in Health Technology andInformatics, IOS Press, Vol. 62, pp. 252-258. (1999)
Park, S., Jayaraman, S., “Wearable Biomedical Systems:Research to Reality,” Proc. IEEE Int. Conf. PortableInformation Devices PORTABLE07, pp. 1-7. (2007)
Post, E.R, Orth, M., “Smart Fabric, or WashableComputing,” Proc. IEEE Int. Symposium on WearableComputers, Cambridge (MA), USA, Oct. 1997, pp.167-168. (1997)
Pun PH, Horton JR, Middleton JP.,”Dialysate calciumconcentration and the risk of sudden cardiac arrestin hemodialysis patients.”, Clin J Am Soc Nephrol.2013 May;8(5):797-803.
Rai, P., “Hybrid Nanostructured Textile Bioelectrode forunobtrusive health monitoring,” DoctoralDissertation, University of Arkansas, ProQuest , UMIDissertations Publishing, ISBN 9781303276231.(2013)
Varadan, V.K., Agarwal, M.P., “Smart healthcaretextile sensor system for unhindered-pervasivehealth monitoring,” SPIE Smart Structures+NDE,Nano., Bio. & Info-Tech. Sensors and Systems 2012,Vol. 8344, 83440E. (2012)
Ramachandran, V.S., Oberman, L.M., “Broken Mirrors ATheory of Autism,” Scientific American, November2006, pp. 63-69. (2006)
Ranney, T. et al. “NHTSA Driver Distraction Research:Past, Present and Future”, Driver Distraction InternetForum, 2000.
Rattfalt, L.; Chedid, M.; Hult, P.; Linden, M.; Ask, P.,“Electrical Properties of Textile Electrodes,”Engineering in Medicine and Biology Society, 2007.EMBS 2007. 29th Annual International Conferenceof the IEEE , vol., no., pp.5735-5738, 22-26 Aug. 2007
Rawles, J., “Magnitude of benefit from earlierthrombolytic treatment in acute myocardialinfarction: new evidence from Grampian region earlyanistreplase trial (GREAT),” BMJ, Vol. 312, pp. 212-215. (1996)
Reisner A. T, Clifford G. D, Mark.R.G, Course materialsfor HST.582J / 6.555J / 16.456J,Biomedical Signal andImage Processing, Spring2007. MITOpenCourseWare (http://ocw.mit.edu),Massachusetts Institute of Technology.
Reneker, D.H., Chun, I., “Nanometer diameter fibers ofpolymer, produced by electrospining,”Nanotechnology, Vol. 7, pp. 216-223. (1996)
Ribeiro AL, Rocha MO, Terranova P, Cesarano M, NunesMD, Lombardi F.,”T-wave amplitude variability andthe risk of death in Chagas disease.”, J CardiovascElectrophysiol. 2011 Jul;22(7):799-805.
Robertson. G, Caldwell. G, Hamill. J, Kamen. G, Whittlesey.S, “Research Methods in Biomechanics.”, Chapter8, p171-181 Champaign, IL: Human Kinetics Publ.,2004.
Sahi, A., Rai, P., Oh, S., Ramasamy, M., Harbaugh, R.E.,Varadan, V.K., “Neural Activity based BiofeedbackTherapy for Autism Spectrum Disorder throughWearable Wireless Textile EEG Monitoring System,”Proc. SPIE 8691, Nano- Bio- and Info_tech Sensorsand Systems 2013, 86910A. (2013)
Sahoo, S., Ouyang, H., Goh, J.C.H., Tay, T.E., Toh, S.L.,“Characterization of a novel polymeric scaffoldapplication in tendon/ligament tissue engineering,”Tissue Engineering, Vol. 12, pp. 91-99. (2006)
Saroj K.L. Lal, Ashley Craig, “A critical review of the
psychophysiology of driver fatigue”, BiologicalPsychology, Volume 55, Issue 3, 1 February 2001,p173-194.
Serruya. M, Hatsopoulos. N, Paninski. L, Fellows. M,Donoghue. J, “Instant neural control of a movementsignal,” Nature, vol. 416, pp. 141–142, 2002.
Shen. J, Barbera. J, Shapiro. C.M, Distinguishingsleepiness and fatigue: focus on definition andmeasurement, Sleep Medicine Reviews, Volume 10,Issue 1, February 2006, p 63-76.
Shyamkumar. P, Oh. S, Banerjee. N, Varadan. V.K., “ AWearable Remote Brain Machine Interface usingSmartphones and the Mobile Network,”Proceedings of Advances in Science andTechnology, vol. 85, pp. 11-16, 2012. Smart T-shirtby GOW Trainer. www.gowtrainer.com
Tao, X., “Smart Fibers, Fabrics and Clothing,” Cambridge,Woodhead. (2001)
Taylor. D, Tillery. S, Schwartz. A, “Direct cortical controlof 3D neuroprosthetic devices,” Science, vol. 296,pp. 1829–1832, 2002.
Tonezzer, M., Lacerda, R.G., “Zinc oxide on carbonmicrofiber as flexible gas sensor,” Physica E: Low-dimensional Systems and Nanostructures, Vol. 44(6), pp. 1098-1102. (2012)
Varadan, V., K., Kumar, P., S., Oh, S., Kwon, H., Rai, P.,Banerjee, N., and Harbaugh R., E., “e-NanoflexSensor Systems: Smartphone-Based RoamingHealth Monitor,” L. Nanotechnol. Eng. Med., 2 (1),011016 (11 pages). (2011)
Varadan, V., K., Oh, S., Kwon, H., and Hankins, P.,“Wireless Point-of-Care Diagnosis for SleepDisorder With Dry Nanowire Electrodes,” J.Nanotechnol. Eng. Med., 1 (3), 031012 (11 pages).(2010)
Vigneshwaran N., Kumar, S., Kathe, A., A., Varadarajan,P., V., Prasad, V., “Functional finishing of cotton fabricusing zinc oxide-soluble starch nanocomposites,”Nanotechnology, 17 (20), 5087-5095. (2006)
Wang, H., Wang, J, Hong, J., Wei, Q., Gao, W, Zhu, Z.,“Preparation and characterization of silvernanocomposite textile,” J. Coat. Technol. Res., Vol.4 (1), pp. 101-106. (2007)
Wearable Wellness System from Smartex s.r.l. Pisa Italy.www.smartex.it
Wearable Wellness System from Smartex s.r.l. Pissa Italy.www.smartex.it
Nanotextile bio-sensors for Mobile Wireless Wearable Health Monitoring of Neurological and Cardiovascular Disorders
INSTITUTE OF SMART STRUCTURES AND SYSTEMS
INSTITUTE OF SMART STRUCTURES AND SYSTEMS (ISSS JOURNAL OF ISSS
J. ISSS Vol. 1 No. 1, pp. 1-10, Sept 2012. REGULAR PAPER
Journal of ISSS 75
M, Chapin. J, Kim. J, Biggs. S, Srinivassan. M,Nicolelis. M, “Real-time prediction of hand trajectoryby ensembles of cortical neurons in primates,”Nature, vol. 408, pp. 361-365, 2000.
Wilson, M.G., Sharma, S., Carre, F., Charron, P., Richard,P., Hanlon, R.O., Prasad, S.K., Heidbuchel, H.,Brugada, J., Salah, O., Sheppard, M., George, K.P.,Whyte, G., Hamilton, B., Chalabi, H., “Significanceof deep T-wave inversions in asymptomatic athleteswith normal cardiovascular examinations: practicalsolutions for managing the diagnostic conundrum,”British Journal of Sports Medicine, Vol. 46 (Suppl.I), pp. i51-i58. (2012)
Wolpaw. J, Birbaumer. N, McFarland. D, Pfurtscheller. G,Vaughan. T, “Brain-computer interfaces forcommunication and control,” Clin. Neurophysiol.,vol. 113, pp. 767-791, 2002.
Wolpaw. J, Birbaumer. N, McFarland. D, Pfurtscheller. G,Vaughan. T, “Brain-computer interfaces forcommunication and control,” Clin. Neurophysiol.,vol. 113, pp. 767-791, 2002.
Yeon, S.J., “Study on texture evolution and properties ofsilver thin film prepared by sputtering deposition,”Appl. Surf. Sci., Vol. 221, pp. 281-287. (2004)
Yoon, H., Deshpande, D.C., Ramachandran, V., VaradanV.K., “Aligned nanowires growth using lithography-assisted bonding of a polycarbonate template forneural probe electrodes,” Nanotechnology, Vol. 19,025304 (8pp). (2008)
Young. T, Palta. M, Dempsey. J, Skatrud. J, Weber. S,Badr. S, “The occurrence of sleep-disordered breathing among middle-aged adults,”New England Journal of Medicine vol. 328(17), pp.1230–1235, 1993.
Yu. S; Cheng. J; , “A Wireless Physiological SignalMonitoring System with Integrated Bluetooth andWi-Fi Technologies,” Engineering in Medicine andBiology Society, 2005. IEEE-EMBS 2005. 27thAnnual International Conference of the , vol., no.,pp.2203-2206, 17-18 Jan. 2006
Zhang, X., Tao, X., “Smart textiles: Passive smart,” June2001 pp. 45-49; “Smart textile: Active smart,” July2001, pp. 49-52; “Smart textiles: Very smart,” August2001, pp. 35-37, Textile Asia.
Zhou.P., Sui.F., Zhang.A., Wang.F., Li.G., “Music therapyon heart rate variability,” Proc. BMEI 3rdInternational Conference on Biomedical Engineeringand Informatics,3, 965-968(2010).
Pratyush Rai received his PhD from Universityof Arkansas in 2013, wherehe also received his M.S. inBiomedical Engineering in2008. He graduated from IITMadras in 2006 with B Tech.in Biotechnology. His PhD
thesis work focused on development of novel textilebased nanostructured sensors for detection ofbiopotential sensing, which are the basis of smarttextile sensors for monitoring arrhythmias, EKG,EEG, blood pressure and skin impedance. He hasworked on high performance OTFT based flexiblesensor electronics, particularly for large scaleintegrated circuits for sensor arrays. His M.S. workinvolved development of solution processed organicsemiconductor FET based sensors for MyocardialIschemia detection and development of nano-bio-battery to power these sensors. He is a ResearchAssociate in Department of Electrical Engineeringat University of Arkansas. He is the team lead forhigh performance nanosensor design and fabricationon wearable platforms/textiles for athletes, withemphasis on printed nanosensors on textile. He hasauthored journal, conference papers, press releasesand invention disclosures for the aforementionedtechnologies.
Sechang Oh received B.S. and M.S. degree inElectrical Engineering from Kyungpook NationalUniversity, Korea in 1996 and Pohang Universityof Science and Technology, Korea in 1999. Hereceived his PhD degree in electrical engineeringfrom the University of Arkansas in 2013. From 1999
to 2008, he worked for theLG INNOTEK Co., Ltd.,where he was involved in thedevelopment of wirelesscommunication modules andelectronic devices. He wasinvolved in the developmentof a wireless networkcamera using motion
detection, audio/video recording, single packagedWi-Fi module based on LTCC, dual band WiMAXmodule, Wibro/Wi-Fi combo module, CDMA(KPCS) full module, Wi-Fi mini PCI card, IF SAW
Pratyush Rai et al.
76
filters, and 915 MHz VCSO during his tenure atLG INNOTEK Co., Ltd., He has 14 pending patentson his research in Korea. Currently, he is aResearch Associate in the Department of ElectricalEngineering, University of Arkansas, Fayetteville.His research interest includes biomedical nano-sensors and wireless sensor systems for real timemonitoring of pathophysiological changes in thebody, wireless health monitoring systems, Point-of-Care health diagnostic systems, biomedical patternrecognition, Human Computer Interface, antenna/RF/mobile system design, energy harvesting forself-powered systems.
Prashanth Shyam Kumar received his M.S. inElectrical Engineeringfrom the University ofArkansas in 2011 and aBachelor of Engineeringdegree in BiomedicalEngineering from ManipalUniversity, Karnataka,India in 2008. His M.S.work involved thedevelopment of dry
electrode based sensors for Electrocardiogram(ECG) measurement and a wireless multisensorsystem for estimating Blood pressure without apressure cuff. He is currently working on developingnovel techniques to automatically infer healthcarebiometrics from minimally intrusive textilenanosensors and applying them to athletics as wellas patient care.
Mouli Ramasamy was born in Coimbatore, India,in 1988. He received theB.E. degree in electronicsand communicationengineering from the Schoolof engineering, SaveethaUniversity, India, in 2011, andthe MSEE degree inelectrical engineering fromthe University of Arkansas,
USA, in 2013. He is currently pursuing his doctoraldegree in electrical engineering in the University ofArkansas. In 2011, he joined the University ofArkansas as a Visiting Research Scholar. Later inthe same year he joined HCL Technologies, India,as a Software Engineer. During his stint as aSoftware Engineer, he was also involved with the
healthcare software research in IIT (Delhi). Hiscurrent research interests include wearableelectronics and healthcare, Point of Care System,Nano-bio-sensors, pattern recognition,electrophysiology of the brain, bio-potential signalprocessing and Real time patient monitoring. Hewas the recipient of the Prolific Young ResearcherAward from the Signal and Telecommunicationsdepartment of Southern Railway in 2009. In 2010,he led at a team of 5 in the AUTCUP-RoboticConference, Iran, to receive the Best TechnicalAspect Award.
Robert Harbaugh was born in West York,Pennsylvania on April 5,1952. He graduated fromhigh school in Red Lion,Pennsylvania in 1970 andobtained a BS degree fromLebanon Valley College in1974. Dr. Harbaughobtained his M.D. fromthe Pennsylvania StateUniversity College of
Medicine in 1978 and received his general surgeryand neurosurgery training at Dartmouth from 1978-1985. He was appointed Assistant Professor ofSurgery (Neurosurgery) at the Dartmouth MedicalSchool in 1985 and progressed to the rank ofProfessor of Surgery (Neurosurgery) in 1997 andProfessor of Radiology in 2001. During his careerat Dartmouth, Dr. Harbaugh served as Director ofthe Dartmouth-Hitchcock Medical CenterCerebrovascular Disease Center from 1994-2003,Director of Cerebrovascular Surgery from 1989-2003, Director of the Neurosurgical Laboratoryfrom 1985-1997 and as acting Residency ProgramDirector from 1996-1997.
In 2003 Dr. Harbaugh returned toPennsylvania as Professor and Chairman of theDepartment of Neurosurgery, NeurosurgeryResidency Program Director and Professor ofEngineering Science and Mechanics at thePennsylvania State University. He has recentlybeen recognized as a Penn State UniversityDistinguished Professor (Penn State’s highestacademic honor) and has been chosen to serve asthe Director of the new, university-wide, Penn StateInstitute of the Neurosciences.
Nanotextile bio-sensors for Mobile Wireless Wearable Health Monitoring of Neurological and Cardiovascular Disorders
INSTITUTE OF SMART STRUCTURES AND SYSTEMS
INSTITUTE OF SMART STRUCTURES AND SYSTEMS (ISSS JOURNAL OF ISSS
J. ISSS Vol. 1 No. 1, pp. 1-10, Sept 2012. REGULAR PAPER
Journal of ISSS 77
Dr. Harbaugh has been an invited speaker ineleven different countries and throughout the UnitedStates. His present research interests include clinicaltrial design, outcomes analysis and qualityimprovement in neurosurgery and computermodeling of intracranial aneurysms. He maintainsa busy clinical practice specializing incerebrovascular surgery and tumor surgery.
Dr. Harbaugh has edited three books andpublished more than 230 articles, book chapters andabstracts. He has served on the editorial boards ofNeurosurgery, the American Association ofNeurological Surgeons Bulletin, Neurosurgery OnCall, the Journal of Neurovascular Disease, theJournal of Neuropsychiatry and ClinicalNeurosciences and Neurobiology of Aging. Dr.Harbaugh has obtained funding for 13 grantproposals from the NIH, NATO, USDA, industryand foundations. He has two U.S. patentapplications.
He is a member of the AANS, CNS, theAmerican Academy of Neurological Surgery, theSNS, the AANS/CNS Section on CerebrovascularSurgery (SCVS), the AANS/CNS Tumor Section,the American Stroke Association (ASA), theAmerican Heart Association (AHA) StrokeCouncil, the New England Neurosurgical Society(NENS), the Pennsylvania Neurosurgical Society(PNS) and the American College of Surgeons(ACS). He has held numerous leadership positionsin these organizations including Chair of the SNSMembership Committee, Scientific Program Chairfor the Academy, Director-at-Large of the AANSBoard of Directors, Chairman of the AANS DigitalTechnology Committee, Chairman of the AANS/CNS Committee for the Assessment of Quality,Chairman of the AANS/CNS Outcomes Committee,Chairman of the AANS/CNS Quality ImprovementWorkgroup, Chairman of the AANS/CNSWashington Committee and Member of theExecutive Committee and Annual MeetingChairman of the PNS. Dr. Harbaugh is a Fellow ofthe ACS and the AHA. He served as a member ofthe Leadership Committee of the AHA StrokeCouncil, as Chairman of the SCVS from 2002-2003and President of the NENS from 2001-2003. Heis also the President of the NeuroPoint Alliance,Inc. and CHYNA, LLC
Professor Vijay Varadan is currently the TwentyFirst Century Endowed Chairin Nano-and Bio-Technologyand Medicine, andDistinguished Professor ofElectrical Engineering, andDistinguished Professor ofBiomedical Engineering (inCollege of Engineering), and
Neurosurgery (in the College of Medicine) at theUniversity of Arkansas. He is also a Professor ofNeurosurgery at Penn State University College ofMedicine.
He joined the University of Arkansas inJanuary 2005 after serving on the faculty of CornellUniversity, Ohio State University and PennsylvaniaState University for four decades. He is also theDirector of the Center of Excellence for Nano-,Micro-, and Neuro-Electronics, Sensors andSystems.
He has concentrated on the design anddevelopment of various electronic, acoustic andstructural composites, smart materials, structures,and devices including sensors, transducers,Microelectromechanical Systems (MEMS),synthesis and large scale fabrication of carbonnanotubes, NanoElectroMechanical Systems(NEMS), microwave, acoustic and ultrasonic waveabsorbers and filters.
He has developed neurostimulator, wirelessmicrosensors and systems for sensing and controlof Parkinson’s disease, epilepsy, glucose in the bloodand Alzheimer’s disease. He is also developing bothsilicon and organic based wireless sensor systemswith RFID for human gait analysis and sleepdisorders and various neurological disorders.
He is a founder and the Editor-in-Chief of theJournal of Smart Materials and Structures. He isthe Editor-in-Chief of the Journal of NanomedicalScience in Engineering and Medicine. He is anAssociate Editor of the Journal of Microlithography,Microfabrication and Microsystem. He serves onthe editorial board of International Journal ofComputational Methods. He has published morethan 500 journal papers and 550 conferencesproceedings and 17 books. He has 15 patentspertinent to conducting polymers, smart structures,
Pratyush Rai et al.
78INSTITUTE OF SMART STRUCTURES AND SYSTEMS
smart antennas, phase shifters, carbon nanotubes,and implantable device for Parkinson’s patients,MEMS accelerometers and gyroscopes. He is afellow of SPIE, ASME, Institute of Physics, andAcoustical Society of America. He has manyvisiting professorship appointments in leadingschools overseas.