December 14 2017 © 2017 Nanya Technology Corp.
Presentation to Investors & Analysts, December 14th, 2017
Joseph Wu, AVP & Deputy Spokesman
Nanya Technology KGI Greater China Corporate Day
2017Q4
2December 14 2017 © 2017 Nanya Technology Corp.
Safe Harbor
The information herein and the presentation made during the
conference contain forward-looking statements and are provided for
information purposes only.
Neither Nanya Technology Corp. nor any other person assumes
responsibility for the accuracy and completeness of the forward-
looking statements or undertakes duty to update the statements. You
are urged to review the information provided herein carefully, and
please don’t distribute, reproduce or disclose the information in whole
or in part without prior written permission of NANYA Technology Corp.
3December 14 2017 © 2017 Nanya Technology Corp.
01. DRAM Industry
02. Business Strategy
03. NTC Overview
Outline
4December 14 2017 © 2017 Nanya Technology Corp.
Smart Home Smart
Healthcare
A.I.
Smart Car
Smart Device
Smart Industry
Smart City
IoT
Big Data Computing
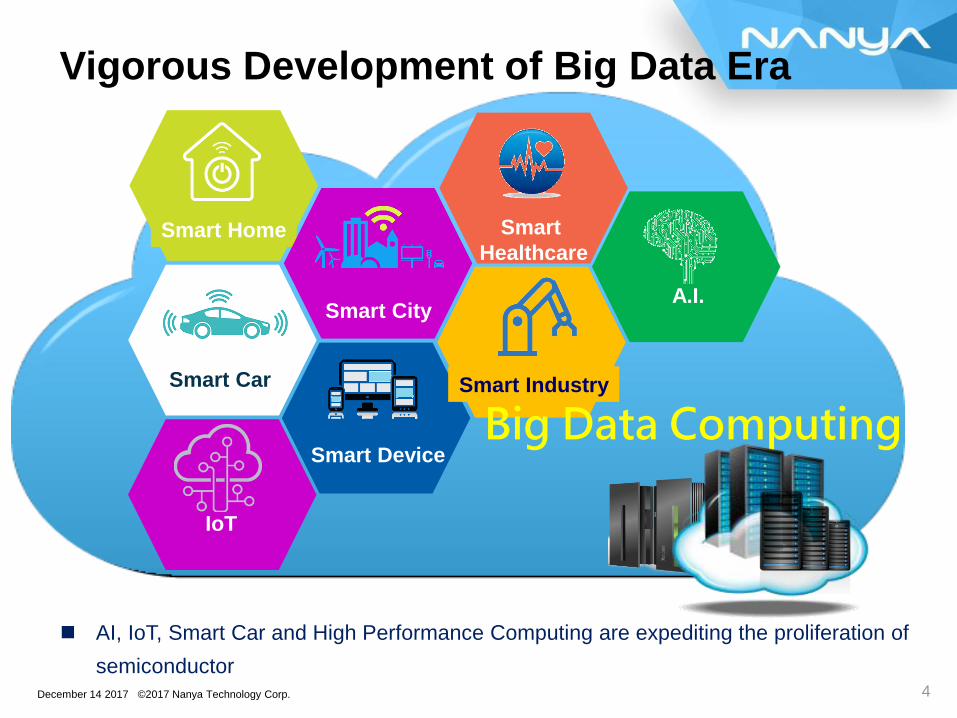
Vigorous Development of Big Data Era
AI, IoT, Smart Car and High Performance Computing are expediting the proliferation of
semiconductor
5December 14 2017 © 2017 Nanya Technology Corp.
High Performance Computing
(A.I., Big Data,
Cloud)
PC Era
Portable Devices
Smart Home、Smart Office、Smart City
IoT、Smart CarIndustry 4.0
Big Data Computing
DRAM Essential to Electronic Devices
6December 14 2017 © 2017 Nanya Technology Corp.
Unit: $ M
Source: Gartner Sep’17
0%
5%
10%
15%
20%
25%
30%
35%
0
50,000
100,000
150,000
200,000
250,000
300,000
350,000
400,000
450,000
2015 2016 2017 2018 (e)
WW Semiconductor WW Memory WW Memory/Semiconductor
Smart Phone + Server
+ Consumer + PC
Smart Car + IoT
+ AI
Strong Momentum of Semiconductor Industry
In 2017, semiconductor YoY revised upward to 20%, total revenue $411.1B
In 2017, Memory YoY revised upward to 57%, total revenue $126B
In 2017, Memory accounts for 31% of total semiconductor revenue
7December 14 2017 © 2017 Nanya Technology Corp.
Source: Gartner Sep’17
Unit: $ M
-
20,000
40,000
60,000
80,000
100,000
120,000
140,000
2015 2016 2017 2018 ( e )
DRAM NAND Others
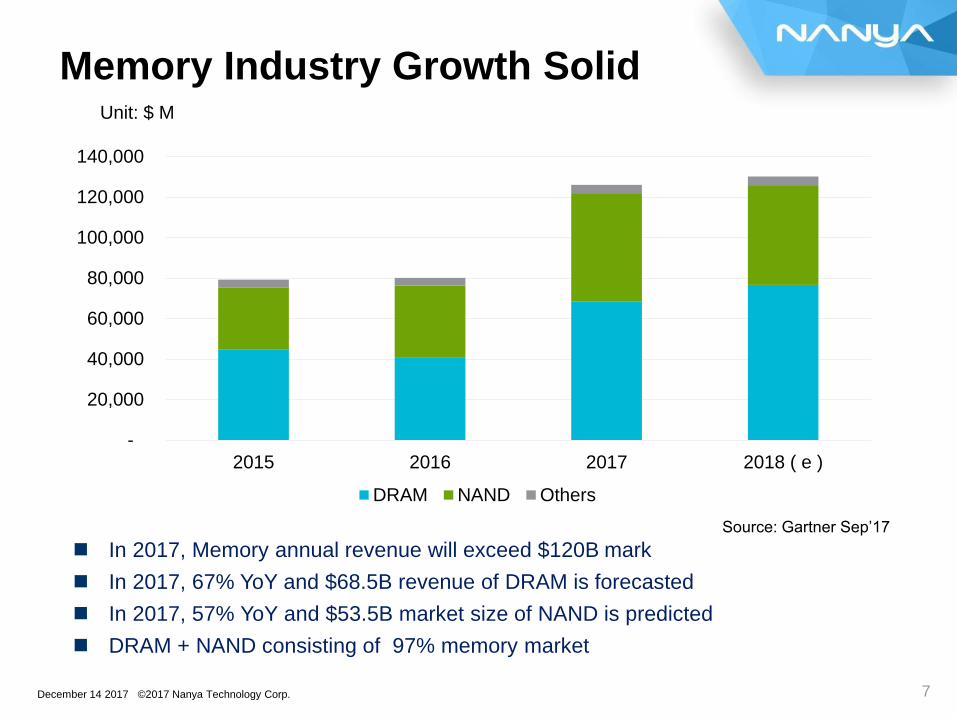
Memory Industry Growth Solid
In 2017, Memory annual revenue will exceed $120B mark
In 2017, 67% YoY and $68.5B revenue of DRAM is forecasted
In 2017, 57% YoY and $53.5B market size of NAND is predicted
DRAM + NAND consisting of 97% memory market
8December 14 2017 © 2017 Nanya Technology Corp.
Source: Gartner Sep’17, IHS Oct’17
Unit: $ M
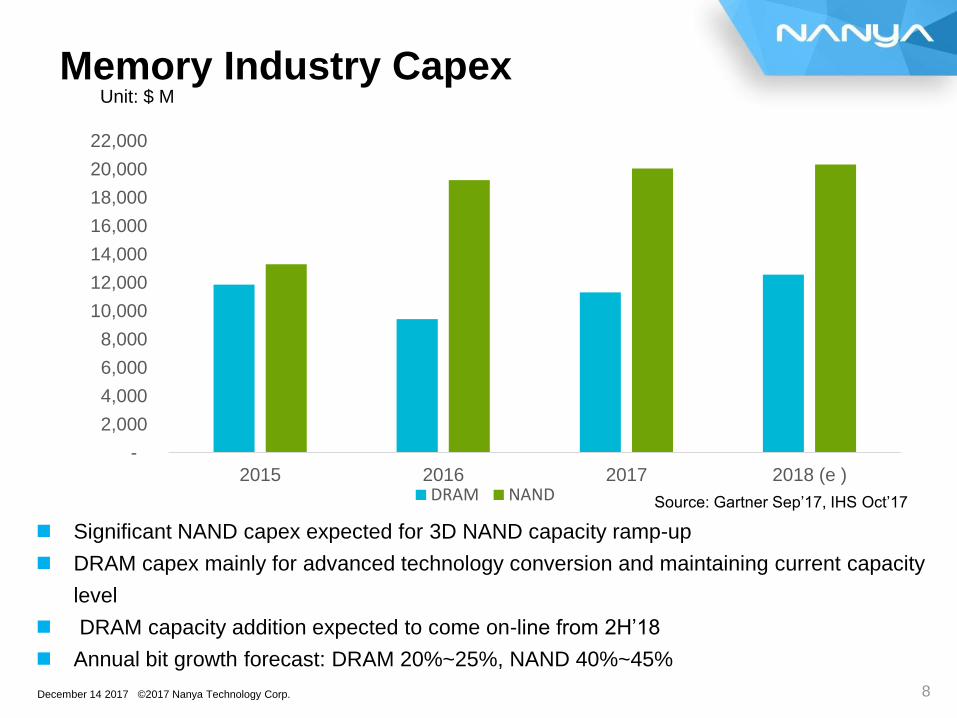
Significant NAND capex expected for 3D NAND capacity ramp-up
DRAM capex mainly for advanced technology conversion and maintaining current capacity
level
DRAM capacity addition expected to come on-line from 2H’18
Annual bit growth forecast: DRAM 20%~25%, NAND 40%~45%
-
2,000
4,000
6,000
8,000
10,000
12,000
14,000
16,000
18,000
20,000
22,000
2015 2016 2017 2018 (e )DRAM NAND
Memory Industry Capex
9December 14 2017 © 2017 Nanya Technology Corp.
1,304
1,213
1,098 1,082
1,096 1,058 1,072
1,133
1,210
0
500
1,000
1,500
2010 2011 2012 2013 2014 2015 2016 2017 2018
WW DRAM Wafer Start (K/M, 300mm)
Source: DRAMeXchange, inSpectrum, IHS, NTC MKT
WW DRAM Capacity
WW DRAM average monthly capacity will moderately increase to 1,210K/M in 2018
10December 14 2017 © 2017 Nanya Technology Corp.
Unit: QTY(Mu)|C/B(GB) QTY C/B Bit Growth
CloudServer +
Work
Station
17.4 188 34%
P2P
PC 255 6.0 4%
Tablet 155 3.0 13%
Smart
phone1,600 3.2 22%
TV 225 2.4 17%
M2M Auto 95 1.8 101%
Consumer & others includes: STB, Storage
(HDD/SSD), Printer, Game Console, Graphic card,
DSC, IP Camera, Industrial, smart watch, etc.
PC + upgrade modules,
16%
Server + WS, 24%
Handset, 38%
Tablet, 3%
DTV, 4%
Auto + Industrial,
3%Consumer & Others,
12%
2018 Demand
27.37Bn(4Gb eq./ YR)
23% YoY bit demand growth forecasted for 2018
Source: IHS, Gartner, NTC MKT
Demand Forecast for 2018
11December 14 2017 © 2017 Nanya Technology Corp.
Source: Gartner, IHS, DRAMexchange, NTC MKT
Supply Demand SufficiencyQty (M, 4Gb eq.) Sufficiency (%)
Favorable DRAM market conditions expected to continue throughout 2018
DRAM Demand/Supply Sufficiency
102% 101%98.3% 98.4%
50%
60%
70%
80%
90%
100%
110%
0
5,000
10,000
15,000
20,000
25,000
30,000
2015 2016 2017 2018 (E)
12December 14 2017 © 2017 Nanya Technology Corp.
01. DRAM Industry
02. Business Strategy
03. NTC Overview
Outline
13December 14 2017 © 2017 Nanya Technology Corp.
0%
20%
40%
60%
80%
100%
2016 2017 2018 2019 2020 2021
<512Mb 1Gb 2Gb 4Gb 8Gb 16Gb
0%
20%
40%
60%
80%
100%
2016 2017 2018 2019 2020 2021
DDR4
Low Power
(LPDDR5/4/3/2/1)
DDR3
DRAM Interface (%)
8Gb
4Gb
16GbDDR5
Others
DDR/ DDR2
DRAM Density (%)
Source: IHS, Gartner, NTC MKT
DRAM Specification Trend Forecast
14December 14 2017 © 2017 Nanya Technology Corp.
Data Center / CommodityConsumer
Server
Commodity
Data
Center STB
TV
Networking
SSDSurveillance
20nm DDR4 8Gb Deployment Strategy
15December 14 2017 © 2017 Nanya Technology Corp.
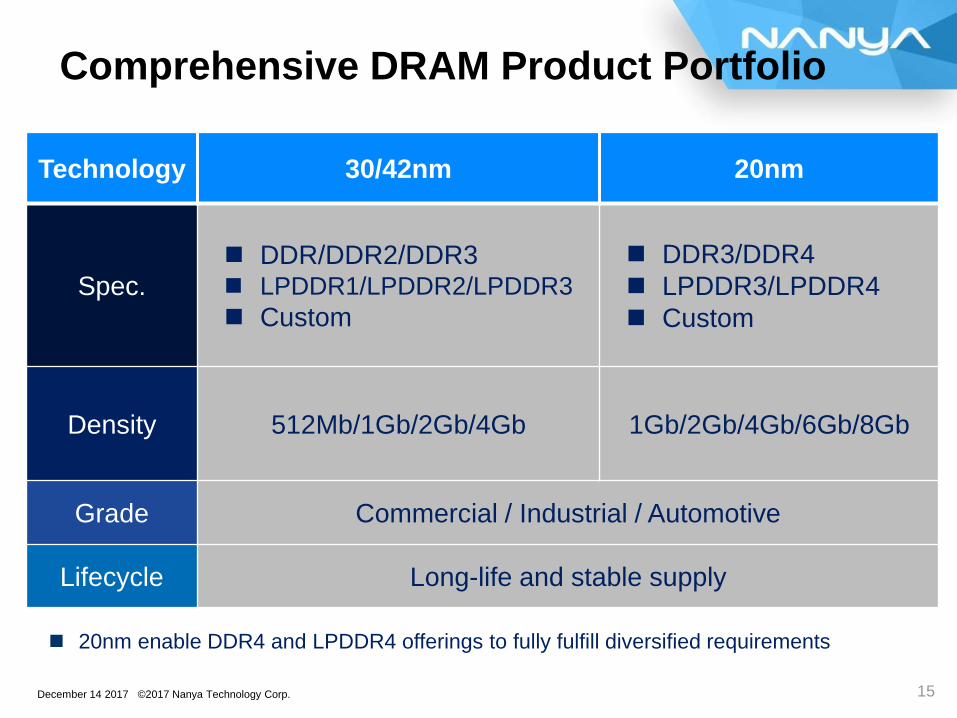
Technology 30/42nm 20nm
Spec. DDR/DDR2/DDR3 LPDDR1/LPDDR2/LPDDR3
Custom
DDR3/DDR4
LPDDR3/LPDDR4
Custom
Density 512Mb/1Gb/2Gb/4Gb 1Gb/2Gb/4Gb/6Gb/8Gb
Grade Commercial / Industrial / Automotive
Lifecycle Long-life and stable supply
Comprehensive DRAM Product Portfolio
20nm enable DDR4 and LPDDR4 offerings to fully fulfill diversified requirements
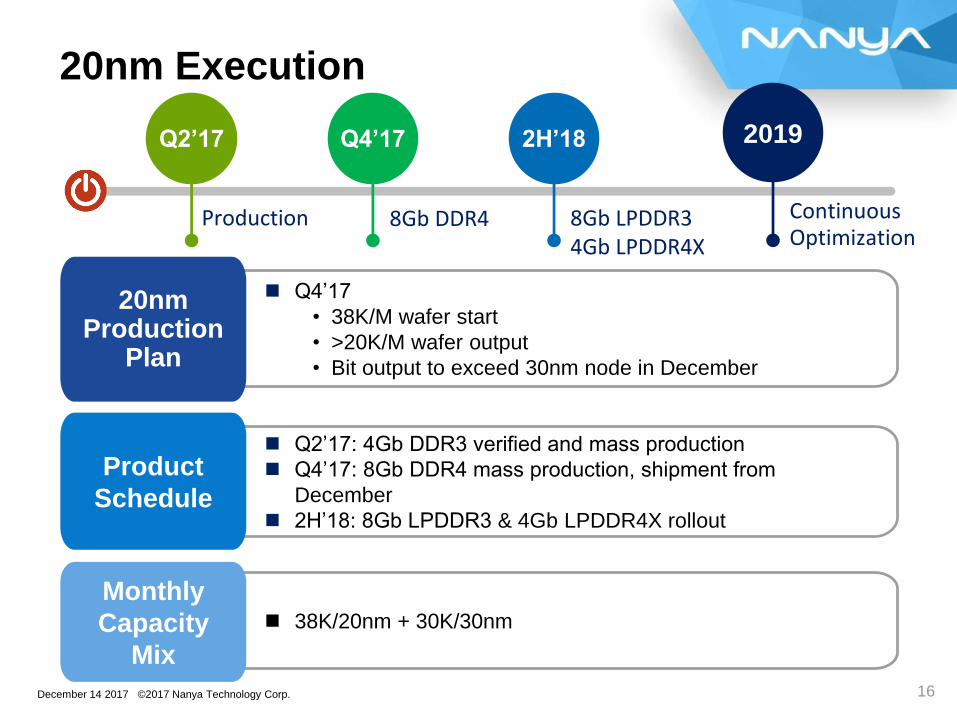
16December 14 2017 © 2017 Nanya Technology Corp.
Production 8Gb DDR4 Continuous Optimization
8Gb LPDDR34Gb LPDDR4X
Q2’17 Q4’17 2H’18 2019
Q4’17
• 38K/M wafer start
• >20K/M wafer output
• Bit output to exceed 30nm node in December
20nmProduction
Plan
Q2’17: 4Gb DDR3 verified and mass production
Q4’17: 8Gb DDR4 mass production, shipment from
December
2H’18: 8Gb LPDDR3 & 4Gb LPDDR4X rollout
Product
Schedule
38K/20nm + 30K/30nm
Monthly
Capacity
Mix
20nm Execution
17December 14 2017 © 2017 Nanya Technology Corp.
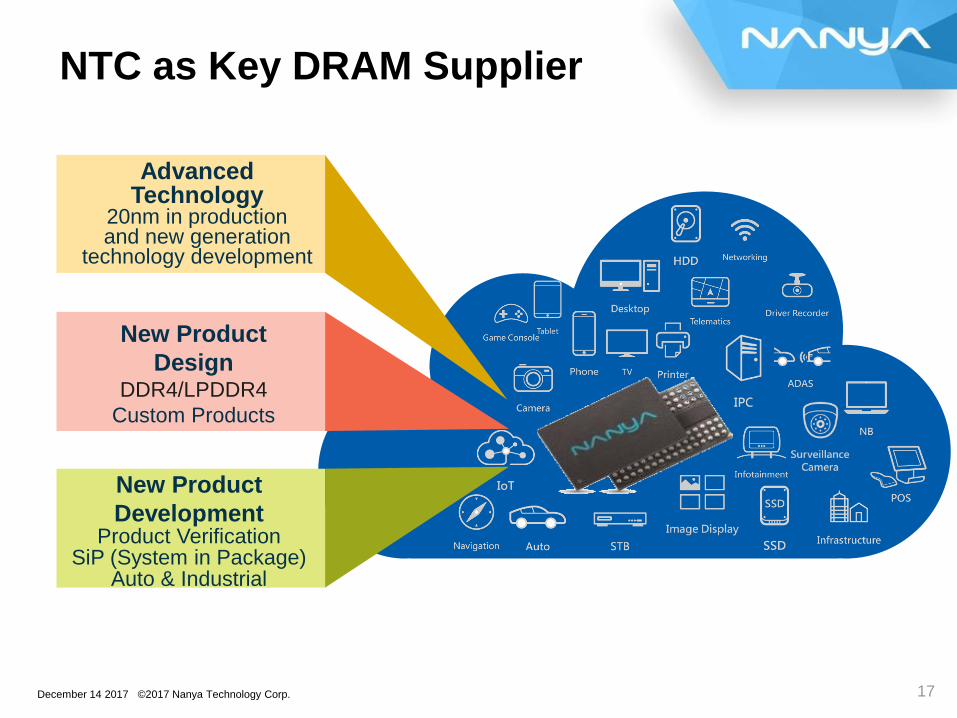
Advanced Technology
20nm in productionand new generation
technology development
New Product
DevelopmentProduct Verification
SiP (System in Package)Auto & Industrial
New Product
DesignDDR4/LPDDR4
Custom Products
NTC as Key DRAM Supplier
18December 14 2017 © 2017 Nanya Technology Corp.
01. DRAM Industry
02. Business Strategy
03. NTC Overview
Outline
19December 14 2017 © 2017 Nanya Technology Corp.
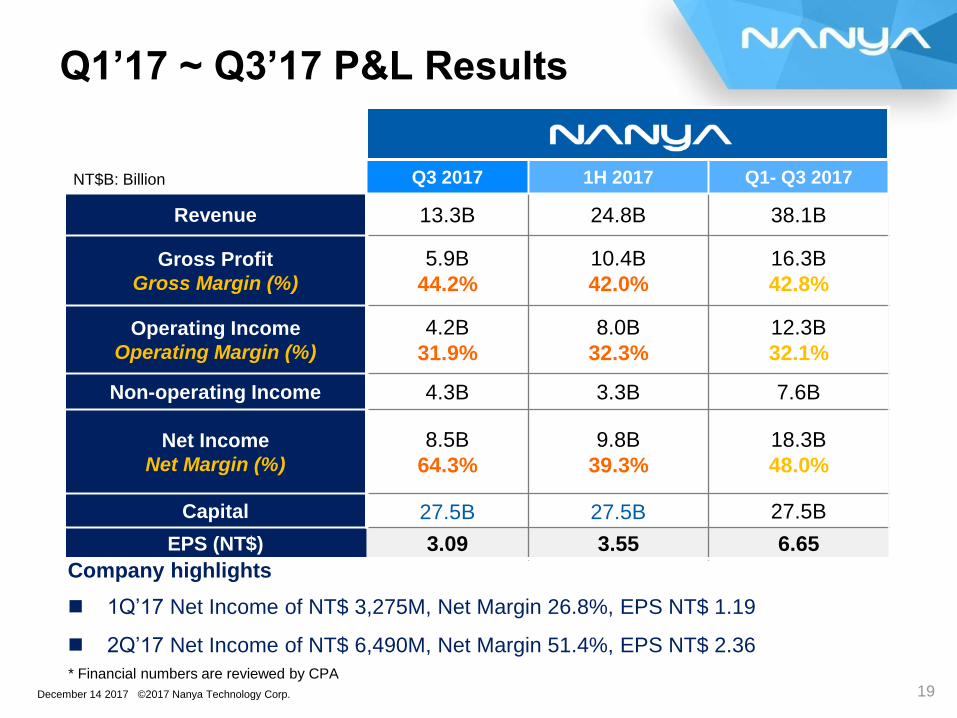
Q3 2017 1H 2017 Q1- Q3 2017
Revenue 13.3B 24.8B 38.1B
Gross Profit
Gross Margin (%)
5.9B
44.2%
10.4B
42.0%
16.3B
42.8%
Operating Income
Operating Margin (%)
4.2B
31.9%
8.0B
32.3%
12.3B
32.1%
Non-operating Income 4.3B 3.3B 7.6B
Net Income
Net Margin (%)
8.5B
64.3%
9.8B
39.3%
18.3B
48.0%
Capital 27.5B 27.5B 27.5B
EPS (NT$) 3.09 3.55 6.65
NT$B: Billion
Company highlights
1Q’17 Net Income of NT$ 3,275M, Net Margin 26.8%, EPS NT$ 1.19
2Q’17 Net Income of NT$ 6,490M, Net Margin 51.4%, EPS NT$ 2.36
* Financial numbers are reviewed by CPA
Q1’17 ~ Q3’17 P&L Results
20December 14 2017 © 2017 Nanya Technology Corp.
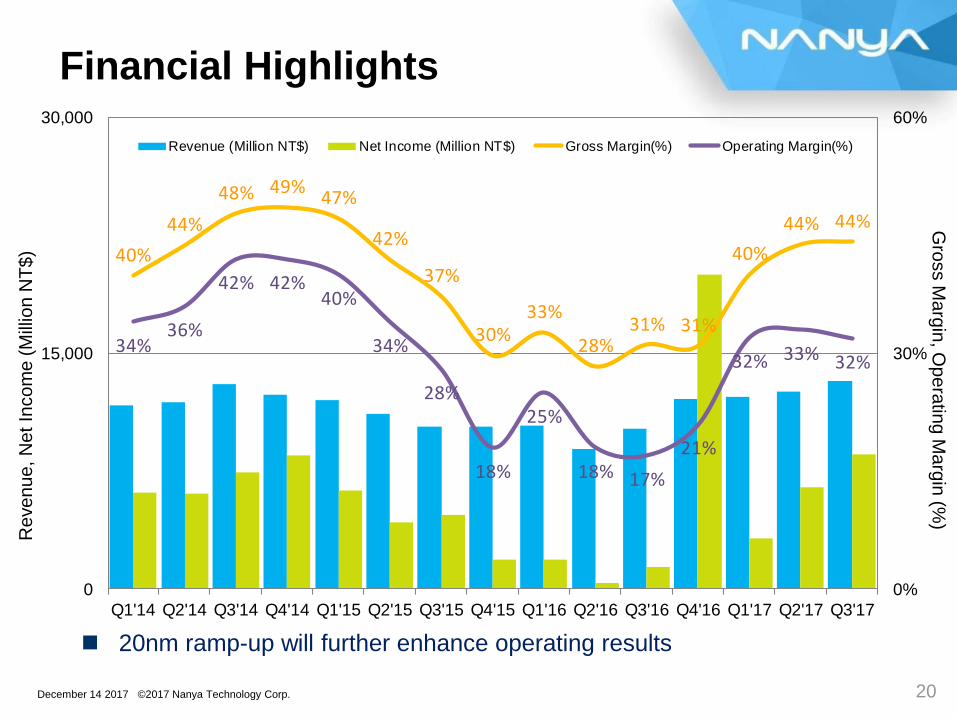
40%
44%
48% 49%47%
42%
37%
30%33%
28%31% 31%
40%
44% 44%
34%36%
42% 42%40%
34%
28%
18%
25%
18% 17%
21%
32% 33% 32%
0%
30%
60%
0
15,000
30,000
Q1'14 Q2'14 Q3'14 Q4'14 Q1'15 Q2'15 Q3'15 Q4'15 Q1'16 Q2'16 Q3'16 Q4'16 Q1'17 Q2'17 Q3'17
Revenue (Million NT$) Net Income (Million NT$) Gross Margin(%) Operating Margin(%)
Re
ve
nu
e, N
et In
co
me
(M
illio
n N
T$
)G
ross M
arg
in, O
pe
ratin
g M
arg
in (%
)
Financial Highlights
20nm ramp-up will further enhance operating results
21December 14 2017 © 2017 Nanya Technology Corp.
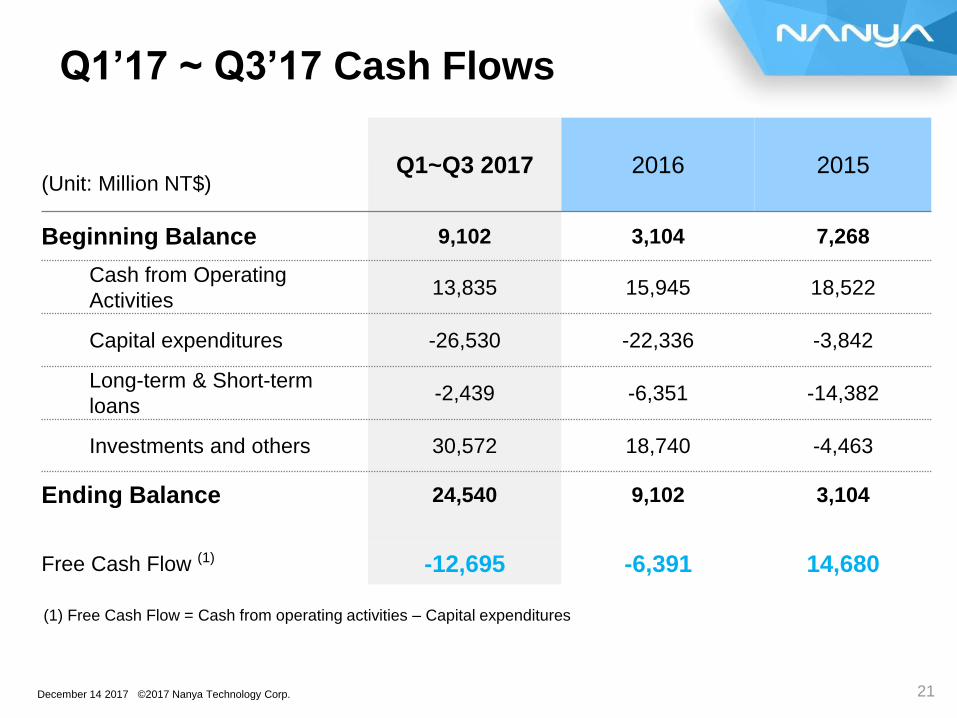
Q1~Q3 2017 2016 2015(Unit: Million NT$)
Beginning Balance 9,102 3,104 7,268
Cash from Operating
Activities13,835 15,945 18,522
Capital expenditures -26,530 -22,336 -3,842
Long-term & Short-term
loans-2,439 -6,351 -14,382
Investments and others 30,572 18,740 -4,463
Ending Balance 24,540 9,102 3,104
Free Cash Flow (1) -12,695 -6,391 14,680
(1) Free Cash Flow = Cash from operating activities – Capital expenditures
Q1’17 ~ Q3’17 Cash Flows
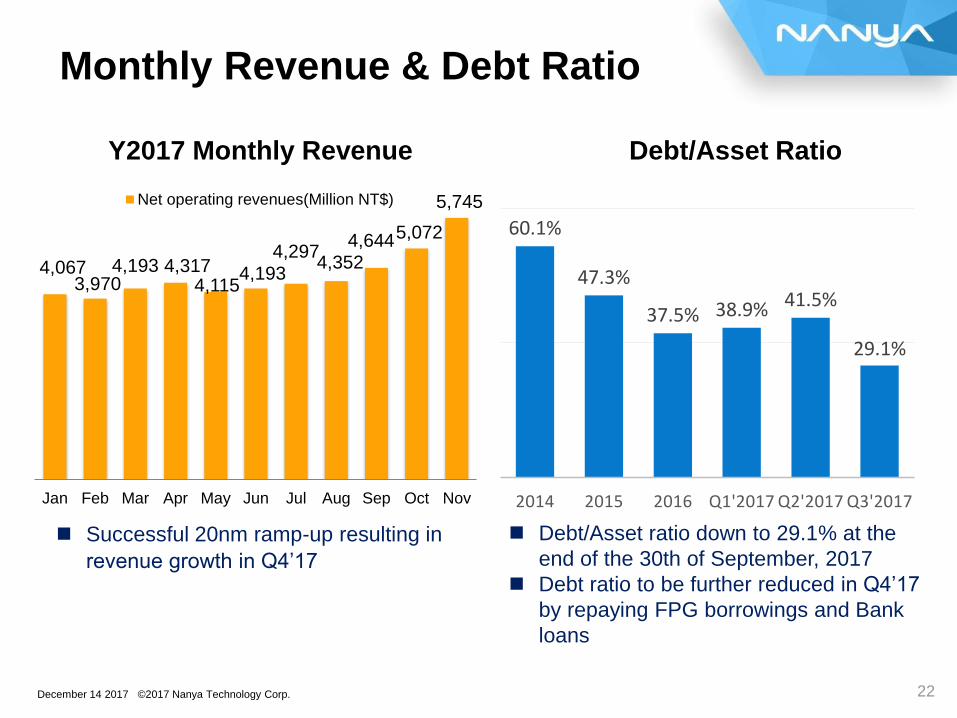
22December 14 2017 © 2017 Nanya Technology Corp.
Debt/Asset RatioY2017 Monthly Revenue
60.1%
47.3%
37.5% 38.9% 41.5%
29.1%
2014 2015 2016 Q1'2017 Q2'2017 Q3'2017
4,067 3,970
4,193 4,317 4,115
4,193
4,297 4,352
4,644 5,072
5,745
Jan Feb Mar Apr May Jun Jul Aug Sep Oct Nov
Net operating revenues(Million NT$)
Monthly Revenue & Debt Ratio
Successful 20nm ramp-up resulting in
revenue growth in Q4’17
Debt/Asset ratio down to 29.1% at the
end of the 30th of September, 2017
Debt ratio to be further reduced in Q4’17
by repaying FPG borrowings and Bank
loans
23December 14 2017 © 2017 Nanya Technology Corp.
Tight supply continued into Q1’18, solid ASP movement
2018 DRAM market in balance and healthy expected
Nanya Technology Operation Focuses:
• Mid-teen bit growth in Q4’17 and 20nm bit output exceeding 30nm
in December expected
• 20nm capacity ramp-up, ~45% YoY bit output in 2018 forecasted
• Launch 20nm DDR4 8Gb to enhance participation in Server
segment
• Expand 20nm product line up for diversified applications
Key Takeaways
24December 14 2017 © 2017 Nanya Technology Corp.
Thanks & Questions