Narrowing Pathways? Exploring the Spatial Dynamics of Postsecondary STEM Preparation in Philadelphia, Pennsylvania Kimberly A. Edmunds • Hamil Pearsall • Laura K. Porterfield Ó Springer Science+Business Media New York 2014 Abstract This paper explores geographical factors associated with the postsec- ondary science, technology, engineering, and mathematics (STEM) preparation of students from underrepresented groups in the School District of Philadelphia from middle to high school during 2008 and 2011. We analyze Pennsylvania state assessment data for mathematics in conjunction with data from the American Community Survey using correlation analysis, cluster analysis, ordinary least squares regression, and geographically-weighted regression. Our analyses find strong relationships among math performance, a key indicator of college readiness for courses of study in STEM, and neighborhood factors within school catchment areas. For example, high percentages of unemployed residents are negatively cor- related to math performance, while high median household income is positively correlated with math performance. These relationships vary spatially across middle and high school catchment areas. The results of this research can foster discussions about school reform towards more nuanced, spatially-informed STEM policies that focus on improving the educational outcomes of students who are traditionally underrepresented in STEM fields, particularly for those youth living in economi- cally disadvantaged communities. Keywords Neighborhood factors Á STEM Á High schools Á Urban schools K. A. Edmunds (&) Research for Action, Philadelphia, PA, USA e-mail: [email protected]H. Pearsall Department of Geography and Urban Studies, Temple University, Philadelphia, PA, USA L. K. Porterfield Department of Educational Foundations, University of Wisconsin-Whitewater, Whitewater, WI, USA 123 Urban Rev DOI 10.1007/s11256-014-0285-6
Transcript
Narrowing Pathways? Exploring the Spatial Dynamicsof Postsecondary STEM Preparation in Philadelphia,Pennsylvania
Kimberly A. Edmunds • Hamil Pearsall •
Laura K. Porterfield
� Springer Science+Business Media New York 2014
Abstract This paper explores geographical factors associated with the postsec-
ondary science, technology, engineering, and mathematics (STEM) preparation of
students from underrepresented groups in the School District of Philadelphia from
middle to high school during 2008 and 2011. We analyze Pennsylvania state
assessment data for mathematics in conjunction with data from the American
Community Survey using correlation analysis, cluster analysis, ordinary least
squares regression, and geographically-weighted regression. Our analyses find
strong relationships among math performance, a key indicator of college readiness
for courses of study in STEM, and neighborhood factors within school catchment
areas. For example, high percentages of unemployed residents are negatively cor-
related to math performance, while high median household income is positively
correlated with math performance. These relationships vary spatially across middle
and high school catchment areas. The results of this research can foster discussions
about school reform towards more nuanced, spatially-informed STEM policies that
focus on improving the educational outcomes of students who are traditionally
underrepresented in STEM fields, particularly for those youth living in economi-
universities, providing one indicator of college preparation. During 11th and/or 12th
grade is also typically the time when students enroll in AP courses as a way to gain
more preparation for college-level work and, in some cases, to earn college credits.
These high school variables serve to provide additional information about levels of
college readiness across the neighborhood high schools in Philadelphia. Although
the AP course participation variable is not exclusive to math courses and both
variables are not exclusive to 11th graders, these variables allowed us to link 11th
grade high school math performance to key indicators of college preparation.
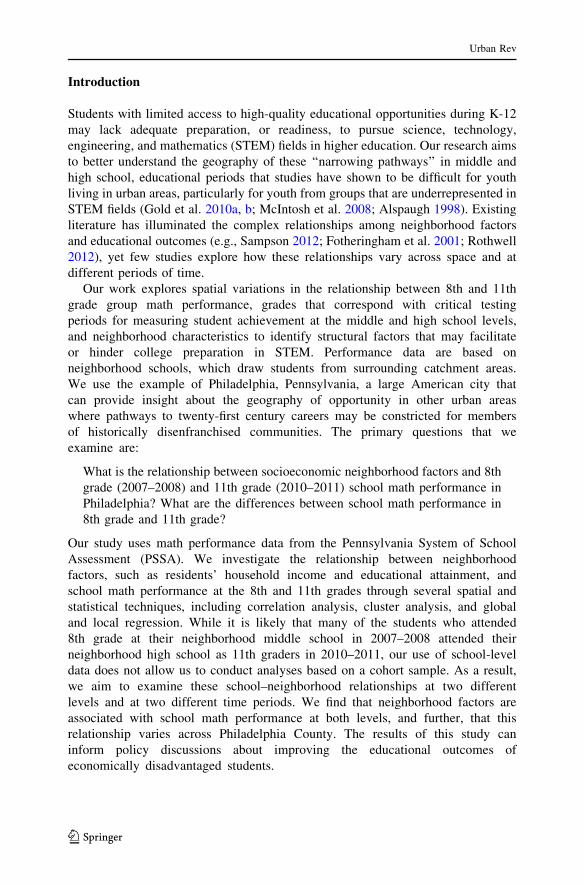
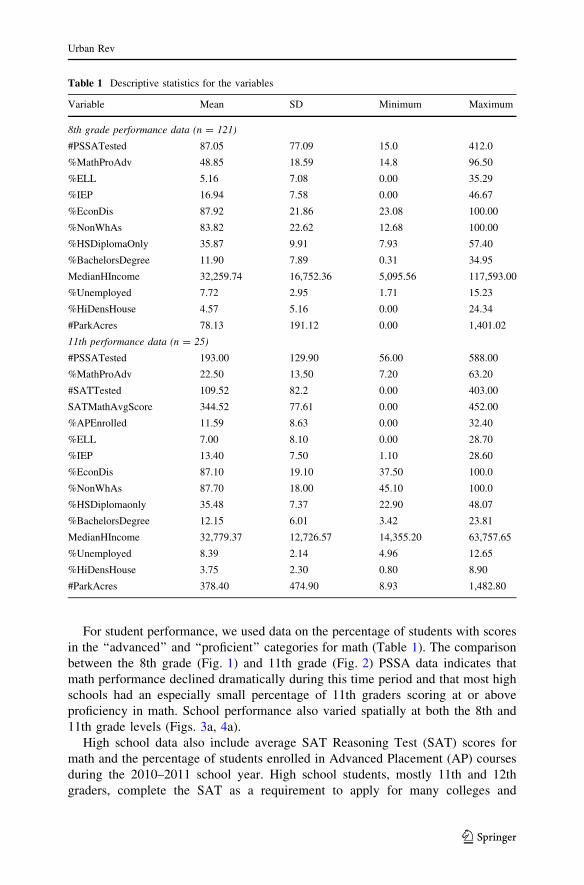
Fig. 1 Histogram: 8th grade math, percentage of students scoring proficient or advanced by middleschool
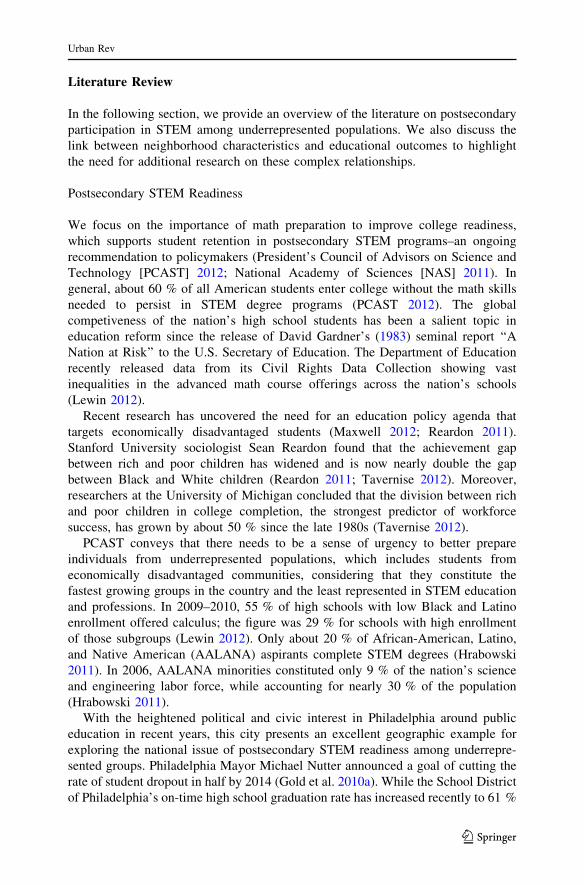
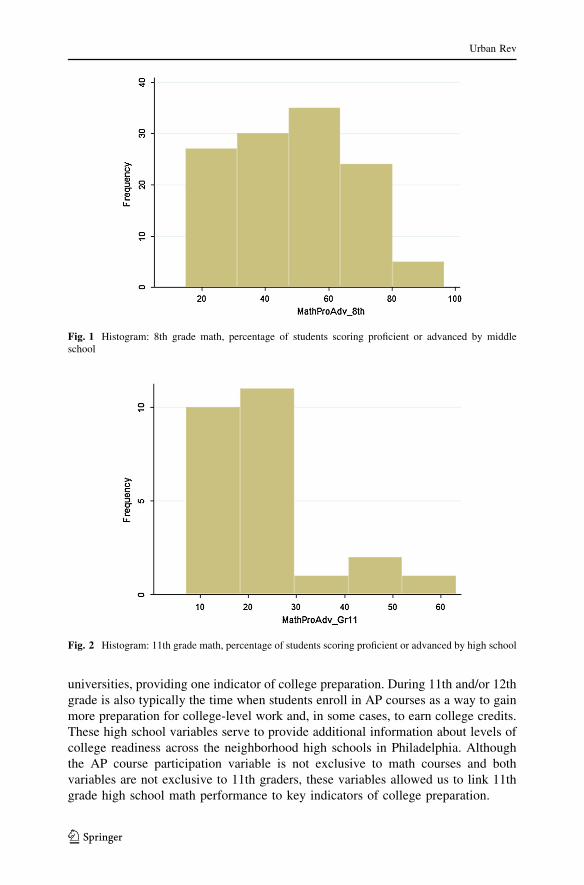
Fig. 2 Histogram: 11th grade math, percentage of students scoring proficient or advanced by high school
Urban Rev
123
Demographic Data by School
We included demographic information on the students taking the PSSA exam: race/
ethnicity, English language learners (ELL), special education (students with an
individualized education plan, or IEP), and economically disadvantaged (eligible for
free or reduced price lunch). Race/ethnicity is closely related to socioeconomic
status, such that House and Williams (2000) suggest that race/ethnicity can predict
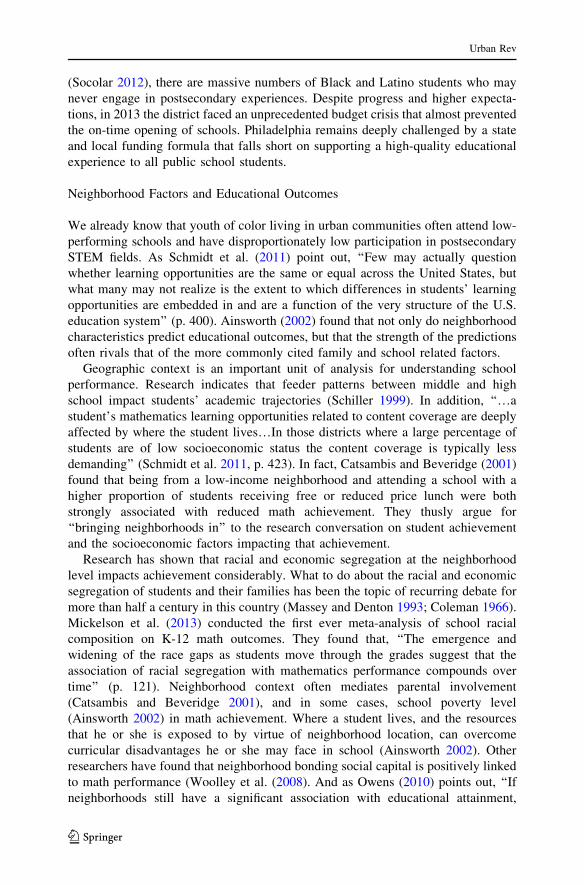
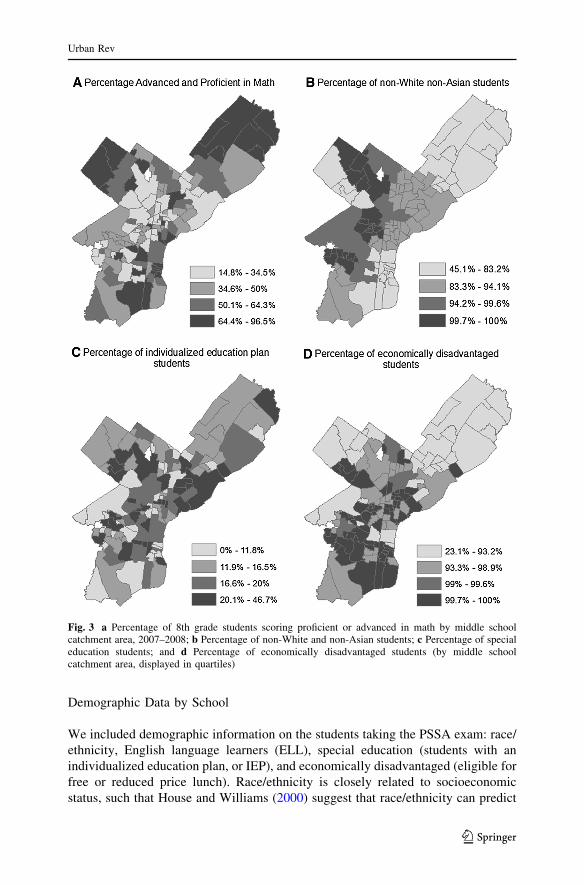
Fig. 3 a Percentage of 8th grade students scoring proficient or advanced in math by middle schoolcatchment area, 2007–2008; b Percentage of non-White and non-Asian students; c Percentage of specialeducation students; and d Percentage of economically disadvantaged students (by middle schoolcatchment area, displayed in quartiles)
Urban Rev
123
socioeconomic status. For race/ethnicity, we calculated a variable for the percentage
of students not White and not Asian. White and Asian-American students have
historically demonstrated higher academic achievement on standardized measures
as compared to Black and Latino students and are not underrepresented in STEM
fields. These variables based on grade group data align well with neighborhood
characteristics since most students attending neighborhood schools live in close
proximity to the school. These school demographic variables differ across
Philadelphia County (Figs. 3b–d, 4b–d).
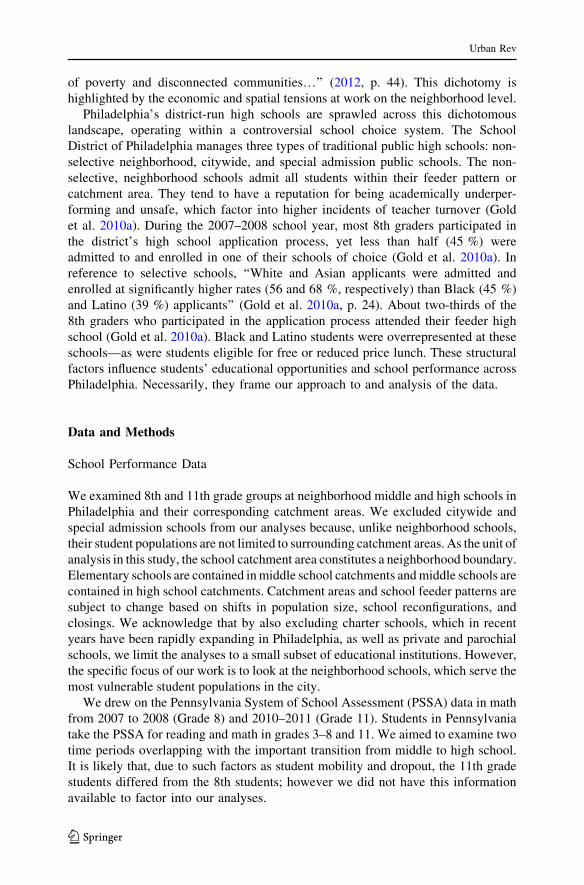
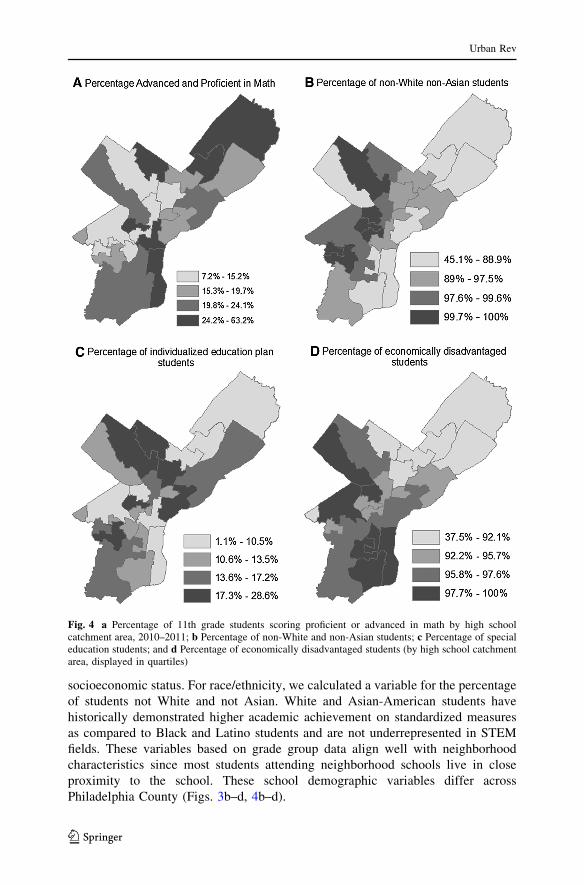
Fig. 4 a Percentage of 11th grade students scoring proficient or advanced in math by high schoolcatchment area, 2010–2011; b Percentage of non-White and non-Asian students; c Percentage of specialeducation students; and d Percentage of economically disadvantaged students (by high school catchmentarea, displayed in quartiles)
Urban Rev
123
Neighborhood Data
To correspond with the school performance data, we used American Community
Survey (ACS) data 5-year estimates from roughly corresponding years, based on the
data availability (2005–2009 and 2007–2011). Based on our review of the literature
(Rothwell 2012; Schott Foundation 2012; Wilson 2009; Conley 1999), we used the
following variables from the ACS to explore neighborhood factors: median
household income, unemployment, and educational attainment (high school
diplomas and bachelor degrees for adults aged 25 and over) (Figs. 5, 6). Each
educational attainment variable represents the highest level of education achieved.
Fig. 5 Socio-economic variables from the 2005–2009 ACS, including median household income,unemployment, and educational attainment (by middle school catchment area, displayed in quartiles)
Urban Rev
123
Household income has been linked to educational outcomes in numerous studies
(Rothwell 2012; Duncan and Murnane 2011; Wilson 2009; Tate 2008; Eamon 2005;
Conley 1999; Yancey and Saporito 1995; Davis 1949). A recent study by the Schott
Foundation (2012) indicated that student performance is linked more closely to
location than student ability and that wealth contributes to inequalities in the
educational system. Indicators of educational attainment, i.e., the percentages of
residents holding a high school diploma or bachelor’s degree, and unemployment,
were also included based on previous research that suggests that absolute levels of
neighborhood resources, including the educational attainment of neighbors, can
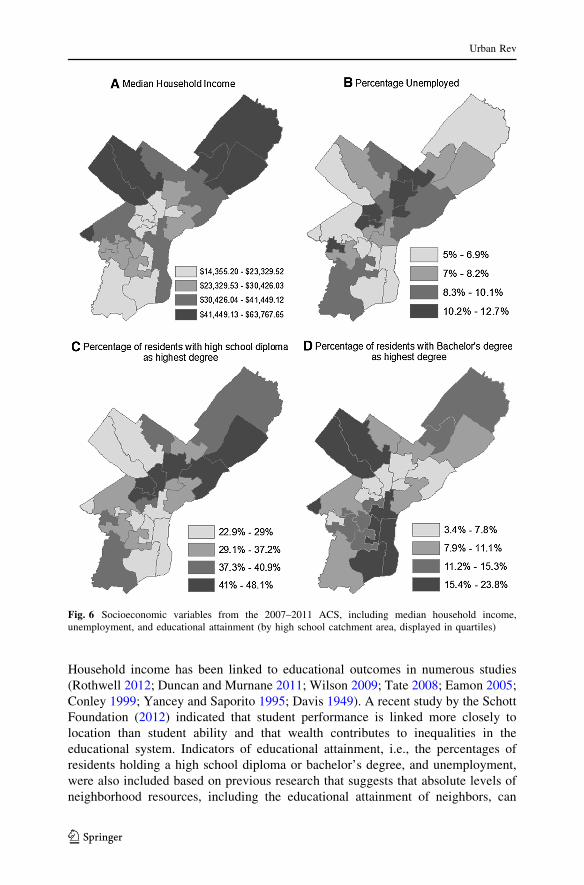
Fig. 6 Socioeconomic variables from the 2007–2011 ACS, including median household income,unemployment, and educational attainment (by high school catchment area, displayed in quartiles)
Urban Rev
123
predict students’ educational performance (Owens 2010). A variable on housing
density was included based on Rothwell’s (2012) finding that cities with the most
anti-density or exclusionary zoning had the highest test scores. Restrictive zoning
that ensures low-density housing is linked to a house-cost gap, or economic
segregation, which is also associated with school test score gaps. The housing
density variable included the percentage of each school catchment area that was
covered by high-density housing. We also used park acreage as an additional
neighborhood characteristic, frequently associated with quality of life (Sampson
2012).
Spatial Joining and Apportioning
All data were aggregated to the school catchment boundaries. For instance, the
percentage of catchment area covered by high-density residential uses was
calculated after overlaying the catchment area and high-density residential area in
a geographic information system (GIS). The census data were aggregated to the
boundaries of the catchment areas using areal interpolation with mask area
weighting because the boundaries of the census tracts did not match those of the
catchment areas. Data from the census tracts were reallocated to the catchment area
boundaries. Areal interpolation weights geographical areas based on the proportion
of the area that falls within the catchment area. For instance, if a census tract
covered 50 % of a catchment area, that percentage was used to weight the
demographic variable. Areas that were known to be unoccupied, including water
bodies and parks, were removed from the analysis prior to the interpolation to
provide a more accurate representation of the distribution of socioeconomic
variables. The final sum is an area weighted average of all census tracts that
intersect a catchment area.
Correlation, Cluster Analysis, Ordinary Least Squares, and Geographically-
Weighted Regression
Quantitative and spatial analyses explored the relationship between school math
performance and neighborhood factors and the geographic distribution of these results to
detect patterns at two grade levels (8th and 11th) at two different points in time (2008 and
2011, respectively). We used Pearson’s r correlation analyses to detect linear
relationships between math performance and school catchment characteristics. Due to
the small sample size of 25, we did not conduct other statistical analyses using the high
school data. The relatively large size of high school catchment areas considerably
reduced our capability to examine local and global phenomena associated with PSSA
math performance. At the middle school level (n = 121) we utilized the Local Moran’s
I tool in ArcGIS 10.0 to examine spatial clustering of school performance based on an
inverse distance weighted conceptualization of the spatial relationship that weights
nearby features more heavily than features that are farther away from the target feature.
We used two regression models to examine the relationship between neighbor-
hood factors and school performance. Ordinary least squares (OLS) regression
(stepwise regression) was employed to understand the relationship between
Urban Rev
123
neighborhood factors and school math performance at the citywide scale.
Geographically-weighted regression (GWR) (Fotheringham et al. 2001) was
employed to allow for further examination of differences across Philadelphia at
the local level that may have been obscured by the global trends. GWR is a local
regression technique that allows for the examination of non-stationarity of variables
across a region. This approach has been increasingly used for a wide range of
applied studies (e.g., Pearsall and Christman 2012; Ogneva-Himmelberger et al.
2009; Brunsdon et al. 2001; Fotheringham et al. 2001) to provide a better fit to the
data when spatial patterns are hypothesized.
Results
Middle School Cluster Analysis, Correlation, and Regression (OLS and GWR)
Results
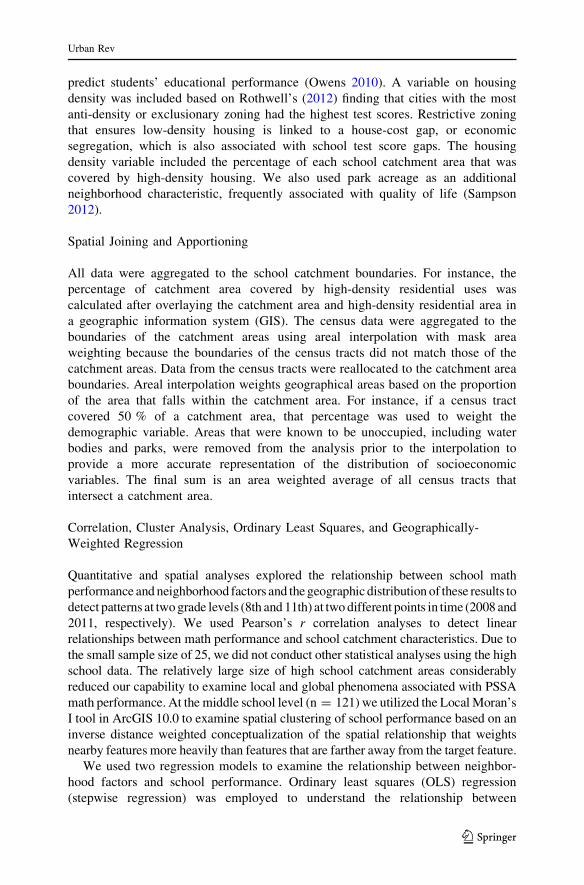
The results of the Local Moran’s I analysis indicate that school performance at the
8th grade level for math is not randomly distributed across Philadelphia (Fig. 7).
Three clusters of high-scoring catchment areas appear in three different regions in
Philadelphia, in the northwest, northeast, and central east. Clusters of low-scoring
catchment areas appear in north Philadelphia and parts of west Philadelphia. There
are also several isolated catchment areas that are high-scoring catchments
surrounded by low-scoring catchment areas. These areas are found in parts of
north Philadelphia and west Philadelphia. These spatial patterns suggest that scores
are linked to geographic phenomena at the neighborhood scale.
The following correlation analysis sheds some light on the relationship between
math performance and neighborhood factors. Ten of the fourteen school
demographic and neighborhood variables are significantly correlated with the
percentage of students scoring advanced or proficient in math at the 8th grade level
(Table 2). From the school demographic variables, %NonWhAs (Fig. 3b), %IEP
(Fig. 3c), and %EconDis (Fig. 3d) are strongly and significantly correlated to math
performance. Each of these variables is negatively correlated to math performance.
From the neighborhood variables, MedianHIncome, %Unemployed, %HSDiplo-
maOnly, and %BachelorsDegree are significantly correlated. MedianHIncome and
%BachelorsDegree are positively associated, while %Unemployed and %HSDiplo-
maOnly are negatively associated.
The results of the OLS regression indicate that the multiple regression model
explains just over 35 % of the variation in school math performance for 8th grade
(Table 3). The residuals were tested for spatial autocorrelation using Global
Moran’s I in ArcGIS 10.0. The results of the Moran’s I test indicate that the
residuals are randomly distributed. The results of the GWR model indicate minor
improvements in explanatory power and fit over the OLS model, with an adjusted r2
of 0.365. However, the purpose of this analysis is not solely to compare the two
regression models based on model fit.
The benefit of the local regression lies in the local coefficients that provide
insight into variations in the relationships among the dependent and independent
Urban Rev
123
variables across the region. For instance, in the global regression model results,
there is a single, fixed relationship between math performance and the independent
variables. In the local model, however, the results allow for the exploration of
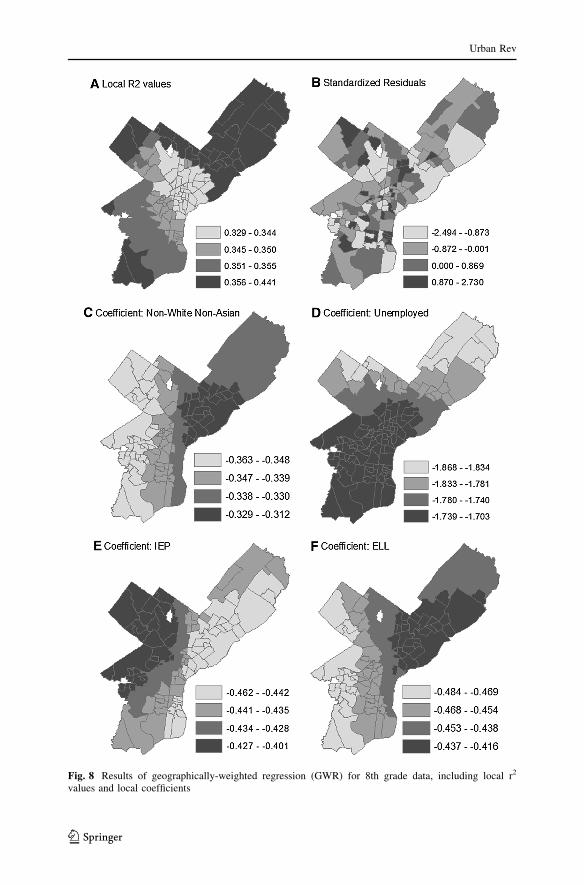
variations in the strength of the relationships (Fig. 8). The fit of the model varies
dramatically across Philadelphia, and the coefficient maps each reveal spatial
variations in the strength of the relationship with the dependent variable. For
instance, r2 values vary from 0.329 to 0.441, with the stronger values occurring in
the northeast and northwest areas of Philadelphia. The use of GWR enables us to see
that the influence of median household income on school math performance is not
random across the region but linked to place-based phenomena.
High School Visual Analysis and Correlation Results
As explained above, the high school dataset included PSSA data and corresponding
catchment areas for 25 neighborhood high schools. In order to illuminate
neighborhood factors that may be related to postsecondary STEM readiness, in
Fig. 7 Clustering of math school performance at the 8th grade level, 2007–2008
Urban Rev
123
this section we (1) describe the results of a visual analysis of the math performance
of 11th grade students attending the high schools in 2011; (2) examine the
relationships between math performance and particular school catchment area
characteristics; and (3) examine the relationships between other indicators of
college readiness and school catchment characteristics.
In general, math performance at the high school level is poor across Philadelphia.
On average, less than 25 % of the 11th graders at neighborhood high schools scored
at proficiency in math in 2011 (See Table 1). Figure 4a shows that there are a few
regions in the county in which math performance appears to be clustered.
Contiguous school catchments in the same class (i.e., the same shade of gray) reveal
regions in which a school’s math performance is similar or related to the
Table 2 Correlations between
advanced/proficient math
variable and geographic and
school demographic variables
for 8th grade
* p \ 0.10; ** p \ 0.05;
*** p \ 0.01
Variable Correlation with advanced/
proficient math,
8th grade (n = 121)
School demographics
%ELL -0.05
%IEP -0.23*
%EconDis -0.28**
%Black -0.35**
%Latino -0.05
%White 0.49**
%Asian 0.30**
%NonWhAs -0.51**
Neighborhood variables
%HSDiplomaOnly -0.24**
%BachelorsDegree 0.39**
MedianHIncome 0.39**
%Unemployed -0.46**
%HiDensHouse -0.02
#ParkAcres 0.13
Table 3 Results of OLS and GWR regression models for 8th grade
Advanced/proficient math Unstandardized coefficients Standardized coefficients Significance
OLS—Intercept 101.77 0.00
OLS—%NonWhAs -0.35 -0.42 0.00
OLS—PercUnemp -1.81 0.50 0.00
OLS—%IEP -0.44 -0.18 0.02
OLS—ELL_Per -0.24 0.18 0.02
OLS—adj. R2 0.38 GWR—adj. R2 0.37
OLS—AICc 1,000.74 GWR—AICc 1,004.08
Urban Rev
123
performance of nearby schools. Typically, high school students living in the
northeast and southern regions of the city perform better than students living in
other areas. At those schools, up to 63 % of 11th graders scored proficient or
advanced in math. High school students living in the north central and western areas
of the city performed especially poorly as compared to students in the rest of the
city. In those areas, no more than 15 % of students attending the neighborhood high
school scored at proficient or above. Evident spatial autocorrelation of math
performance by high school catchment area suggests that student proficiency in
math was not evenly distributed across the county but rather influenced by school-
level and neighborhood factors, such as the socioeconomic characteristics of the
communities.
To further examine the relationships between math performance, a key indicator
of college readiness for courses of study in STEM, and school catchment area
characteristics, we use a correlation analysis. As shown in Table 4, six of the 14
variables are significantly correlated. The six significantly correlated variables are
from the school demographics category. The correlations between rates of
proficiency in math and catchment area characteristics differ in direction and
strength, the results of which align with our review of the literature.
The strongest correlations occur between math performance and the school
demographic variables, which are based on aggregated student-level data for
students taking the PSSA exam. School demographic variables with a significant
positive relationship to math performance include the percentages of ELL students,
White students, and Asian students. Student variables with a negative relationship to
math performance include the percentages of special education students (Fig. 4c),
Table 4 Correlations between
advanced/proficient math
variable and geographic and
school demographic variables
for 11th grade
* p \ 0.10; ** p \ 0.05;
*** p \ 0.01
Variable Correlation with advanced/
proficient math,
11th grade (n = 25)
School demographics
%ELL 0.65***
%IEP -0.51***
%EconDis -0.24
%Black -0.45**
%Latino -0.07
%White 0.54***
%Asian 0.79***
%NonWhAs -0.78***
Neighborhood variables
%HSDiplomaOnly -0.08
%BachelorsDegree 0.30
MedianHIncome 0.18
%Unemployed -0.24
%HiDensHouse -0.03
#ParkAcres 0.08
Urban Rev
123
economically disadvantaged students (Fig. 4d), Black students, and Latino students
taking the PSSA exam. Notably, as is the case for the 8th grade dataset, the variable
measuring the percentage of students taking the test who were non-White and non-
Asian (Fig. 4b) has a significant negative correlation to math performance (-0.776).
Figure 4b displays the high concentration of non-White and non-Asian students
in most of the neighborhood high schools. These schools also have high
concentrations of economically disadvantaged students, and the variable for
percentage of economically disadvantaged students is linked negatively, yet less
strongly, to math performance. This suggests that poverty is a weaker hindrance to
math performance for schools with majority White and Asian populations. There is
little variation among the high schools on these variables: just three catchment areas
in which the percentage of Black and Latino students was below 50 % and two
catchment areas in which the percentage of economically disadvantaged students
taking the test was below 50 %.
Neighborhood variables positively associated with math performance in the
catchment area include median household income, percentage of the population
with a bachelor’s degree as highest level of education, and the number of park acres
(Table 4). However, these variables are not significantly correlated and are weakly
associated with proficiency in math performance in the high school catchment area.
The spatial distributions for income and degree completion provided in Fig. 6a, d
show that socioeconomic status, based on median household income and
educational attainment, in the northeast, northwest, and southeast is higher than
in other regions of the city.
Neighborhood variables with negative associations to math performance include
percentage of the population aged 25 and older with a high school diploma only,
percentage unemployed, and high-density housing. Correlation results for high
school completion suggest that high school graduation rates among the catchment
area population are inversely related to proficiency in math at the high school level.
As indicated above, this was also the case with regard to the 8th grade dataset. As
shown in Fig. 6b, unemployment is higher in particular areas of the city, especially
in the north central region. There are noticeably lower rates of unemployment in the
southern, northwestern, and northeastern areas.
We found that other indicators of preparation for college entry, i.e., average SAT
scores for math and participation in Advanced Placement (AP) courses, were
strongly and significantly correlated (0.62; p \ 0.01 and 0.69; p \ 0.01, respec-
tively) with 11th grade PSSA math performance and correlated in similar ways to
school catchment area characteristics (Table 5). These results suggest that PSSA
math performance is related to college readiness in general. As provided in Table 1,
on average a mere 13.9 % of students in neighborhood high schools took AP
courses in 2011. In addition, the mean SAT score for math was 358.9 on a scale of
200–800. These educational outcomes do not evoke confidence in the ability of
neighborhood high schools in Philadelphia to provide college readiness opportu-
nities to the students they serve.
The variables measuring educational attainment—percentage of the population
earning a high school diploma only and percentage holding a bachelor’s degree—
were weakly, and contrarily, correlated with the two indicators of college readiness
Urban Rev
123
(Table 5). SAT performance and AP enrollment were negatively associated with
diploma earning while positively associated with bachelor’s degree attainment.
These results suggest that, individually, the educational attainment variables, based
on the small dataset of high school catchment area characteristics, are not useful in
assessing the influence of neighborhood factors on these indicators of college
readiness.
The results of the visual and correlation analyses of the high school catchment
data reveal patterns of spatial dependence in math proficiency across the city of
Philadelphia. Students attending school with high percentages of Black and Latino
classmates are especially vulnerable to graduating without the skills needed to excel
as a STEM major in college. While the neighborhood variables used in the
correlation analysis yielded weaker relationships to math performance than school-
level demographic characteristics, they too demonstrated spatial variation and
dependence.
Differences in Math Performance at the Middle School and High School Levels
Despite an upward trend in recent years, Philadelphia’s neighborhood middle and
high schools continue to perform poorly in math, typically with less than 50 % of
students at these schools scoring proficient or advanced.1 Further, proficiency in
math declines from neighborhood middle schools to high schools. In 2008, the 8th
grade mean percentage of students performing at the proficient or advanced level
was 48.9 %, with a standard deviation of approximately 19 percentage points. In
2011, 11th grade mean percentage was 22.5 %, with a standard deviation of 13.5. In
most catchments, there was a double-digit drop in the percentage of students scoring
proficient or advanced between the middle school and its feeder high school.
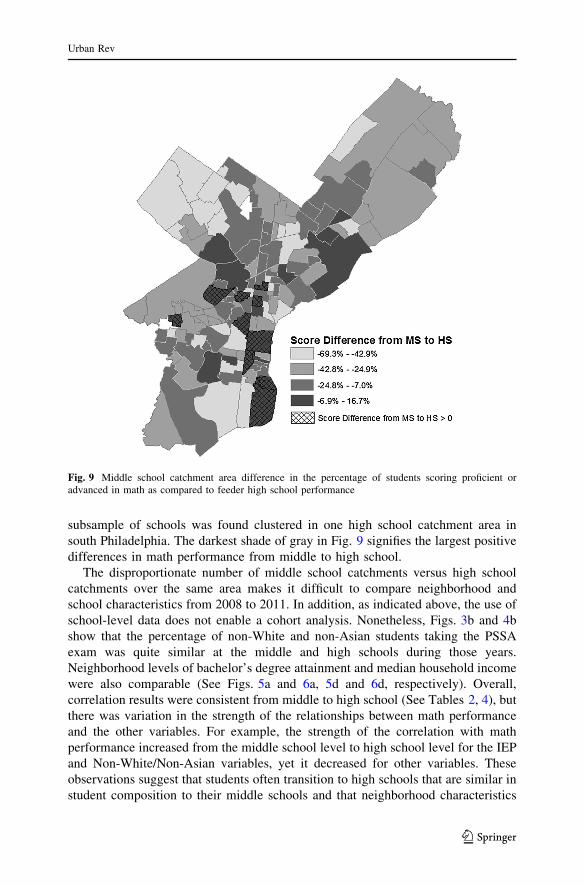
Proficiency levels increased in only 10 of 121 middle school cases (Fig. 9). In three
of those 10 cases, there was a double-digit percentage point increase in the rate of
proficiency from middle to high school, signifying meaningful growth. This
Table 5 Correlations between average SAT score and AP course enrollment for 11th grade
Fig. 8 Results of geographically-weighted regression (GWR) for 8th grade data, including local r2
values and local coefficients
Urban Rev
123
subsample of schools was found clustered in one high school catchment area in
south Philadelphia. The darkest shade of gray in Fig. 9 signifies the largest positive
differences in math performance from middle to high school.
The disproportionate number of middle school catchments versus high school
catchments over the same area makes it difficult to compare neighborhood and
school characteristics from 2008 to 2011. In addition, as indicated above, the use of
school-level data does not enable a cohort analysis. Nonetheless, Figs. 3b and 4b
show that the percentage of non-White and non-Asian students taking the PSSA
exam was quite similar at the middle and high schools during those years.
Neighborhood levels of bachelor’s degree attainment and median household income
were also comparable (See Figs. 5a and 6a, 5d and 6d, respectively). Overall,
correlation results were consistent from middle to high school (See Tables 2, 4), but
there was variation in the strength of the relationships between math performance
and the other variables. For example, the strength of the correlation with math
performance increased from the middle school level to high school level for the IEP
and Non-White/Non-Asian variables, yet it decreased for other variables. These
observations suggest that students often transition to high schools that are similar in
student composition to their middle schools and that neighborhood characteristics
Fig. 9 Middle school catchment area difference in the percentage of students scoring proficient oradvanced in math as compared to feeder high school performance
Urban Rev
123
tend to endure over time. Further analysis using student-level data from additional
years would be useful to see if these patterns persisted.
Discussion and Conclusion
Policy Implications
Numerous studies have provided evidence that neighborhood factors are linked to
school performance. Our intention was to examine the relationship of these
neighborhood factors with school math performance across space and at two
different testing periods to draw attention to the role of neighborhood factors in
math performance at the middle and high school levels in the city of Philadelphia.
As noted above, math proficiency is a major indicator of aptitude in STEM fields.
Our study has considerable policy implications and highlights the need for
additional research on broadening pathways to STEM pursuits.
To begin, math performance is related to neighborhood factors, such as
household income and educational attainment; however, our findings indicate that
these relationships vary spatially. For instance, the 8th grade geographically-
weighted regression results show that the strength and direction of the relationship
between math performance and median household income differ across Philadel-
phia. In some places the influence of income, a wealth indicator, on math
achievement seems to matter more than in other places. Because grouping together
high percentages of poor students of color in schools appears to be problematic for
student achievement in Philadelphia (Edmunds 2010), education policy should
strive to address the underlying causes of this pattern and do a better job of closing
the ‘‘opportunity gap’’ (Carter and Welner 2013). Policymakers should be wary of
imposing ‘‘one-size-fits-all’’ remedies. At the least, they should be context-oriented
and place-specific in order to generally enhance access to high-quality educational
opportunities and to broaden the participation of traditionally underrepresented
students in STEM fields.
Locational factors play a role in the academic trajectories of Philadelphia youth
and their STEM participation. An Executive Branch initiative includes policies to
recruit, support, retain, and reward 100,000 STEM educators in 10 years (PCAST
2012). A comprehensive approach would address how to transform low-performing
schools into places where educators want to work and students want to learn. In
addition, students and parents may not want to depend on neighborhood schools to
provide the type of math preparation required to excel in STEM. They may need to
look outside of the school to access services that will meet their needs. These may
include subsidized college preparation programs happening after school or during
the weekend. Accessing external resources involves a level of social capital that
may be lacking in many communities. In addition, the services may not be available,
which points to the need for cultivating public–private partnerships among the
school district, community-based organizations, local colleges and universities, and
other stakeholders.
Urban Rev
123
Areas for Future Research
While this research has drawn attention to the narrowing pathways to STEM among
public school students in Philadelphia, we have identified several ways in which the
study could be extended and elaborated to expand our understanding of neighbor-
hood effects on STEM readiness. First, we use publicly-available, aggregated data
to illuminate geographic phenomena linking academic performance to the
socioeconomic characteristics of school catchment areas. It is difficult to attribute
neighborhood factors to math performance, considering that there are numerous
factors at multiple levels that influence this academic outcome. We were not able to
control for those many factors, such as teacher effectiveness and students’ prior
performance in math. A more comprehensive research design would incorporate
student-level data on math performance and residence and include students
attending charter, special admission, private and parochial schools. That would
enable analyses of students’ math performance by controlling for neighborhood
variables (based on their residence), school variables (based on their middle schools
and high schools), and individual characteristics. It would also increase the number
of data points at the high school level, allowing for more robust analyses. Moreover,
additional measures of STEM readiness could be incorporated. Our study relies on
math performance as an indicator of postsecondary STEM readiness, but a
multidimensional approach to measuring STEM readiness would provide a more
complete and accurate assessment.
Our unequal samples sizes did not allow for direct comparison between the 8th
grade and 11th grade math performance. However, we found that math performance
declined from 8th grade to 11th grade in Philadelphia, or between 2008 and 2011,
calling for the need for further research on this transition. Expanding the sample size
and tracking students from 8th grade to 11th grade would allow for sufficient
representation of the transition and would allow us to better understand the changing
pathway to courses of study in STEM.
Our literature review and research suggest that the high school selection system
in Philadelphia further disenfranchises economically disadvantaged students and
youth of color aspiring to gain expertise in STEM-related fields that will enable
them to be highly-skilled, successful members of the American workforce. The
policy implications of this study are clear for broadening participation in STEM; the
structural barriers that are associated with academic achievement impede the ability
of a growing population of students to enter STEM fields. As acknowledged by
multiple scholars (NAS 2011), only a comprehensive approach that involves all
stakeholders and addresses all factors that impact these students’ success in STEM
will result in sustainable progress.
Acknowledgments Research for this paper was supported, in part, by the National Science Foundation
(NSF) through a grant (Award 1061028) to the Association of American Geographers (AAG). Any
opinions, findings, and conclusions or recommendations expressed in this material are those of the
author(s) and do not necessarily reflect the views of the NSF or the AAG. We would like to acknowledge
May Yuan, University of Oklahoma, for her generous guidance and feedback.
Urban Rev
123
References
Ainsworth, J. W. (2002). Why does it take a village? The mediation of neighborhood effects on
educational achievement. Social Forces, 81(1), 117–152.
Alspaugh, J. W. (1998). Achievement loss associated with the transition to middle school and high
school. The Journal of Educational Research, 92(1), 20–25.
Brunsdon, C., McClatchey, J., & Unwin, D. J. (2001). Spatial variations in the average rainfall-altitude
relationship in Great Britain: An approach using geographically weighted regression. International
Journal of Climatology, 21, 455–466.
Carter, P. L., & Welner, K. G. (Eds.). (2013). Closing the opportunity gap: What America must do to give
every child an even chance. New York, NY: Oxford University Press.
Catsambis, S., & Beveridge, A. A. (2001). Does neighborhood matter? Family, neighborhood, and school
influences on eighth-grade mathematics achievement. Sociological Focus, 34(4), 435–457.
Coleman, J. S. (1966). Equality of educational opportunity. Washington, DC: National Center for
Educational Statistics (DHEW/OE). Retrieved from ERIC database.
Conley, D. (1999). Being black, living in the red: Race, wealth, and social policy in America. Berkeley,
CA: University of California Press.
Davis, A. (1949). Social-class influences upon learning. Cambridge, MA: Harvard University Press.
Duncan, G. J., & Murnane, R. J. (Eds.). (2011). Whither opportunity? Rising inequality, schools, and
children’s life chances. New York, NY: Russell Sage Foundation.
Eamon, M. K. (2005). Social-demographic, school, neighborhood, and parenting influences on the
academic achievement of Latino young adolescents. Journal of Youth and Adolescence, 34(2),
163–174.
Edmunds, K. (2010). Looking from the outside in: A spatial analysis of students’ neighborhood
characteristics and school performance in Philadelphia. In Paper presented at the ESRI International
Education User Conference, San Diego, CA, July 2010.
Fotheringham, A. S., Charlton, M., & Brunsdon, C. (2001). Spatial variations in school performance: A
local analysis using geographically weighted regression. Geographical & Environmental Modelling,
5(1), 43–66.
Gardner, D. P. (1983). A nation at risk: The imperative for educational reform. An open letter to the
American people. A Report to the Nation and the Secretary of Education. Washington, DC: National
Commission on Excellence in Education. Retrieved from ERIC database.
Gold, E., Evans, S., Haxton, C., Maluk, H., Mitchell, C., Simon, E., et al. (2010a). Context, conditions,
and consequences: Freshman year transition in Philadelphia. Philadelphia: Research for Action.
Gold, E., Evans, S., Haxton, C., Maluk, H., Mitchell, C., Simon, E., et al. (2010b). Transition to high
school: School ‘choice’ and freshman year in Philadelphia. Philadelphia: Research for Action.
House, J. S., & Williams, D. R. (2000). Understanding and reducing socioeconomic and racial/ethnic
disparities in health. In B. D. Smedley & S. L. Syme (Eds.), Promoting health: Intervention
strategies from social and behavioral research (pp. 81–125). Washington, DC: National Academy
Press.
Hrabowski, F. A. (2011). Editorial: Boosting minorities in science. Science, 331, 125.
Lewin, T. (2012). Black students face more discipline, data suggests. The New York Times. Retrieved
from http://www.nytimes.com/2012/03/06/education/black-students-face-more-harsh-discipline-data-