48
NARTD NARTD | The Past, Present and Future May 19 th 2008 Steve Miranda Senior Manager | The Nielsen Compan Senior Manager | The Nielsen Company

NARTDNARTD | The Past, Present and Future
May 19th 2008
Steve MirandaSenior Manager | The Nielsen CompanSenior Manager | The Nielsen Company
Agenda
• The general Grocery environment.
• Looking back at the Grocery beverage market over the last 10 years.
• How has the market changed?• What brands have come and gone?• What trends have emerged?
• The current retail environment.• Channel and Segment shares.• What drives consumer purchase?p
• Looking ahead.• How will mega trends impact beverages?
Information SourcesInformation Sources
• Nielsen | ScanTrack– Measures scan sales through all supermarkets and grocery stores (warehouse
withdrawals for independents)
• Nielsen | Homescan Consumer Panel– Captures all in-home consumption of packaged and fresh grocery products
purchased from all supermarketsp p– 10,000 representative households across metro and regional Australia– Understanding consumer behaviour driving why the market behaves as it does.
• Nielsen Shopper Trends Report 2008– Online study, March 2008
• Nielsen Omnibus

Grocery environmentyOverall growth slips in 2007, NPD drives category growth

2007 Defined Grocery growth slightly behind 2006.2007 Defined Grocery growth slightly behind 2006.
Growth Rate Over Time For Total Defined GroceryGrowth Rate Over Time For Total Defined GroceryDefined Packaged Grocery - % value change vs YA - Australia
8.9 8.8
10.02001 2002 2003 2004 2005 2006 2007
6.3
7.7
6.4
7.9
6.86.6
6.9
6.3
6.8
6.2
7.3
6 0
6.7
6.1
7.0
6.46.16 0
6.4
8.0
6.2
7.17.4
8
6.86.76.8
6.2 6.1
6.9
8.0
s YA
5.1
5.6
3.9
5.6
5.0
6.0 6.0
4.7
5.65.85.45.3
5.15.5
5.25.24.8
4.44.7
4.54.8
3.6
4.54.7
5.2
4.54.64.8
4.2
4.8
5.7
4.4
5.5
4.7
4.03.83.6
5.7
5.0
4.0 3.8
5.75.8
5.14.8
3 4
5.24.84.8
3.84.0
4.0
6.0
Valu
e C
hang
e vs
2.62.4
2.7
3.2
2.72.5 2.4
3.4
2.0
% V
Average growth rate of 5.5% in 2006 d li i t 4 6% i 2007
0.4
0.0
2006 declining to 4.6% in 2007
Source: Nielsen ScanTrack

However strong year on year growth for Confec / However strong year on year growth for Confec / Beverages is ahead of the market.Beverages is ahead of the market.
Australia - Packaged Grocery % value growth vs. YADepartment Summary
8
MAT TO 02/07/2006MAT TO 01/07/2007
6.7
6 5 9
8
7.1 7 7
4.6 4.4
5.3
3.8
5.1
4.23 6
5.9
4.3
3.23.6
2.5 2.4
PACKAGEDGROCERY
DRY GROCERY HEALTH/BEAUTY PETFOOD/ACCESSORIES
HOUSEHOLD DAIRY CASE CONFEC/DRINKS FROZEN FOODS TOBACCOPRODUCTS
Source: Nielsen ScanTrack

Total Packaged Grocery CPI has rebounded after a Total Packaged Grocery CPI has rebounded after a steep declined in late 2007.steep declined in late 2007.
CPI in Packaged Groceries & LiquorCPI in Packaged Groceries & LiquorBased on a fixed basket of 28,750 grocery and 12,500 liquor products, measured through national supermarkets, liquor
stores, hotels and bottleshops (source: ScanTrack | Grocery & ScanTrack | Liquor)
6.0
4.0
5.0
YA
1 0
2.0
3.0
% c
hang
e vs
-1.0
0.0
1.0
Total Packaged Grocery Total Packaged Grocery excl Tobacco Total Packaged Liquor
source: ScanTrack | Grocery & ScanTrack | Liquor)

This was driven by aggressive price discounting by This was driven by aggressive price discounting by the retailers within Beverages.the retailers within Beverages.
CPI i F d & BCPI in Food & BeveragesBased on a fixed basket of food and beverage products, measured through national supermarkets and grocery stores (source:
ACNielsen ScanTrack)
8 0
9.0
5.0
6.0
7.0
8.0
YA
2.0
3.0
4.0
5.0
% c
hang
e vs
Y
-1.0
0.0
1.0
%
-2.0
Chilled Dairy Only Frozen Only Drinks & Snacks Dry Grocery & Bakery
source: ScanTrack | Grocery & ScanTrack | Liquor)
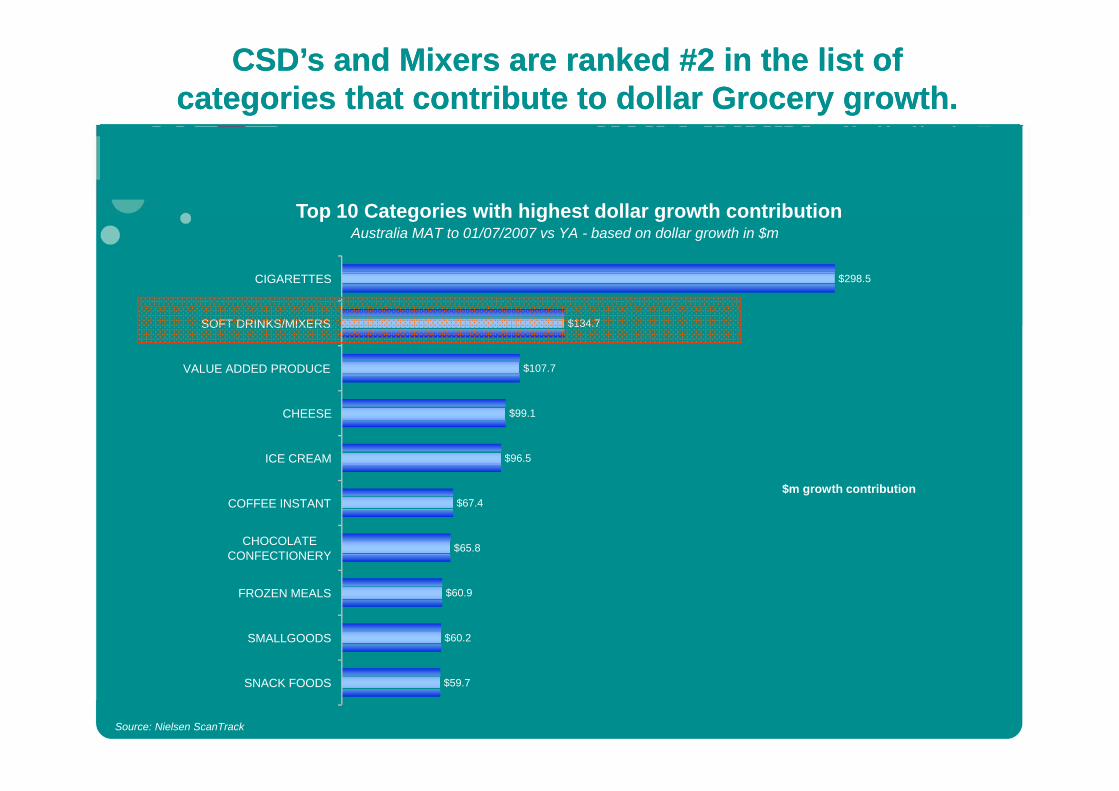
CSD’s and Mixers are ranked #2 in the list of CSD’s and Mixers are ranked #2 in the list of categories that contribute to dollar Grocery growth.categories that contribute to dollar Grocery growth.
Top 10 Categories with highest dollar growth contributionTop 10 Categories with highest dollar growth contributionAustralia MAT to 01/07/2007 vs YA - based on dollar growth in $m
$298.5CIGARETTES
$134.7
$107.7
SOFT DRINKS/MIXERS
VALUE ADDED PRODUCE
$99.1
$96.5
CHEESE
ICE CREAM
$ th t ib ti$67.4
$65.8
COFFEE INSTANT
CHOCOLATECONFECTIONERY
$m growth contribution
$60.9
$60.2
FROZEN MEALS
SMALLGOODS
$59.7SNACK FOODS
Source: Nielsen ScanTrack

Beverage categories are also featuring highly within Beverage categories are also featuring highly within the top 20 fastest growing categories. the top 20 fastest growing categories.
Top-20 fastest growing grocery categories
NPD (Boost)
Brand extensions, larger packs, multi-packs
Powerade Isotonic multi packs
Top 20 fastest growing grocery categoriesAustralia MAT to 01/07/2007 vs YA, based on % value growth.
316.3
51.3
35 4
CHILLED BABY FOODS**
FRUIT/TEA/COFFEE DRINKS
SPORTS/ENERGY DRINKS Powerade Isotonic, multi-packs35.4
29.9
27.7
24.8
SPORTS/ENERGY DRINKS
FOOT CARE
OLIVE OIL
VALUE ADDED PRODUCE
Health, larger packs, multi-packs
22.1
18.0
15.4
15 4
FRESH SOUP
MINERAL/STILL/SPRING WATER
FRESH MILK-FLAVOURED
ICE CREAM 15.4
15.0
14.3
14.2
ICE CREAM
FROZEN MEALS
FRESH PASTA&SAUCE
HOSIERY
% value change vs YA
13.8
13.7
13.6
13 5
PAPER TOWEL
EGGS
CHRISTMAS CAKES
JELLY 13.5
13.4
13.3
JELLY
DAIRY DIPS
COFFEE INSTANTSource: Nielsen ScanTrack

NARTD over the last decadeNARTD over the last decadeSegment changes, top brands and private label
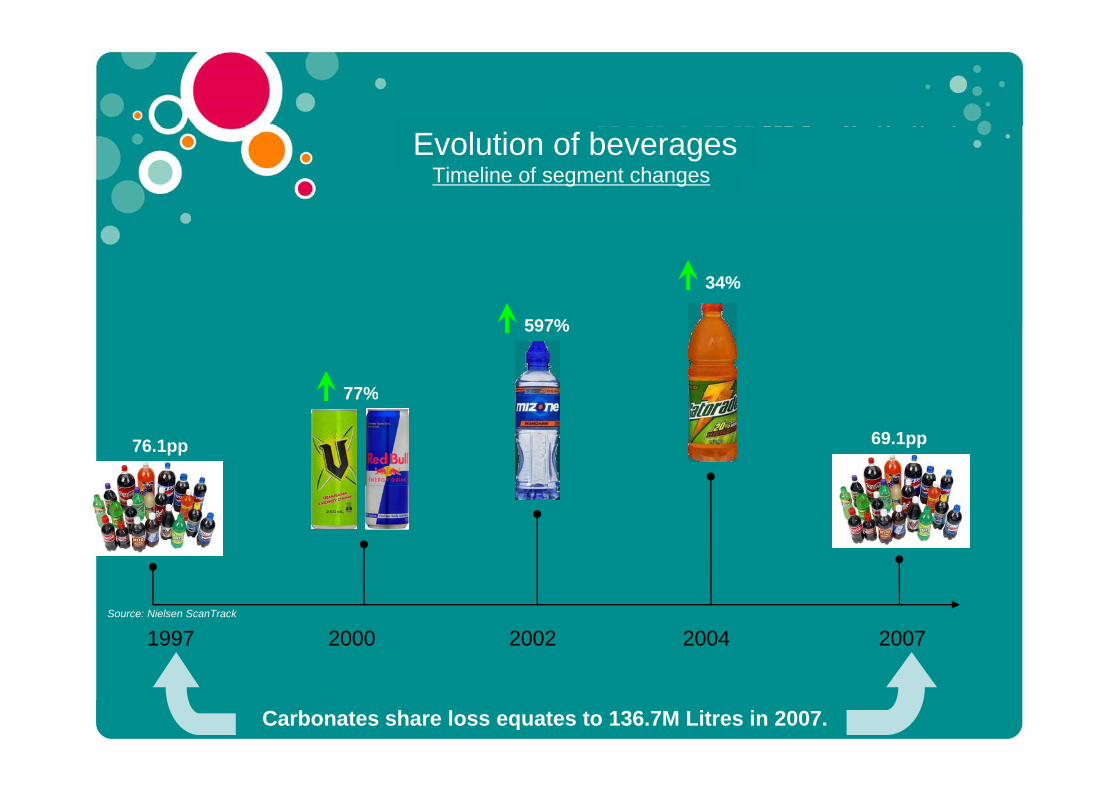
Evolution of beveragesTimeline of segment changes
34%
77%
597%
76.1pp
77%
69.1pp
1997 20072000 2002 2004Source: Nielsen ScanTrack
Carbonates share loss equates to 136.7M Litres in 2007.

This shift has resulted in emerging segments like This shift has resulted in emerging segments like Water, Energy and Sports gaining share.Water, Energy and Sports gaining share.
National Grocery | Trended Volume Share of NARTD Volume = Litres (000's)
6 4 8 28.1 8.7 9.4 10.525.0
30.0
35.0
1.0 0.9 0.9 0.90.9 0.9 0.9
1.1 1.3 1.7 1.84.0 5.3 5.9 6.1
6.4 7.4 8.2
15.0
20.0
25.0
18.7 18.3 18.2 18.4 19.7 18.5 18.1 19.4 18.7 18.4 16.9
0 0
5.0
10.0
0.0YEAR1997
YEAR1998
YEAR1999
YEAR2000
YEAR2001
YEAR2002
YEAR2003
YEAR2004
YEAR2005
YEAR2006
YEAR2007
TOTAL ENERGY DRINKS TOTAL FRUIT JUICE & DRINK TOTAL SPORTS DRINKS
TOTAL STILL WATER NON PURE TOTAL STILL WATER PURE TOTAL TEASource: Nielsen ScanTrack
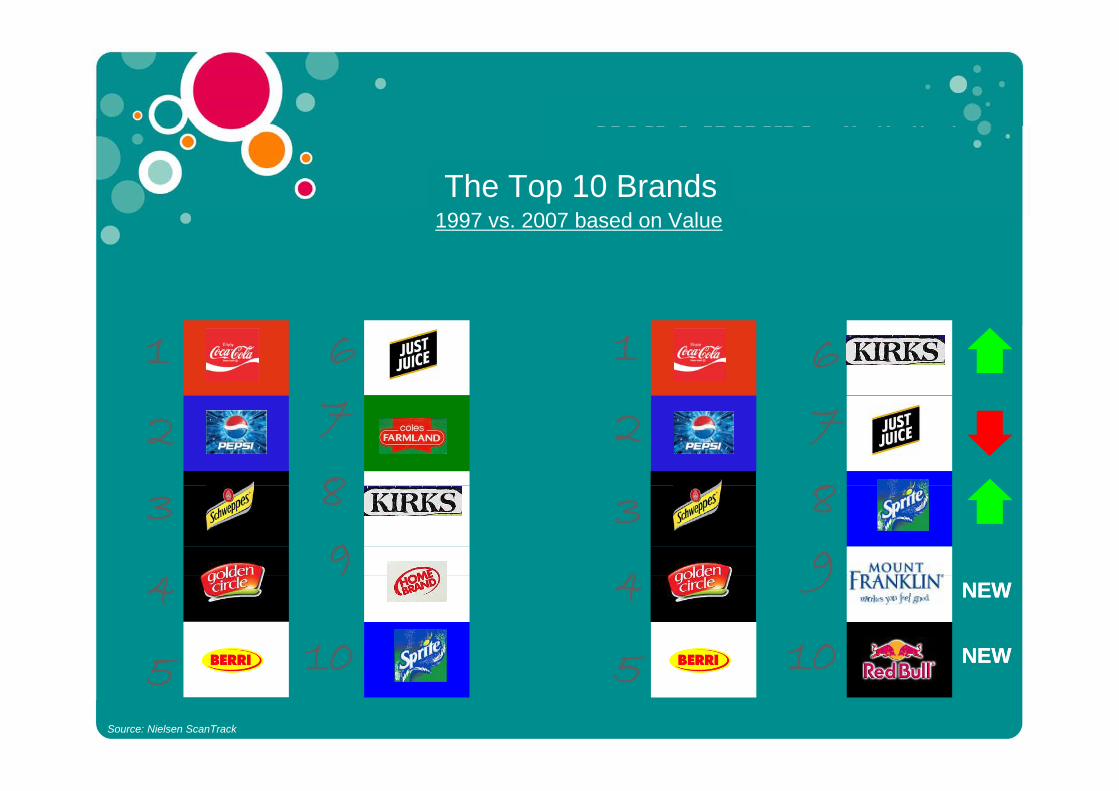
The Top 10 Brands1997 2007 b d V l1997 vs. 2007 based on Value
1 16 6
28
27 7
83 8 3
49
8
94
5 5
4
10
9
10
NEWNEW
NEWNEW5 510 10Source: Nielsen ScanTrack

The Top 10 Brands1997 2007 b d V l1997 vs. 2007 based on Volume
1 16 6
28
27 7
8
NEWNEW
3 8
93
4
8
9NEWNEW
4
5 10
4
5
9
10 NEWNEW5 10 5 10Source: Nielsen ScanTrack
NEWNEW
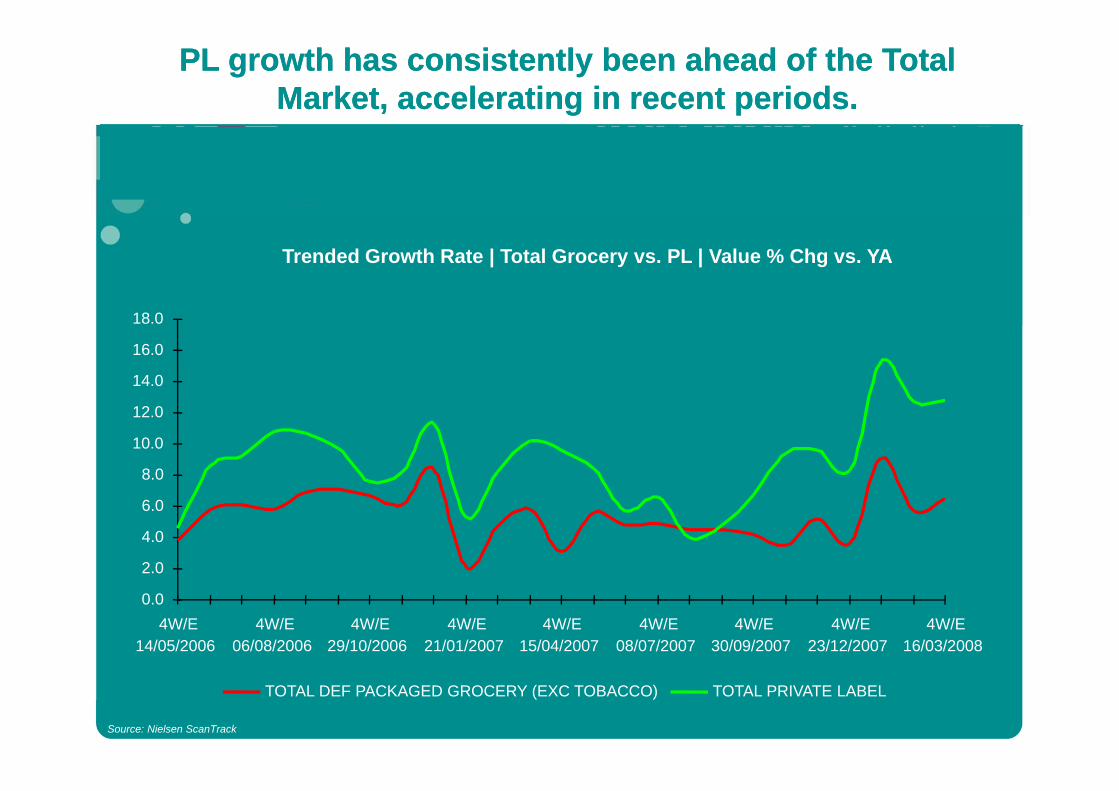
PL growth has consistently been ahead of the Total PL growth has consistently been ahead of the Total Market, accelerating in recent periods.Market, accelerating in recent periods.
Trended Growth Rate | Total Grocery vs. PL | Value % Chg vs. YA
14.0
16.0
18.0
8.0
10.0
12.0
2.0
4.0
6.0
0.04W/E
14/05/20064W/E
06/08/20064W/E
29/10/20064W/E
21/01/20074W/E
15/04/20074W/E
08/07/20074W/E
30/09/20074W/E
23/12/20074W/E
16/03/2008
Source: Nielsen ScanTrack
TOTAL DEF PACKAGED GROCERY (EXC TOBACCO) TOTAL PRIVATE LABEL
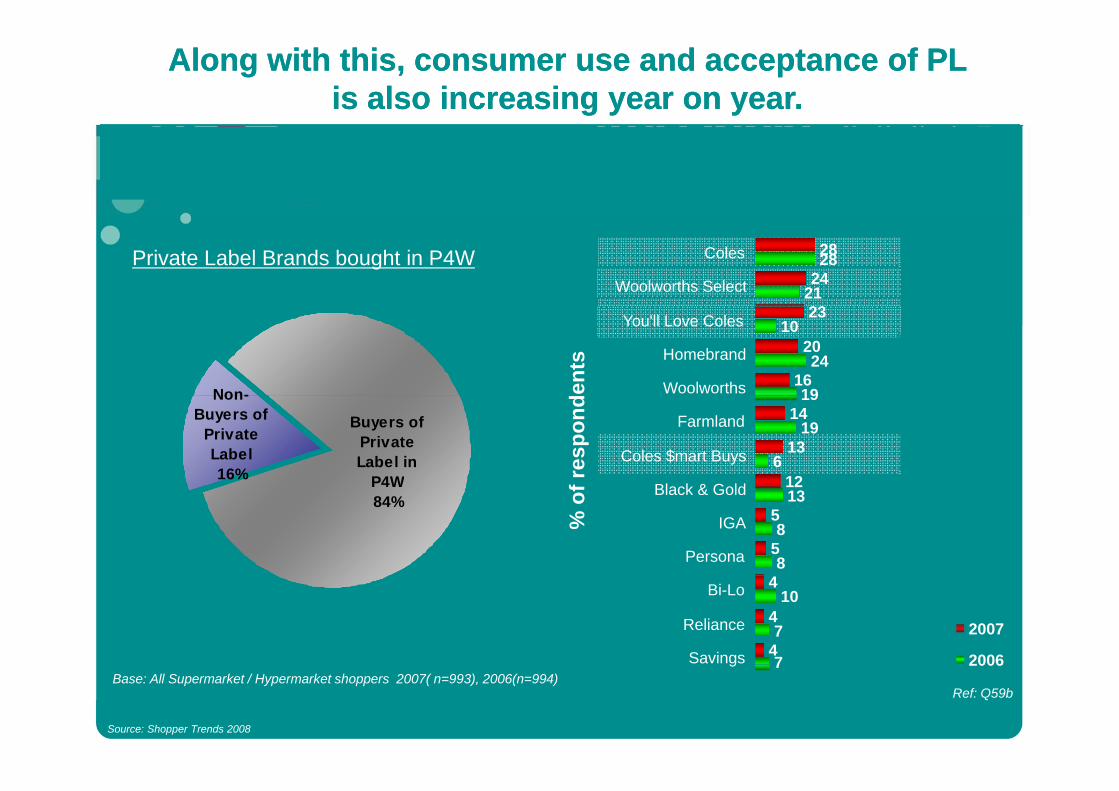
Along with this, consumer use and acceptance of PL Along with this, consumer use and acceptance of PL is also increasing year on year.is also increasing year on year.
Private Label Brands bought in P4W 28
2428
21
Coles
Woolworths Select
Non- ents
23
20
16
10
24
19
You'll Love Coles
Homebrand
Woolworths
Buyers of Private Label in
P4W
Non-Buyers of
Private Label16% f r
espo
nd
13
126
1419
19Farmland
Coles $mart Buys
Bl k & G ldP4W84%
% o
f 12
5
5
13
8
8
Black & Gold
IGA
Persona4
4
4
10
7
7
Bi-Lo
Reliance
Savings
2007
2006
Ref: Q59bBase: All Supermarket / Hypermarket shoppers 2007( n=993), 2006(n=994)
Source: Shopper Trends 2008
7g 2006
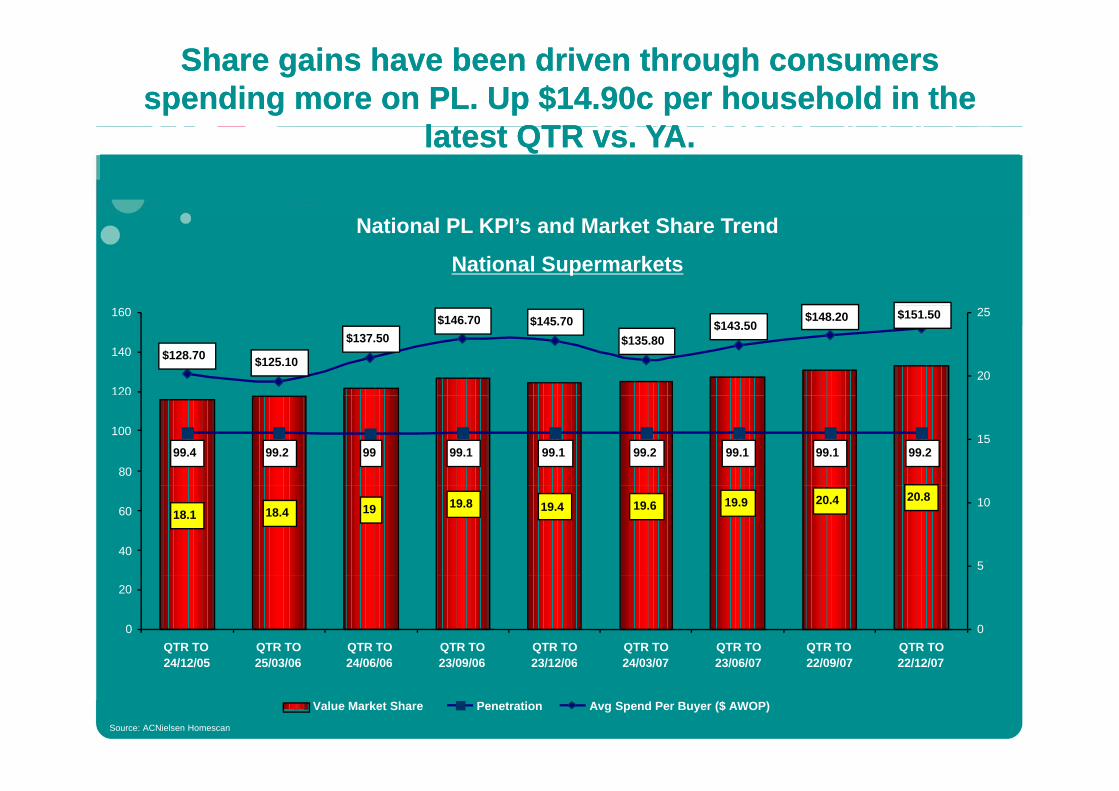
Share gains have been driven through consumers Share gains have been driven through consumers spending more on PL. Up $14.90c per household in the spending more on PL. Up $14.90c per household in the
l t t QTR YAl t t QTR YAlatest QTR vs. YA.latest QTR vs. YA.
National PL KPI’s and Market Share Trend
National Supermarkets
$128.70 $125.10
$137.50$146.70 $145.70
$135.80$143.50
$148.20 $151.50
120
140
160
20
25
99.4 99.2 99 99.1 99.1 99.2 99.1 99.1 99.280
10015
18.4 19 19.8 19.4 19.6 19.9 20.4 20.818.1
40
60
5
10
0
20
QTR TO24/12/05
QTR TO25/03/06
QTR TO24/06/06
QTR TO23/09/06
QTR TO23/12/06
QTR TO24/03/07
QTR TO23/06/07
QTR TO22/09/07
QTR TO22/12/07
0
24/12/05 25/03/06 24/06/06 23/09/06 23/12/06 24/03/07 23/06/07 22/09/07 22/12/07
Value Market Share Penetration Avg Spend Per Buyer ($ AWOP)
Source: ACNielsen Homescan

PL share growth has also been driven through Aldi. Aldi PL share growth has also been driven through Aldi. Aldi is also successfully attracting new shoppers through is also successfully attracting new shoppers through
new store openingsnew store openings
ALDI PL KPI’s and Market Share Trend
new store openings.new store openings.
ALDI PL KPI s and Market Share Trend
Total Aldi
$153.90$144 30 $146 20
160 100$141.90
$132.00
$143.50 $143.80
$131.10 $133.80
$144.30 $146.20
120
140
707580859095
92.4 91.9 93.1 92.5 92.5 91.2 91.4 93.190.680
100
40455055606570
20
40
60
152025303540
15 16.5 17.2 18.4 19.8 20.2 21.2 23.2 24.1
0
20
QTR TO24/12/05
QTR TO25/03/06
QTR TO24/06/06
QTR TO23/09/06
QTR TO23/12/06
QTR TO24/03/07
QTR TO23/06/07
QTR TO22/09/07
QTR TO22/12/07
0510
Value Market Share Penetration Avg Spend Per Buyer ($ AWOP)
Source: ACNielsen Homescan
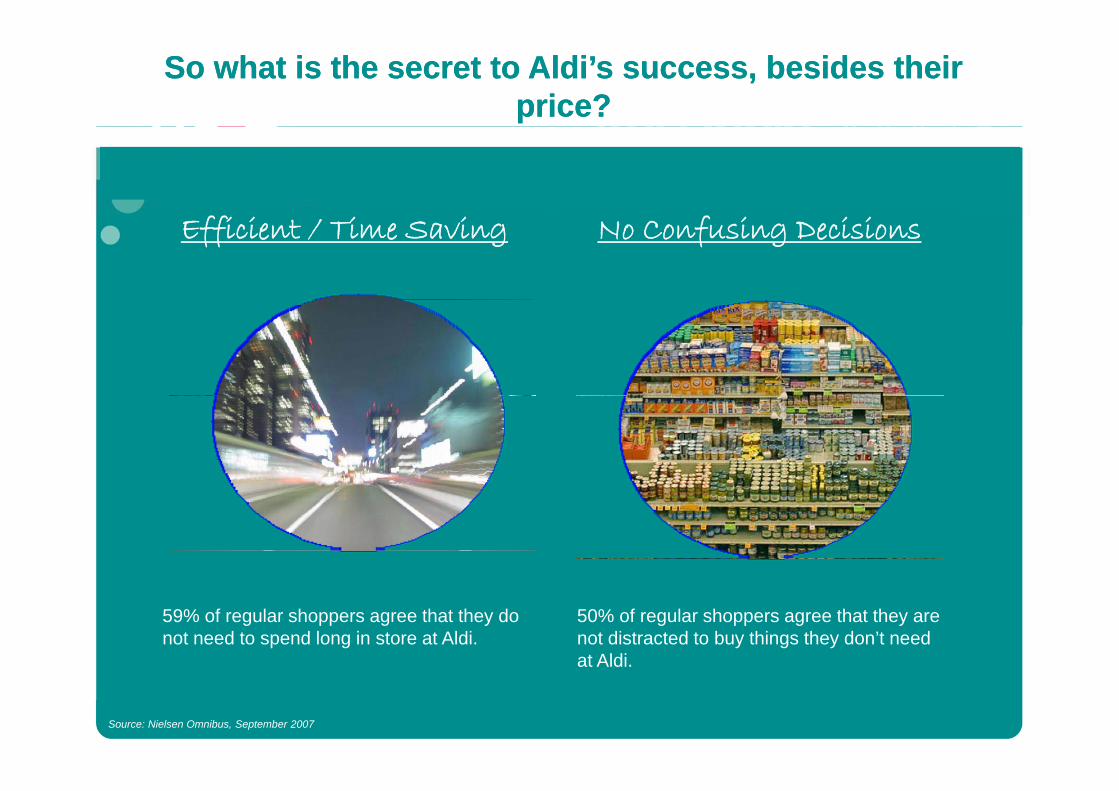
So what is the secret to Aldi’s success, besides their So what is the secret to Aldi’s success, besides their price?price?
ff fEfficient / Time Saving No Confusing Decisions
59% of regular shoppers agree that they do not need to spend long in store at Aldi.
50% of regular shoppers agree that they are not distracted to buy things they don’t need at Aldi.
Source: Nielsen Omnibus, September 2007
at Aldi.

and how is this impacting NARTD?

Overall however we are not seeing PL gain share Overall however we are not seeing PL gain share within the Beverages category in Grocery.within the Beverages category in Grocery.
f | 1997| 2007The impact of PL on NARTD | 1997| 2007
Branded Beverages
PL Bevs11.9%share
Branded Beverages
PL Bevs9.0%share
88.1% shareBranded Beverages
91.0% share
Source: Nielsen ScanTrack
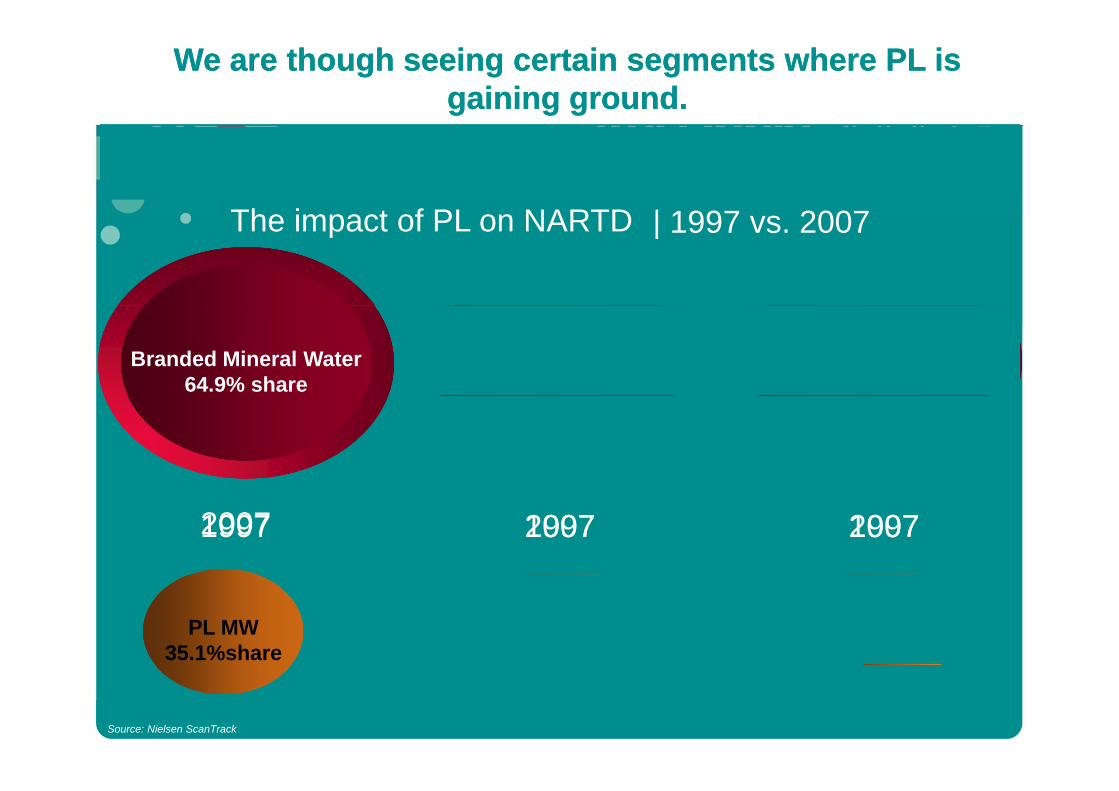
We are though seeing certain segments where PL is We are though seeing certain segments where PL is gaining ground. gaining ground.
The impact of PL on NARTD | 1997 s 2007The impact of PL on NARTD | 1997 vs. 2007
Branded Mineral Water76.4% share
Branded Mineral Water64.9% share
Branded Water87.8% share
Branded Water83.6% share
Branded Juice91.5% share
Branded Juice87.5% share
2007 2007 20071997 1997 1997
PL MW23.6%share
PL MW35.1%share
PL Water12.2%share
PL Water16.4%share
PL Juice8.5%share
PL Juice12.5%share
Source: Nielsen ScanTrack

And its easy to see why….And its easy to see why….
14c / 100ml 9c / 100ml
5c / 100ml 20c / 100ml
14c / 100ml 11c / 100ml
Source: Coles Online
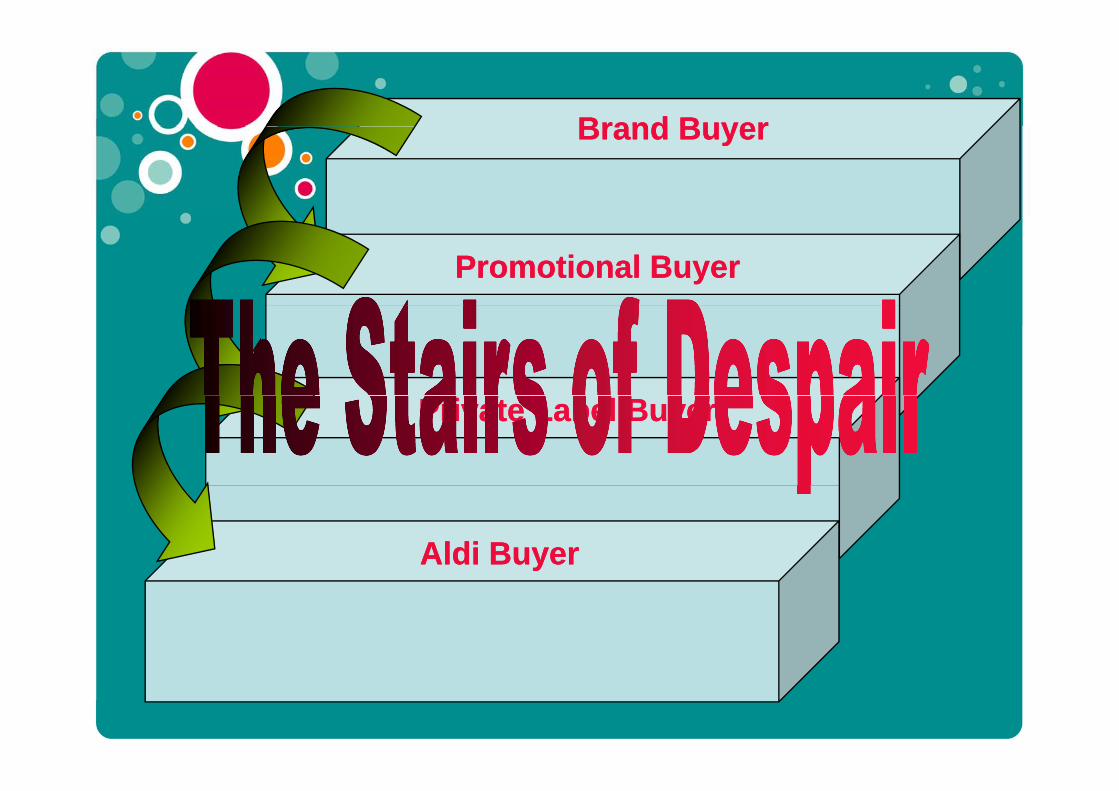
Brand BuyerBrand BuyerBrand BuyerBrand Buyer
Promotional BuyerPromotional Buyer
Private Label BuyerPrivate Label Buyer
Aldi BuyerAldi Buyer
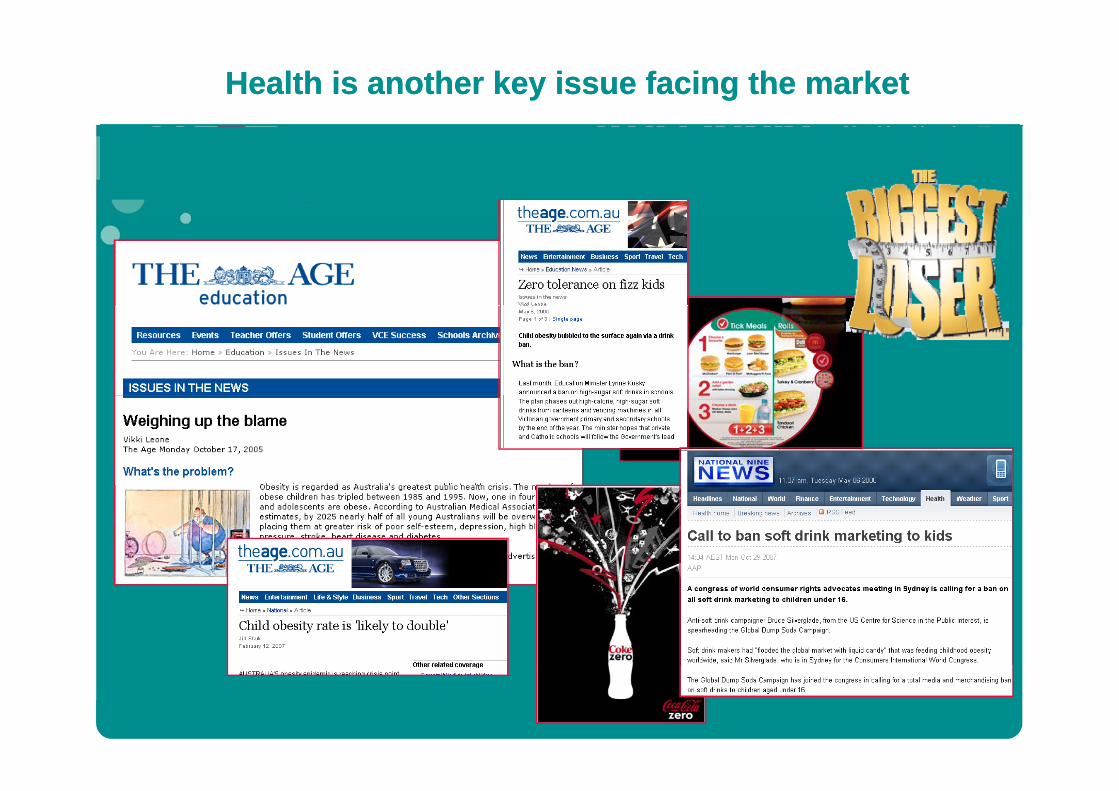
Health is another key issue facing the marketHealth is another key issue facing the market

And as a result, Diet items are growing significantly And as a result, Diet items are growing significantly ahead of non diet beverages.ahead of non diet beverages.
National Grocery | Volume % Change vs. YAVolume = Litres (000's)
16 718.0
12.0
16.7
12.0
14.0
16.0
6 86 7
10.29.2
7.18.18.0
10.0
6.1
2.1
6.16.8
4.5
2.1
5.86.7
4.93.3
4.7
2.0
4.0
6.0
-0.2-1.4
0.9
-2.0
0.0YEAR1998
YEAR1999
YEAR2000
YEAR2001
YEAR2002
YEAR2003
YEAR2004
YEAR2005
YEAR2006
YEAR2007
-4.0
TOTAL NON-DIET TOTAL DIETSource: Nielsen ScanTrack

Which has resulted in Diet gaining over 10 share Which has resulted in Diet gaining over 10 share points over the last 10 years.points over the last 10 years.
National Grocery | Diet vs. Non Diet Share of NARTD Volume = Litres (000's)( )
70%80%90%
100%
40%50%60%70%
26.0 27.0 27.9 27.7 27.0 28.1 29.5 29.7 31.4 35.1 36.010%20%30%40%
0%YEAR1997
YEAR1998
YEAR1999
YEAR2000
YEAR2001
YEAR2002
YEAR2003
YEAR2004
YEAR2005
YEAR2006
YEAR2007
Source: Nielsen ScanTrackdiet non diet
Current landscapeNational consumption, segment shares and segment profiles

Homescan per capitaHomescan, per capita consumption nationally.p y
AVG 116 8LAVG - 116.8L
AVG 111 2L
AVG – 98.4L
AVG – 111.2L
AVG – 102 8LAVG – 127.0L
AVG – 102.8L
AVG – 78.7L
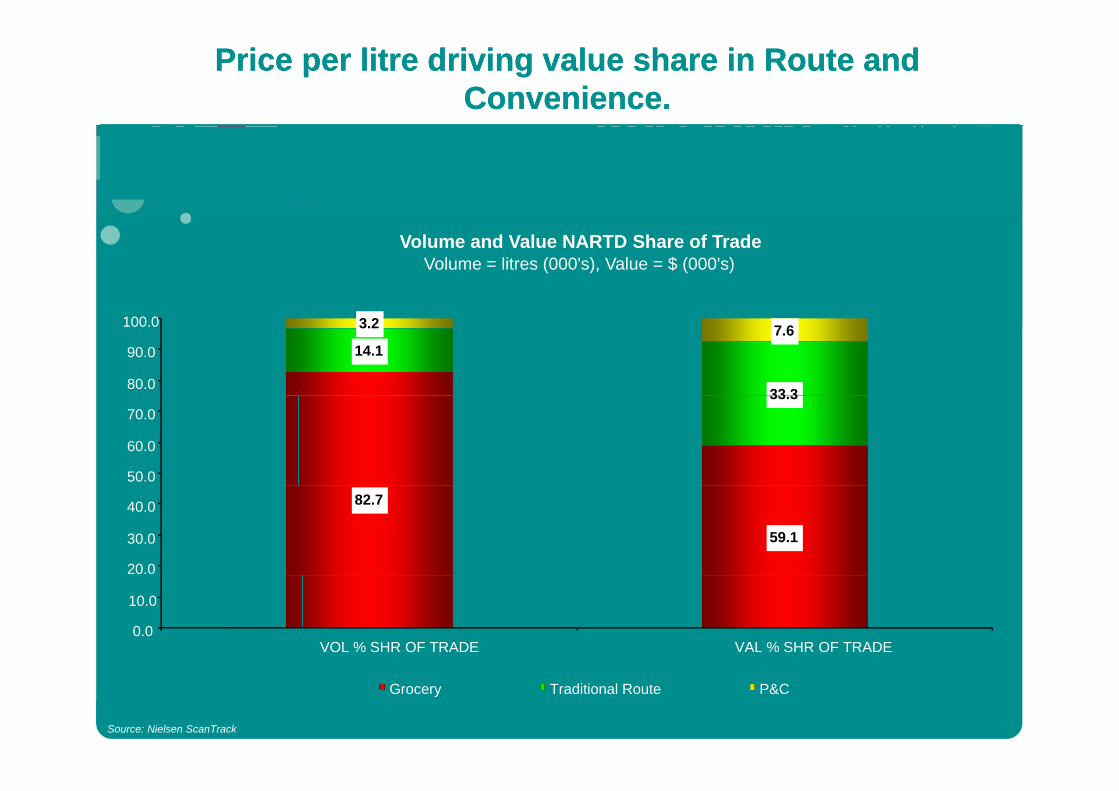
Price per litre driving value share in Route and Price per litre driving value share in Route and Convenience.Convenience.
Volume and Value NARTD Share of Trade Volume = litres (000's), Value = $ (000's)
14.1
33 3
3.2 7.6
80.0
90.0
100.0
33.3
50.0
60.0
70.0
82.7
59.1
20.0
30.0
40.0
0.0
10.0
VOL % SHR OF TRADE VAL % SHR OF TRADE
Grocery Traditional Route P&C
Source: Nielsen ScanTrack

While the emerging segments value share is higher While the emerging segments value share is higher than their volume share due to the higher price.than their volume share due to the higher price.
Value and Volume Segment Share of NARTD Volume = Litres (000's), Value = $ (000's)
70 080.0
90.0
100.0
10.9%
11.3%16.1%
7 5%
40.0
50.0
60.0
70.016.9%
19.7%
7.5%
0 0
10.0
20.030.0 60.9%56.7%
0.0
VAL % SHARE VOL % SHARE
TOTAL SOFT DRINKS TOTAL FRUIT JUICE & DRINK TOTAL STILL WATER
TOTAL ENERGY DRINKS TOTAL SPORTS DRINKS TOTAL MIXERSTOTAL ENERGY DRINKS TOTAL SPORTS DRINKS TOTAL MIXERSTOTAL MINERAL WATERS TOTAL TEA
Source: Nielsen ScanTrack

Cola Flavoured Carbonated Beverages
25 – 54 year olds25 54 year olds
Married with kids, older and younger families
Lower blue collar occupation
Skewed towards QLD families
Source: Nielsen Omni
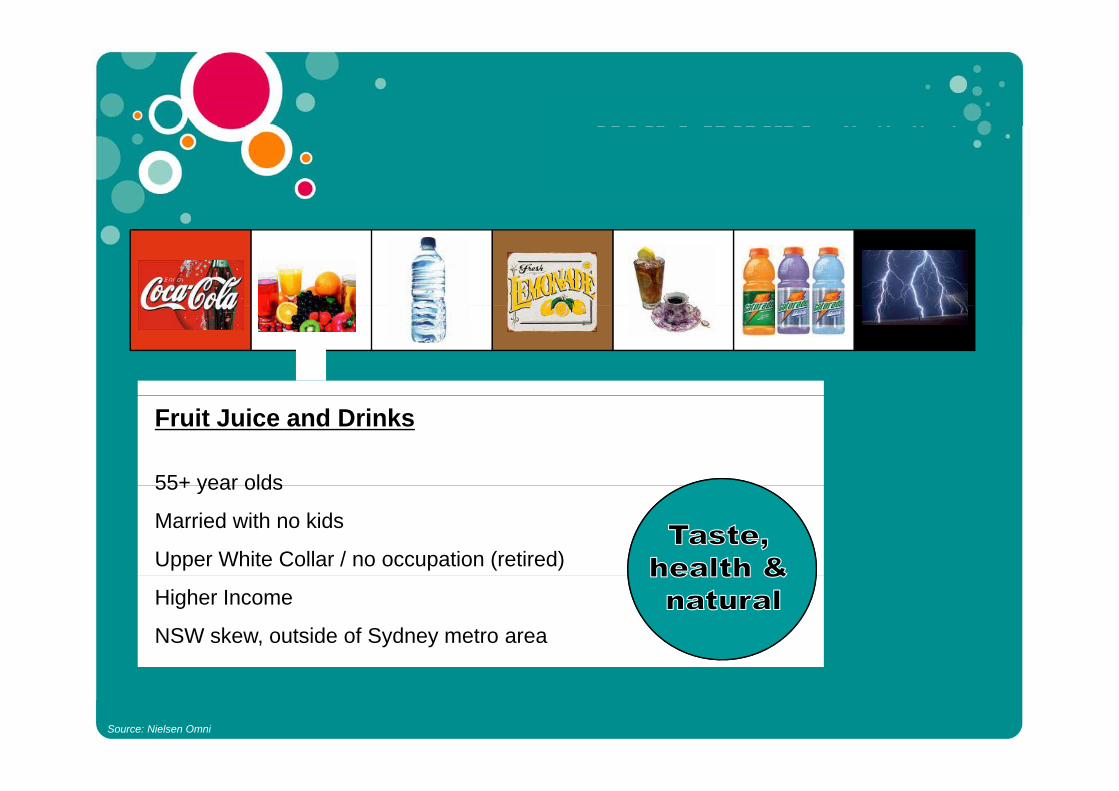
Fruit Juice and Drinks
55+ year olds55+ year olds
Married with no kids
Upper White Collar / no occupation (retired)
Higher Income
NSW skew, outside of Sydney metro area
Source: Nielsen Omni

Still Bottled Water
FemaleFemale
18 - 24 year olds
Skewed towards the Sydney metro area
Source: Nielsen Omni
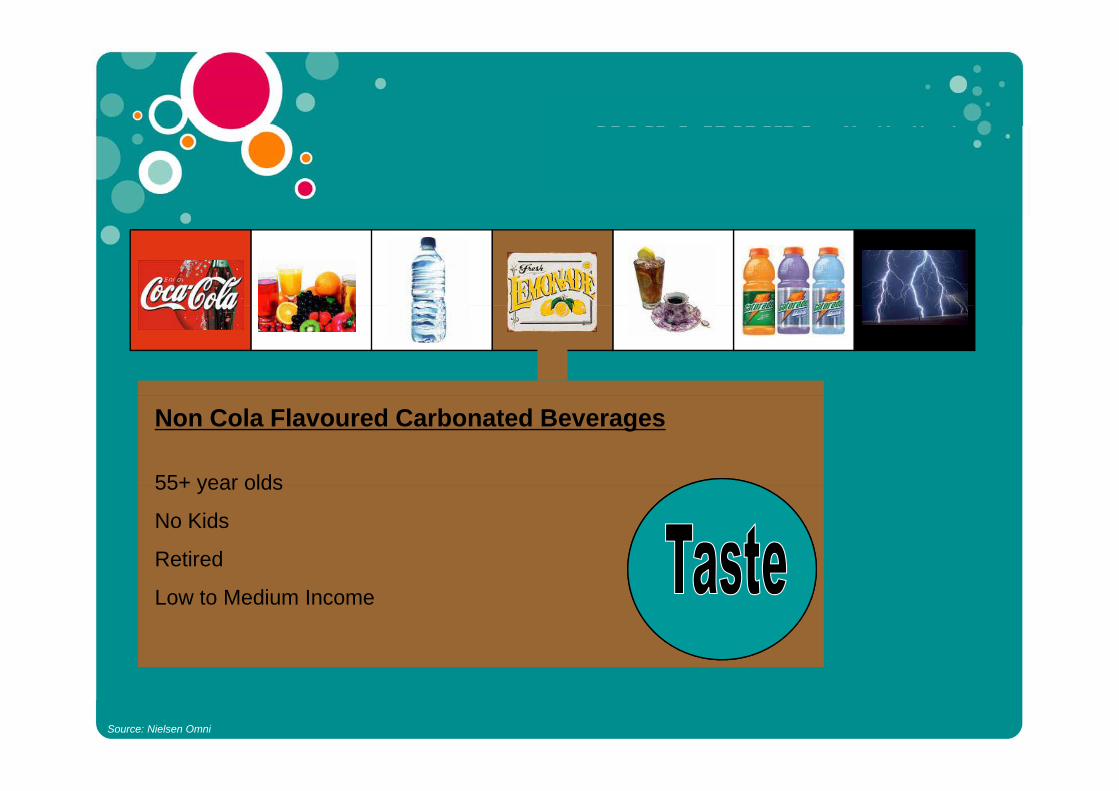
Non Cola Flavoured Carbonated Beverages
55+ year olds55+ year olds
No Kids
Retired
Low to Medium Income
Source: Nielsen Omni
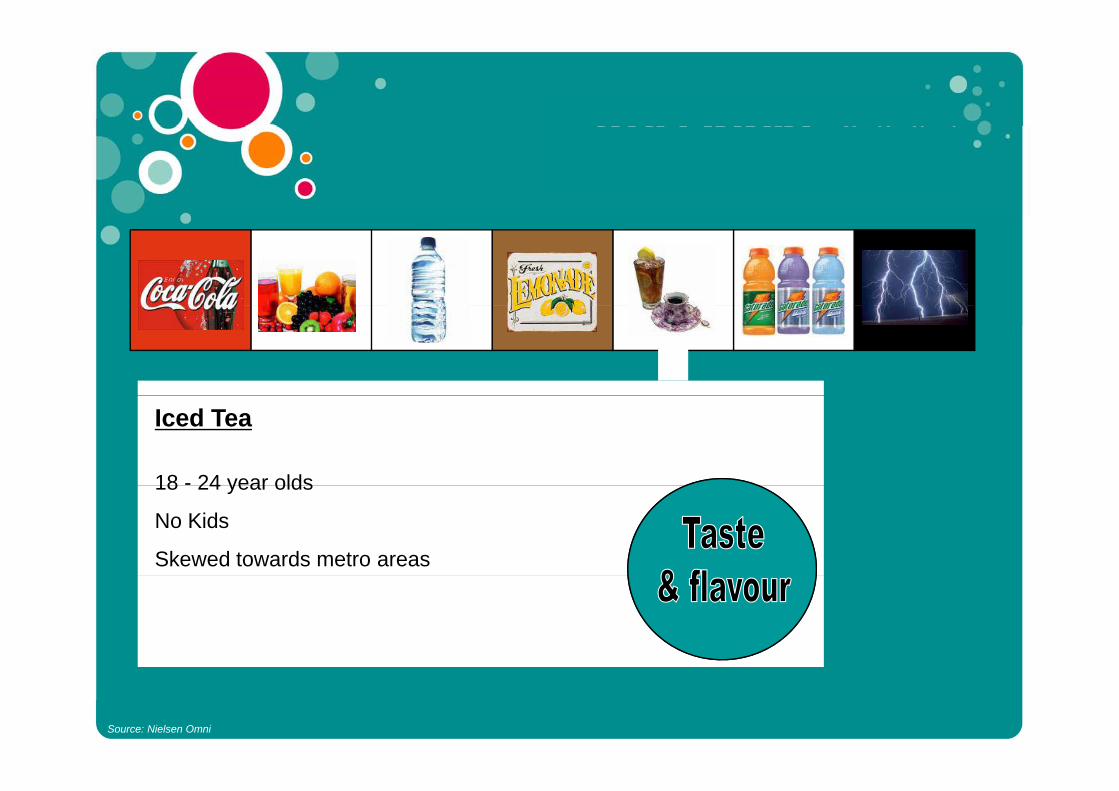
Iced Tea
18 - 24 year olds18 24 year olds
No Kids
Skewed towards metro areas
Source: Nielsen Omni

Sports Drinks
MalesMales
18-39 year olds
Blue Collar
Low to Medium income
Perth and Queensland area
Source: Nielsen Omni

Energy Drinks
18 -24 year olds18 24 year olds
Single with no kids
Upper blue collar
Skewed towards Melb, QLD and SA
Source: Nielsen Omni
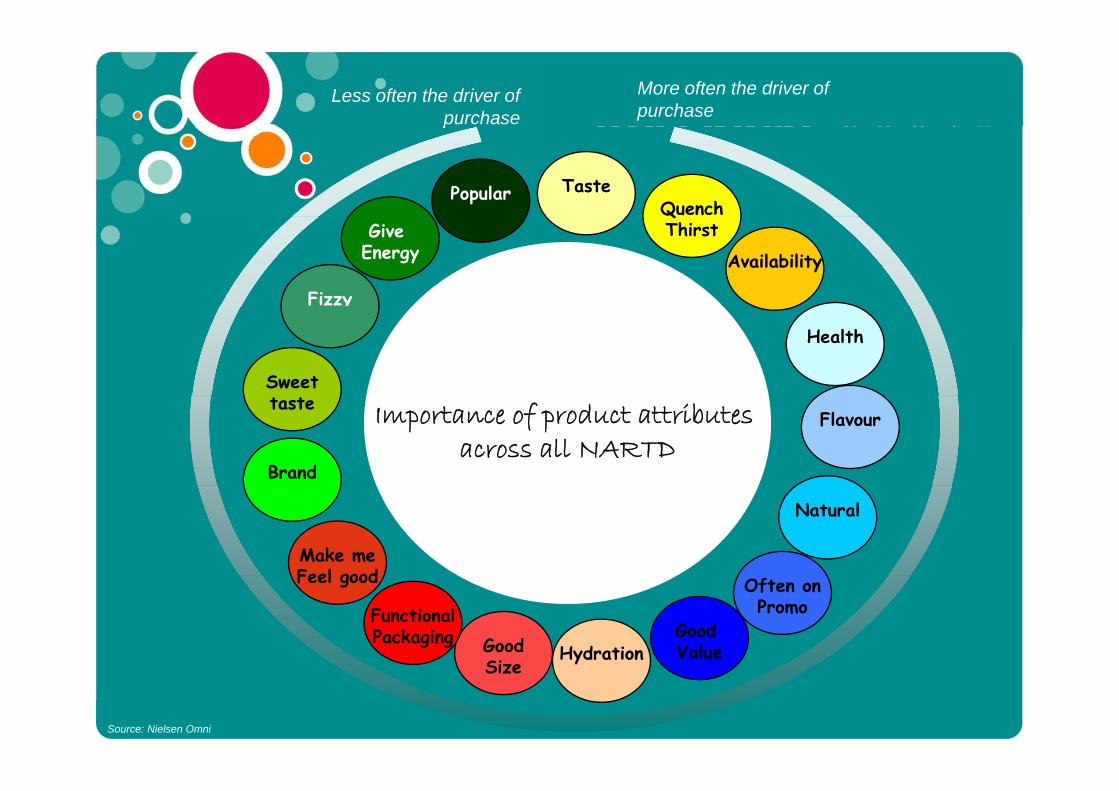
More often the driver of purchase
Less often the driver of purchase
QuenchPopular Taste
p
QThirst
Availability
Fizzy
Give Energy
Health
Sweet
Flavour
Brand
taste Importance of product attributes across all NARTD
Natural
Make meFeel good Often on
PromoGood ValueHydrationGood
Size
FunctionalPackaging
Feel good
Size
Source: Nielsen Omni
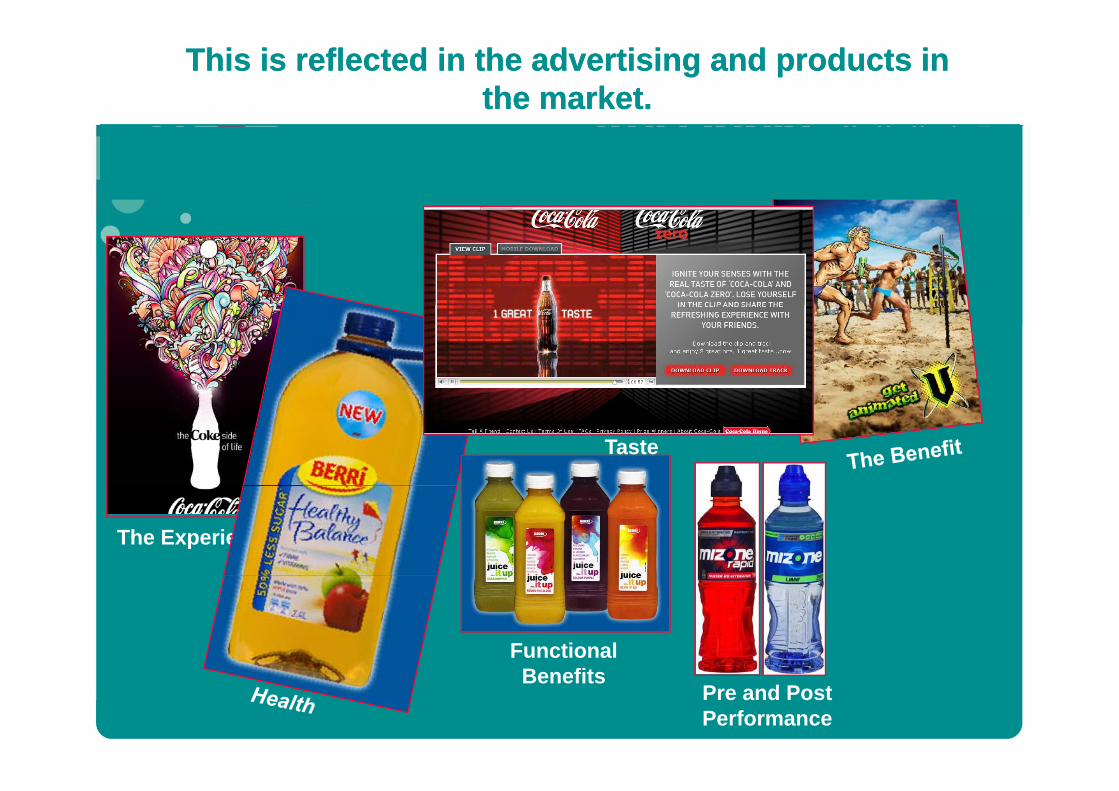
This is reflected in the advertising and products in This is reflected in the advertising and products in the market.the market.
Taste
The Experience
Functional Benefits
Pre and Post Performance

Looking forward | consumer trendsMega Trends

Mega TrendsMega TrendsMega TrendsMega TrendsS i th Pl t Aff d bl l i Ev da T h lSaving the Planet Affordable luxuries Everyday Technology
• Local sourcing • Added value services• Local sourcing
• Natural production/organic
• Sustainable manufacturing
• Added value services
• Premium product/quality
• Customisation/one offs/exclusivity
• Brand information access
• Media selection & relevance to target consumer/shopper
Sustainable manufacturing
• Protects scarce energy/water resources
Customisation/one offs/exclusivity
• Speciality sourced/expert endorsement
• Simple messages/cut through
• Product benefits not ingredients
• Recyclable materials • Mobile lifestyles
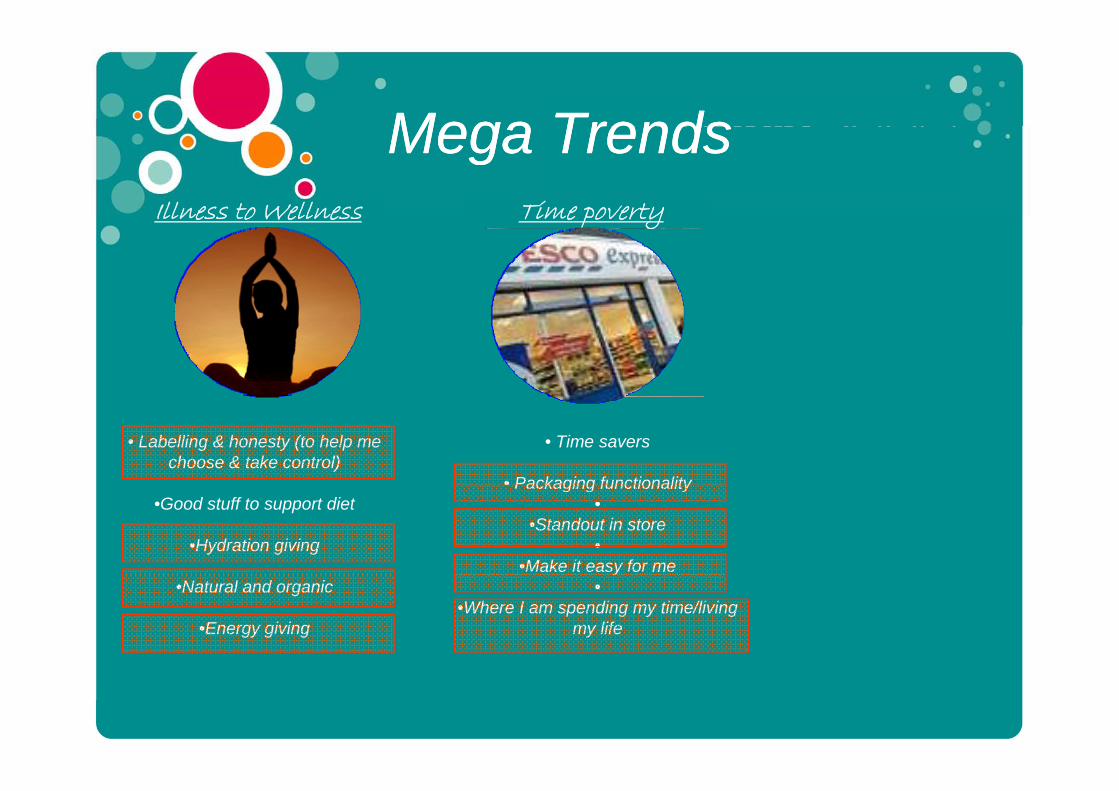
Mega TrendsMega TrendsMega TrendsMega TrendsIllness to Wellness Time povertyIllness to Wellness Time poverty
• Labelling & honesty (to help me choose & take control)
• Time savers
• Packaging functionality•Good stuff to support diet
•Hydration giving
Packaging functionality•
•Standout in store•
•Make it easy for me•Natural and organic
•Energy giving
y•
•Where I am spending my time/living my life

Summing up the Summing up the pastpast, present and future, present and future
• In the past we have seen share gains from the emerging p g g gsegments of Energy, Sports and Water.– These segments have also been key in driving growth for
Beverages over the last 10 yearsBeverages over the last 10 years.
• Over the last few years we have seen a shift towards PL within T t l G ll t i BTotal Grocery as well as some segments in Beverages. – The major threat is towards Natural or non Flavoured products
which are used as moderators.
• Health has also become a major factor within beverages.Banning some drinks in schools shows like The Biggest Loser etc– Banning some drinks in schools, shows like The Biggest Loser etc have changed consumers perceptions, which has resulted in strong growth for Diet Beverages.
Summing up the past, Summing up the past, presentpresent and futureand future
• Currently South Australians are the heaviest per capita y p pconsumers of Beverages.
Th h l lit G ti f th 8L i• The channel split sees Grocery accounting for more than 8L in every 10L purchased.– From a value point of view however Convenience and Route
account for about 40% of the market.
• The most common driver for purchase across all beverages isThe most common driver for purchase across all beverages is Taste with Thirst Quench and Availability also important.– From a segment level however these do change.

Summing up the past, present and Summing up the past, present and futurefuture
• Going forward there will be renewed pressure on manufacturers g pand retailers to provide consumers with more.
There will be a focus on health and the environment through natural– There will be a focus on health and the environment through natural products and packaging.
– Consumer Generated Media will be an important data source for manufacturers to understand how consumers feel and interact withmanufacturers to understand how consumers feel and interact with their brands.
– Consumers will look to manufacturers to provide them more from th k t i t it i d t h l th f lthe same pack, more nutrients, vitamins and more to help them feel better.
– And finally, how will manufacturers provide consumers with a d t th t th th t ith th i li ?product that they can use as they get on with their lives?
• Functional Packaging, in store media / theatre and assisting consumers in making it easy.

Thank You


