JPL PUBLICATION 85-78 (NASA-Cfi-176528) SOLAB CEIL CALIBRATION N86-19585 FACILITY VALIEA1ICN Cf faALLCCN fLIGHI DATA: * COMPARISON Cf SEUTTLI ANE EALLOON FLIGHT i£SOLlS (Jet Prcpulsicr Lat.) 36 p Unclas 3C A03/MF A01 CSCL 14B G3/35 05458 Solar Cell Calibration Facility Validation of Balloon Flight Data A Comparison of Shuttle and Balloon Flight Results B. E. Anspaugh R. G. Downing L B. Sidwell October 15, 1985 NASA National Aeronautics and Space Administration Jet Propulsion Laboratory California Institute of Technology Pasadena, California
Transcript
JPL PUBLICATION 85-78
( N A S A - C f i - 1 7 6 5 2 8 ) SOLAB CEIL C A L I B R A T I O N N86-19585F A C I L I T Y V A L I E A 1 I C N C f f a A L L C C N f L I G H I D A T A :* C O M P A R I S O N Cf SEUTTLI ANE E A L L O O N FLIGHTi£SOLlS (Jet Prcpulsicr Lat . ) 36 p Unclas3C A03/MF A01 CSCL 14B G3/35 05458
Solar Cell Calibration FacilityValidation of Balloon Flight Data
A Comparison of Shuttle and BalloonFlight Results
B. E. AnspaughR. G. DowningL B. Sidwell
October 15, 1985
NASANational Aeronautics andSpace Administration
Jet Propulsion LaboratoryCalifornia Institute of TechnologyPasadena, California
TECHNICAL REPORT STANDARD TITLE PAGE
1. Report No. oz_-jo
4. Title and SubtitleSolar Cell Calibration FaciliFlight Data; A Comparison ofResults
7. Author(s) B t E > Anspaugh> R>G
9. Performing Organization Name or
JET PROPULSION LAB(California Institul4800 Oak Grove DriiPasadena, Calif orn:
2. Government Accession No.
ty Validation of BalloonShuttle and Balloon Flight
. Downing, L.B. Sidwell
id Address
3RATORY:e of Technologyrela 91109
12. Sponsoring Agency Nome and Address
NATIONAL AERONAUTICS AND SPACE ADMINISTRATIONWashington, D.C. 20546
3. Recipient's Catalog No.
5. Report Date
6. Performing Organization Code
8. Performing Organization Report No.
10. Work Unit No.
11. Contract or Grant No.NAS7-918
13. Type of Report and Period Covered
External ReportJPL Publication
14. Sponsoring Agency Code
RE156 BK-506-55-45-06-0015. Supplementary Notes
16. Abstract
The Solar Cell Calibration Facility (SCCF) experiment was designed and built toft*
evaluate the effect of the earth's upper atmosphere on the calibration of solar cell
standards. During execution of the experiment, a collection of carefully selected
solar cells was flown on the shuttle, and reflown on a high-altitude balloon, then
their outputs were compared. After correction to standard temperature and intensity
values of 28 deg C and an earth-sun distance of 1 AU, the solar cell outputs during
the two flights were found to be identical. The conclusion is therefore that the
high-altitude balloon flights are very good vehicles for calibrating solar cells for
use as space flight reference standards.
17. Key Words (Selected by Author(s))
Spacecraft Design, Testing, and Per-formance; Spacecraft Propulsion andPower; Power Sources; Laboratories,Test Facilities, and Test Equipment
18. Distribution Statement
Unclassified; unlimited
19. Security Clossif. (of this report)
Unclassified
20. Security Clossif. (of this page)
Unclassifed
21. No. of Poges 22. Price
JPL 0184 R 9183
JPL PUBLICATION 85-78
Solar Cell Calibration FacilityValidation of Balloon Flight DataA Comparison of Shuttle and BalloonFlight Results
B. E. AnspaughR. G. DowningL B. Sidwell
October 15, 1985
NASANational Aeronautics andSpace Administration
Jet Propulsion LaboratoryCalifornia Institute of TechnologyPasadena, California
The research described in this publication was carried out by the Jet PropulsionLaboratory, California Institute of Technology, under a contract with the NationalAeronautics and Space Administration.
Reference herein to any specific commercial product, process, or service by tradename, trademark, manufacturer, or otherwise, does not constitute or imply itsendorsement by the United States Government or the Jet Propulsion Laboratory,California Institute of Technology.
ABSTRACT
The Solar Cell Calibration Facility (SCCF) experiment was designed and
built to evaluate the effect of the earth's upper atmosphere on the
calibration of solar cell standards. During execution of the experiment, a
collection of carefully selected solar cells was flown on the shuttle, and
reflown on a high-altitude balloon, then their outputs were compared. After
correction to standard temperature and intensity values of 28 deg C and an
earth-sun distance of 1 AU, the solar cell outputs during the two flights
were found to be identical. The conclusion is therefore that the high-
altitude balloon flights are very good vehicles for calibrating solar cells
for use as space flight reference standards.
iii
ACKNOWLEDGMENTS
The authors take pleasure in acknowledging the support and assistance
of a great number of people who made this experiment possible, most notably
Jerome Mull in, formerly of NASA Headquarters, who gave prograjnmatic support,
Bob Mueller of JPL, who wired the panel and helped with the environmental
testing, Bob Weiss of JPL, who manufactured the modules, performed the
simulator measurements, and participated in the balloon flight operations,
Randy Webster, Edith Nir, and Steve Donnelly, who wrote most of the analysis
software, Astronaut Judy Resnick, who operated the experiment during its
flight on Discovery, and the entire staff at the National Scientific Balloon
Facility, who flew the high-altitude balloon.
iv
CONTENTS
1. INTRODUCTION 1
2. EXPERIMENT DESCRIPTION 3
2.1 OPERATIONAL SEQUENCE 3
2.2 SOLAR CELL DESCRIPTION 4
3. SHUTTLE FLIGHT 9
3.1 SHUTTLE DATA ACQUISITION SYSTEM 9
3.2 SHUTTLE FLIGHT DATA ANALYSIS 11
4. BALLOON FLIGHT 19
4.1 BALLOON DATA SYSTEM 19
4.2 BALLOON DATA ANALYSIS 23
5. COMPARISON OF SHUTTLE AND BALLOON FLIGHT RESULTS 25
6. CONCLUSIONS 28
REFERENCES 29
Figures
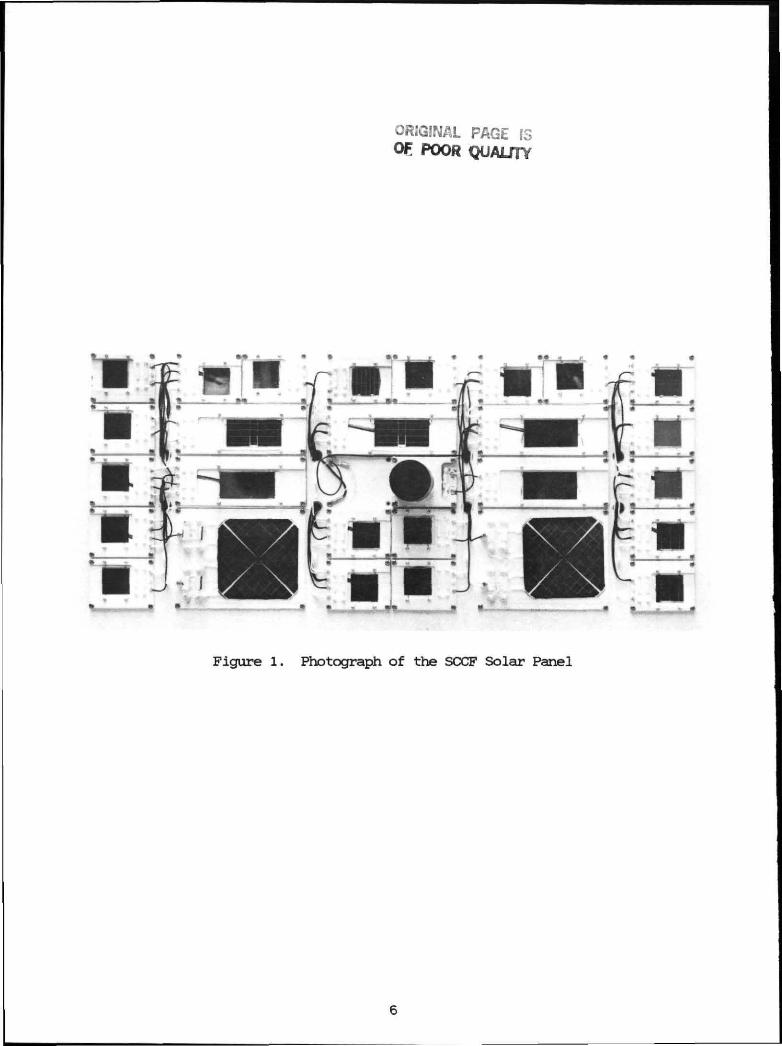
1. Photograph of the SCCF Solar Panel 6
2. Schematic Layout of the SCCF Solar Panel 7
3. Block Diagram of the SCCF Flight Data System 10
4. Plot of Ch.l Output (Cell 81-002) vs. Time During Orbit 4 . . 13
5. Plot of Temperature vs. Time for Channel 41 During Orbit 4 . 14
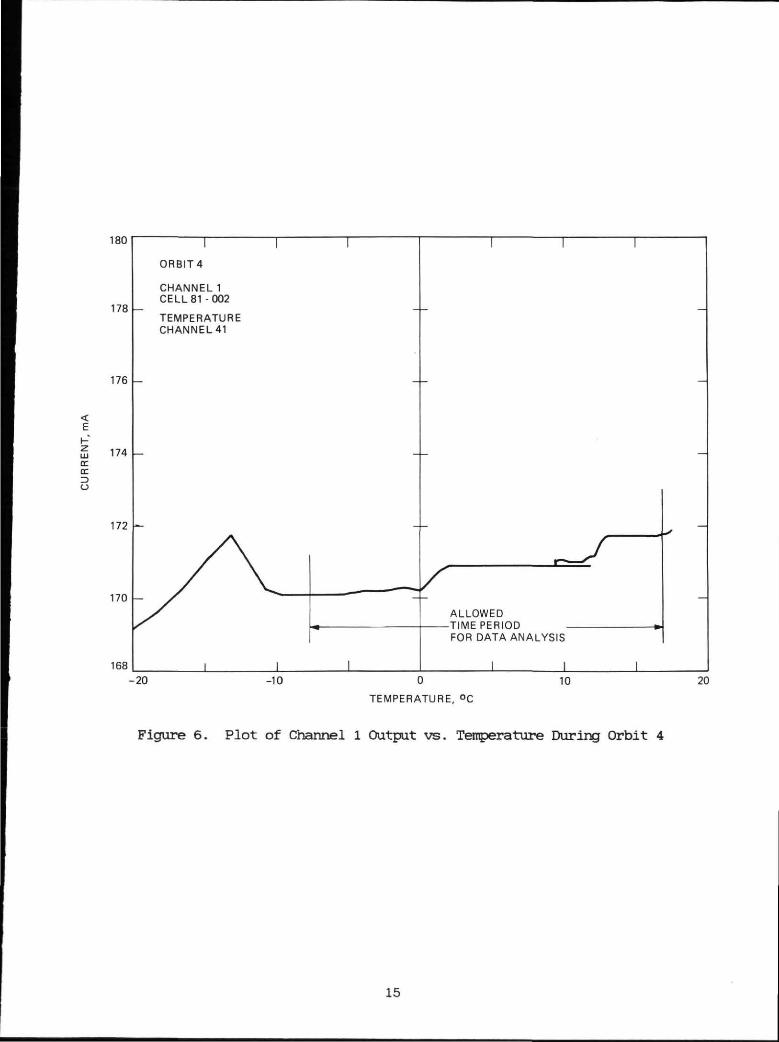
6. Plot of Ch. 1 Output vs. Temperature During Orbit 4 15
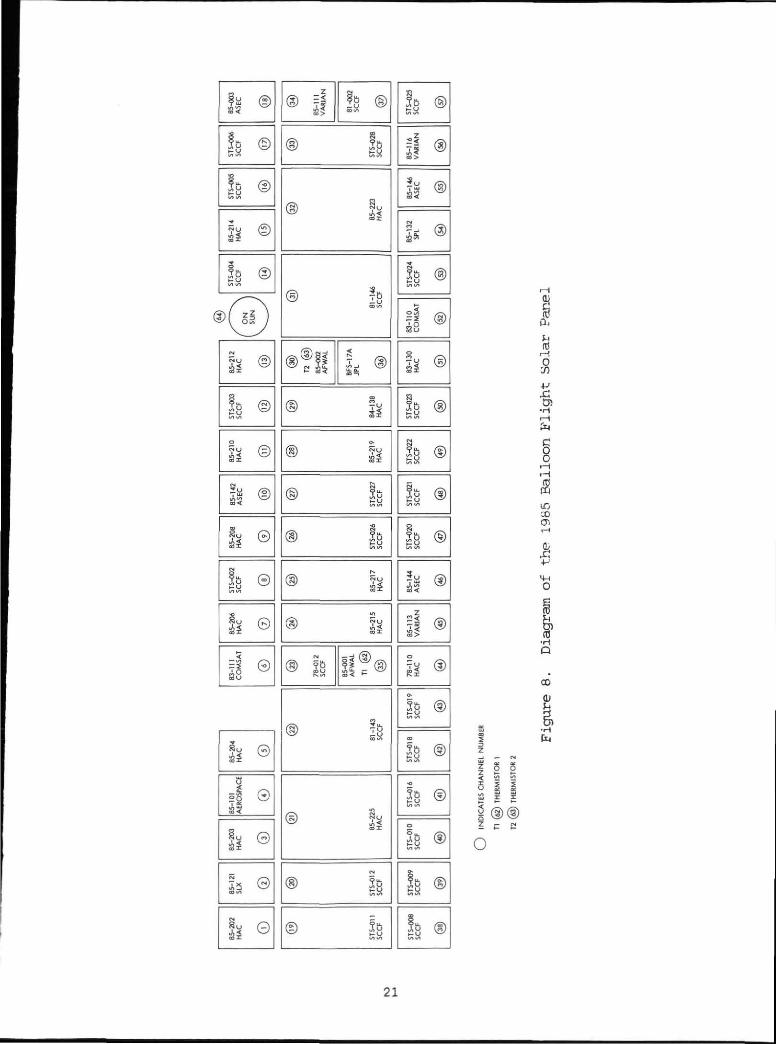
7. Photograph of the 1985 Balloon Flight Solar Panel 20
8. Diagram of the 1985 Balloon Flight Solar Panel 21
Tables
1.
2.
3.
Description of the Modules 5
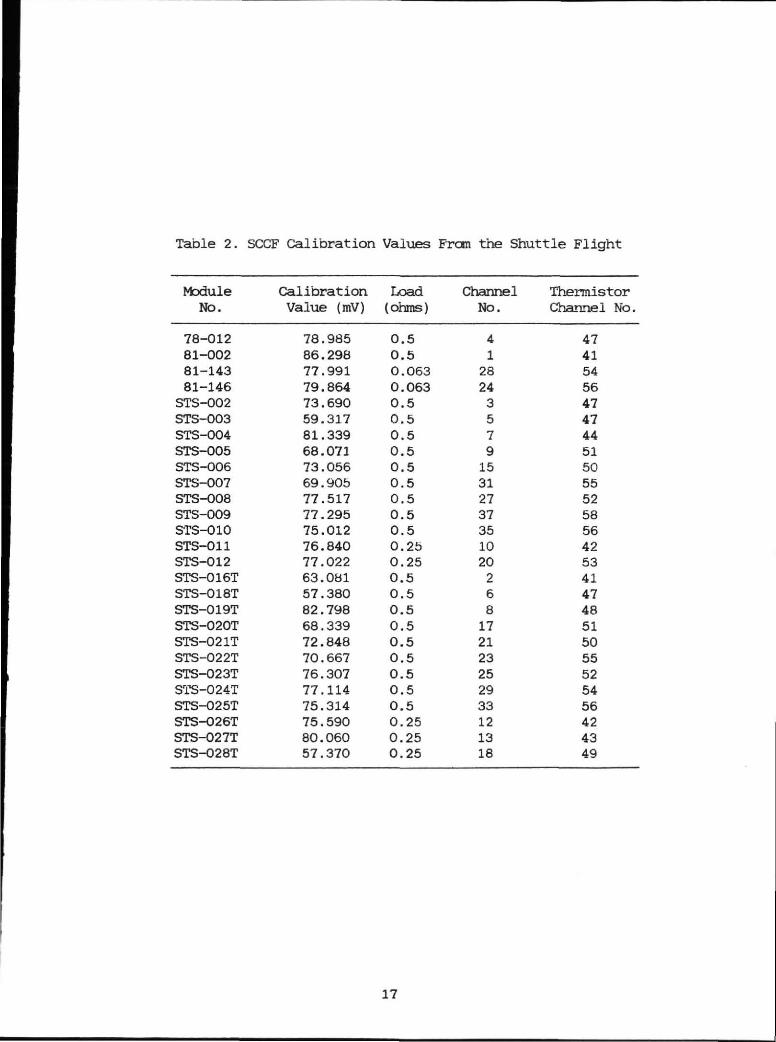
SCCF Calibration Values From the Shuttle Flight 17
Comparison of Calibration Values and Temperature CoefficientMeasurements, Shuttle vs. Balloon Flight 26
VI
What goes up must come down, but don't expect itto come down where you can find it — Lily Tomlin
SECTION 1
INTRODUCTION
The Solar Cell Calibration Facility (SCCF) experiment was conceived to
evaluate the effect of the earth's upper atmosphere on the calibration of
space solar cell standards. The concept involved flying a collection of
solar cells on the shuttle, reflying them on a balloon, and then comparing
their outputs. When flown on the balloon at altitudes near 120,000 ft (36
km), the cells receive sunlight only after it passes through a thin band of
atmosphere. This thin band attenuates solar radiation by a small amount. The
experiment was designed to determine whether this attenuation has any
measurable effect on the output of solar cells. If so, calibration values
that have been derived from balloon flights over the past 22 years would
have to be changed. Nearly all the solar panels flown in space (during
those 22 years) have been measured on ground-based solar simulators whose
intensity was set using one of these balloon-flown standards, so if the
effect is large, the result would be of considerable interest to the space
power community.
A secondary objective of the SCCF experiment was to measure the
temperature coefficients of the collection of solar cells during the
shuttle flight and compare the results with measurements made in the
laboratory. Solar cells produce short circuit currents that increase
linearly as a function of temperature. This rate of increase, the solar
cell short-circuit-current-temperature coefficient, is commonly used to
correct solar cell data to some standard temperature. The use of accurate
temperature coefficients is essential in many aspects of solar cell
measurements and solar panel design. Their measurement in space should
agree with their measurement in the laboratory.
SECTION 2
EXPERIMENT DESCRIPTION
2.1 OPERATIONAL SEQUENCE
The SCCF experiment was one of three experiments that made up a larger
experimental package called the OAST-1, which flew successfully on the first
flight of the Discovery shuttle (STS-41-D mission) from late August through
early September 1984. The SCCF consisted of a panel of solar cells and
thermistors, the mounting structure, and control electronics. An on-board
data acquisition system processed the experimental data and recorded them on
tape. With the exception of electrical power, which was derived from the
shuttle, the SCCF was entirely self-sufficient and required no telemetry.
Operation of the SCCF experiment was initiated by switching on SCCF
power, then giving a command to the shuttle's attitude control system which
caused the shuttle to rotate and point its payload bay at the sun. The
shuttle's celestial sensors and computers then controlled its attitude to
keep the SCCF solar panel perpendicular to the sun. An on-sun indicator
located on the SCCF solar panel monitored the accuracy of the alignment with
the sun. If the alignment was within a 3 degree half-cone angle, data was
accepted by the data acquisition system and recorded onto magnetic tape.
The experiment was turned on four times during the Discovery flight and each
time it was operated for the sunlit duration of an entire orbit.
At the end of the flight, the solar ceils were removed from the panel
and mounted on the tracker used for JPL high-altitude balloon flights. They
were flown on balloon flight No. 1405P on July 12, 1985, at the National
Scientific Balloon Facility (NSBF) in Palestine, Texas. After reaching a
float altitude of 115,000 ft (35 km), the tracker was turned on, allowing it
to lock onto the sun. During this time, the solar cell output and solar
panel temperature data were radioed to Palestine by the on-board telemetry
system where it was decoded and recorded on magnetic tape. The flight was
terminated after recording data for a three hour period centered around
solar noon. The payload came down by parachute, was recovered, and was
returned to JPL.
The balloon flight data and shuttle flight data were analyzed
similarly, except that temperature coefficients measured in the JPL solar
simulation laboratory were used for making temperature corrections to the
balloon data. The data analysis programs for these two experiments were
written by different programmers and the methods of analysis were developed
separately. This procedure was used to minimize the possibility of
accidental agreements or disagreements between shuttle data and balloon-
flight data.
2.2 SOLAR CELL DESCRIPTION
Many types and sizes of solar cells were selected for this experiment.
They were chosen to have wide variations in technology, size, manufacturer,
and material. Cells with wide variations in spectral response were also
included. If the attenuation of solar illumination was significant, the
cells having high blue sensitivity would be expected to show more difference
in output than those cells with a high red sensitivity. Table 1 lists the
cell types flown and gives a description of the technology used to
manufacture the cells. The photograph in Figure 1 shows how the cells
appeared after assembly onto the shuttle flight panel. Figure 2 is a diagram
of the same panel, identifying the modules as they were placed on the panel.
Table 1. Description of the Modules
Module CellNo. Description
78-O12 Vertical Junction81-O02 Planar81-143 w.a.81-146 w.a.STS-011 w.a.STS-026T w.a.STS-012 w.a.STS-027T w.a.STS-O16T w.a. Low alphaSTS-002 w.a. Low alphaSTS-O03 LPE GaAsSTS-O18T LPE GaAsSTS-O28T LPE GaAsSTS-004 Hi RedSTS-019T Hi RedSTS-005 Lo RedSTS-020T Lo RedSTS-006 Hi BlueSTS-O21T Hi BlueSTS-007 Lo Blue Lo RedSTS-022T Lo Blue Lo RedSTS-O08 Flat SRSTS-023T Flat SRSTS-009 Gridded backSTS-024T Gridded backSTS-O10STS-025T
Notes: See Ref . 1 for the commonly used abbreviations in theOther abbreviations are as follows:w.a. Wraparound contactsLow alpha Gridded contacts, both front and backLPE GaAs GaAs cells made by Liquid Phase EpitaxialSR Spectral ResponseHi/Lo Blue Cells with unusually high/low blue SRHi/Lo Red Cells with unusually high/low red SRBBSF Boron Back Surface FieldT Indicates modules containing a thermistor
the flight, and (6) a complement of miscellaneous systems such as
transponders, radio tracking beacons, and subsystems for encoding data such
as latitude, longitude, and altitude. The ground-based part of the data
system resided at the NSBF in Palestine, Texas. It consisted primarily of
radio receivers and computers for demodulating, decoding, displaying, and
recording all the telemetered data in real time.
As in the shuttle flight, the system aboard the balloon contained an
on-sun indicator and a voltage reference box. Here, the on-sun indicator
did not open or close a gate according to the suitability of the data. Its
output was recorded (along with output from the other data channels), and
that reading was used during analysis to determine the suitability of the
data. The voltage reference box was a battery-driven power supply. It
produced very stable voltages of 0, 50, 80 and 100 mV which remained
constant to within +0.1 mV over a temperature range of 20 to 70 deg C.
These voltages were multiplexed with the other data, sent through the
telemetry system, and recorded on tape. They were examined during the
analysis phase to ensure proper operation and end-to-end stability of the
balloon flight data system.
The 10-bit A/D converter aboard the balloon was capable of reading the
thermistors with sufficient accuracy and resolution that a variable gain
amplifier was not necessary. For instance, when the converter was reading a
thermistor in the 50 to 60 deg C range, a one bit change in the A/D
converter was equivalent to a temperature change of only 0.25 deg. The
resolution improved rapidly at lower temperatures, becoming 0.07 deg near 28
deg C. Since the temperature corrections to the solar cell data were small
(typically about 1%), additional accuracy in the temperature readings would
be of little value.
22
During data transmission, the multiplexer stepped through the 57 solar
cells, the two temperature channels, the four reference voltage channels,
and the on-sun indicator channel at the same rate used on the shuttle
flight, two scans per second. Data transmission occurred after the balloon
had achieved its float altitude of 115,000 ft (35 km) and the tracker had
been turned on. A continuous stream of data was transmitted and received
over a three hour period during the flight.
4.2 BALLOON DATA ANALYSIS
The analysis of the balloon flight data is described in detail in
Ref. 2. The analysis program performed several major steps:
It selected data for analysis from the desired time period (onehour before solar noon until one hour after solar noon). Thecomputer read data from the tape until it accumulated 200 readings..for each channel (i.e., 200 scans). During accumulation, datablocks were accepted only if the on-sun indicator reading .verifiedthat the tracker was aligned properly with the sun. The data fromeach channel were then averaged and checked for any anomalousreadings, which were eliminated and the average recomputed.
A distance factor was computed to correct the solar intensity tothe 1 AU standard by multiplying the average cell readings by thesquare of the earth-sun distance at the time of the flight.
The cell data were corrected to 28 deg C using the temperaturecoefficients measured in the laboratory before the flight.
Another block of 200 data scans was read from the tape and averagedin the above fashion. This process was repeated 19 times, then anoverall average of all 4000 data points was computed to give thefinal calibration values.
The procedure for dealing with temperature corrections to the balloon
flight data differs markedly from that used in the SCCF data analysis. In
the latter case, a major part of the program was dedicated to deriving
regression coefficients from the flight data. The SCCF program fit the data
to a linear equation expressing cell output as a function of temperature,
23
then used that equation to correct the data to 28 deg C. In the balloon
flight analysis program, however, a temperature correction was made to each
data point using the laboratory-measured temperature coefficients multiplied
by the temperature difference, (28-T). During the shuttle flight, the cell
temperatures rose to within a few degrees of +28 deg C; therefore the
magnitude of the temperature corrections was relatively small. On the
balloon flight, the panel temperatures were much higher, ranging between +57
and +61 deg C, so the applied corrections were considerably larger and in
the opposite direction.
24
SECTION 5
COMPARISON OF SHUTTLE AND BALLOON FLIGHT RESULTS
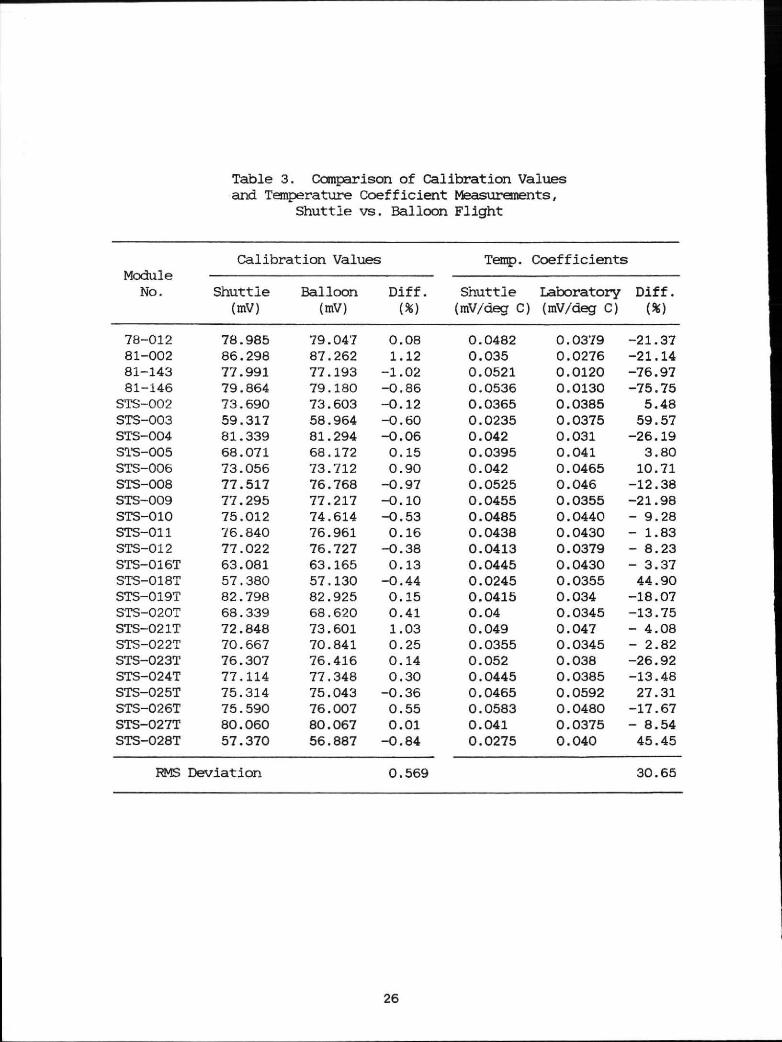
Table 3 summarizes all the measurements and calculations for the SCCF
experiment cells. It compares the calibration values derived from the
shuttle data with those derived from the balloon data and also compares the
temperature coefficients measured during the shuttle flight with those
measured in the laboratory.
The balloon calibration values deviate at most 1.12% from the shuttle
values, and the root mean square deviation is only 0.57%. An examination of
the data from each module revealed that the agreement did not depend on
whether the cell had a high or low spectral response in any particular
wavelength region. For example, some cells with high blue responses read
higher on the balloon than on the shuttle, while others with high blue
responses read higher on the shuttle than they did on the balloon. The same
observation was made for cells with high red responses and also for ceils
with relatively flat responses. This agreement shows that the balloon
flights are an excellent method of calibrating solar cell standards.
The temperature coefficient results were not as consistent. Table 3
shows that the temperature coefficients computed from the shuttle data do
not agree with the values measured in the laboratory. The measurement
methods used in each case were similar. A series of cell output voltages
were measured as a function of cell temperature, and then a linear least
squares fit was performed to determine the dependence of output vs.t\
temperature. Correlation coefficients (r ) were computed as a measure of
how well the data actually fit straight lines. The fits to the shuttle
25
Table 3. Comparison of Calibration Valuesand Temperature Coefficient Measurements,
data were rather poor, with correlation coefficients falling between 0.86
and 0.93, whereas the correlation coefficients computed for the laboratory
data were between 0.97 and 0.999. These differences are primarily caused by
data amplifier saturation during some of the temperature measurements and
the limited resolution associated with an 8-bit A/D converter. The shuttle-
based temperature coefficients were derived from data that varied over
temperature ranges of only 30 deg C (typically between -6 and +20 deg C).
The data did not change much over this limited temperature excursion, and
when it did change, it changed in jumps of 0.4 mV because of the resolution.
In contrast, the laboratory data was taken over a temperature range of 80
deg at five equally spaced temperatures. A digital voltmeter with 1
microvolt resolution was used to produce highly accurate measurements.
Temperature corrections to the shuttle data using the more inaccurate
temperature coefficients did not detract from the accuracy of the shuttle
data because the panel temperatures were very close to the standard
temperature of +28 deg C and the corrections were small.
27
SECTION 6
CONCLUSIONS
The SCCF experiment has shown that the method of calibrating solar
cells on high-altitude balloon flights produces calibration values that are
nearly identical to calibrations produced in outer space. The calibration
values derived from the balloon flight agree with those derived from the
shuttle flight to within 1.12%.
28
REFERENCES
H.Y. Tada, J.R. Carter, Jr., B.E. Anspaugh, and R.G. Downing, Solar CellRadiation Handbook (Third Edition), JPL Publication 82-69, JetPropulsion Laboratory, Pasadena, CA, Nov. 1, 1982.
B.E. Anspaugh and R.S. Weiss, "Results of the 1985 NASA/JPL BalloonFlight Solar Cell Calibration Program," in press.