Page 1
NASA CONTRACTOR
REPORT
QO
!
,,¢1:
Z
r
NASA CR-928
r
(NASA ¢;K.uK
_ GPO PRICE $
CFSTI PRICE(S) $
Hard copy (HC)
Microfiche (M F)
ff 653 July 65
L
https://ntrs.nasa.gov/search.jsp?R=19680009804 2018-05-13T00:41:28+00:00Z
Page 3
NASA CR-928
PROPULSION SYSTEM DYNAMIC SIMULATION
THEORY AND EQUATIONS
By Arnold W. Martin
Distribution of this report is provided in the interest of
information exchange. Responsibility for the contents
resides in the author or organization that prepared it.
Issued by Originator as Report No. NA-67-384
Prepared under Contract No. NAS 2-3268 by
NORTH AMERICAN AVIATION, INC.
Los Angeles, Calif.
for Ames Research Center
NATIONAL AERONAUTICS AND SPACE ADMINISTRATION
For sole by the Clearinghouse for Federal Scientific and Technical Information
Springfield, Virginia 22151 - CFSTI price $3.00
Page 5
v--
PP,.ECE,_,NG FAGE BLANK NOT FILMED.
TABLE OF C_TS
SUMMARY
INTRODUCTION
AIR IRDUCTION SYSTEM
STARTED PHASE
Starte_ Inlet Geumetry
Simulation Concept
Upstream Properties
Properties at the Upstream Face of the Terminal Shock
Properties Behind the Terminal Shock
Inlet Boundary Layer Bleed Flow
Subsonic Flow Total Pressure Losses
Duct Volume Mass
Duct Volume Temperatures
Duct Volume Pressures
Bypass and Engine System Airflows
Helmholtz Volume Properties
Helmholtz Volume Acceleration
Phase Switches
Outputs to the Air Induction Control System
tWSTARTING PHASE
Insufficient Demand Simulation Concept
Choked Throat Unstarting Simulation Concept
Upstream PrOperties
1
2
4
8
8
8
11.
12
13
14
16
20
20
21
25
27
29
3].
37
39
111
Page 6
TABLE OF COR_TS (Co.tinue_)
1_roperties Upstream of the b_tream Normal Shock
Properties Behind the Normal Shock
Bour_ry Layer Bleed Forward of the Throat
Upstream Volume M_ss and Total Temperature
Upstream Volume Total Pressure
Upstream Normal Shock Position
U_mtream Properties for the Duct Volume
Properties Behind the Terminal Shock
Boundary Layer Bleed for the Duct Volmme
Duct Losses
Bypass and Engine System Airflows
Duct Volume Mass and Total Temperature
Duct Volume Total Pressure
Terminal Shock Position
Phase Switches
Outputs to the Air Induction Control System
FILL PHASE
Simulation Concept
Upstream Properties
Properties at the Terminal Shock Station
Properties Behind the Terminal Shock
Effective Throat Area
Boundary Layer Bleed Flow
39
4o
4o
42
43
4_
48
48
49
5O
5o
51
5z
5z
52
55
%
57
5V
60
iv
Page 7
or co_w,m (coat_)
Duct Vol_m Total Pressure Losses
Bypmss and Engine System Airflows
Duct Volume Total Pressure
TeFK_I Shock Position
l_ase Switches
Outputs to the Air Induction Control System
SUBCRITICAL PHASE
Subcrltlcal Phase Concept
Upstream Properties
Inflow
Boundary Laymr Bleed Flows
Duct Volume Total Pressure Loss
Bypass and Engine System Airflows
Duct Volume Mass and Total Temperature
Duct Volume Total Pressure
Terminal Shock Velocity and Position
Phase Switches
Air Induction System Sigr_is to the Control System
_RSHDCK PHASE
Hammershock Phase Concept
Upstream Properties
Properties at Station X
Properties Upetrem- of the Na_erlhoak
Pap
6z
6l
62
62
63
6_
65
65
66
66
68
68
69
69
69
70
?o
7o
72
72
73
73
75
v
Page 8
TABLEO_ COr_I_TS (Coatin_ea)
Properties Behind the HammershocM
Effective Flow Area a_ Volume
Boundary Layer Blee_ Flows
Bypass _ Engine System Airflows
Duct Volume Total Pressure Losses
Hunershock Volume Mass and Total Temperature
Hasm_rshock Vol_m_ Total Pressure
Hammershock Velocity and Position
Forward Outflow
Phase Switches
Outputs to the Air Induction Control System
INITIAL CONDITIONS
Startecl Phase
Unstartin_ Phase
Empty-Fill Phase
Subcritical Phase
Hamme rshock Phase
SYMBOLS AND NOTATION
LIST OF FIGURES
APPENDIX
REFERENCES
Pap
79
?9
80
8o
81
82
83
83
87
89
9o
91
92
98
212
vi
Page 9
PROPUL_I0WSYSTZMUIRAM3EBD4_ATIOI
THEORY_ EQUATIORB
By Arnold W. Wextln
North American Aviation, Inc.
SUMMARY
This report presents the theOryp equationl and assumptions for & pro-
pulsion system dy_mic simulation program with emphasis on the air induction
system.
Although the simulation program was developed and used primarily for
the XB-70_ the theory and equations are sufficiently general to be appli-
cable to a wide range of inlet configurations and flight conditions.
Similarly, while the majority of simulation runs have utilized a digital
computer in conjunction with the General Electric Cumi_'s 'q)ynasyar"
program_ the simulation is adaptable to other ccRputing systems, and to
analog computers.
Page 10
I_TRODUCTIOH
In the _evelolment of any propulsion system _ymamlcs simulation, a
choice must inevitably be ma_e between accuracy, an_ cost a_1 ccRplexity.
Almost u Inovitably, the optisn_m compromise of these conflicting require-
ments will differ from s_mAlation run to simulation rum. Thereforo, the
simulation program provided as part of contract NAS2-3268, reference i,
has been based on a "building block" concept wherein each of the building
blocks can be as sophisticated or as simple as is appropriate. The same
concept is used here in describing the logic and equations for various
portions of the simulation proID_m.
Air Induction System Simulation:
For illustrative purposes, the simulation theory and equations pre-
sented here are of an intermediate degree of sophistication, and assume an
air induction system similar to that of the XB-70. In particular, it is
asstm_d that i) inlet boundary layer air is bled through porous material
covering appreciable portions of the throat and internal contraction sections
of the inlet, and 2) bypass air is extracted f_m the duct ims_diately up-
stream of the engine face. Details of any specific coafiguration can
usually be accounted for by minor changes in the equations.
The overall air induction system simulation pro1_lua is capable of
simulating almost any mode of inlet operation, from static conditions to
high supersonic Msch numbers, fr_ all external to all internal shock
cumpression, and from small disturbances to hammershock. Usually, the
event to be simulated and the associated mode of inlet operation will be
2
Page 11
i known prior to making a simulation run. Consequently the portions of the
simulation not applicable to the run can be eliminated. Similarly, many
of the options within each phase or mode of inlet operation can be
eliminated for a given simulation run.
Air Inductioa Oon_rol System and Zngine System SimdationB:
Both _e alr induction control oymtem and the enl_Lnes for a given
alrera£_ _end to be highly dependent on the speolfie c_tgurttion.
ConsequentlTs only highly simplified control syltem and engine systeB
simulations are presented.
On first acquaintance, these representations my seem to be
siwplified to the extent of being useless. Experience with the sl_lulation
p_ h_ shown, hoverer, that such representation can be extremely
useful, for exa_le, in i) _apping areas where detailed testing is
required or where a high _egree of simulation accuracy is required, 2)
simulating wLlfunctions, 3) analyzing test date, and 4) determining the
necessary d_cs response characteristics for various elements of •
control system. Such representations have the very appreciable advantage
of being easily interpreted, readily changed, and economically run.
3
Page 12
AIR INDUCTION SYSTXM
Air Induction S_tem Phases of O_era_ion
From both logic and convenience considerations, the air inductlon
system silulatlon program is divided into phases or modes of operation.
These phases have been arbitrarily desiguated as Started, _nstartinK,
Enpty-Fill, Subcritical, and _rshock.
Started P_e:
In the Started Phase, an inlet operates with either a combination
of external and internal shock compression or all internal shock compression.
The terminal normal shock is located downstream of the effective throat as
illustrated in figure i. If the terminal shock were initially at position
"a" and the engine or bypass airflow demand decreased, pressure in the duct
would increase and the terminal shock would move forward. Maximum total
pressure recovery is obtained with the terminal normal shock at the
effective throat. Figure 2 shows the typical rise in engine-face total
pressure recovery as the terminal shock moves from "a" to '_" with decrease
in airflow demand. Should the terminal shock move forward of the effective
throat, the inlet unstarts.
Unstartin8 Phase:
Once the terminal normal shock moves forward of the effective throat t
continuity of mass, energy and momentma requires that it continue to
forward past the cowl lip. As the terminal shock moves from "b" to "c"
figure 3, engine face total pressure recovery drops as shown in figure 2.
Page 13
Z_lJt IIemtJ4m _Luz_L_l _ __ sl_k _m_l _ _w e_eet£_ _wmat
to _lw _ :_Lp is te_ the lhste-_l Ew_e.
_t_l_ _wt dne_l_L _ _wed by tJm _ _emand downstream
of _ talat throat being :tess the: the airfXov oa_urad by t_ stsrte4
inlet. Unsta_ also results vhen ttw inlet throat area bee_s insufficient
to pus tl_ _l_ured alrflow. Such a condition elm _'lme because of a
deore_o _n throat area s a reduction in _ch n_bmrs or an increuo in
captured airflow caused by attitude or inlet geometry changes. Whlcbever
the cause, a normal shock forms in the thromt and moves upstream as ll1_-
trsted in figure _. (It is to be noted that this mboak is in addition to
the existing terminal normal shock. ) Depending on the terminal shock
location at the instant of throat chokln_ the termlma_ mormm_ shock m_V
move upstream fast enough to catch and coalesce _rlth the forward normal
shock before it reaches the cowl lip.
Eerpty -F_.U Phase:
As the terminal normal shock moves for_rd of the cowl llp_ the
large static pressure rise across the shock tends to cause massive
separation of the boundary _ver on the external cce|pression surTmces.
Figure 5 _11ustrates hc_ the flow separation restricts the effective
inlet throat area to a fraction of the geometric area. With _ow
greatly reduced and outflo_ (engine and bypass d_and) proporttomm_ to
the instantaneous duct total pressu_e_ engine face tot_ pressure rILl
rapld_7 from condition "d" to "e" as shorn in figure 2. During this empty-
In8 phase, a terminal shock forms in the effective throat and moves dovn-
stream as the duct pressure drops. (l_te that there i_ an exter_
an intermal norx_ shock during this l_as_. )
Page 14
After duct pressure drops to a critical level s the separated flow
reattaches as shown in figure 6. Wlth outflow low because of the low duct
pressure_ inflow exceeds outflow, duct pressure rises; and the terminal
normal shock moves upstream. Depending on the engine and bypass _e_n_p
the terminal shock will either i) proceed forward of the cowl lip1
triggering boundary lair separation and a new emptying phase, or 2)
stabilize in a supercritical positions downmtream of the inlet throet_
point "g" of figure 2.
The Empty-Fill P_ase described above is applicable to all of the
unstart cycle subsequent to the Unstartir_ Phasej and to buzz s and super-
critical stabilized operation.
Subcritical Phase:
Subcritical and stable inlet operation at subsonic and supersonic
flight speeds is shown schematically in figure 7. This mode of operation
is designated the Subcritical Phase.
Hanm_rshock Phase:
When duct outflow is abruptly reduced, say by an engine stall, the
large excess of inflow over outflow causes a sharp rise in pressure at the
engine face. The pressure propagates upstream at a speed, relative to the
local flow_ somewhat greater than sound. The interface between the
undisturbed upstream flow and the high-pressure, low-velocity downstream
flow is termed a ham_rshock. Pressure behind the hamz_rshock can
appreciably exceed free-stream total pressure.
Figure 8a shows a typical pressure trace during a hammershock transient.
The pressure is that which would be seen Just behind the hammrshock front.
Page 15
_ Points on the trace correepond to the l_L_ershock _ve pomition8 jbown
figure 8b.
Both the physical and the simulation processes of changing frcn one
Phase to another are continuous and smooth. Logic ls contained in e_ch
Phase to initiate the change to the next Phase. Special "Initial Conditions"
logic computes those properties required to accomplish a smooth transltlon.
In the subject inlet simulatlon_ logic is provided to automatically
accomplish the following Phase changes,
Started
Started
Unsta_In6
_ty-rln
Empty-Fill
Empty-Fill
Subcritical
Unstarting
Hammershock
Empty -Fill
Hammershock
Subcritical
Started
Empty-Fill (supercritical, stable)
Subcritical Hammershock
7
Page 16
STARTED PHASE
Inlets having internal shock ccmpression are characterized by low
external drag, clean internal lines, and high pressure recovery. These
advantages are realized, however, only when the inlet is controlled to
near peak performance where smmll transients in airflow supply or demand
can result in the rather violent transient, inlet unstart. Consequently,
simulation accuracy is particularly important for the Started Phase of
inlet operation.
Started Inlet Geometr_
Figure 9 is a schematic diagram of a typical air imductlon system
with a mixed (part external, part internal) shock cc_ression inlet. Princl-
pal components are the shock compression surfaces, the subsonic diffuser, a
boundary layer bleed system, and a bypass system.
The simulation model configuration for the physical system of figure 9
is shown in figure iO. Also shown are the flow stations with the symbols
used in the simulation logic.
Simulatio n Concept
The simulation model can be considered as either I) a system of two
somewhat arbitrarily defined volumes to which are applied the continuity
relationships of mass, energy, and momentum, or 2) a modified Helmholtz
resonator superimposed on the internal flow. A mechanical analogy to the
Helmholtz resonator concept is a spring-mass system wherein the low
Page 17
velocity air in the aft-duct-volume (Duct Volume)serves as the spring
as it is compressedor expanded,and, the high velocity air in the
throat section (Helmholtz Volume)acts as a masswhosekinetic energy
is changing. Figure 10 illustrates the division betweenthe Duct
Volumeand the Helmholtz Volume. Note that the upstreamface of the
Helmholtz Volumeis the terminal shock.
In essence, the simulation lo@ic computes the acceleration of the
"Helmholtz Volume" resulting from the instantaneoua flow cor_itions at the
upstream and downstream faces of this volume. The Helmholtz Volume
acceleration is integrated to obtain velocity; then, velocity is integrated
to obtain position. Inasmuch as the terminal shock is the upstream face of
the Helmholtz Volume, the acceleration, velocity, and position of the
terminal shock are also determined.
Two different basic concepts have been used in computing the
acceleration, velocity and position of the Helmholtz Volume. The concept
designated "Frozen Plug" is presented in the text. This concept is simpler
and less sensitive to the arbitrary input of Helmholtz Volume length.
Because it is more sensitive to the assumed Helmholtz Volume length, the
alternate concept (Appendix A) is sometimes preferable when test data are
available to help in the length selection.
Flow properties at the upstream face of the Helmholtz Volmne are
determined entirely by conditions upstream of the terminal shock. Specific-
ally, these conditions are aircraft Mach number, angle of attack, angle of
yaw (- sideslip) and inlet geometry. The simplifying assumption is made
that the flow is essentially one-dimensional at the terminal shock,
although empirical factors can be used _o account for non-uniformlty. It
9
Page 18
is further e_i_ that aircraft attitude and inlet geometry rates of
chanp are such that the ccmpression surfaces a_ seen a8 quasi-stationary
by the supersonic flow.
Flow conditions at any station in the Felmholtz Vol_me (figure I0)
are computed frum one-dimensional flow relationships proceeding aft from
the upstream face. Mass and energy enter through the upstream face
(terminal normal shock), and leave through the boundary layer bleed exits
in the Helmholtz Volume and through the interface with the Duct Volume.
The Duct Volume is considered to be a lumped volume in that changes
in density and total temperature are assumed to occur simultaneously
throughout the volume. However, flow properties are assumed to vary from
station to station in the Duct Volume in accordance with quasi-steady
state, one-dlmensional flow relationships. Mass and energy enter the Duct
Vol_e through the interface with the Helmholtz Vol_, and leave through
the boundary layer bleed openings in the Duct Volume, through the by_ss
openings, and through the engine(s).
Details of the Started Phase are given in the several "logic block"
subdivisions which together form the simulation program. These arbitrary
subdivisions, corresponding in general to the logic block diagrams and
card decks of Reference i, are as follows: Upstream Properties, Properties
at the Terminal Shock, Properties Behind the Terminal Shock, Boundary Layer
Bleed Flows, Subsonic Flow Total Pressure Losses, Duct Volume Mass, Duct
Vol_m_ Total Temperature, Duct Volu_e Pressures, B_/_ss a_d Engine System
Airflows, Helmholtz Vol_e Properties, }Tmlmholtz Volume Acceleration, Fnase
Switches and Outputs to the Air Induction Control Systems.
i0
Page 19
_ Upstream Properties
The outputs computed in the Upstream Properties logic block are Tto ,
Ptx , and WII ; and local _kch number, MA . Figure 11 is a flow diagrem
showing the equations used in calculating these outputs.
It will be noticed that _ has been ass_ed to be a constant, 1.4,
in these and subsequent calculations. The error introduced by this asstmrp-
tion is far outweighed by the greater simplicity and time saved in the
numerous calculations involving _ . It might be noted that while the
specific values selected for such frequently used parameters as 7, g, and R
are not critical, it is important that the exact value selected for a term
be used in all equations using that term. In particular, the motion of the
Helmholtz Volmne (and therefore the terminal shock) is a function of the
small difference between large numbers, one computed for the flow conditions
proceeding from the freestream aft to the Helmholtz Volume-Duct Volmne
interface, the other computed from the engine face forward to the interface.
A small difference in the value of a constant as used in the upstream
calculations from that used in the downstream calculations results in a
residual error.
The flight conditions, Po , To , Mo , ao and _o are usually input
as independent functions of time as shown in figure ii. They can, however,
be expressed as functions of other parameters or computed in further simu-
lation logic blocks.
Pt___x, total pressure recovery Just upstream of the terminal shock, is
Proexpressed as a function of flight conditions and inlet gecaetry. This
permits the use of either test data or data computed from theoretical
shock equations for steady state flow. Note that test data must not include
Ii
Page 20
losses acroes the termimal mormml shock or in the subsonic diffuser. Total
pressure recovery upstream of the terminal morm_l shock is surprisim@ly
laaensitlve to smmll chm_s in 8ecmmtry for high-performance mlxed-compression
inlets. Consequently, it is frequently Ix_sible to express Pta/Pto as a
function of Mo , (_o , and _o only.
The mass flow rmtio, WII is also expressed as a function of flight
conditions and it.let _mmetry. Either test _ta, calculated values, or a
combination of both can be used. Note that l
where Wbb is the boundary layer bleed mass flow ratio for a bleed zoneTo
entirely in a supersonic flow field. Because the mass flow ratios WI andFo
Wbb can be uniquely defined by the same parameters, it is convenient to
Wo
combine them into the sing/e term, WII/W o .
Inasmuch as there is no work or heat addition to the flow between the
freestream and the terminal shock, Ttx is equal to Tto .
Properties at the Upstream Face of the Terminal Shock
Those properties uniquely determined by the upstream flow conditions
and the area at the terminal shock station are Ax , Wx , Mx , Px , Tx , Pry
and _y . Equations used in computing these properties are shown in figure 12.
In brief, supersonic Mach number at the shock is computed by iteration from
the known quantities of weight flow, total pressure, total temperature, and
area. The iteration routine used in the digital computer simulation program
is given in Reference i.
12
Page 21
Total flow at the shock station, W x , is tlm to_ captureA flow less
the boundary layer bleed flow up to the shock. Details of how bleed flow
in the throat region ia computed are given in the nectlon, Inlet Boundar_
La_er Bleed Flow.
Pry and Fy are calculated on the assumption that the terminal shock
is stationary. These parameters are used in secondary calculations where
it is convenient to mlke the calculations before determining the shock
velocity and then apply corrections to account for the shock velocity.
Pro_rtles Behind the Terminal Shock
Properties behind the terminal shock are a function of shock velocity
as well as upstream flow conditions and area. Calculations to obtain these
pa_ters, ( Ux'/U_, My, Ty, Tty, 5 ' Pry, _ wy ) are sho_in
figure 13.
The calculations are based on the fact that the _ of static pres-
sure and temperature across a normal shock depend only on the Mach number
of the supersonic flow relative to the shock wave. The procedure consists
of: i) calculating MX' _ the Mach number of the upstream flow relative
to the shock from the supersonic flow Mach number relative to the duct;
2) calculating downstream static pressure, static temperature, and _ch
number relative to the shock using conventional normal shock equations;
3) calculating downstream _ch number relative to the flow; and 4) calcu-
lating airflow, total pressure, and total temperature downstream of the
terminal shock and relative to the duct using the M_ch number relative to
the duct, static pressure and static temperature.
13
Page 22
zaletio: aw L Wr Bleednov
Boundary _r b_l _'lov is ec_ider_ in three l_s. First, Umrs
ts houndmry _r _ from zonu that am s_m and completely Ulmtr_m
of the _us_ shock 4Luring started cq_mtion. This bleed _ov l_s been
subtracted frcR the total captured airflow to give the lass flow ratio,
VII/W o , as descrt_d in the section, U_str_a Properties. Seeon4, there
is the _ flov ul_trem of the ter_ns_ shock frca a sons (or sonss)
vhereln the b]_ed flow is affected by the terminal shock _Itlon. 1_his
bleed flov ls designated _obx • Third, there is the bleed flow dovnstresa
of the terai]_al shock. _his flov, _bby , varies both with terminal shoek
postio_ and, to • lesser degree, vith terminal shock velocity.
Local conditions in the supersonic flov upetreaa of the termia_l shock
are dependent only on the flight conditions and inlet 8ecmetry. Consequsntly
_bbx is identical to that under steady state co_lltlo_s vlth the sam termlaa£
shock position.
Local eo_dltions in the subsonic flov dovnstreem of the teraA_al shock
vary vlth termi:ai shock velocity as yell s4 position. _his factor is
accounted for in the boundary la_er bleed floe calculations as follovs:
1) _ is computed for stead_ state conditions, assuming the ete_
state terminal shock to be at the instantaneoun shock position.
2) The _stlo of instantaneous to stead7 state bleed flov is asst_ed
to be equal to the ratio of instantaneous to ste_ state statlo
paqessure behind the terminal shock. That is,
Ik
Page 23
*_ _bbx and _y can be determined for a given f_iKht, eondition_ inlet
p_etr_, boundary lair bked ccefi_tion and tectal ohock l_ition
frcm either or both a_alytical consi_eratioms and _el test @ata. The
best procedure will vary depending on the details of the 8peciflc bounty
layer bleed configuration and the test data available. The simulation
format used for the XB-70 is described for illustrative purposes.
In the XB-70, inlet boundary layer air bled frcn • "throat bleed zone"
extending frum 81iKhtly forward of the geometric threat aft to the end of
the porous material varies with terminal shock position. Bleed flow through
from this zone is collected in a single c_wpartment as shown in figure 14.
Also shown is typical 0.25 scale model test data showing boundary layer
bleed mass flow ratio in this zone as a function of terminal shock position.
Inspection of the data shows total bleed flow to vary approximately
linearly with terminal shock position. Bleed flow from forward Of the
terminal shock, Wbbx , is zero with the shock at XII and equal to the total
measured bleed flow with the terminal shock at or aft of XII I . Conversely,
the steady state bleed flow from aft of the terminal shock, Wbby , is equal
to the total measured bleed flow with the terminal shock at XII , and zero
with the terminal shock at or aft of XII I . Further, the throat area
variation and bleed area distribution for the XB-70 inlet make it reasonably
accurate to assize that Wbb x and Wbby also vary linearly with terminal shock
position between XII and XII I .
Based on these observations, the following equations were used to
compute the bleed flow upstream of the terminal shock position.
Wbb---_x - _x aX
WII
15
Page 24
where
test
data
A X is set to zero inLsmu_h
Similarly, when the terminal shock is between
When the terminal shock is upetream of XiI ,
as Wbb x will then be zero.
XII and XII I
AX i X - XII
When the terminal shock is downstream of station Xli I ,
AX- Xii I - XII
inasmuch as there is no further increase in Wbb x as the shock moves aft of
the bleed zone.
Equations for computing bleed flows _ownstream of the terminal shock
are based on similar reasoning. Detailed equations for bleed flows both
upstream and downstream of the terminal shock are presented in figure 15.
Note that the bleed flow slope_ _ , is negative as illustrated in figure 14.
In the XB-70 simulation program, _x and _y are expressed as table
look-up functions of local Mach number MA , and throat area, factors
indirectly defining local flow Ymch number realtive to each exposed bleed
outlet.
Subsonic Flow Total Pressure Losses
Air induction system total pressure losses can be categorized as those
occurring across the shock waves, and those resulting from friction and
vorticity. The latter, of course, can be strongly influenced by shock-
boundary layer interactions.
Assumptions made in simulating total pressure losses othe_ than shock
16
Page 25
- losses are as follows:
1) There are no expansion losses in the supersonic flow in the inlet.
2) There are negligible friction losses in the supersonic flow in
the inlet.
3) The magnitude and distribution of total pressure losses throu6h
the subsonic diffuser are those for quasi-steady state flow.
The assumption of negligible friction losses in the supersonic inlet
flow is Justified by the fact that air in the boundary layer where such
losses occur is usually bled-off to prevent boundary layer-shock inter-
actions.
Losses in the subsonic flow downstream of the terminal shock are
functions of the subsonic diffuser geumetry, duct Mach number, Reynolds
number, and the location and strength of the terminal shock. The latter
become significant particularly during highly supercritical operation
when the terminal shock tends to be both strong and downstream of the region
having boundary layer bleed.
The format for simulating the subsonic flow total pressure losses
permits use of various representations without affecting other portions of
the simulation program. Losses can be calculated from test-derived factors
or theoretical considerations. The basic requirement for the simu/ation
program is that subsonic diffuser total pressure losses be computed for
three sections, y - z, z - d, and d - 2 as shown in figure 16. Total
pressure losses in each section are assumed to vary linearly from zero at
the upstream face to the full loss at the downstream face.
M_st of the representations that have been used have the form
_Pt" IF(Pt " P)
17
Page 26
E is an empirically or theoretically-derived loss coefficient, ususAly •
function of one or more variables defining tke inlet 8e_etry aud/or the
terminal shock location. The comprenible dynamic pressure, qc =- Pt - Ps
may, depending on the logic selected, be that at i) station X, 1._diately
upstream of the terminal shock, 2) station T, inmediately downstreal of
the terminal shock, or 3) stations T, Z, and d, the upstream stations for
each of the three sections.
The representation selected usually depends on the form, quantity and
quality of test data available. The following observations may be of help
in selecting the representation for a specific simulation.
I) The representation must give a continuous variation in total
pressure losses with changes in terminal shock position and
inlet geometry. For example, one of the most accurate represen-
tations for small shock excursions is that which bases losses on
qc at the station where the porous bleed material ended. Losses
upstream of this station are eliminated by boundary layer bleed.
Duct flow aft of this station is constant. However, a large and
troublesome step change in qc occurs when the terminal shock
crosses this station.
2) Basing losses on the subsonic qc Just downstream of the terminal
shock is both logical and probably the most conventional method of
computing subsonic diffuser total pressure losses. A subtle dis-
advantage, whose i_rtance depends on the details of the
simulation program, is a feedback between subsonic total pressure
losses and qc through the bermlnal shock velocity.
3) Basing losses on the supersonic qc Just upstream of the terminal
18
Page 27
shook ls ]_x_i_ appropriate when the terminal s_k uo_s
a_c_b_ downltrs_m of the throat. The sho_-boum_ _-yer
interaction then bec_es a dominant factor in deterllntng subsonic
diff_er losses. The supersonic qc is related to the strength of
the terminal shockp and is therefore .mrs nearly proport£oaed to
the shock-bound£ry layer interaction losses than Is qc downstream
of the terminal shock. A further advantage is that the supersonic
qc is independent of the terminal shock velocity.
4) In most tests_ only the overall total pressure losses are measured;
and, engineering Judgement must be used to determine what pro-
portion of the overall loss occurs in each section. Basin6 losses
for each section on qc at the upstream face of that section would,
therefore, seem to be questionable refinement, except under special
circmnstances.
Two of the representations which have been used in the X3-70 program
are shown in figures 17 and 18. The equations of figure 17 illustrate the
use of the quasi-steady state static and total pressures downstream of the
term/hal shock to eliminate the redundancy loop between the dynamic total
pressure and total pressure losses in the Duct Volume. The representation
of figure 18, wherein losses are based on the dynamic head upstream of the
terminal shock_ was found convenient for simulation runs investi@ating the
effects of abnormal bypass door settings. The terminal shock was then far
downstream, and losses were strongly affected by the strength of the terminal
shOck.
19
Page 28
Duct Volume _s
Air in the Duct Volmme at any instant is
t
tinitial
where d_d__ is the difference between flow into and out of the Duct Volume.dt
Flow out of the Duct Volume, depending on the configuration, may
include the engine primary airflow, engine secondary airflow, bypass air-
flow, and auxiliary airflow for cooling or other purposes. If the auxili-
ary airflow is negligible as for the XB-70,
We" W2+ Ws + Wbp
Durin 6 steady state operation_ inflow is Wz where
W z m WII - Wbb x - Wbby- g_ A z U z
During non-steady state operation, the inflow differs from W z because the
upstream face of the Duct Volume is moving. Inflow under such eamLitioms
can be envisioned to consist of two parts - the flow relative to the duct
at station z, and the flow swept by the area A z moving at a velocity dX_V
relative to the duct through air of density
whe re
Wz' m gPz AzUz " gPz Az
U z' - Uz - dX/dt
Z •
_= Wz U z'Uz
The calculation of W-d is shown in detail in figure 19.
Duct Volume Temperature
Total temperature is computed from the instantaneous total enthalpy
and air quantity in the Duct Volume assuming that the air within this
2O
Page 29
vol_e is at s uniform total t_permture. Airflow out of the Duct Voluml
is used to be st this umiform total temperature. Airflow into the Duet
Vol_e is ass_ed to be at the total tempermture Just downstream of the
terminal shock s Try . Therefore:
-_d (_d CpTtd) " wz' cPTty "we CpTtd+ ,zAz-'y-"aTdX
Dividing by Cp and differentiating:
T_+ _d dTtA . W z' Ttz - WeTtd+ PzAz dX
dt _t JC--_d-_
Substituting
dTtd
dt
(Wz' -W e ) for _ ,
l__ IWz' (Ttz " Ttd) ÷ PzAz ___I
Further,
W z' - W_ (i dX/dt_ Uz'
8/'_#
PzAz dX wz (_- l) dX/dt Tz
JCp dt 7 U s
the refore,
dTtd Wz [Uz'dt _Vd Uz
(Tty - Ttd)+
The final equations for computing Ttd are presented in figure 20.
Duct Volume Pressures
At any instant, the average density in the Duct Volume is
21
Page 30
_e_fore
V_ i_a
Pc].=W_-_ RTdw
Vd
Ptd= Pd (i + 3"5
where Md is the l_ch number at the station d where the density is equal
to the average density in the Duct Volume. Several methods of vtryi_
degrees of accuracy and complexity have been developed for computing Mmch
number at the average density station. The simplest approximations reason-
ably accurate for all but extremely large terminal shock excursions_ is
defined by the equations of figure 21.
The first step in this approximate method consists of determining
the ratio of the area at the average density station to the geometric
average area in the Duct Volume during the initial steady state conditions.
This ratio is then assm_ed to remain constant during the transient conditiJns.
During the initial steady state condltions_
and
Vd
g _d = Ptd
RTtd
22
Page 31
The_fore
or
,,,,,.(, -g)',Further, flow at the aver_ _enmity rotationwill be equal to Wz , the flow
at the e_ of the bour_ry layer blee_ llylll. L_u_eh all
v_v R
the flow area at the averep _nllty ita_ion iI
Ad " Wzv_q_ ./-_ (1 + ._2)3
Ptd _
The gecc_tric average area is ccczputedas
Adgeo" ---__ - X,.
Consequently, the ratio of area at the average density station to the geo-
metric average area is
Ka .AaAageo
Aa-- i
"r
During subsequent transient conditions, M_ is determined by iterative
solution of _he equmtion:
(1 + ._2)3 ptaH KaAageo
23
Page 32
wherQ
and WzH
P_H m _y -_IPt_ "_zd
is the flow at station z cc_?uted off t_ usuRptto_ that the flow
is in equilibrium vlth tim Ina_tntameoun value of t_rmlna3 shock velocity.
A more correct assumption would be that the flow at tim average density
station w_s the average of the instantaneous flows at the upstream and the
downstream faces of the Duct Volume. This however, introduces a redundancy
loop (Ptd is a function of Wd which is a function of Ptd) which introduces
more proble_ than the change in accuracy umueAly merits.
To repeat,
" Pa( + .z%a)3"5= (i+ . 2)3.5va
total pressures at the upstream and downstream faces of the Duct Volume are,
respectively,
PtzD : Ptd + APtzd
and
Pte = Pt2 = Ptd " APt_e •
Static pressure at the upstream face of the Duct Volume is
PzD = PtzD/( 1 + -2J4zD2) 3"5
where MzD is obtained by iteratlve solution of the equation
(i , .2MzD2) 3 PtzD Az
Note that PzD is static pressure at station z computed from properties in
the Duct Volume. Later, pressure at station z is computed frcn properties
in the Helmholtz Volume. It i| the difference between these two pressures
24
Page 33
s"
that acts to accelezlte the Holuholts Volume.
Byline and lh_ne System Airflows
The optimum forlmt for computing byps_s and en_ne systes airflows will
vary with details of the specific configuration to be simulated. In the
XB-70 comf1_ration, duct air enters a plenum cbambor Inediately forward
of the enKines from where it is exhausted either or both through the bypass
doors s_d the engine secondary flow system. The lyStel iS shown schematic-
all_ in figure 22.
EJch inlet has two sets of bypass doors, Trim and Main. Both the Trim
and FAin bypass doors form convergent-divergent nozzles at low bypass exit
area and convergent nozzles at high by_sl exit areas. The Trim bypass
doors have high movement rate capabilities but low flow capacity; conversely,
the Maln doors have low rate capabilities but high flow capacity. Total
bypass flow is the sum_atlon of the flow through the two sets of bypass
doors. Bypass flow is computed as
where
Wbp= Kb_ Pt2_ ((i Mbp >CbpAbp+ . .Mbp Z)3
Mbp- bypass throat Mach number.
CbpAbp- bypass effective throat area.
During most flight conditions, Mbp is sonic or near sonic, and
Wbp" KbpPtZk Cb Abp
25
Page 34
Further, the pressure rmtio, Kbp- _ _ umu_ varies with by_eJI8 flow
quantity which im turn varies with C_J_hp . It is often convenient, there-
fore, to include the Kbp term in the 0bp term.
XB-70 engine secoadary airflow is, depending on flight comditlons,
supplied by either the boundary layer bleed syetem or the bypmss c_rt-
ment. In the latter situation, secondary airflow is scheduled as s
function of primary engine flow. The engine system airflow can then be
e_L_re s s &s
Equations for computing bypmss a_ engine system airflows are pre-
sented In figure 23.
Helmholtz Voltm_ Properties
In the "frozen plug" simulation concept, properties t_'__ the
Helmholtz Volume at any instant are assumed to be dependent on, a_ in
equilibrium with conditions Just downstream of the terminal shock (station
y of figure lO). For example, at station z of the Helmholtz Vol_m, the
instantaneous total temperature is Tty ; the instantaneous total pressure
is Pty less the subsonic diffuser losses between stations y a_ z; and,
the instantaneous flow is Wy less any flow removed from the duct between
stations y and z.
Total air quantity in the Helmholtz Volume is the initial quantity
plus the difference between flow into and out of the vol_. That is,
t
Page 35
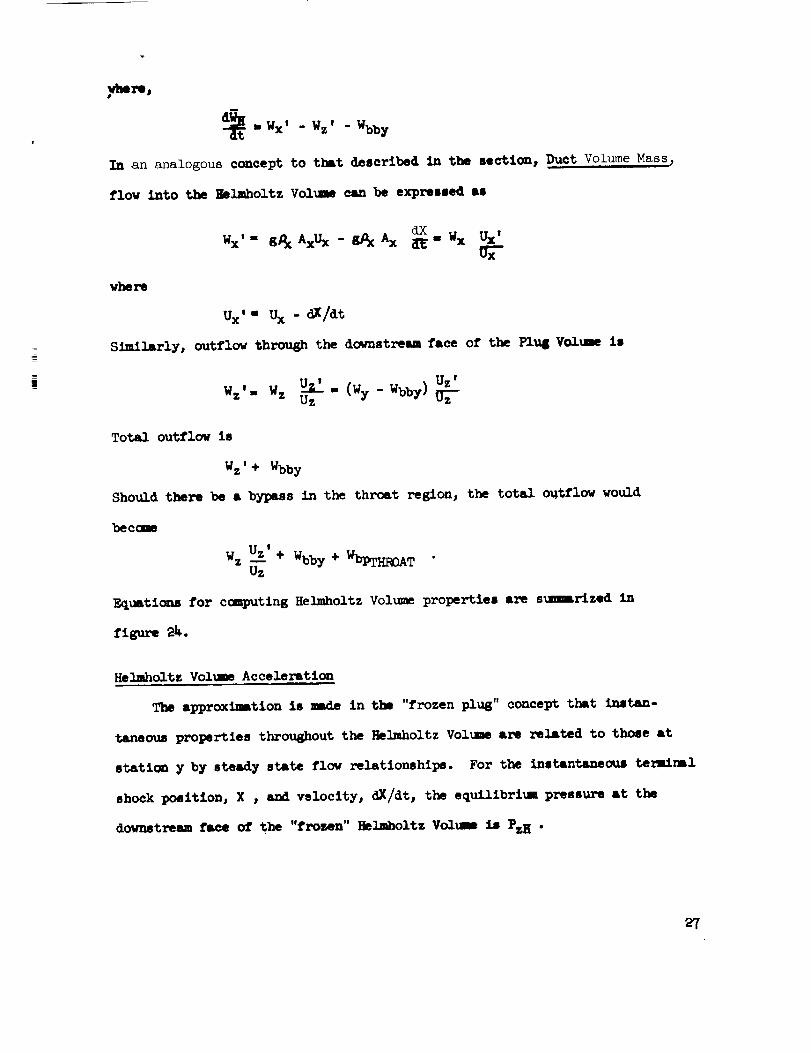
_% =Wx' - Wz' . Wbby
In an analogous concept to that described in the section, Duct Volume Mass,
flow into the Nelmholtz Volmm can be expreued as
where
dXwx'' S&Ax_-g&_ _'_x Ux'
Ux'" UX - _/at
Similarly, outflow through the downstream face of the Plus Volume is
Wz,. Wz Uz' . (wy-Wbby) Uz'Uz
Total outflow is
W z ,+ Wbby
Should there be a bypass in the throat region, the total outflow would
become
W z Uz' + Wbby + WbPTHROA T •Uz
Equati_ for computing Helmholtz Volume properties are summLrized in
rigu_,z_.
Helmholtz Yol_ Acceleration
The approximation is made in the "frozen plug" concept that instan-
taneous properties throughout the Helmholtz Volume are related to those at
statiOm y by steady state flow relationships. For the instantaneous terminal
shock position, X , and velocity, dX/dt, the equilibrium pressure at the
downstream face of the "frozen" Helmholtz Volume is PzH •
2?
Page 36
The IDstamtameOUS pressure at the u_tream face of the Duct Volume,
c_ute4 from Duet Volume properties, is PzD • Dmrl_ ste_ state
operation, PzH equals PzD ; am_, there is no imbsla_ce of formes at the
interface. During non-equilibrium conditiom, PzH will not equal PzD ; anda
there will be an unbalanced force of (PzH - PzD)Az • The unbm_mLnced force
is assumed to act on the Helmholtz Volume as follows:
dt_ g
or
dt d-_ +'g _ " (PzH " PzD)Az
Figure 25 is a diagram of the equations used to determine Helmholtz
Vol_ne terminal shock acceleration, velocity, and position.
It might be noted that there is no "dead time" factor introduced into
the equations of motions (dead time being that time required for • dis-
turbance traveling through the airflow at local sonic velocities to go
from, say, the engine face to the terminal shock). While dead time may
logically be considered a limiting minimum time for • disturbance to be
sensed at another station, it is hypothesized that any disturbance propa-
gated through the Duct Volume will be attenuated to insignificance until
there has been a significant rise in Duct Volume pressure. Further, the
mass accumulation causing Duct Volume pressure change and the disturbance
"wave" propagation take place coincidental!y rather than sequentially.
Consequently, the addition of a "dead time" would not be logical.
Z8
Page 37
Fnue 8vitebas
T_ _bsse switch logic coQtin_lly monitors vazto_ inlet ]jzaltere
to det4ratae whether and when • switch should be as4R:
i) to the Unstarting l_sse beoaule the terainal aoraal shock has
passed forward of the aerodynamic throst,
2) to the Unstarting Phase becaume the throat area is too mall to
pass the captured flow,
3) to the Ha_ershock Phase becaule of an abrupt decrease in outflow
fr_ the duct.
Logic for each of these checks is outlined in figure _ and described below.
Unstart Imititated by the TermlmAl Shock Moving _pstream of the Throat:
In _tmcusslng the initiation of unstart due to the terminal normal
shock moving forward of the inlet aerodynamic throat, it should be noted
that the aero_ymam_c throat can be appreciably forwmrd of the geometrlc
throat. This is illustrated in figure 27.
Three checks ma_ mm_e to determine when this type of unBtart has been
inltlmted. Firstt the terminal shock must be moving upstream. Second, the
supersonic MLch number upstream of the terminal shock must he increasing.
These checks indicate that the terminal shock is movlng upltream of an
aero_c throat. Finally, the terminal shock must be forward of the
geometrlc throat. This check has been found necessary became there may be
one or more secondary throats (area contraction) downstream of the primary
inlet throat. Even small area discontinuities associated with the area
calculation procedure can result in a false unstart without this check.
z9
Page 38
_tazt Inltlate_l by Ins_1_iclent Throat Area:
Inlet unstart is also initiated when the throat a_a becomes insuffi-
cient to l_SS the captured airflow. This conaitlon mt_ result fFom m
variety of causes including attitude chan@es, M_ch nulber cbanps, and
throat area chan@es. Whatever the causej the phase switching logic ccml_ree
the captured airflow (less the boundary layer bleed upstream of the throat)
to the flow that can pass through the throat at the instantaneous total
pressure and temperature. An empirical constant, Ku _ is used to reduce
the flow that could theoretically pass through the throat at MIch 1.0. This
factor accounts for such items as non-uniform Mach number in the thrcat_ and
differences between effective flow area and geometric area.
Hammershock:
The large and abrupt decrease in duct outflow associated with engine
stall results in the formation of a hammershock wave at the engine face and
subsequent forward motion of this wave. Inasmuch as an airflow decrease of
any magnitude will c_use a hasnaershock disturbance of some magnitude, the
decision as to how large the airflow decrease must be before the Hammershock
Phase is applicable is necessarily arbitrary. Consequently, the phase
switching logic computes proportional rate of change of duct outflow,
dWe/d t--_/ , and compares this with an arbitray critical rate of change, K_ t
above which the Hasmershock Phase is considered more appropriate. Selection
of KES is made by cumparing both Hammershock Phase and Started Phase simu-
lation data for a series of duct outflow reduction rates. KHB is that value
giving an appreciably higher duct pressure with the Hammershock Phase than
with the Started Phase.
3O
Page 39
,0utlmto to the Air lad uctlon Control Syetea
One of the loot _ttfieult problems in the destEn and develolment of
an air induction eyotem is finding stEu&ls sultable for oo_trol of the
system. Dtt_erences in inlet 8ecmetry, per_orasnoe requirement4, m&neu-
vertng rates, and similar factors _ undoubtedly _ska the control system
and stg_4 used unl_ue for each aircraft. Hoverer, severe_ procedures
used in computing control signals for the XB-70 de_o_trate some of the
metho_ which can be used in simtlating control sis_Jls. Locationl of the
various air induction control system sisx_l ptck-upe are shorn in figure 28.
Local Hach N_ber:
Msch n_ber on the first r_ of the inlet, MA , is used to arm the
Restart Control and to schedule throat area. Local M_ch nuRber is used as
a control syeten input in preference to freestrean M_ch n_ber because,
ideally, it eliminates the need to know angle of attack and angle of _v.
HA is computed by interpolation of tables of HA versus Ho , ao , and _o •
Such tables can be _enerated either from test data or anslytlcal data.
Local Static Pressure Ratio:
The ratio of local static pressure to the static or total pressure at
another duct station is a vldely used control signal. Durln_ the "Lov
Performance" mode of inlet operation of the XB-70 for example, the bypass
doors are opened to pull the terminal shock aft to the "Dovnstrean Shock
Position Signal" station, thereby providing tolerance to larger airflow
transients.
Figure 29 shows theoretical and test observed variation in the DSPS
static pressure, PI_ , vith terainsl shock position. Also shown is a
Page 40
reference static pressure, PDSR , at • station close to the enctne face
where flov is Llvays subsonic. _e static pressure mtto curve t _ p
indicates terminal shock position in units independent of absolute tote£
pressure. When "Low Performance" is called for, the byp_s doors open until
the ratio PDSS reaches a scheduled value.
Several procedures can be used to simulate the air induction syst_a
signals of figure 29. The moat appl'opi'iate method depends om the cont_
system design and the empirical data available.
Where the control system reacts only to the information that the
pressure ratio is above or below the scheduled value, it is sufficient to
use the shock position as a signsl. That is:
if X ) XDS S
P0ss-- < scheduled value
bypass doors move in closing direction;
if X < XDSS
-- > scheduled value
PosR
bypass doors move in opening direction.
Where the bypass rate depends on the difference between the observed
and scheduled values of PD6S__ , it becomes appropriate to use empirical
data tables of P_S as a function of terminal shock position azd inlet
throat area. This introduces the slopes shown in the test data of figure
29, associated with pressure feed back throu6h the boundary layer and flnAte
width of both the pressure sensor and the terminal shock.
When pressure sensor lines are relatively long and perhaps of dissimilar
32
Page 41
le_he, steulsttoa of the 1tee ];_ue sad sm]_Lt_Lo z_s]?ee_e cZzemeterLotLos
_sy reo._Lre thl&t the absolute s_tto p_essure at t]w |spoor ]Lressuro _]?s be
c(wputed. This can be dm_e M follow. If X > XDm • M_8 is obtai.ed b7
lterstlve supersonic solutio_ of the equstlon
Hi , ,, ,
(1 ÷ ._2)3
T_ln
Ptxi
Pm_ (i + ._-_
If X _ XD6ps , MDSpS is obtained by iterative subs_ic solutio_ of the
equati_
MDSpS WD6pSi
(i+.z%sm2)3"5 Pt3_PS_ _-_ "ADSI_
Then
_sm = Ptmm
(i + .a_sm2)3"5
Assu_ total pressure losses in the subsonic flow to be proportional to
duct le_h,
or
Pt_ " P_DSPS = XDSpS " X
Pry - Pt2 x2 - x
x -xl
33
Page 42
The val_m of WDS m can best be determined by c_l_tlca of the spsclfl@
geometry. For the XB-70 configuration, XDS _ Is slightly downstream of the
porous bleed section, s_l, ignoring secondary _msalcs effects, WD6R3 = Wz .
Duct Overpressure:
To minimize air induction system weight I it amy be desirable to have
a control function which opens the bypLss doors when necessary to limit
differential pressure •cross the duct _ to • scheduled maximum. The
sign_l pressures required are POP and Po where the control mmlntalns
POP " Po -<AP scheduled. Po is obtained frcl flight conditions. POP is
obtained in • manner similar to that described above for cc_uting PDSS •
Shock Position Pressure Ratio:
The terminal shock positioning parameter, SPP, for the B-T0 inlet is
the ratio of the shock position manifold pressure PSPM, to • throat total-
pressure-probe pressure, PSPR • The shock position manifold and the throat-
total-pressure probe are shown schematically in figure 28.
As the terminal shock moves forward, the numher of manifold static
pressure taps exposed to the high static pressure downstream of the terminal
shock increases s and therefore the manifold pressure increases. The total
probe pressure, which does not change with tersinal shock positimn_ serves
to eliminate the effect of absolute pressure level. By properly spacing
the holes in the manifold, the ratio of manifold to total l_obe pressure,
SPP, can be shaped to give a near linear variation with, say, corrected
_ight fl_, Wo/(Pt2/Pto ).
In the B-70 inlet simu/atio_, SPP is obtained by inter_x_lation of
model test values of SIT tabulated •s • function of terminal shock position,
3_
Page 43
, throat area, and _ . These factors define the terminal shock
ATP_
position, inlet pcmstry, and inlet throat _ch n_ber.
Examples of the equations used to obtain inlet signals to the control
system are presented in figure 30. The rmpresentati_ for _te_mg the
Em_mmtrmam Shoak _rmmeter, D_P_ is & o_H Bmtwmen the several methods
discussed previously. PDSS is set equal to Py when the termimmA shock is
for_rd of the sensing stationp and equal to Px when the shock is aft of the
sensing statlon. PIeR is set equal to Pd • While not precise_ these values
give reaso_ble approximations of the signal pressures with & minim_ of
calculatioms. A similar simplification is used for the Overpreuure sismal.
35
Page 44
t_STARTING PEASE
The mode of inlet operatl_ wherein a _rma.1 shook travels upstream
from the aero_c throat to the cowl llp, figures 3 an_ _, is terme_
the Unstarting Phase. Figure 2 shows the typical pressure drop during thls
phase a_ its relationship to the remainder of the ummtart transient.
Unstartin$ can be initiated by either of two comd/tions. In one,
later referred to as Insufficient De_ _amtarting, the airflow d_
downst_mmm of the inlet throat becomes less than the airflow through the
throat section. In the other, called Choked Threat Unmtar_ing, the captured
airflow exceeds the airflow that can pass through the throat at the existing
total pressure and temperature. The separate sets of logic for simulating
Insufficient Demand Unstarting and Choked Throat Unstarting have been
combined in the mutually-inclusive Unstartim 6 Phase.
Insufficient Demand Unstartln_ Simulation Concept
Figure 31 is a schematic representation of the Insufficient Dema_i
Unstarting simulation model. The model differs frum that for the Starte_
Phase in that it has one rather than two "lumped volumes" with distribute_
properties. This simplification is Justified both by the lesser accuracy
requirements for this phase and by the agreement between the simulation a_
model test data.
In brief, properties downstream of the terminal shock are _etermine_
from the instantaneous total mass and total temperature in the Duct Volume;
and, the properties upstream of the terminal shock are determined from the
instantaneous flight conditions and inlet geometry. The terminal shock
Page 45
Ve_i_ _ t_t value required to satisfy the upstreamand downstream
"oondltlons at _ instant. Shoek position Io obtained by Inte_tlon of
the shock velocity.
Choked Thromt Unstartin 6 Simulation Concept
Inlet unltart because of insufficient thromt area to _s the c_ptur_
airflow can result i) from attitude chanps increuing the captured alrflov,
2) fraa decreases in thromt area, and 3) from flight Mmch n_mber reductioma.
Whatever the cause, the excess of inflov over that which can pass through the
throat results in the formation of a normL1 shock in the throat.
In the simulation program, this mode of operation is initiated by
arbitrarily locating a normal shock a small but finite distance forward of
the throat. The vol_ between this normal shock and the throat then
becomes the control volmne for the Choked Throat Unstarting Phase as illus-
trated in figure 32. Inflow to the "Throat Volume" is a function of the
supersonic flow conditions Just upstream of the bormal shock and the normal
shock velocity. Flow leaves the oo_trol volume through the choked throat and
through any boundary lamer bleed exits in the control volume. Outflow is a
function of the total pressure and temperature in the control volml and
the effective throat and bleed areas. Total pressure and temperature are
computed from the instantareous values of volmne, ,ross, enthalpy and averQ_e
velocity in the control vol_me. Shock velocity is determined by iteration
to obtain thet value necessary to satisfy the instantaneous flow conditions
usptrsam aria dovnstream of the normal shock.
It is e_sized that the normal shock described above is in addition
to the origimally existin_ terminal shock. That is, there are tvo simul-
tameous normal shocka in the inlet. During the ummtarting tranlient, the
37
Page 46
upstream normml shock motion is independent of conditions 8_wns_4mn of the_r
inlet throat ( unless the terminal shock moves forward of the throat). The
terminal normal shock motion is, however, very much a function of the
upstream conditions and therefore of the upstream normal shock.
Figure 33 illustrates the dependency of the terminal nor_l shock
motion on the choked-thr_t-induced transient. As the upstream normal shock
forms at the throat and moves out of the supersonic diffuser portion of
the inlet, the ratio of total temperature across the shock rises and the
ratio of total pressure drops rapidly. The associated chan@e in pressure,
temperature I and flow Just upstream of the terminal normal shock then cause
it to move upstream. Depending on such factors as the position of the
terminal normal at the time of throat choking, the terminal mormsl shock
may overtake and coalesce with the upstream normal shock before it reached
the cowl llp.
Because of their interdependency, the Insufficient demamd and the
Choked Throat Unstarting Phases have been combined in the single Unstarting
Phase. In those cases where an unstart is induced by throat choking, the
throat total pressure, temperature and flow computed by that Phase logic
become the upstream conditions for the terminal shock. Switchir_ to the
Empty-Fill Phase occurs when either the upstream normal shock, the terminal
normal shock, or the coalesced shock pass the cowl lip. This procedure
assumes that the Unstarting Upstream transient is independent of the terminal
normal shock, or to be more specific, that there is sonic flow through the
effective throat area. If and when the terminal shock passes forward of
the throat, flow in the throat will in actuality be subsonic. The error
in camputed outflow does not, however, appreciably affect the overall tranllent.
$8
Page 47
t"Mo=e 4ststls of _ slm_stton lollle are presented la the 41s_ssioas
of the vs._om _orttcm o1' the _lng Phsse.
Vpetre_ P_erties
The sim_latlon model for the Unatarttng P_aae is presented In ftg_re
3_- Durin£ the Unatarting Dovnatrean transient, the Upstre_ ¥o1_ beecaes
vanishiz_ly _ and does not affect the upstream properties relative to
the Duet Vol_.
Upstream properties for the _petreai Vol_e are ec_ted as shown in
figure 35. T_ equations used to compute Ptx , Ttx s WII , and MR am
identical to those used in the Started Phase, figure 11. The data tables
used in calculating these properties are also identical and intercbsngeable
vlth the 8_rted Phase Tables.
Ptx is, by definition, the total pressuze just dovnstre *m of the
oblique c_epresslon shock waves in the supersonic _Lffuaer but upstream of
any normml shock within the inlet. Ptx increases, therefore, as the normal
shock moves for_wrd and eliminates part of the oblique shock system total
pressure loss. Oenerally speaking, the oblique shock losses frcm the cowl
to the throat are small, and the assumption that the oblique shock losses
(aDd therefore Ptx) do not vary vith nor_ shock position is considered
adequate for the Unstarting Phase of inlet simulation.
Properties U_etrem of the U_etream Normal Shock
Equations for cc_tt_ properties Just for_rd of the upstream normal
shock are presented in figure 36. Note that Wxu exceeds WII irma_uch aa
WII is defined as the total oapturod alr_lov less the bleed flov up to
station XXX d_ started o_e .rmtloa as _Uu, trated in figure 37.
39
Page 48
ai_1ov sm_ cmmilative bleed flov are plotted u • i_nctlon of inlet stst£_
for four terminal shock posltions. At a given norea_ shock positlon, Y_ ,
flov Just uI_treaa of the shock vl].1 be WII ÷ _bbx as express_l g1_l_tc-
ally in figure 37. Note that while there is less bleed flow forv_d of tbo
nonll shock as it moves upstream in the supersonic diffuser, the total
bleed flow increases as more of the bleed area is exposed to higher-static-
pressure subsonic flow.
Prol_erties Behind the Upstream Normal Shock
Properties Just downstream of the normal shock are determined by
1) computing the M_ch number of the upstream flow relative to the moving
normal shock, 2) computing static pressuze and tewpematttre fr_ the u_etreau
static pressure and te_rmture and the upstream _h number relative to
the shock, 3) calculating the downstream Mach number relative to the movi_
shock, 4) calculating the downstream M_ch number relative to the duct, and
5) computing total temperature relative to the duct frco the downstream
static temperature and the Mich ntwnber relative to the duct. Figure 38 is
a diagram of the equations used for these calculations.
Boundar_ La_er Bleed Forward of the Throat
Illustrative curves of total boundary layer bleed flow, bleed flow
upstream of the normal shock, and bleed flow downstream of the nor_ shock
as _ function of shock position are presented in figure 39. These charac-
teristic curves may be determined from analytical considerations or by inter-
polation of test data. The c_un_es shown were obtained by straight-line
interpolation of data such as shown in figure 37. Each particular inlet
and bleed configuration will have its own characterlstles. Those of the
4O
Page 49
XB-70 eonf£4pu_tio_ are essentially lins_r M shorn.
Su]?ereooic flow at • station upetrun of noruL1 shock hetween s_tlOU
XIi and XI s figure 37, is equal to WIl plus and ino_nt, aWbb x . For
the bleed .kmracteristics shown in figure 39,
In t non..d_sensio_.], form,
AWbbx m dWbbx/WII (XII-_ Xu>(WII>
" _xu(Xii - Xu) WII
dWbbx/WII between stations XI and Xii .dx
in the subsonic flow region between the normal shock
where _xu is the slope
Bleed flow, Wbby u
statlon_ Xu s and the throat is computed in a similar method as that den-
cribed for ccoputinK _Wbb x . Equations for ccaputing Wbby u and AWbb x are
listed in figure 40. As in the Started Phase, quasi-steady state bleed flow_
Wbby u , is corrected to the dynamic conditions by the ratio of instantaneous
to quasi-steady state static pressures aft of the normal shock. That is
Wbb "
The equation for computing Wbbyu used in figure 40,
b_" _yu(Xu " XT)WII
would more properly be
Wbb-_ " ['yu(Xu - XII)+_y(XII- XT)]WII
becauae the aerod_c throat statiom and the bleed zooe bea_ station,
41
Page 50
XIi , will usum/ly differ slightly. The error intro4uced is trivial for
most configurations.
_stream Volk_ ' Mass_ a_i Total Temperature
Inflow to the Upetream Vol_ can be envislone_ to co,slat of two
;arts, flow relative to the duct at station Xu and the quantity of air
swept by the shock face moving throu@h air at a density Pxu with a
velocity
whe re
dXu relative to the duct. That is
Wxu" _Dxu Axu Uxu - g&u Axu -_e_u.Wxu _UA
d J( u
U½u - Uxu - .._
Outflow is the s_mmtion of flow out of the boundary layer blee_ exits
in the Upstream Volume and flow through the choked throat. The latter is
WT ,,KuPtu ATA
where the throat Mach nmaber is assumed to be unity and Ku is an empirical
flow coefficient which accounts for non-uniformlty in Mach n_her at the
throat.
The quantity of air in the Upstream Volume at any ti_, t_ is
t[
W-u. W_-ui+ |dWu dt
- ]i -I6
dWu is the difference between inflow,where i denotes the initial value and __
Wxu , and outflow, WbbYu + WT • Detailed equations are presented in figure
41.!
Total temperature in the Upstream Volume is computed on the assumption
42
Page 51
that total telpemture is uniform t_t the vmlmm at an_ instant.
now er_s_ tb shock face enl_ers the volume at the total tmaperature,
Try u . Flow lemvtn_ the volmm Is at the uniform total temperature, Ttu .
wA % Tt_ - (wT+
Fefoz'e
W'b'o_)cp_tu . 4(wucpTtu)dt
dt
wA _t_ (wT+wbb_)_'t.- WA _tu (w_+Wb.oyu)Ttu+_w _Ttu
OF
dTtu Wluq_-- _ (_t_ -_u) •
These eq_t£omJ arm summarized in figure 41.
Ul_tream Vol_ Total Pressure
C_eu_tlon of tot_ pressure in the Upstream Volmm is based on the
stml_l_yl:4 ssSumptl_ tl_t the &refuse density is the same as that at a
flow &l_& whleh to the &veraje of the upstream and downstream faces of the
Ul_tre_a Volmm. M_ch nmaber Mu is computed at this station where
Au" _Axu + AT) assmmln_ that the flow qu_ntlty, total pressu_, and total
_rmtu1_ are equml to those at the throat. (The error introduced by
t_eoe u|_s_tloms ls small when the shock is near the thro_t. The effect
of sm_ error on the overall transient is _ as the shock &ppromches the
cowl llp).
Total pressure, Ptu , is then computed fr_a the relatlonshIpa
_u_U i __- -
I
RTu Vu
_3
Page 52
and
Ptu/Ttu. (z , 2)2.5*
Figure 42 is a flow diagram showing all the equations required to coRpute
Ptu" Inasmuch as subsonic total pressure losses in the Upstream Volume are
extremely _, total pressure is assumed to be uniform throu6hout the
volume.
U_strean Normal Shock Ponitton
upstream normal shock position is obtained by integration of the
shock velocity. Shock velocity is determined by iteration as that value
necessary to satisfy the instantaneous pressure ratio across the 8hock_
Ptu/Ptxu s where Ptu is obtained from continuity in the Up6tream Vol_ne and
Ptx is computed from upstream properties.
Various c_nputer approaches may be used to determine the shock velocity
necessary to satisfy the instantaneous pressure ratio across the shock. All
are variations of the following general procedure.
i) Static pressure s Pxu s and static temperature s Txu are ccRputed
frcR Mxu , Ptxu , an_ T_xu which are supersonic flow properties
relative to the duct at the instantaneous shock position.
2) A shock velocity relative to the duct s dXu/dt iie assumed and the
corresponding Mach number of the flow relative to the shock is
c_puted as
axu
3) Subsonic flow static pressure_ Pyu _ s_tic temperature Tyu and _ch
_nber relative to the shock s _u s are cclputed fr_l conventional
Page 53
_)
normal shock equations and the _uaatittes M_u s Pxu , and Txu .
Note that the static properties are not dependent on whether the
duct or the shock is used as the reference. That is, Pxu" l_u ,
T_- T_, P_- P_, _ _" T_Downstream Mach nuaber relative to the duct is computed as
_-_+_
5) Downstrema total pressure relative to the duct, Ptyu , is computed
as
Pt_ " P_(1 ÷ ._)3.5 .
6) Ptyu is then composed to Ptu (or Ptyu is compared with Ptu )
If Ptyu equals Ptu , the total pressure ratio across the normal
shock is satisfied, and the assumed shock velocity, dXu/dt , is
correct. If Ptyu does not equal Ptu , the procedure is repeated
with a different assmued shock velocity.
k graphical solution of the foregoing equations is presented in figure
_3. For example, if Pt__u_u. _Yu . 0.95 , and Mx is 1.5, the normal shocketxu Ptxu
Mach n_ber relative to the duct is -0.135. It can be seen that for many
conditions there are two shock Mkch numbers which can satisfy the total
pressure ratio across the shock. The simulation program is arbitrarily
restricted to the solid line portions of the curves to the left of the
minimums of Pty/Ptx •
The equation used for iterative shock velocity solution in the digital
computer simulation program of Reference 1 is
_5
Page 54
lnaccurscles _urin6 the initial portion of the transient occaesionally
result in PtMIP_x v_es below the ainlaua for the associated Mach number,
Mx . _rhile thls condition exists, the shock Mach nuaber, (dX/dt)/a x is set
equal to the '_wer LIMit" vLlue a thst is, the vaiue where the slope of
ctei can alas result in i Intary downBtrel excursion of the sick.
Because the upetrem normal shock is initially located Just u_tream of the
thrcat station, • •mall downstream excursion could eliminate the Upstream
Volume, a_d t_revlth, the simulation logic. Cor_equently_ the iteratlvely
ccRputed shock Mach number is checked; and, if it is positive s its value is
set to zero.
The equatio_ for ocmputing upet_eaa normal shock position are listed
in figure _J_.
Upetreem Properties for the Duct Volume
It will be recalled that the Started P_ase contains logic to determine
when • switch should he _de to either the Choked Throat Unstartir_ Phase
or the Xnsufficlent De, rid Unstarting Phue. To review, if the captured
airflow (less bleed to the throat) exceeds the airflow that can plsll through
the throat at sonic conditions, the Choked Threat Unstartln_ l_e is
initiated. If the total airflow de_ is less than the captured airflow
Page 55
and the terminal normal shock moves forward of the aerodynamic throat,
Insufficient Demand Unstarting is initiated.
ChokeA Throat Unmt_rting:
Knovle4ge as to which )hess is applloable is carried over to the
Unstartln_ P_m_e vhiah incorporates both plmses of _tmrting logic in •
sln61a phase. If the Choked Throat Unstartln$ Pbue is &ppllosble, the
total tewperature sad total pressure in the UIntr_m Yolume bec_ the
total taqlrsture and pressure ul_treal of the teraLinal shock. That is,
Ttx = Ttu
Ptx " Ptu
If the terminal shock is aft of the throat, the flov Just upltremm of the
ters_n_l shock is
Wx - WT - Wbb x
If the ter_InLl shock is forward of the throlt, the flow Just upstream of
the terJLinal shock is
Wx - WT + AWbb ¥
The above flow relatio_mhips are shown mcbemmtleally in figure 45. Once the
terminal shock moves forwLr_ of the throat, the assumption of sonic velocity
in the throat used in computing WT is no longer v_lid. However, the error
is considered acceptable for this transient.
Insufficient _ Unstartln6:
If the Insufficient De_snd Urmtarting Phase Is applicable, the
Upetrmam Volume vanishes and the properties upstream of the terminal shock
are identic_ to those forvard of the nov non-existent upstream nolwA1
shock. _nat is,
47
Page 56
Ttx- Ttx u- Tto
Ptx " Ptxu
Flow upetre#am of the shock is
W x- WII+ 4Wbb x
as illustrated in figure 37. The equationm used in c(Jeputin_ p_rtles
upstream of the terminal shock are presented in figure _6.
Prol_rties Behind the Terminal Shock
Equationl for computing properties Just aft of the terml-=l nor_l
shock are presented in figure _7. The equations and logic are identical
to those for the uI_tream normal shock_ figure 38.
Boundary Layer Bleed for the Duct Yolmm
When the terminal shock is aft of the throat during the Choked Throat
Unstarting transient, flow between the throat and the termi_ml shock is
supersonic. Consequently, the slope of bleed flow ratio per unit length
of duct, d(Wbbx/WII)/dx " _x s derived from started inlet dmta can be used
to campute bleed flow between the throat and the terminal shock with
sufficient accuracy for the Unstarting transient.
That is,
Wbb x J, _x(X - XII)(WII)
Similarly, bleed flow frcm the Duct Volume is
Wbby " (_) (X - XIII)WII
When the terminal shock is forward of station Xii , bleed flow forward
of the terminal shock will be less by an amount AWbb x than it would he wlt_
the tersIDal shock at XIl . Using the logic discussed previously for the
48
Page 57
Upstream Volume and shown graphically in figures 37 _=a _gs
(xxx-X)Wxx •
Similarly, bleed flow care of the Duc% Volume is
Wbby" [(_)(XII "XIII)+ (_ru)(X "XII)] wII ryPy
If _yu is approximately equal to _y , the letter eq_tion can be reduced
to
_by" (_) (X - XIII)(WII) _Y
When the termiaal shock is fo_au'd of the inlet throat, flue Just
upstream of the ter_msl shock will exceed the flow at the throat ststion
by the bleed flow, 4Vbby between the terminal shock and the throst (see
z±sure _) _.ere
4Wbby" (_u) (X - XT)(WII)
The e_ustio_ and lo@le used to ccwpute bleed flows relevant to the
Duct Volums are summarized in figure 48.
Duct Losses
Both s_nalmtloa accur_y requirements and the effect of mmll lmmcour-
a_les o_ the overall transient are less for the Unatartl_ Phase than for
the Started Ph_e. The logic for determining total pressure losses other
than shock leeees Is, therefore, less critical t_ for the Started P_.
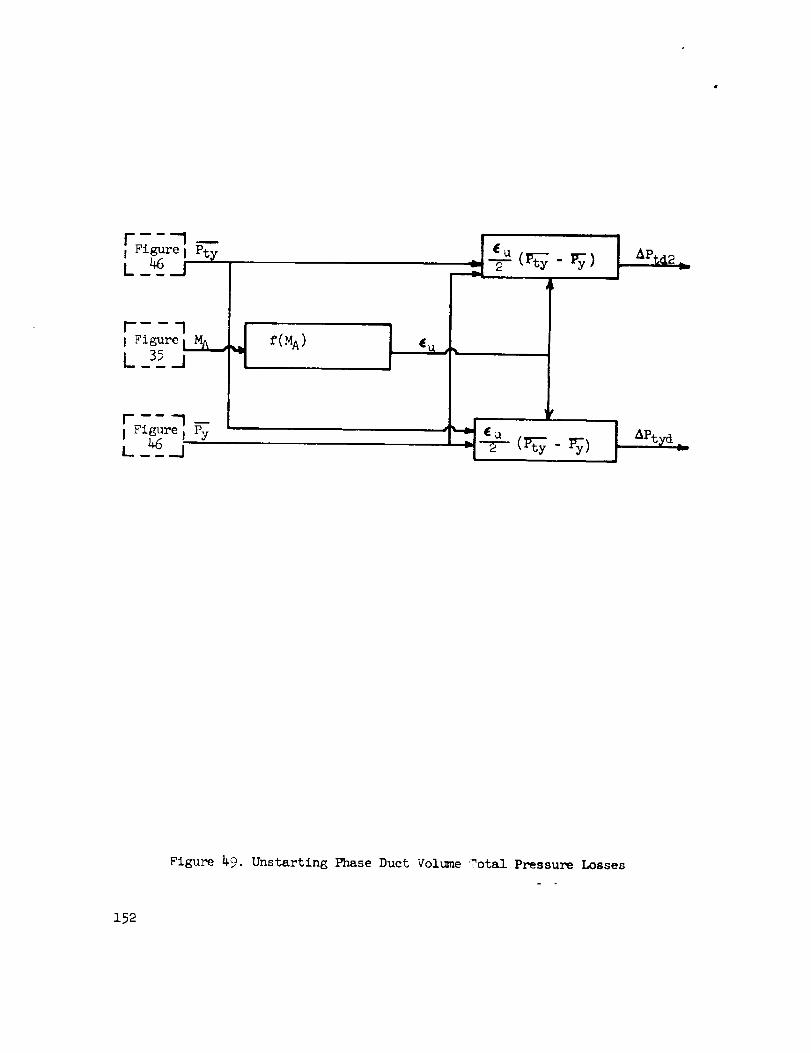
Ass_ti_ msde in the total pressure lees calc_tioml presented in
figure 49 are as follows:
i) Total pressure losses from the eowl lip to the terminal shock
are me@Liable.
Page 58
2) Losses a._ of the terninal shook Lre proportlo_A to the qmst-
_r_ml shook. Use of _¥ - _ rather rhea the actual _mmte
hesS, Pay " Py , eltai_tes s redundancy in the sho_ action
eq_tlons vith little loss in accurLe 7. The e_plrloal loss factor
can be expressed as the function of surf approln_Ate psrsmetere_
for exsap_ HA as used in the equations of figure _9.
3) Losses fraa the termlnsl shock to the averlqme density station, d;
and the losses from statto_ d to the engine face are assmmed to be
equal.
_pasl and Enline S_tm Airflows
The duct airflow demand, We i is the 8_mation of the bypass airflow
and the engine system priory and secondary airflows. Figure 50 shows
typical equltlons used in ocmputing We for the XB-70 configuration wherein
the bypass total pressure is sufficient during the Unstarting Phue to
ensure sonic flow in the minimum area section of the "Main" and 'Triu"
bypass doors.
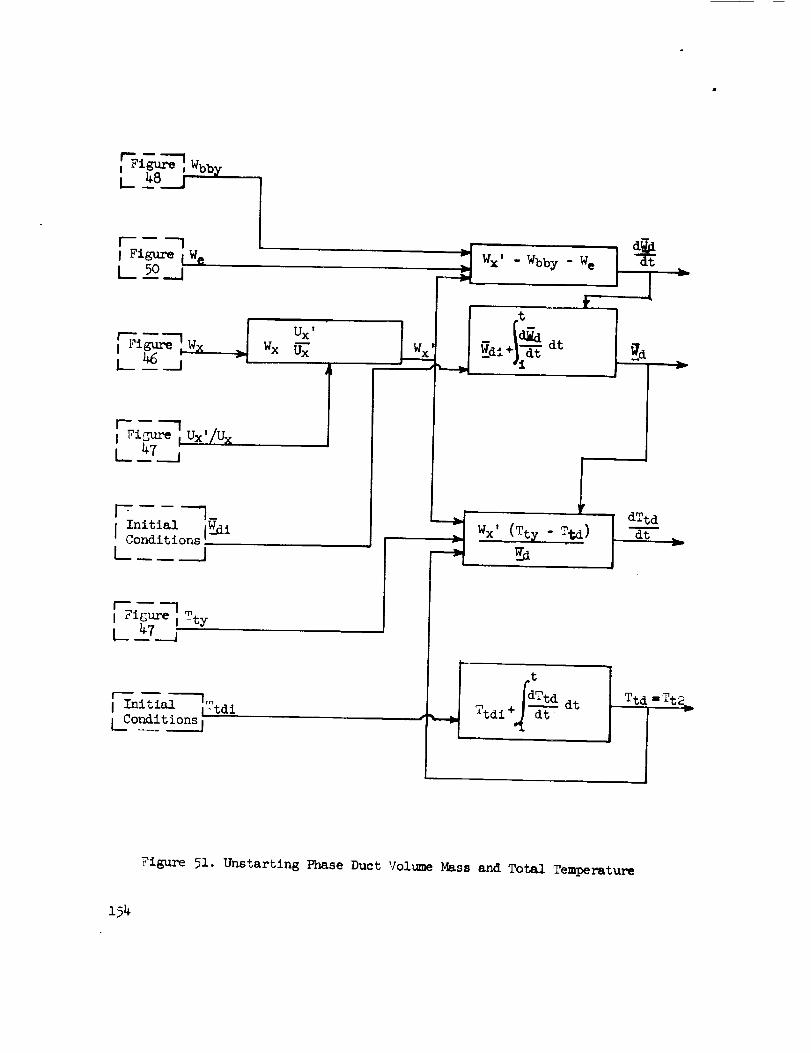
Duct Volume Mass and Total Teaper_ture
Air quantity in the Duct Volume at an7 instant is the initia_ qus.utity
of air in the velum pluJ the difference between inflow and outflow from
the volume over the given time interval. As described in the Started Phase
section s inflow is the flow crossing the moving termln_ shock fsoe of the
Duct Volume,
Ux'.W x M_'Wx'"WxUx
50
Page 59
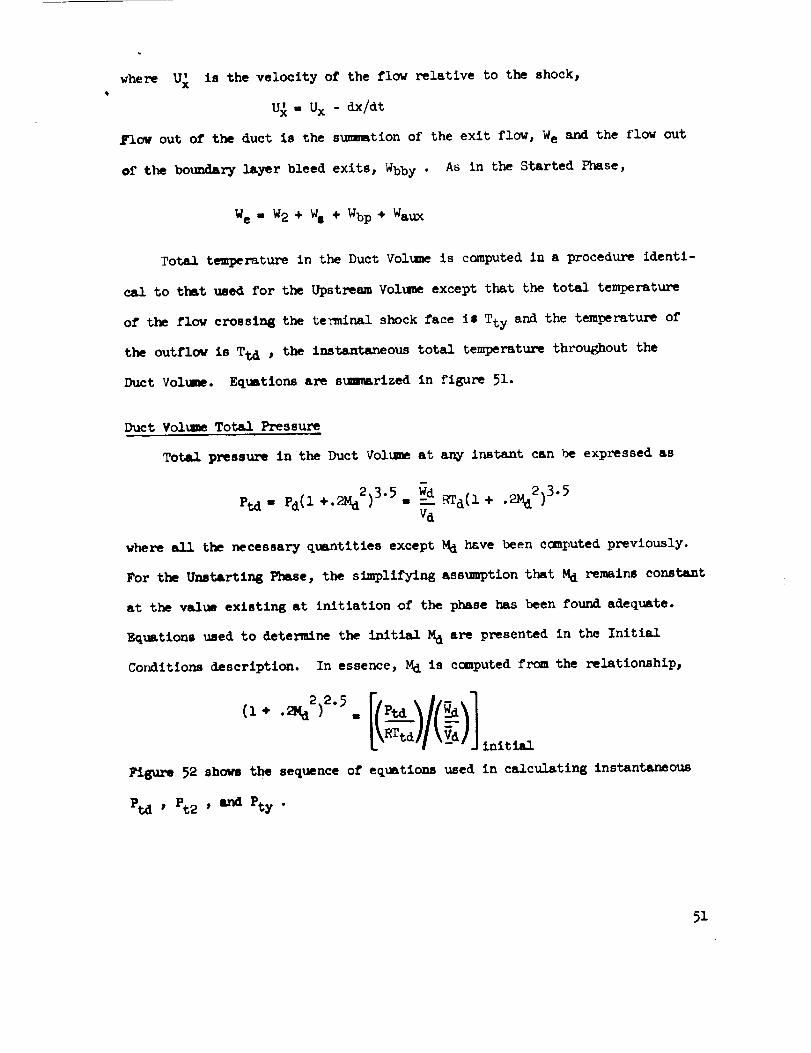
where U s is the velocity of the flow relative to the shock,
U_ = Ux - dx/dt
Irlow out of the duct is the summation of the exit flow, We and the flow out
@f the boundary layer bleed exits, Wbby . As in the Started Phase,
We " _2 + w, + _bp + _aux
Total temperature in the Duct Volume is computed in a procedure identi-
cal to that used for the Upstream Volume except that the total temperature
of the flow crossim 8 the terminal shock face is Tty and the temperature of
the outflow is Ttd , the instantaneous total temperature throughout the
Duct Vol_me. Equations are suB,arized in figure 51.
Duct Volume Total Pressure
Total pressure in the Duct Volume at any instant can be expressed as
P_a = Pd( I +'?_a2) B'5 = _ _d (I + "2_a2) 3"5
va
where all the necessary quantitles except _ have been computed previously.
For the Unstar%in_ Phase, the simplifying assumption that Md remain8 constant
at the value exlstln@at initiation of the phase has been found adequate.
Equations used to _etermine the initial Md are presented in the Initial
Conditions description. In essence, M d is computed from the relationship,
- initial
Figure 52 shows the sequence of equations used in calculating instantaneous
Pt2 , Pry•
51
Page 60
Teminsl SMock Position
The tenBinel shock velocity and position are oo_C_ed in procedureo
identical to those described in the section, UpstreM Normml Shock position
These procedures are indicated by the equJtions of fia_u-e 53.
Phase Switches
The Unstarting Phase almost invariably terairates by switching to the
Empty-Fill Phase when either the terminal shock or the "upetream normal
shock" move forward of the cowl lip. However, conditions can be such that
the transient will reverse and operation revert to the Started Phase. This
occurrence is recognized by the switching logic when the following conditions
are satisfied:
i) the transient was initiated by insufficient demand
2) the terminal shock moves aft of the geometric throat.
The fact that the inlet ge_netric throat is usually downstream of the effec-
tive throat provides hysteresis, so as to speak, to prevent small initial
errors from causing repeated switching between the Started Phase and the
Unstarting Phase.
The Phase Switching logic equations are presented in figure 54.
Outputs to the Air Induction Control S_stem
Logic possibilities for simulating control system signals are helic-
ally identical to those described for the Started Phase. In fact, the
control system simulation usually requires that the same logic be used in
all l_bases of inlet operation to provide a consistent and continuous si_p_al.
Inasmuch as the inlet signal logic to be selected will vary widely with
the simulation objectives, only the unstart signal parameters used on the
52
Page 61
.XB-70 are _Lsaun_L for the U_._Im4_ FaMe.
_llmm 55 sbov_ the loo_tlaB of the I_o pFeslure _ used to sense
unmtart, an_ hov the presmures vary dur_ am unstart. The ratlo of tk*
.Igni_ to reference pre.em, PtrS/l_ , le _.o e_mll. As the terminal
normal shock morea forvard of the tap, PUB , there i| in abrupt increase
in local static pressure stud In the non-_memsto -_1 pressure _stto, _/PuR •
As far ms the controller is concer_d, u_tart _curs v_n the pressure
ratio increases to a pre-selected v_lue as tllustrsted In figure 55. Note
that it Is the flrst normal mhock to cross the statlc pressure tap, Pt_ ,
that sigDal8 an unstart. This may be either the ter_ shock or, in
event the unJtart was inltlated by throat choking, by the upstream normal
shock.
Depending on the degree of simulation refiMm_nt desired, either i)
the u_start pressure rstio can be simply represented am a value above or
belov the controller scheduled vaAue imdi_ti_ _ustart depemdin_ on whether
the normsl shock is forward or aft of the PUS tap; or 2) the i_lividusA static
pressures at PUS and _R can be computed by the methods similar to those
described in the Started Phase Section.
_3
Page 62
EMPtY-FILL PEASE
Simulation Concept
The Empty-Fill Phase, as suggested by the title, consists of two
distinct mo_es of inlet operation. Inspection of a typical buzz pressurt
trace, figure 56 reveals the similarity of the characteristic pressure
to that of a container having negligible inflow, an_ outflow proportional
to the pressure (or mass) in the container. The "filling" portion of the
trace shows a corresponding similarity to the filling process of a container
having constant inflow, and outflow proportional to the pressure (or mass)
in the container.
Schlieren photographs and static pressure data obtained during buzz
show extreme separation during the emptying mode of operation, but reattach-
ment of the flow during the filling process. Further, pressure taps in
several inlet models have shown static pressures during the emptying process
to be quite close to values computed assuming sonic velocity in the flow
downstream of an external normal shock. This region of near sonic pressure
is in the vicinity of but is more extensive than the geumetric throat region.
A simulation model for the Empty-Fill Phase which is compatible with the
foregoing observations is illustrated by figure 57.
The governing mechanism during the Empty-Fill mode of operation is flow
separation, both in actuality and in the simulation mo_l. Because the
separation process is not readily amenable to theoretical treatment (nor
is the process overly consistent in Nature), various arbitrary assumptions
as to separation characteristics are required inputs to the simulation
Page 63
. ]?a_psn. These au_ptlem lael_de the rote ask ]patte_ eg tko ee_amtlea,
the d_et ]i_eseure at vhleh mattaolmoat IB initiated, sad the rate sad
pattern of reattaelment. Trial and _r vsxia_ion of thoN o.har_terlotlee
have short I) the simulation moults am not overl_ seMitlve to the s.lmr-
atlm e_zaoterlstlcs aeem_d, and 2) noa-dAaoastoasXlsed selmratlem chare_-
terlstlee based on test data give sim_atloa results in good a4_ee_nt vlth
test data for inlets of _utte varied scale and eoafl_rstlon, Reference 3.
(Aip_ezmat is eo_mtdare4 8oo4 if the differences betveen a simulate4 aa4 a
test tro_lent are of the same _4_itude am the differences between several
test transients. )
The single control vol_me and the associated flov stations and terai-
aolo_ used in the Depty-F_ Phase simulation are defiaod in figure 57.
Properties in the Duct Volw are "l_eped" in that chants are a_smmd to
occur si_taneouml_ throughout the Duet Volum; however, properties differ
from statics to station in the volume. Terminal shock motion is determined
by iterative solution of the motion required to satisfy the independently
caeputed properties upetreaa and downm_ream of the shock. Further details
of the equJtiozl and logic are discussed in accordance with the severL1
functlo_ bloeks which make up the si_tlot_ pro_.
D_etre_ Properties
The calculations for deteraining properties upetma_ of the terminal
shock, figure 58, are nearly identical to those for the Started Phe_e. The
o_e differe_e Is that (Ptx/Pto)E to the total pressure recovery down_trea_
of the exter_ oblique shocks and the external nor_ shock. Total pres-
sure meov_ry for the Started l_e, Ptx/Pto , I the total pressure in
Page 64
the i-let downstream of the oblique compression wBvme but u_trm_ of
normal sboak. (Pt_Pto)E is determlmmd with the ext4rmLl normal shock
close to the cowl where £t will be during the "Fill" p_ue. Durlm6 the
Empty _e (where forwLrd motion of the extermml normal shock will ellml-
mate portions of the gecmetry-cre&ted oblique shock waves and flow selmrmtiol
will create mev oblique waves) accuracy of the total pressure calculation8 is
not critical. Consequently 2 the total pressure recovery_ (Ptx/Pto)E ,
ccmrputed for the Fill mode is satisfactory.
The started inlet flow, WII , is a fictitious flow durin K unatarted
operation, but is used in the simulation phase switching logic to determine
when an inlet restart occurs.
Properties at the Terminal Shock Station
Properties at the terminal shock station are computed from oue-dlmen-
sional flow relationshipe using airflow, area, total pressure, eu,d total
temperature at the terminal shock station. In addition, intelll_ence is
required as to whether flow Just upstream of the terminal shock is subsonic
or supersonic. Flow conditions are illustrated in figure 59 for the three
possible conditions during the E_pty-Fill Phase: 1) terminal normal shock
aft of the throat during the Fill mode of operation, 2) terminal shock
forward of the throat during the Fill mode of operation (similar in many
respects to the Unstarting Phase), and 3) terminal shock aft of the throat
during the Empty mode.
The Empty-Fill Phase differs from the previous Phases in that Wx is
no longer a unique function of inlet geometry, flight conditions, sad
terminal shock position. Rather, the known factor during the Dmpty-Fill
Phase is that the flow is sonic in the effective throat for conditions 1
%
Page 65
and B above, •hA near sonic for the shore-duration cond/tton 2.
v_- _ _ (l .,..z,,_2)3"°
Ptx A_: X
By Inspection of figure 59, it can be seen that if:
The refore s
x>_, WX-WT-Wbbx
X<X,z,: Vx-W,Z, +aWbby
The equations of figure 60 show the logic used in determining the
applicable condition and how the required properties are computed. Note
that the equation for Wx in figure 60,
Wx " WT + AWbby u - Wbb x
degenerates to the for_l shown in figure 59 inasmuch as aWbbyu vanishes with
the terminal shock aft of the throat add Wbb x vanishes with the terminal
shock forward of the throat.
Properties Behind the Terminal Shock
Calculations shown in figure 61 to compute properties Just downstream
of the terminal shock are identical to those previously discussed for the
Unstarting Phase.
Effective Throat Area
The gemerLl concept of flow sel_rstlon and re•ttacbment which results
in a tlme-varying effective flow area at • given geometric station has been
indicated in figure 57. In absence of detailed information, a flow separ-
atlon _ttern is arbitrarily selected to give simple equations for effective
Page 66
flow area at • glvem s_atioa as • _netlea of ttDe.
]_Lre 62 _plcts the •slalom _ in _1_1¥1j_ the equatloM of
figure 63. The ass_spttons are mule that l) the effective thrcst ares ia
at the geometric throat station, sa_ 2) the effective flow area varies
linearly vtth station In the detached flow region. It can he seen that,
from purely geometric consldermtlone, effectAve flow ares st a_r I_,AI,tlom
X between XT and XRA is
A ,f- Wef ÷ (X - XT) - ef)-xT)
Effective flow area aft of XRA is identical to the geometric area.
Note that the only parameter that must be expressed as a function of
time durln_ _he period of separation is effective throat area, ATe f .
Specifically, ATe f during the separation process is expressed as • function
of time frcu the initiation of the separation; and, ATe f during the reattach-
merit process is expressed as a function of time from the initiation of the
reattachment. Separation is initiated if:
i) Operation switches from the Unstarting Phase to the Empty-Fill P_e
2) The terminal normal shock moves upstream past the cowl lip in the
Empty-Fill Phase
3) Operation switches from the Subcrltical Phase to the Empty-Fill
Phase because the mmss flow ratio becomes less than the buzz-limlt
mLss flow ratio.
The simulation input curves of ATeffective/ATgeumetric versus time
after the initiation of separmtion were initially determined by trial era4
error. Various curves were assumed, and the curve glving best agreement
between simulation and test data was selected. This curve was then comverte4
Page 67
to a _-d_ulcmal form by ass_t_ that _d_ rate of _]pmmtl_ _ ]_o-
portlemal to the square root of the t]ar_ _ t_lwratu_ (ve:l_lt¥),
and inve_,_ lz_q_rticmal to the square root of the throat area (lea_th).
This non-dl_uelo_l curve has been used with good result| for quite varied
inlet sizes and conft_a_ations; however, better values for a specific con-
figuration can be determined by trial and error if sufficient test 4k_ta are
available.
Am pressure An the duet drops during the emptying mode of operatioa,
a value is reached where the flow reattaches. XB-70 model test data show
that the reattaclment usually occurs vhen the duct total to ambient static
pressure ratio, Ptd/Po , reaches a critical value t KEF . XB-70 test data
indicate that KEF was essentially independent of l_ch number and that a
KEF value of 6.4 is appropriate for "averaBe severity" unst_rt and buzz.
A KEF value of 4 was found appropriate for severe unetarts and buzz.
A procedure similar to that described above for separation was used
to obtain a curve of ATefTective/ATsecmetric versus time after Ptd/P O _< KEF.
During this reattachmen% however, ATef/ATgeo increases with increasing
time.
Although not essential, it has been found convenient, and in keeping
with the actual flow phenomena, to assume a constant area throat section
extending from the geometric throat station to the cowl lip.
The logic umed in determining effective throat area is smmarized in
the flow diagram of figure 63. F4uations for cc_ing effective flow area
at any station are presented in figure 64.
Effective volume is cumputed in a procedure similar to that used in
obtainin6 effective flow area. Equations are shown in figure 65.
59
Page 68
Boundar_ La_er Bleed Flow
L0_¢ for cce_uting boundary lair bleed flo_ _ similar in pneral
for_Bt to that uled in the Started l_ame. It d_fem primarily in that
bleed flow has been made non.d£mensional by using the parameter Wbb/WT
rather than Wbb/WiI . (WII is not a measurable parameter during tests
with unstarted supercritical operation. )
The validity and importance of the bleed flow calculation during
separated flow c_nditions might well be questioned i_mamuch as the bleed
effects can be readily absorbed in the gross asuu_ption of effective throat
area. However, it is convenient, if not neceuary, that a continuous and
consistent calculation be made during all of the Entry-Fill Phase so that
the bleed flow will be knovn when the flow reattaches. Because the accuracy
of the bleed flow calculation is of little concern during operation with
separated flow (emptying mode), the parameters Wbb/W T are dete_mimed by
test or calculations for unstarted, supercritical inlet ccmditions.
Assuming linear variation in bleed with shock position as illumtrated
in figure 14, and referring to the sketches of figure 59, it can be eee_
that bleed flows can be calculated as follows :
X > XII I : Wbbx/WT-_(xm -x_)
Wbby/WT = 0
AWbby/W T " 0
XT < X < Xll I : %b_W T" &(X -X_)
Wbby/WT"6(X -Xm)
_Wbby/W T " 0
6O
Page 69
X<XT: Wbbx/WT - 0 (no s_o_ta _ u_t_._ oe shock)
wb_/wT - _y(X - xIi x)
AWbby/WT - _(x - x_)
No_e that the reference flow is WT , while the reference flow in the
Started and Unstarting Phases is WIi .
Detailed equations are shovn in figure 66.
Duct Volume Total Pressure Losses
Figure 67 presents the equations for computing Duct Volume total
pressure losses. They are identical to those used in the Unstarting Phase.
BYl_S,s. and E_ns S_atem Airflows
The equations and logic for ccmrputing bypass and engine system air-
flows, figure 68, are identical to those for the Started and Unstarting
Phases.
Duct Volume Mass and Total Te_rature
The quantity of air in the Duct Vol_me at any instant is the initial
Inflow is the
, where
quantity plus the difference between inflow and outflow.
flow relative to the shock face of the Duct Volume, W_
x +Outflow frcm the duct volume, as in the Started and Unstarting Phase,
Is the summation of Wbby and We .
The logic for computing Duct Volume total temperature is identical to
that used in the Unstarting Phase. Note that total temperature behind the
external normal shock (and therefore upstream of the terminal shock) is
61
Page 70
assumed to be equel to freestream total temperature. This assumption in
effect says that the velocity of the external normal shock relative to the
inlet is trivial. Model test data confirm that, although the external
normal shock does move during the Empty-Fill transientj the total excursion
of the external normal shock is smell (most of the motion in the external
shock field durir_ buzz is in the oblique shock portion of set.rated-flow
lambda shock).
Figure 69 is an equation flow diagram for computing Duct Volume mass
and total temperature.
Duct Volu_e Total Pressure
The logic and equations for computing Duct Vol_ze total pressure are
identical to those used for the Unstarting Phase. The simplifying assump-
tion is again made that the Mmch number at the average density station,
Md , remains constant at its initial value. Fortunately, this assumption
is most nearly correct when greatest accuracy is desired during super-
critical, attached-flow operation with the terminal shock near the throat.
Equations are listed in figure 70.
Terminal Shock Position
The terminal shock position and velocity are calculated in a procedure
identical but for two exceptions to that described in the Unstarting Phase
section, U_stream Normal Shock Position.
The first exception is associated with the terminal shock which i)
forms at t.he throat upon initiation of the Phase, and 2) moves aft as a
consequence of subsequent events. The simulation logic ass_unes this termi-
nal shock forms initially at a station slightly downstream of the throat.
62
Page 71
Velocity Of this terminal shock is then _etermined fraB the instantaneous
total pressures upstream and d_wns_ream of the terminal shock. To elimi-ate
the possibility of the terminal shock being _riven forward of the throat
because of small errors in the initial conditions, the program logic sets
the shock velocity to zero until the total prelsure ratio across the shock
results in a positive (downstream) velocity.
The secon_ exception recognizes the fact that when the terminal shock
moves aft, the increasing shock strength an_ appreciable boundar_ layer
result in shock-boundary layer interactions. These are evidenced by a
series of oblique shocks rather than a slngle, clean terminal shock. This
effect is appFox_mated in the slmulat_on program by introducing an effective
Mach nmaber, Mxe = KMXM x , where K_X is an empirical function of X.
Physically, Mxe can be envisioned as the component Mx normal to a pseudo-
oblique shock having total pressure losses equal to the oblique shock
train. When test data to evaluate KMX are not available, its value is
assmned to be unity.
Figure 71 gives the equations for computing terminal shock velocity
and poeition.
Phase Switches
The phase switching logic in the Empty-Fill Phase continually checks
as to when a switch should be made to the Started Fnase, the Hammershock
Phase, or the Subcritical Phase. A further check is made as to when a
mew Empty-Fill Phase should be initiated.
Inlet operation switches to the Started Phase, (a restart is made)
when flow through the throat bec_aes equal to the captured flow. An
empirical constant is used to account for differences between _ctual and
63
Page 72
theoretical restart conditions.
A switch is made to the Femmershock Phase when the rate of change of
the duct outflow exceeds a specified rate. The method of selectin6 the
specified rate is discussed in the description of the Started Phase switch
logic.
A switch is made to the Subcritical Phase when the conditions are
satisfied concurrently that i) the terminal shock moves forward of the
cowl lip, and 2) the duct mass flow ratio exceeds the empirical minimum
value for buzz-free inlet operation.
A new Empty-Fill Phase is initiated (flow separation is triggered)
when, concurrently, i) the terminal shock moves forward of the cowl lip,
and 2) the duct mass flow ratio is less than the empirical minimum value
for buzz-free inlet operation.
The phase switching equations are presented in figure 72.
Outputs to the Air Induction Control System
The logic used to determine local pressure signals to the AICS for
the Started and the Unstarting Phases are equally applicable to the Empty-
Fill Phase. It is to be remembered, however, that flow is subsonic from
the cowl lip to the throat, and that effective rather than geometric areas
must be used during separated flow conditions.
64
Page 73
8UBCRXTICAL PE_WE
An inlet opermtee in the Subcritical Phase when flow from the cowl lip
to the engine face i8 subsonic and stable. The Subcritical Phase encom-
passes flight wlth stable, unstarted (all extermml shock compression) inlet
operation.
Subcritical Phase Concept
The Subcritical Phase simulation model is based on the reasoning pre-
sente4 in reference 4 for determining the approximate position of an
external normal shock. The top portion of figure 73 illustrates the general
procedure. Known quantities are M_ch number upstream of the normal shock,
and the captured flow. The airflow spilled by the inlet is assumed to be
diverted around the cowl lip by a pseudo-surface originating at the cowl
lip and having the maximum angle possible without flow detachment. The
normal shock stands at the intersection of the pseudo-surface and the
stream tube Just entering the inlet. The bottom portion of figure 73 shows
the change in shock position, A X , when the captured stream-tube is reduced
from hI to hz .
The simulation model is shown in figure 74. The lumped volmme concept
described for the Unstarting a_d Empty-Fill Phases is again used but with
the external normal shock and the pseudo-surface now serving, respectively,
as the upstream face and p_rt of the bounding surface of the Duct Volume.
A_ain_ iteration is use_ to determine the shock velocity required to satisfy
the instantaneous values of total pressure upstream and downstream of the
shock. Shock velocity is integrated to determine instantaneous shock
65
Page 74
position. If the shock moves forward, the _udo-ramp surface spills more
flow and less flow enters the inlet. If the shock moves aft, more flow
enters the inlet.
During subsonic and low supersonic speeds, the simttlation concept
has no physical significance. However, the simulation procedure can be
extended to such conditions by the ass_nption of a pseudo-Mach nmnber,
M_p , and its associated pseudo-shock. Use of the pseudo-Mach number pro-
vides a nwchanism for closing the loop between airflow supply and demand
at subsonic flight conditions. The validity of this procedure has not
been checked a_inst test data. However, a high degree of simulation
accuracy is generally not required at subsonic flight speeds.
Upstream Properties
Equations for computing properties _stream of the terminal shock
(external normal shock) are presented in figure 75. The equations are
similar to those for the other Phases except that Mx , previously computed
from one-dimensional flow continuity relationships, is now a function of
flight conditions and inlet geometry. Further, when Mx is less than I.i,
a pseudo-Mach n_nber of i.i is assLmed to permit use of the simulation
logic at subsonic Mach numbers.
Inflow
By hypothesis, the angle between the flow Just upstream of the terminal
shock and the pseudo-surface which deflects the spillage air is the maximum
angle not causing flow detachment. Variation of this angle, 8ma x , with
upstream Mach number is shown in figure 76 for both two-dlmensional and
conical flow. Generally, two-dimensional values are used because flow at
66
Page 75
the cowl lip approaches two-dimensional flow even for axi-symmetric inlets.
6 max can be obtained fram tables, as in figure 76 or by the following
equations.1
cot e_Ax
tan&M_X - 2 cot @MAX(Mx2sin_ - i)
2 + _x2(_+ I - 2 sina%aX)
From the geometry of figure 73 it can be seen that
'WxIt (A_-_-) (Wx) (_-t) =Wxh 42.t
and
Further,
(a_ x) axtan_maxAh = AXtan6max = a_t _t
Wx Ax Ptx _ Mx
-%- " _ ]_ _]-_ O- + .a_a) 3"5
and
Combining terms ami converting to a derivative format,
dWx- Yg(_) Ptx Mx tmntmax (_/ax)--_ (1 +. 2Mx2) 3"5
67
Page 76
Finally, inflow to the Duct Volt,me is
t
Wx" Wx i+ Si _t dt
The foregoing equations are suzi_rized in figure 77.
Boundary Layer Bleed Flows
Inasmuch as the terminal shock is always forward of the cowl lip in
the Subcritical Phase, th_ only bleed flow to be calculated is Wbby . To
maintain similarity with the calculations in the other Phases, bleed flow
is
Wbby" _y (XI - XII I) (Wx)
Where _ is _b/dx , the non-dimensionalized bleed flow per unit"X
length of bleed surface exposed to subsonic flow. The procedure for non-
dimensionalizlng the bleed flow slope is not l_artlcularly appropriate for
the Subcritical Phase (in actuality, Wbby tends to increase with decreas-
ing Wx at a given flight condition). However, both the bleed flow quan-
tity and its effect on inlet dyrlamics are small in this flight regime. The
bleed flow equations are listed in figure 78.
Duct Volume Total Pressure Loss
Total pressure loss in the Duct Volume is asstmaed to he proportional
to the dy_c head at the end of the bleed section. Half of the total
pressure loss is assumed to occur between the end of the bleed section and
the average density station, and half between the average density station
and the engine face. The required equatiuns are shown in figure 79. Note
that these calculations assume a quasi-stationary terminal shock, making
TtI---II" Tt o and PtIII " Fry. This assumption having negligible effect
p
68
Page 77
on the slBulatlon accura_p elimir_tes a redundancy loop.
BYI_SS and Engine System Airflows
The bypass and engine system airflow calculations, figure 80, are
identical to those for the other phases.
Duct Vol_ Mass and Total Temperature
The logic and equBtions for computing the instantaneous quantity of
air and the total temperature in the Duct Volume are similar to those
discussed in the Unstarting and Empty-Fill Phases. The equJtions are pre-
sented in figure 81.
Duct Volume Total Pressure
The equations for computing total pressure in the Duct Volu_e, figure
82, are identical to those described for the Unstarting Phase except for
the additional equations required to determine the portion of the Duct
Volume forward of the cowl lip. From consideration of the two-dimenslonal
geometry of figure 73, area at station X is
Ax m hx AL
hL
,where A L and hL are the flow area and height respectively at the cowl lip
station. Further,
hx - hL - (XL - X)tanSml m
so that
Ax - AL
The increment of Duct Volu_me between the terminal shock and the cowl lip
69
Page 78
is, therefore _
Mech n_ber at the average density station is assumed to remain
constant at the value existing at the beginning of the Phase.
Terminal Shock Velocity and Position
The iteration for the terminal shock velocity required to satisfy
the instantaneous total pressures upstream and downstream of the shock is
shown in figure 83. As in the other Phases, shock velocity is integrated
to obtain shock position. A further portion of the logic prevents any
appreciable travel of the terminal shock aft of the cowl lip.
During subsonic conditions, there will, of course, be no actual
terminal shock, and the pseudo-shock is nothing more than a convenient
fiction.
Phase Switches
Three conditions can cause a switch from the Subcritical Phase to
another mode of inlet operation. First, an abrupt decrease in duct out-
flow can result in hanmershock. Second, reduction of the inlet mass flow
ratio to the value where buzz occurs causes a switch to the Empty-Fill
Fhase. Third, an increase in airflow demand to the point where inlet
operation becomes supercritical causes a switch to the Empty-Fill Phase.
The logic for determining when a switch to another Phase should be made
and what the new Phase should be is presented in figure 84.
Air Induction System Signals to the Control S_stem
The same simulation techniques used to generate inlet signals to the
7O
Page 79
e_rol I_tea in other Phasescan be use_ in the Subcritical P_e.q
71
Page 80
HA_I_HOCK PHASE
A typical hazm_rshock pressure transient induced by engine stall is
shown in figure 85. Hammershock can occur during any of the various modes
of inlet operation, and at any flight speed. In fact, the hammershock
pressure trace of figure 85 was recorded during ground operation of XB-70
Ship i.
Hammershock Phase Concept
A schematic representation of the simulation model for the Hammershock
Phase is presented in figure 86. While the model shown is for ham_rshock
initiated in the Started Phase, the simulation logic is also capable of
simulating ha_m_rshocks initiated in the Empty-Fill and the Subcritlcal
l_es.
The _rshock Phase logic is based on the fact that the pressure
disturbance is propo_gated at a velocity in the airflow same what higher
than the local speed of sound. Consequently, flow upstream of the distur-
bance front is unaffected by the disturbance. That-is 2 upstream flow
relative to the disturbance front is supersonic, and the disturbance front
becomes a normal shock wave.
The same concept of a control volume used in the Unstarting and Empty-
Fill Fhases is used in the hammershock logic. Now, the upstream face of
the control volume is the te1_minal shock; and, the downstream face is the
engine face. Upon initiation of the Hsam_rshock Phase, a hammershock wave
front is arbitrarily located slightly forward of the engine face. With
outflow drastically reduced, inflow to the control volume (Hammershock Volume)
72
Page 81
greatly exceeds outflow; pressure in the volume rises; and s the l_er-
shock wave front moves upstream at the velocity required to satisfy the
instantaneous total pressures upstream and downstream of the shock. If
pressure in the duct is sufficiently high upon expulsion of the _rshock
wave_ there will be flow out of the duct into the external flow field until
the static pressure at the cowl lip drops to the total pressure downstream
of the external shock system. The simulation run is terminated at this
time.
Upstream Properties
The equations for ccml_uting the upstream properties, presented in
figure 87, are identical to those for the Started, Empty-Fill and Sub-
critical Phases except for the additions required to determine which Phase
was in effect when the hammershock w_s initiated and what the corresponding
upstream properties are.
Properties at Station X
Flow conditions for hammerehock initiated in the Started, Empty-Fill,
and Subcritical Phases are illustrated in figures 88 and 89. To reduce
the logic required to compute properties at station X, it has been assumed
that hammershock will not be initiated during the Unstarting Phase, or
during the portion of the Empty-Fill Phase when the normal shock is moving
from the throat to the cowl lip station. Because the pressure gradients
are not overly severe and the duration is sins//, the probability of engine
stall and ha, mmrshock occuring at such times is also small.
The logic and equations for ccmputing properties at station X are
presented in figure 90. Inasmuch as flow is subsonic throughout the duct
73
Page 82
during subcritical operation, there is no internal normal shock (except
for the hammrshock); and therefore, station X as previously defined does
not exist. However, it is convenient to maintain a similar computing
format for all phases by arbitrarily setting X equal to the cowl lip
station. The simulation program then knows that flow is subsonic at any
station downstream of the cowl lip.
To further promote similarity in cumputing format, the concept of a
base flow, Wbase , is introduced. Using this concept, Wx can be expressed
as
Wl_bx+ aWbb .)Wx-W seI -
Wbase is the flow at some base point station, Xb . Wbb x is the bleed flow
between the terminal shock (other than the hasm_rshock) and the base
station when the terminal shock is aft of the base station. At a station
upstream of Xb , flow will be greater than Whose by aWbb , the amount of
bleed flow from that station to Xb . Note that this bleed flow increment
must be computed for the flow conditions existing when Wbase was obtained.
In the Started Phase, for example, Wbase = WII is obtained with supersonic
flow upstream of XII . Consequently the bleed flow increment, 4Wbb , must
be computed on the basis of supersonic flow upstream of the base point
station.
Inspection of figures 88 and 89 show that the components of the flow
are as follows according to the Phase in which the hammershock transient
was initiated.
Started Phase :
Wbase " WII
74
Page 83
Wb x/ .se"
4 b/W se " bx/Wil
Empty-Fill Phase
Wbase - WT
Wbbx/Wbase " Wbbx_ T
4Wbb/_oase" _Wbby/WT
Subcritical Phase
Wbase - WII 1
bx/ se = 0
_Wbb/W_e = 4Wbby/Wlll
Further details are given in figure 90.
Properties Upstream of the Hsmmershock
Properties Just upstream of the _rshock are computed on the
simplifying assumption that the terminal shock (other than the hammershock)
remains stationary from the initiation of the hammershock transient until
the hazm_rshock wave overtakes and coalesces with it. During this period,
the total pressure downstres_a of the terminal shock is Pry inasmuch as the
shock is assuned to be stationary. Similarly, flow at the hammershock
station, WxE 5 , is equal to Wx less any bleed flow between the terminal
shock and the hazmmershock. After the shocks coalesce, the properties
upstream of the hacm_rshock are, of course, identical to those upstream of
the terminal shock.
Details of the logic and eq_tions used can be seen in figure 91. Note
that when the hammershock reaches the cowl lip, flow at the cowl lip can
75
Page 84
become ne_tive as described in the section, ForwLrd Outflow.
Properties Behind the Hammershock
The equations for computing properties inmediately downstream of the
hammershock are identical to those used in the Unstarting and Empty-Fill
Phases. The equations are shown in figure 92.
Effective Flow Area and Volume
In event the hammershock transient is initiated during the portion of
the Empty-Fill Phase when flow is separated, the effective flow area and
volume differ from the geometric values. The logic used to compute effec-
tive area and volume is the same as that used in the Empty-Fill Phase except
that it is assumed that the degree of separation remains constant through
the hammershock transient. That is, the ratio of effective to _ecaetric
throat area, ATef/A T , is constant at the value existing at initiation of
the Hammershock Phase. The equations for computing effective area and
volumm are presented in figures 93 and 9_ respectively.
Boundary Layer Bleed Flows
The logic used in computing bleed flows is similar to that described
for the previous Phases except for the complications introduced by the fact
that the hammershock transient may be initiated in any of the three Phases,
Started, F_mpty-Fill, and Subcritical. By reference to figure 89, it can be
seen ___.,thatthe following relationships apply where _x I/
\W_seRflo_" respectively.
76
Page 85
" S_ Phase:
X > XII I
XII < X < Xii I
X < XII
XRS > Xii I
XII < XEB < XII I
XHS < XII
Wbbx/WII
_x(Xii I - XII)
_x(X - XII)
b_byBS/WIII
0
_(X m - Xii I)
_(XH8 - XII I)
Wbbx/WII
0
0
_x(XiI - X)
_by/WII
0
_y(X - XIII)
_y(X - Xiii)
Em_y-Fill Pl'mse
X > XII I
XT < X < XII I
x<x T
X_ > XII I
XT < XHB < XII I
xm<xT
Wbb_T
Cx(xnT- _)
_(x - _)
0
_(XHB - XII I)
_y(XEs - XII I)
A Wbby/wT
0
0
Wbbby/WT
0
_y(X - XIii)
_y(X - Xiii)
77
Page 86
Subcritical Phase
Wbbx/Wlll Wbby/Wll I
x _<xl o _y(xl- xnl)
X}_B > XII I
XES< Xlll _y(xm - xnl)
The logic for determining the various bleed flow quantities is shown
in the equation flow diagram of figure 95.
Bypass and Engine System Airflows
Bypass and engine airflow calculations, figure 96, are identical to
those used for the other phases.
Duct Volume Total Pressure Losses
To determine subsonic flow total pressure losses, a pseudo total pres-
sure loss from the terminal shock to the engine face station is first
calculated as
APty2 = E(_ty- Pyy)
With losses assumed to be distributed linearly with duct length, the total
pressure loss from the terminal shock to the ham_rshockbeccues
Subsonic flow total pressure losses in the Hammershock Volume are assuz_d to
78
Page 87
. be _61igible inaeauch as the exit flow and Mach nuEber are low during the
hamershock transient. Subsonic flow total pressure loss equations are
presented in figure 97.
Ha_Bershock Voltme Mass and Total Temperature
Air in the Ham_ershock Volume is that initially in the volume plus the
difference between inflow and outflow in the ensuing interval. Inflow is
the flow crossing the hazR_rshock face of the Hammershock Volume. Outflow
is the summation of the bleed flow from the Nam_rshock Volume, the byes
flow, and the engine system flow. Engine System flow can be negative
(inflov) should there be flow reversal during engine stall.
Flow entering the Nammershock Volume is at the total temperature
immediately downstream of the haw,_rshock, TtyES . This flow is assumed
to mix instantaneously with the air the Hannnershock Volume to give a uni-
form total teml_raturm, Tt_ . Outflow is at the temperature TtH S (if
reverse flow occurs during engine stall_ the ne_tive engine airflow will
be at the appropriate temperature rather than TtEB).
Figure 98 shows the equations used to compute Hammershock Volume mass
and tote/ temperature.
Eannershock Volume Total Pressure
The basic logic for calculating Duct Volume total pressure in the
Unstar_lng and E_ty-Fill Phases is used to compute Nannaershock Volume
total pressure. MES , the Mach n_ber at the average density station in
the Eamm_rshock Volume, is assumed to remsin constant at its initial value.
Equations are presented in figure 99.
79
Page 88
Han_ershock Veloclt_ and Position
The han_rshock velocity is determined by iteration for the shock
velocity satisfying the instantaneous upstream add downstream total pres-
sures. Shock velocity is then integrated to determine shock position. The
required equations, figure I00, are identical in form to those used for
computing terminal shock motion in the Unstarting and Empty-Fill Phases.
A function, which sets hannnershock velocity to zero until PtE3 _- Ptx_ ,
has been added to minimize the effects of small inaccuracies in the initial
conditions.
As discussed previously, the terminal shock, if one exists, is assumed
to be stationary until it is overtaken by the ha_mershock. The two shocks
then become one shock having the velocity and position computed for the
hammershock.
Forward Outflow
As the hammershock moves forward of the cowl lip, duct total pressure
is frequently higher than total pressure in the external flow Just forward
of the cowl station. Under such conditions, there will be flow from the
duct into the external flow.
With outflow from the inlet, the local external flow will b_ brought
to essentially stagnation conditions. Therefore static pressure at the
cowl lip will be PtxE where PtxE is the total pressure behind the external
normal shock for supersonic flight conditions or the freestream total
pressure for subsonic flight conditions.
If the Mach number at the throat station is subsonic during outflow,
the outflow quantity can be ccRputed from total temperature, total pressure,
8O
Page 89
• Otstte prenure s and area at the cowl station. That is,
.Pt__ A v_wf° FE (1+ .z,%213
where ML is determined frca the ratio of total to static pressure at the
cowl I:Lp, PtHs/PtxE •
The flow calculated in the above method may exceed the maximum possi-
ble flow throu6h the throat area, particularly at high inlet area contrac-
tlon ratios. Outflow is then the flow computed for sonic velocity at the
throat,
Pt_Wfo - __ AT
Outflow at any instant will be the lesser of the two flows cumputed above.
Outflow will continue until PtSS drops to PtxE • Equations for computing
forward outflow are presented in figure I01.
Phase Switches
The _ammerehock Phase is terminated when the hammershock moves forward
of the cowl lip and duct total pressure becomes equal to or less than
external flow total pressure at the cowl lip. Physically, inlet operation
would then change to either the Empty-Fill Phase or the Subcritical Phase.
In practice, it is usually desireable to termlnate the simulation run
following a h_zershock transient. The Phase switching logic of figure 102
terminates the entire simulation run at the ena of the Haa_ershock Phase.
Attention is called to the fact that the combination of a mild engine
stall initiated during hig_.ly supercritical started inlet operation can
81
Page 90
result in a ha_mershock transient wherein the coalesced ha_ershock-
terminal shock will become stabilized before reachlng the cowl lip. That
is t the inlet will remain started. This possibility is not conmidered in
the Phase switching logic of figure 102.
Outputs to the Air Induction Control System
Inlet signals to the control system are generated using the same
basic logic described for-the previous Phases.
82
Page 91
INITIAL CONDITIONS
Certaim initial conditions must be cumputed at the beginning of each
Phase of inlet operation. With the exception of the Unstarting Phase,
each Phrase may be initiated either in a steady state condition or in a
transient condition carried over from the previous Phase. In either event,
it is usuLlly desirable t_ keep those equations required only to compute
initial conditions outside of the main body of the simulation program.
Thens only those equations needed in the dynamics calculations need be
carried along continually. Care must be used_ of course, to ensure that
the initial conditions calculations are consistent with the dynamics
equations.
Started Phase
are
Quantities which must be known upon initiation of the Started Phase
,_, T_, _ , %_bp, _ x.
WHi , the air quantity initially in the Helmholtz Volume, is evaluated
by use of Simpson's Rule. That is
Z
X
z.x(+ ...+ _(gpA)n.l
2(g_A)2+ 4(gpA)3
+ (gm_)n )
+ 2(_)_
Where n is the even number of equal length increments into which the
Helmholtz Volume is divided and the stations O, i, ---n are as shown in
figure lO3.
83
Page 92
At any station J,
At a station xj < XII I
(XI - 1W j" WII - Wbb x - _bby XIII X. X
At a station Xj _ XII I
Wj = WII - Wx - Wbby
Mj is obtained by iteration to determine the subsonic solution of the
equation.
whe re
(1 Aj PtJ V _g
Ttj " Ttx = Tto
and
Finally,
uj- Mj/_gRTj -Mj i +._j
In the XB-70 program, the Helmholtz Volume has usually been divi@ed
into lO equal-length segments for the W-H calculation. The same basic logic
is used to determine the air quantity initially in the Duct Volume. Because
it is considerably lar6er, the Duct Volume is usually divide_ into i00
84
Page 93
• equal-leith se_ents. Further, because the upstream face of the Duct
volume will almost invariably be aft of the boundary layer bleed section,
flow at each station will be the same v_lue. That is_
Wj" Wil - Wbb x - Wbby
For steady state initial comd_tions,
Ttd = Tto
The procedure for computing KA is described in the section, Duc____t
Vol_e Pressures, of the Started Phase. To review,
A_e o - VdXe - Xz
_'_/A_o
The effective bypass area required for the steady state initial termi-
shock position is that value requlrmd to balance the airflow supply and
demand. With supply and demand being, respectively,
and
WII - Wbb x - Wbby
wbp + w2 + w,
85
Page 94
the effective bypass area is
whe re
and
that
A_ - WbP_to . _to (WII-WbbX -Wbby-W2 -Ws)PtbpA PtbpA
Ptbp " KbpPt2"Kbp(Fry" APtyz"_Ptzd"APt_)
W2 and W s are functions of Pt2 , Tt2 , and throttle position. Note
Pt2 is tmiquely defined by the initial geow_etry, upstream properties,
and the terminal shock position during steady state conditions.
The initial steady state terminal shock position is either input
directly by specifying X, or indirectly by specifying the Shock Position
Parameter, SPP. If SPP is input, the initial conditions program assu_es a
value of X, computes the resulting value of SPP and cumpares this with the
input (scheduled) value of SPP. This procedure is repeated until
SPP SFPsched. is within a specified tolerance. This trial and error pro-
cedure has usually been accomplished by use of the "Slope Method" in the
XB-70 program as illustrated in figure 104. In this method SPP is ccmputed
for the maximum and minimum anticipated values of X t and the error between
the scheduled and computed SPP is determined. A straight line, Chord 1 of
figure 104, is then drawn, l_ne intercept of the chord with the zero error
line determines the value of X, to be used in ccaputing the error, (_SPP).
The procedure is continued as illustrated until X gives an error, ASPP,
within the allowable tolerance.
The preceding calculaticas are all based on the assumption of steady
state conditions. Consequently, W_H = _-H , _ = __d _ Ttd = Ttd ,
Ptd " Ptd • If the Started Phase is initiated from non-steacly state
86
Page 95
• conditions s the same calculations described above are used to ccer_ute the
quasi-stead_ state parameters. These a_e then corrected to the non-steady
state initial conditions as follows:
. Ptd%0[_"td Ttd
I
___ . Ptd Tto W_d
_'t'td Ttd
where Ptd and Ttd are the instantaneous values carried over from the
previous phase. Practically I the changes in geometry, attitude, and/or
airflow demand required to restart an inlet are generally slow relative to
the duct dynamics. Consequently instantaneous values of the required para-
meters will be close to the quasi-steady state values.
Unstartin_ Phase
Properties which must be known at the initiation of the Unstarting
Phase are Md , W_d , Ttd , W_u , and Ttu . Generally, the Unstarting Phase
will be initiated as a continuation of the Started Phase. At the Phase
change, the simulation model changes in that the Helmholtz Volume and the
Duct Volume of the Started Phase are combined to form the single Duct
Vol_ne of the Unstartlng Phase. That is,
(Vd)Unstarting - (Vd + VH)Starte dPhase Phase
similarly
(W-d)UnstartlngPhase
" + )StartedPhase
Further, the total pressure and total temperature at the engine face are
8?
Page 96
continuous functions through the Phase chan6_ so that, ..
(Pt2)Unstarting " (Pt2)StartedPhase Phase
and,
(Tt2)Unstarting " (Ttd)Unstarting " (Tt2)Starte dPhase Phase Phase
Md , the Mach n_mber at the average density station in the Duct Volume
will change because the Duct VOlume changed. Inasmuch as
= Ptd Vd i 'gPaRTt---_ (1 + ._d2) 2"5
_1 is
whe re
Ptd " Pt2 + APtd2
At the Phase switch, the Upstream Normal Shock, arbitrarily located a
small but finite distance upstream of the throat, will not yet be in motion.
Consequently
and
Ttu " Tto
Ptu= Ftty
Air quantity in the Upstream Volume is
W_-u.RTto (i +.2Mu2) 2"5
88
Page 97
where
6 112.5
ar_i Mxu , Vu , an_ Ptxu are calculated in accordance with the dynamics
equations.
Empty-Fill Phase
Initial conditions which must be calculated for the Empty-Fill Phase
are Md , Ttd and W-d • When the Phase is initiated as a continuation of
the Unstarting Phase, the Mach number, Md , computed at the initiation of
the Unstarting Phase is carried over and used during the Empty-Fill Phase.
While an approximation, this value is reasonably correct inasmuch as the
terminal shock is close to the throat station upon initiation of both the
Unstartlng Phase and the Empty-Fill Phase. Further, the simulation is not
overly sensitive to the accuracy of Md •
Engine face total pressure and temperature are continuous functions
through the Phase switch. Consequently
and,
(Pt2)Empty_Fill = (Pt2)Unstarting
Phase Phase
(Tt2)Empty-Fill= (Ttd)Empty_Fill =Phase Phase
Air in the Duct Volu_e is
RTta (1. + .2M_ _)2.
(Tt2)Unstartin@Phase
89
Page 98
where
Ptd= Pt2+ aPt
In event a simulation run is initiated in the Empty-Fill Phase, the
initial terminal shock position is specified and the value of W__ is
ccmputed in the same procedure used for the Started Phase. _d is then
computed as
\RTt 4
Subcritical Phase
Required initial conditions for the Subcritical Phase are Ttd , Md ,
and W-d " When the Subcrltlcal Phase is initiated as a continuation of the
Empty-Fill Phase, Md is carried over from the Empty-Fill Phase to the
Subcritlcal Phase. As engine face total temperature and total pressure
are continuous during the Phase switch,
(Tt2)Subcritlca I = (Ttd)Subcritica I - (Tt2)Empty_Fil 1Phase Phase Phase
and
(Pt2)Subcritlcal" (Pt2)Empty.Fil IPhase Phase
Air in the Duct Vol_ne is
whe ]_s
. Ptd qRTtd (1 + .2--Md2) 2" 5
Ptd = Pt2 + 4Ptd2
90
Page 99
If the Subcritical Phase is initiated from stead_ state conditions,
W__ is computed by use of Simpson's Rule in _ procedure similar to that
used in the Started Phase. _i is then calculated as
_ta w-d
Hams_rshock Phase
Initial conditions which must be computed or input for the Hammershock
Phase are _ , _ , and TtES .
By the nature of the tran@ient, MHS , the Mach number at the average
density station in the Hammershock Volume will be low during the Ham_ershock
Phase. Consequently an assumed constant value is input, usually between 0
and 0.2.
The hammershock wave is initially located just far enough upstream
of the engine face to create a finite Hammershock Volume. Initial total
pressure and temperature in the volume will, therefore, be equal to the
engine face total pressure and temperature at the instant of the Phase
= PtHS V_
RTtHs(1 + .m4m_)2.5
switch. Then,
whe re
FtHS = Pt2
TtE8 = Tt2
91
Page 100
SYMBOLSANDNOTATION
Primary S_mbols
Symbol
a
A
Adgeo
Cp
Cbm
Cbp
Cbt
DSP
g
h
J
KEF
KHB
KMX
KRS
Kyz
Definition
speed of sound
flow area at the station designated by the subscript
average geometric area, volume/length
specific heat at constant pressure
main bypass area flow coefficient
bypass area flow coefficient
trim bypass area flow coefficient
Downstream Shock Parameter, PDsS/PDsR
acceleration due to gravity
stream tube height
mechanical equivalent of heat
ratio of flow area at the average density station to
the average geometric area in the Duct Volume, Ad/Adgeo
Ptbp/Pt2
value of Ptd/Po at which separated boundary layer flowreattaches
input constant - if (dWe/We)/dt _ KHB, inlet operationswitches to the Hammershock Phase
empirical factor to account for boundary layer-shockinteraction effects
empirical value of WT/WII at which inlet restart occurs
flow coefficient for the inlet throat area under sonic-
flow conditions
portion of the subsonic total pressure loss betweenstations Y and Z
92
Page 101
Primary Symbols (Continued)
Kz2
!
M
P
Pt
Ptx/Pto
(Ptx/Pto)E
(Ptx/Pto)s
qc
R
SPP
t
T
Tt
U
U'
V
W
portion of the subsonic total pressure loss betweenstations Z and 2
length of the Helmholtz Volume
Mach nt_nbe_.at the station designated by the subscript
static pressure at the flow station desisted by the
subscript
total pressure at the flow station designated by the
subscript
local to freestream total pressure ratio immediately
upstream of the terminal normal shock in the started
and the Unstarting Phases
local to freestream total pressure ratio downstream of
the external normal shock and upstream of the terminal
shock in the Empty-Fill Phase
local to freestream total pressure ratio upstream of
the external normal shock or pseudo-normal shock in the
Subcritical Phase
compressible flow dynamic head,.P t - P
gas constant
position parameter, PSPM/PsPRshock
time
static temperature at the flow station designated by
the subscript
total temperature at the flow station designated by the
subscript
velocity relative to the duct
velocity relative to the associated normal shock
volume
airflow at the station designated by the subscript,
weight/tlme
93
Page 102
PTimar_ S_mbols (Continued)
Wbbx
Wbbxu
Wbby
Wbbyu
WT
g
(Wl/Wo)buzz
X
x()
Y
Z
bleed flow downstream of Xll and upstream of the terminalshock (supersonic flow region)
bleed flow upstream of XII and the terminal shock(supersonic flow region)
bleed flow downstream of XII and the terminal shock(subsonic flow region)
bleed flow upstream of XI7 and downstream of theterminal shock (subsonic _low region)
flow through throat under sonic-flow conditions
air quantity in the volume designated by the subscript,we ight
empirical value of mass flow ratio below which buzz
Occurs
terminal shock station, upstream face
flow station as designated by the subscript
terminal shock station, downstream face
flow station at the interface between the Helmholtz
Volume and the Duct Volume in the Started Phasesimulation model
_0
7
8max
APt( )
AtR
Ats
angle of attack
ratio of specific heats, Cp/C v
maximum deflection angle for attached flow
subsonic flow total pressure loss between the stations
indicated by the subscripts
non-dimensionalized time after flow reattachment begins
non-dimensionallzed time after flow separation begins
subsonic flow total pressure loss coefficient
- APt/(P t - P)
sonic flow constant, (i + .2M2) 3 where M .-1.0
94
Page 103
Primar_ S_mbols (Continued)
P mass density at the station designated by the subscript
bleed flow ratio slol_,
bleed flow ratio slo_,
bleed flow ratio slo_,
angle of yaw
(WbbylWbase)
Supersonic
Subsonic
Subscripts
Subscript
_se
bm
bp
bt
d
dH
e
E
ef
H
EB
i
L
Description
reference or base value of parameter
main bypass
b_qoass
tr_Ja bypass
station in the Duct Volume where the density is equal
to the averag_ density in the Duct Volume - also,
parameters associated with the Duct Volume
pro_y at station d as computed from the He]mholtzVolume side
station just upstream of where the byl_ass and engine
system airTlows divide
parameter applicable to _hnpty-FiS1 _se
effective value of parameter as disting_ished from the
geometric value
prol_y in the Helmholtz Volume
property in the P_ammershock Volume
value at the initiation of the Phase
cowl lip station
95
Page 104
(Continued)
n
o
R
S
S
T
TAB
u
x
XU
y-
yu
yES
z
zH
2
I
nth value or element
freestreamvalue
downstream station where flow separation ends and where
flow reattachment begins
property of the engine secondary airflow
parameter applicable to the Subcrltical Phase
throat station
parameters applicable to the test data used for empirical
tables of boundary layer separation and reattachmentcharacteristics
properties in the Upstream Volume
immediately upstream of the terminal shock
immediately upstream of the Upstream Normal Shock
i_medlately upstream of the hammershock
i._ediately downstream of the terminal shock
i_medla.tely downstream of the Upstream Normal Shock
immediately downstream of the hammershock
property at the interface between the Helmholtz Volt_eand the Duct Volt,he
property at the interface between the Helmholtz Volmme
and the Duct Voltune as computed from the Duct Volumeside
property at the interface between the Helmholtz Volume
and the Duct Voltune as computed frQm the HelmholtzVolume side
engine face station
upstream end of the boun_o_y layer bleed area
Page 105
.Subscripts (Continued)
II
III
boundary layer bleed compartment station, usually
located slightly forward of the geometric throatstation - bleed flow forward of this station is not
affected by the position of the terminal shock during
started operation
downstream end of the boundary layer bleed area
Supers cripts
Superscript
()
(),
Description
quasi-steady state value for the instantaneous terminal
shock position
parameter relative to the non-geometric station
designated by the subscript
97
Page 106
LIST OF FIGURES
Figure No.
1
2
3
4
5
6
7
8
9
lO
ll
12
13
14
15
16
17
18
19
2O
21
Title Page
Started Phase of Inlet Operation 103
Total Pressure Recovery Versus Time i0_
Insufficient Demand-Induced Unstarting Phase of Inlet
Operation 105
Choked Throat-lnduced Unstarting Fnase of Inlet Operation 106
Emptying Portion of Empty-Fill Phase 107
Filling Portion of Empty-Fill Phase 108
Subcrltlcal Phase of Inlet Operation 109
Hammershock Phase of Inlet Operation llO
Typical Air Induction System 112
Started Phase Simulation Model i13
Started Phase Upstream Properties 114
Started Phase Properties at the Terminal Shock 115
Started Phase Properties Behind the Terminal Shock 116
Started Phase Boundary Layer Bleed From Zones Affected by theTerminal Shock Position 117
Started Phase Boundary Layer Bleed Flows 118
Started Phase Subsonic Flow Total Pressure LOsses Diagram 119
Started Phase Subsonic Flow Total Pressure Losses 120
Started Phase Alternate _thod Subsonic Flow Total
Pressure Losses 121
Started Phase Duct Volume Mass 122
Started Phase Duct Volume Total Temperature 123
Started Phase Duct Volume Pressures l_
98
Page 107
t
LIST OF FIGURES (Continued)
Figure No.
22
23
24
25
e6
27
28
29
3o
3l
32
33
34
35
36
37
38
39
40
Title
Started Phase Bypass amd Secondary Airflow System
Started Fnase Bypass and Engine System Airflows
Started Phase Helmholtz Volume Properties
Started Phase He/mholtz Volume Acceleration
Started Phase Phase Switches
Started Phase Aerodynamic Throat
XB-70 Signals to the Air Induction Control System
Started Phase DSP Signal Vs. Terminal Shock Position
Started Fhase Outputs to the Air Induction Control System
Insufficient Demand-lnduced Unstartlng Phase SimulationModel
Choked Throat-lnduced Unstarting Phase Simulation Model
Choked Throat-lnduced Unstart, Ptu/Ptx , Ttu/Ttx ,
and Xu Versus Time
Unstarting Phase Simulation Model
Unstarting Phase Upstream Properties for the UpstreamVolume
Unstarting Phase Properties Forward of the UpstreamNormal Shock
Duct & Cumulative Bleed Flows During Started & UnstartingPhases
Unstarting Phase Properties Behind the Upstream NormalShock
Unstartin g Phase Bleed Flow Slopes
Uns_drting Phase Bleed Flows in the Upstream Voltm_
125
i_6
127
128
129
130
131
132
133
13_
135
136
13T
138
139
i4o
142
143
99
Page 108
LIST OF FIGURES (Continued)
Figure No.
41
42
43
44
45
46
47
48
49
5o
51
5e
53
55
%
57
58
59
6O
61
62
Title
Unstarting Phase Upstream Volt_e Mass & Total Temperature
Unstarting Phase Upstream Volmne Total Pressure
Unstarting Phase Variation of Shock Pressure Ratio WithShock Mach Number
Unstarting Phase Upstream Normal Shock Velocity & Position
Unstarting Phase W x During Choked Throat Unstarting
Unstarting Phase Properties at the Terminal Shock Station
Unstartin 6 Phase Properties Behind the Terminal Shock
Bleed Flows for the Duct Volume
Unstarting Phase Duct Volume Total Pressure Losses
Unstarting Phase Bypass and Engine System Airflows
Unstarting Phase Duct Volmue Mass and Total Temperature
Unstarting Phase Duct Volt_e Total Pressure
Unstarting Phase Terminal Shock Velocity and Position
Unstarting Phase Phase Switching Logic
Unstarting Phase Inlet Unstart Pressure Signals
Empty-Fill Phase Typical Buzz Trace
Empty-Fill Phase Simulation Model
Empty-Fill Phase Upstream Properties
Empty-Fill Phase Airflow at the Terminal Shock
Empty-Fill Phase Properties at the Terminal Shock Station
Empty-Fill Phase Properties Behind the Terminal Shock
Empty-Fill Phase Effective Flow Area During Separation
PaSe
Z_
z46
l_?
149
15o
15l
152
153
z_
z55
z%
z57
159
z6o
Z62
163
z6_
165
z66
lO0
Page 109
t
LIST OF FIGURES (Continued)
Figure No.
63
6_
65
67
68
69
7o
71
72
73
7_
75
7_
77
78
79
8o
81
82
83
84
Title Page
Empty-Fill Phase Effective Throat Area 167
Empty-Fill Phase Effective Flow Area 168
Empty-Fill Phase Effective Volume 169
Empty-Fill Phase Boundary Layer Bleed Flows 170
Empty-Fill Phase Duct Volume Total Pressure Losses 171
Empty-Fill Phase Bypass and Engine System Airflows 172
Empty-Fill Phase Duct Volume Mass and Total Temperature 173
Empty-Fill Phase Duct Volume Total Pressure 174
Empty-Fill Phase Duct Terminal Shock Velocity and Position 175
Empty-Fill Phase Phase Switches 176
Subcritlcal Phase Captured Flow-Shock Postion Relationship 177
Subcritical Phase Simulation Model 178
Subcritical Phase Upstream Properties 179
Subcritical Phase Maxlmm. Deflection Angle of AttachedFlow 181
Subcritical Phase Inflow 182
Subcritical Phase Boundary Layer Bleed Flow 183
Subcritical Phase Duct Volume Total Pressure Losses 184
Subcritical Phase Bypass and Engine System Airflows 18_
Subcritical Phase Duct Volume Mass and Total Temperature 186
Subcritical Phase Duct Volume Total Pressure 187
Subcritical Phase Terminal Shock Velocity and Position 188
Subcritical Phase Phase Switches 189
i01
Page 110
LIST OFFIGURES (Continued)
Figure No.
85
86
87
88
89
9O
91
92
93
9_
95
97
98
99
i00
i01
102
103
104
Title
Hammershock Phase Hammershock Pressure Trace
Hammershock Phase of Inlet Operation
Hammershock Phase Upstream Properties
Hammershock Phase Simulation Models
Nammershock Phase Bleed Flow Schematic Diagram
Hammershock Phase Properties at Station X
Eammershock Phase Properties at the Ha_mmrshock Station
Hammershoek Phase Properties Behi_ the Hammershock
Hammershock Phase Effective Flow Area
Hsmm_rshock Fnase Effective Volume
Hazmuershock Phase Bleed Flows
Hammershock Phase Bypass and Engine System Airflows
Hammershock Phase Subsonic Flow Total Pressure Loss
Hammershock Phase Hammershock Volt,he Mass & Total
Tempe rature
Hanm_rshock Phase Hammershock Volume Pressures
Hammershock Phase Hammershock Velocity and Position
Hammershock Phase Forward Outflow
Hammershock Phase Phase Switches
Initial Conditions - Simpson's Rule Determination of W_H
Initial Conditions - Slope Method of Successive
Approximations
Page
19o
191
192
193
zg_
197
198
199
20O
201
2O2
203
2o4
2O5
2o6
207
2o8
2o9
210
211
102
Page 111
ii \\\
//////i///
l / I Iii
////
///
//
/
:8
_D
ICJ
[.OJ
-el
IJ
,4
lo3
Page 112
Pt2
PrO
a b c e f g
l '4. I
i
TERMINAL SHOCK POSI:PION
a - b
b - c
d - e
e - f
g
TIME
PHASE
STARTED
UNSTARTING
E_ PORTION OF EMPTY-FILL
FILL PORTION OF EMIl"f-FILL
STABILIZED, SUPERCRITICALOPERATION IN EMPTY-FILL
Figure 2. Total Pressure Recovery Versus Time
io4
Page 114
Unstart caused by throat choking begins with the
formation of a normal shock in the throat, "h".
As this shock moves forward, the terminal normal
shock moves forward, and may catch and coalesce
with the upstream normal shock before it reaches "i"
Figure 4. Choked Throat-Induced Unstartln@ Phase of Inlet Operation
lO6
Page 115
Illllllllll
//
/
I)=
0+)
W
_D
I
_o7
Page 117
| I
!i "//
f
fj,
ff
Jf
I"
zo9
Page 118
C_
_J
C_
c_
C_
llO
Page 120
t
I/
J
i//1
,"I//iI
/ /!
iii I
/ !!
!!
!!
/!
0
4_
,,el
1_1.2
Page 122
I _ Poe(t) tI .J
IInlmt I Ac -
t ,CoTmt_I+
, 1,L_(t)j To
•Wo
Figure ii. Started Phase Upstream Properties
zz4
Page 123
I •
I r
,-I
GI
.t:v
E_
i
d
N
I
I.--t
r!I,r_ ..1
d
Page 124
6
Figure 13. Started Phase Properties BehlzK1 the Terminal Shock
116
Page 125
I
Wbb x + Wbby -
-_- _, -%, ._---_THROAT BLEED ZONE - - END OF POROUS
MATERIAL
XiI XIII
Wbbi
wII
+Wbbx Wbb_
/ %"
/ ", WII
0
XII XIII
SHOCK POSITION _'_
Figure 14. Started Phase Boundary Layer Bleed Frum Zones Affected by the
Terminal Shock Position
117
Page 126
I
i 13 IJ
' FIKure' 12 '!I_ ....... I
t "1J IX, Figure, 25 II .j
I 1
ZnP ut IXIII
,_o_t_ntiJ
t 1
IInput IXII
[Constant 1J
r-..... -1
i Figure IWlli Ii )i
L ...... J
r "I
I ii ,i _J
[t. ..... _/
r
m
D
If:
X > Xii I
X _< Xii I
_Z _by
%t
(_, W) l_x
0
_i_j,(X - XIII)WII
If:
X > Xll I
XII < X< XII I
X < XII
Wbbx -
4*x(XIII - XII)WII
4*x(X - XII)WiI
0
Figure 15. Started Phase Boundary Layer Bleed Flows
kv
Wbbx
118
Page 127
(pel
MlO
¢J
SO
qP
C_
zz9
Page 128
12i
L-- _ __I
f(M A, AT) _(_ty - _t#
r i,Input I Kd2'Constant I4_ _ __.j
Input !
)-_ Kd2 4PtY2 I APt_
Pty2 " 4Ptd2 " _Ptyz
r
lu
Fi1_re 17. Started Phase Subsonic Flow Total Pressure Losses
120
Page 129
. 4
e 11 tL___ --.I
I _11 u_e I 11_tHI t
L .... -I
t
]Pl_ 18. 8ta_'t_lL _ AZtez_te ]lbtbo_
81d_o_t@ now Total l%,,oesuz,,e I,_eoeo
Page 130
,dx I
I Figure !dt L i
I
' Figure !Uz [i 24[ I
U_ - dX/dt I
Uz ]
' 7
' Figure iWzJ 241 J
f I
! II Figure IWe
i 23 I
Initial
I Condition itWdik
W/%
tWdi+t _tdt
!
dr_
Figure 19. Started Phase Duct Volume Mass
122
Page 131
%
_m_wQo I
I •t...... -J
_mmo_
' 1.9 IL ..... .J
.|
r-row mgwq
Flmzr, l 'z's1 2_. :L .... .-I
Co_litlodL ..... J
Figure 20. Started Phase Duct Volume Tote_ 1'emperatuye
dTtd
Tt,_
123
Page 132
I !
|
P,_(z+._H2) ":.5
Figure 21. Started hse Duct Volume Pressures
Page 133
WING SURFACE BYPASS FLOW
_ _ / ENGI_ FACE
DU_T FLOW
J
___ %--_-%--_--_f
J2
Mi[ure 22. Sl;arted 1_e B:r_| a_ Seoomda_ Airflow S_im%em
125
Page 134
- -'1
:co='_ti _
L. 1r .... "1
I r_.¢,_..,,:P_2 x_p P_2
L_W
r _, _'i_r,,; Tt2 II 20! !
t ..J
r 1
' f(A"rcs_, C_
' i %t_t' f(AZCS CbtAbt( W )
L. a A
f I! !
, :(_m) ,z(w2 + w,)L- l
w.
Figure 23. Started Phase BT_e_s and Engine Syst_ Airflows
z26
Page 135
F_=/(z+.
r _
t FigureI' 13 iL......J
z27
Page 136
F-,llU.!_,L ..... _j
i _ ,t J
I nsu_I P_DJ
--I
42x dt d'_
X
|
7 _
Pigure 25. Started Phase Helmholtz Volume Acceleration
128
Page 137
io mu
i 251
IConmtm.nt ii- .... J¢- ..... "1
I nm=,l_
L .... ..--.I
Tz,_- -" xrz
L--- ..I
i Fllivm'* ] WIT, 11L ..... ]
r".... _,,
l_lwn
.... _< _-z
_1 x<X'r
I S_tch
I u_-t_ m_e
'" _ llllml
_ wrrD.=_(_- xn)]>_ wTS_tch
II_t llluIColltl,nt _t....... _ m_.lai > Km
m
_tch to
irlboek
dMe/dt
_. Started Ph_e Phase S_te_s
Z29
Page 138
AX
_bX VB.
TE_41NALSHOCK STATION
W_ - Wbbx
AX
i
INLET STATION
Figure 27. Started Phase Aerodynamic Throat
130
Page 140
n
p-
o_
F-4
0
Z
132
Page 141
I", _ct) I.%L....... J
F;c-,3"-I! I
_o, %)v
..... --Ip o, _(t) '!L ..... m
r !!
, _l_re Pdi 21!L ....... |
!
r- ...... -i
I .I._ iL ...... ..I
,,J-3 _.i
f -tJ ll'i&_l_m XI 25 1I_ ..... /
r 1I f(AICS_ ATL--.- ...I
F...... ,Figure WIiu I
t. ...... JI !
I, nm-'e ; etx|
I-. .... J
e_
x >xD6 s Px
DSP
I SPP
r
Figure 30. Started Phase Outputs to the Air Induction Control System
133
Page 144
/
/I
II
II
II
136
Page 146
, ' I_et, f(AI_!I.. ..... .j
! I!, r(t)!
L,
'r(t)!!
,
•(_, _o, _'o,I.a._ -_ _
L.. ...... j
_PoA o
f(Mo' 0_0' _O' I.O.! -],
_II _II
,T.o_;-Wo
LI
IW II
#
TI_OP Ttant
_r
Figure 35. Unstarting Phase Upstream Properties for the Upstream Volume
131
Page 147
t !
i Figurt I!35 ] Ptma
! "1
II Figure IWII, 35 'g..... J
! I
| Iter_tlve
Solution of:
(i + .a_2)3
r I II Fi_re I Tto
l 35 ;.J
,,]
Mxu > 1.0
_u
f I
_.._- I _, !
1_2__,_ _ _(_'_)!
! ......
L..... J
li
Lv
! !
Figure 36. Unstarting Phase Properties Forward of the Upstream Normal Shock
139
Page 148
_LEED_ IN THIS ZONE _ BLEED FLOW IN THIS ZONE VARIES [NOINDEPEHDENT OF TERMINAL [ WITH TERMINAL SHOCK POSITION [PAST TH_
_HOCK POSITION DURI]_ [ DURING STARTED OPERATION I POINT
---..,_T_ / I_TIO
XI X u XII XII IWl
_Wbb x
Wxu
Wii NORMAL SHOCK
AT--._XIII
xII
Xu
XI
_D
NORMAL SHDCKAT
XI
X u
Xlll
J ! JX I Xu XII XII I
INLET STATION
Figure 37. Duct & Cumulative Bleed Flows During Started & Unstarting Phases
14o
Page 149
r .I
!
L ..... J=
[ _._ ] Fx_ /"rNL-2 - ]-\ "L_2_J v6--_'---)'_ !
Figure 38. Uns_rting Phase Properties Behi-a the Upstream Normal Shock
:).43.
Page 150
HH
_ku __-- WbhxII " WbbxI_/WII
XII _I 7
Wbbxiii - Wbbxii/WII
_- -x__ 7
WbBY II " Wbby I/If_=- x= xi/
_Y _ Wbbylll - Wbbyil/Wll
XIII XII /
BLEEDSUPERSONIC BLEED
SUBSONIC BLEED
I
XI XII XIII
TERMII_L SHOCK STATION
Figure 39. Unstarting Phase Bleed Flow Slopes
Page 151
XII
_(_, A_)
_,x_(xn-y_)wzz
I
m Flip,re IXu
!
1 I
r T",".,I.. .... J
1 !
@_(Zu- _)wn
Figure 40. _TnstartlnK Phase Bleed Flows in the Upstresm Volume
Page 152
_mp w m_m
_ ..... J
rtu, 42I..... ..I
Page 153
,,z.._t I, Constant;L ..... J
L__ z_J_ 7
' II FJ.gure Ttu
!
Figure 42. Unstartin£ Phase L_pstream Volume Total Presmure
z45
Page 154
I==-i
i
.==/
i
o,M
o
o
o
+_
tl
.el
Page 155
_1-t.3
.t.3
I I
I !L._.J
v v
t',--NO
r---------1
_ xJ
¢,'1 _1
.,-I
if
H
r'-- -1I
L?:__I
---1
_, I
._tL__J
_Q
II:i
.1-t
r_
r_F_L7 .
i_1 ,_t_._;__ _._
Page 156
UPSTREAM NORMAL SHOCK TERMINAL SHOCK
i
m
8R
l
Wx j A_bby
WT
[_ " wT.+ AwbbyI
Figure 45. Unstarting Phase Wx During Choked Throat Unstarting
148
Page 157
I..., .35 j
r _r,&..'_L__J
Phase Initiated By: Ttx =
Choked Throat Ttu
Ins. Demand T
! I p+_,, I Phase Initiated By: Ptx =I Figure
L - 3-,5--! ," ICh oked Throat Ptu
r F_8_1_e-1Pt___ Ins. DemandL. I____ l Ptxu
[ Fi__ Initiated By: Wx =
U- !5-iw_. IChoked Throat Wxu
[Fi_e__tIns. Demand WII+_ Wbb x
CF[_el x
X_ XT:[ Figure
L j8 - J Yes
,No
_.___J
Wxu -
W T - Wbb x
WT
TtxT x
+
Ptx Ax
If:
Phase Initiated
By Ins. Demand
(I + .2Mx2)3
Iterative
Solution for
Mx>1.0
Phase Initiated
By Choked Throat
X ) XT Mx>1.0
Phase Initiated
By Choked Throat
X 4 XT
r
_X: D -"ty
>1 /__6Mx2______3.5L_._6 / Ptx
_x+5/ _Mx_-l/
__.1 Ptx
Ptx/(I + .2Mx 2)-3"5
| _--MX: 2 Y =
,>1 /7_ -l_p
\6 / x_I Px
Figure 46. Hnstarting Phase Properties at th9 Terminal Shock Station
149
Page 158
7_'2 "_-Pz PY6
Figure 47. Unstartln6 F_se Properties Bchin_ the Terminal Shock
15o
Page 159
I Fi_u_ I !
i
__ XII'X) (wII)
_,u(x-_)(_zz)
__(WII)Py
I
!
I
£ Wbby
Ftll_re 1,8. Bleed Flc_ for the Duct Volmm
15z
Page 160
I -1--I Figure IL -46_ U Pt_
r II Figure
L _35n
II Fig ure ]
L___J
f(MA) II
-I 2 (t_y - Fy) I APtyd _-
Figure 49. Unstarting Phase Duct Vol_me Total Pressure Losses
152
Page 161
Kbp Pt2 I
J
W
A
Z(w2 + Ws)+Wbm * Wbt
r-----I , ws)
L----J
Figure 50. UnstartingPhase Bypass and Engine System Airflows
153
Page 162
[ II Figure IWe
L _o_j
' _ jI
_T__,_x'/_x' 47 iI
I Ux '_ Wx
lr " "1-
I Initial l_ilConditions
[ ]
I rn
I Initial l_tdi
[ Condltionsj
__ _,-_-_ol@t
I dTtd
"-_ Wx' (Tty - Tt_I)
ftt_Ttdl +_ _ dt
?igure 51. Unstarting Phase Duct Volume Mass and Total Temperature
154
Page 163
! !
I :(ATCS)t
r II Figure t X
I j
r !
I 51 I
I II Figure l,T_dI 5_ j
ilnitial 1
onditions_ Md
ri mgure l_Pt_2
L 49._i
r Ft_-e 1 A pt_49 I
! J
Ttd1+.z_ 2
Pd(1 +. 2Md2)3"5
Td
ti Ptd -_I Ptd2
Ptd+A Ptyd
Figure 52. Unstarting Phase Duct Volume Total Pressure
155
Page 164
!
!
+,-4kO
I
÷
156
F i
F '7I !
L.__J
I
÷
8
£
i
e3
_q
Page 165
UNSTART_ PEASE SWITCHING L00IC
[ Ii Fii_rel X. _ --
U _ U _en-----Xu < XL
I Xz _ Switch tor- -- --II Input Empty-Fill Phase
Lco___9_.tr-_
----X < XL
L. 53 __ I- Switch to
IEmpty-Fill Phase
kIInput]_[ Constant I r.
Transient initiated by YmsufficlentDem_
&
x>x TSwitch to
Started l_ha_o
Figure _. Unatarti_ Phase Phase Switching Logic
157
Page 166
m
J
PUR
PUS
PuR
i[m
5
O
6
UNSTARTm m emmm
NORMAL SHOCK POSITION
Figure 55. Unstarting Phase Inlet Unstart Pressure Signals
Page 167
FILLING
SECONDS
Figure 56. Empty-Fill Phase Typical Buzz Trace
159
Page 170
f(Mo,,o,_o,I.O.)
To(l 9 7-i 2T Mo )
v
_Xr
WII
Tt°'Ttx __
Figure 58. Empty-Fill P_se Ul_tre_- Properties
162
Page 171
W X
I w _ Wx " wT + awbbY
I.._by I
t .
I
X Xll I
Wbby
XI
IFILL MODE J
Wx WT - Wbbx
Figure 59. Empty-Fill Phase Airflow at the Terminal Shock
163
Page 172
L. J tl_
66 ,t-..... J
r .... m -_ox
Figure i!
66 .
L
- Wbb x
t
Figure 60. Empty-Fill Phase Properties at the Terminal Shock Station
Page 173
Ty(J.+ .a%2)
Figure 61. Empty-Fill Phase Properties Behind the Terminal Shock
165
Page 174
l.J.l
LL
Z
Zl.l.i
8
H H H n II
m
I,--
l---fJ_
N
f_
X
I--X
orJ'j
u
r,-1
u}
I
r_
j
Page 175
r i, f(t) iL__J
r Figure I Tto
L___J
I Constantl
I J
,| f(AICS)7 AT
L. !
r i, f(t) o PQL__J
I
L _70 _j
YES
NO
;1_-_ (t't:LEF) _ ((_T_°)TAB ]AT - l'ts
d b J d
_ (t-tiR) T_ _--
ft R
_ Inltlal time when ]q Ptd/P9 _ KEF
Figure 63. Empty-Fill Phase Effective Throat Area
i
w
167
Page 176
ax : t(x, AT)1'Figure ] X II' 71 ..L
Ir Axer s ,,
x<x_ A_erX-XT
x_<x<x_ _ (,mr_A_,r)+AT_:x>xs ._
A.xef8
F
Axefs I
Axef
Figure 6_. Em_pty-Fill Phase Effective Flow Area
168
Page 177
r .... -.]%L;(;_._._I
i Figure _XI 7_ iL .... -J
i
.....-_!va= r(x,_)r 1
con_ r----_v_ = r(xR,_)
_ 1L_c°_.__J--T_ .
--- _ I I It. V_r..=
r ..... 11 I I Vd_f.
L--?--_-F1 ' I
; 63 I-- ' _ .... IV_r
L ..... J IYe' Vdjr. _'-'--'_
L_ ,o j
Figure 65. Empty-Fill Phase Effective Volume
169
Page 178
t "1,f(AICS)L. _ __I
t !I Figure ,X
U !LJ
finput IIn^_.o.. IXIII
! Input I
I' C°nstant_XT
I
%_./
...__.2
l_.._#
,,_._.,%_..,
.-.-2
--._1%__I
_y
I
' If:
X > XII I_-_
_-_ XTK XKXii I
--_ If:
X .,%XII I
X2 < X < XII I
_-_ X<X T
If :
X > XII I
_- X < XII I
r I
Wbbx =
_x(XIII'XT)W T
x(X-_)wT
0
Wbbx
o0
nI
Wbby
_y(X-XIII)WT
b_
I Figure IPY
[_ 6_ j
t I--I Figure I PyU _6o_ _j
Wbby
]
L
r
Wbby
ryW
Figure 66. ,Empty-Fill Phase Boundary Layer Bleed Flows
17o
Page 179
F _ _a I
m
I Figure IPt_
L 2°__]
r Fi_ II IMA
I 58 1
F w i .... I
,F_ iP_I 60 j
[ :, Z(AICS):AzL_ l
dE= (_y. 14
i
_igure 67. Empty-Fill Phase ,Duct Volume Total Pressure Losses
17i
Page 180
znPut Io__nstant 'Kbp
Pt2
L riTt2 WFig__/
ChmAbm (W) IWbmf(AIcs)'!
[ f(AlCS) I 1ICbtAbt _ CbtAbt W_ Wbt
-- 7 A
E,,' 9(ENO)I X(wo_%)
IZ(W2+ Ws )+ Wbm ÷ Wbt I Weo--
Figure 68. Empty-Fill Phase Bypass and Engine System Airflows
172
Page 181
_Ii 11
IFigure IWe
L 68 I
v 1I Figure u Wbby
66 •I J
r tInitial
Lconaitio_-
rlFigure I60 I Wx
I ]
D u I
IFigure I Ux-
t 61 iu_
f
, IIFigure I Try
I' 6z 1
r-IInitial _tdi
Lcondi_ion_
._I'
Wx' - Wbby - fie
dt
IIa_'a
f
-_ Wx'(Tty - Ttd)_d
t
dTtd
Ttd i + ji-_-6-
dt
dTtd
a___t
Ttd m Tte
_igure 69. Empty-Fill Phase Duct Vol_e Mass and Total Tem1_rature
173
Page 182
r
LT ._j
I ]
V
!
I Figure
[ 69 j
[
IInitial
L ]
Figure
67 1
Ttd
i+ .2_I 2
T d
r
Figure
67
Pd(i+.e_i2)3"5 Ptd " APtd2
Ptyd I
l
r
Figure 70. Empty-Fill Phase Duct Volume Total Pressure
174
Page 183
,-4I t4"_.
...,
I./'%
I
A
"'-J X
x ISO
"-J x
I ,,_o
.111
,0 _I _I
F>.,-4
,M
4.} _ i_+ _Im
4- dl
J _ 0 l
I ,_ ._ iI t _ _ _E
I _ _1 _-_ b-
,_1 ,_1 _']r-7 r--7 r- 7i I
L__J LE_I L___J
_"-J m
II
0
A
r:]l r-7I_I"II_ Io,L_..:J L_gJ
.i-)
.H
r-?,I _t_ IL___
.H,I.I.,-4
l#
o
g.1:3
@
.H
I
t'.-
1?5
Page 184
• L •
IFi --1
L___
r
I"n6"a_ lWoI __
L 5e
X 4X L &
we+WbbY >Wo
SWITCH TO
Subcrtti_FaMe
buzz
_o) buzz
Figure 72. Empty-Fill Phase Phase Switches
176
Page 187
! II fCt)i
f(Mo,aro,_o,I.G. )
r-
Pto _x
I ITto,Ttx_ To(i÷._.%2)
Figure 75a. Subcritical Phase Upstream Properties
179
Page 188
Li
Figure 75b. Subcritical Phase Upstream Prol_erties
180
Page 189
4.6
4.2
3.8
3.0
I I I
SEE REFERENCE 2
I I I-
/
2 DI_4E_IONAL
!//
o= /
2.6 , /
_2.2 //
1.8
_._ ////" //"
i.O f __ / / / AXISYMMETRICI Io zz 16 _ 24 28 32 36 4o
SEMIVERTEX ANGLE o,8 DEGREES
Figure 76. Subcritical Phase Maximum Deflection Angle for Attached Flow
181
Page 190
F m m_ _ 1
I Figu.re I' 75 a JL-_ ___J
IL. _ _..j
I Figure I P't,xt 75a tL_ ___.J
1 I A!znlmt ,
li(z -#-.m_)3.5
dWx
r "-I
Initial _x _ondition _ _ tit
=
r
Figure T7. Subcritical Phase fallow
z82
Page 191
PiFigure 7M AJ 75 a Li I
r !
,'f(AICS) ,AT'L _ _._J
I !iInput ,X IIConstantlI j
I IIInput IXIIIIConsta_t Ii ]
rlFigure IiwxI
L 77 ;
iII'_y(XI - XIII)W x
]
I
Figure 78. Subcritical Phase Boundary Layer Bleed Flow
183
Page 192
L_---I
|Figure
_olution
MII I < i
XIII
_o :(Mo,AT)
Figure 79. Subcritical Phase Duct Volume Total Pressure Losses
Page 193
! IIFlip're I Pt2
[ _2 _j
t 1
[ 1
IZ(AZCS) i CbmAbm,L J
r IIf(AICS), ObtAbt
h_.... J
Kbp Pt2
Tt2
I:(ENG) ]Z(w2 + Ws)
bm
Wbt I_(Q 2+ Ws )+ Wbm _Wbt
Figure 80. Subcritical Phase Bypass and Engine System Airflows
185
Page 194
I Figure ]We
I 8o_ I
,Fi_]_bbyI78 i
r- Initial _ _di I
I ConditionL
1 Figure Wx
I 77 j
i Figure
I 75b
r. II Figure Tty
I 75b j
I Initial Ttd i
[_ Condition ]
wx u_
- Ux
JW_ - Wbby - We
IIat
Wl(Tty - Ttd)
__tTdi+ j-_- dt
dt
dTtddt
I -
Figure 81. Subcritical Phase Duct Volume Mass and Total Temperature
186
Page 195
v
L I
rF i I
_V-
! XL
I
r- i
If(AICS) IAT
h
Input
Constant ]
[ Figure '1I 83I I
iFigur_
1 79
[Figure1 79
J
" hAL h__k_L Pt_'aPt_2] .Pt2.
Ax/-_ [ J -
_Ptd_Pt III_ Pty_
Figure 82. Subcritical Phase Duct Volume Total Pressure
187
Page 196
:._1
i:7r 7
Ii I_°I,j12__1
TI
I8
+_
!
,i . )
_,. _
14
I
188
Page 197
I _tanilL___
[ Fi ,w
I _ I '_
L_ __.I
I I
[f(_ICSi _ ._
t[--Fi_ lWbbyl 78 --L_ i
r_% -Ix
! Inl_ t "_,Xii I
Lc°cr lnput IXTF
Consta_t_ -_J
I l
FigureI 7_I -/
L---_
,,,,-
Tt °
WREN
SWITCH TO
HAMMERSHOCK
PHASE
WHEN
We_'WbbyWo <I_) BUZZ
SWITCH TO
EMPTY -FILL
PHASE
WHEN
--We+ bY _III_X._) h WT
SWITCH TO
EMET-FILL
PHASE
Figure 8_. Subcrltical Phase Phase Switches
189
Page 198
XB-70GROUNDOPERATION
PtPto
1.4
1.2
1.O
.8
.6
.4
.2
i i l [
I-
Figure 85. Hammershock Phase _rshock Pressure Trace
19o
Page 199
/
/tlOOlllllOOllll
PIll
.i-(
-la
_H0
J
.rt
Page 200
Co_dltlonm tL. .... .J
Past Pt_se
"to,_o,I.G. )
*%,%,I.G. )Starte_
Pro
f(%, _o, %,I.o. )
Wo
Tto = Ttx
Figure 87. Hammershock Phase Upstream Properties
19e
Page 201
SUBSONIC
x STARTED
SU_ER-SONIC
SUB-" SUPER-
SONIC SONIC_ . SU_
J i_1
x EMPTY-FILL
P
SUBCRITICAL
Figure 88. _Mmmmrshock Pha_e Simulation Moclels
193
Page 202
STA/_O_T_N
WII Wx W
I Vb_x I wbb_i I
I | i |I !
X I Xii X Xii I Xll S
WII. Wx _ WX_
I ' i : II t " i, II I I I IXI XII I X XES
Wx_
XIII
W_ WII
i _w_ Wbb_m
I Z I I
' i 1 II I J I'
X I X & XII XII IXHS
Figure 89a. Hammershock Phase Bleed Flow Schematic Diagram
Page 203
_IE_-FILL 0PERATIDN
wT wx wxsSL
/i i i 'XI XT X XII I XHS
v
m! , : ii iI I , ! | '
I ' i | i
I I I IXI XT X XHS XII I
W x &
WXHS WT
W_by_S
t/: ! I
x _XttS
XIII
Pigure 89b. Hammershock Phase Blee_ Flow Schematic Diagram
195
Page 204
SUBCRI_ICkL _ERAT I_
!
X ,, X XIII
!XI = X XHS XII I
WX
l ! tI •• i
i | il l• I
tx_.x _ xIiI
Figure 89c. _rshock Phase Bleed Flow Schematic Diagram
Page 205
ic_o__t___j----_If:
<i
x_s< x¢ <1
I' Zuitial'_. Past Phase
I Co_ti_t
Past Phase:
Started
_y-_nA
Subcritical
Iterative
Solution For:
Kx)lMx. (Mx)1
Mx<Z
],r_ I, Axef
LJ 3__j
r 1i __ iL _7__j Tto.-Tt_
• Wx oI Ptx Axef
'T=Y |
' AM,x_
>1 6
WIII =W_
Wll
Wbb
L2L__obx
_-_-_L 9_ .j
- Past Phase:
Started
D
E_y-F_
Subcritical
Wbase:
WII
WTWIII
Wbase
Ptx
Figure 90. Hammershock Phase Properties at Station X
W X
197
Page 206
I
I FIEure I Wx I
,__9°__iF_" "I xL ILco____--l---_ [T II Figure I Wbby
I 95 I
! II Figure I Pry
I _ I
! II Figure I _ PtyxHB
I 97 I
I Figure. I AxHSef
I 93 ]
r 1' f(t) 'l ]
To
I- II Figure _ Wfo
L zoz !
FI Figure ]
L 1oo jXHB
v ,P
i
T IInitial
LI Conditio_x i
r I
I ngu_ iI 9o j
I T Ttx
1
I
If:
X_ > XL
X_ __ XL
Pty " _ PtyxEs
WxEB
PtxHB AxHsef
Iterstive
Solution for
=
(MxHS)I < Z.O
WxES :=
Wx - Wbby
Wfo
axes
_>xXL _z.XHS < X
x__< xT.
II.I__
1.O
Figure 91. Hammershock Phase Properties at the Hammershock Station
j.-
MxHB
PxEs
z_
Page 207
,_ -' 1L_ _ j_---]
TyHS(I + ._ES) TtyHS
I Figure I Tx_,! 91 j
---- clXEB
i i00 L\ I_L___
r Fi_re I p
L__J
(_ + 5)(T_-_ - I)TxHB
I_ +5
:V_,2-_?Mx_ s - i
Ty_
| cq
I 91 .- _s _ 1.o P_s
Mx_s> 1.o ("_6 " :t.x_
t
PyES
Figure 92. Hammershock Phase Properties Behind the Hammershock
199
Page 208
II f(AICS)I i
[Input
[ConstantL ]r_it±_ q[Condition
InputConstant[ I
rFi gure IX1 95
L___J
!
[Initial .
Condition] ATef
fFigureI i00I
f(X,A T)
f(X ,AT)
A X
Axe f: "[
(Ax) 1 [Axe f
Ax
ATef). .
(xR -_ (X-XT)
I:: (Axml
- f(XHs,AT)
ATef
_ATefe_T
Yes
JNo
Ax_i_ef =
(4mS) Z
4ms
AXESefL
r-
Figure 93. Hammershock Phase Effective Flow Area
2OO
Page 209
(xR -mr) + vr_
XES > XR VES
I FigureI
L 93
[f(AIcs)]_L.___
vHs = f(Xm,Az) v_
J
'._.__
A_f < Ar vHsez -
YES VESef
No VEB
Figure 94. Hammershock Phase Effective Volume
201
Page 210
.fF
,, .1 _ o
xl
' !l
,1•rl ,i-4
x x
I-'4 I_ _I
It
i'I'
!
202
Page 211
I_ __ I_-
7
r
',f(E_)IJ(w2+ %)l !
Figure 96. Ha_mershock Phase Bypass and Engine System Airflows
zo3
Page 212
[n_r,u.,e I,xA Ii _7 , "-I_ ___J
r(XA)
I_ I-n ! _v
[ I
IInlm,t 7 X2Constant !
' II Figure X
I 95 JI
1 j
FXI_ - X
_ _, - 5_7
i
_PtyxE3
IF,igure ] XHSi00 r
L j
?igure 97. Hanm_rshock Phase Subsonic Flow Total Pressure Loss
2O4
Page 213
Wa
I 95I__ __.i
l 9edTt_
dt
fInitial" _TtHS
[Conditio_ !
Figure 98. Hammershock Phase Kammershock Volume Mass & 2oral temperature
z05
Page 214
I Figure II 9_ I V_ef
I .j
I__ __1 VESef
rI Fio_ure_ TtH S
RT_ !p_
Input I_I C0nstant
L I
TtHS
_I PHS(I_'_)3"5 I Ptl_ = PtyES
Figure 99. Hammershock P_mse Hammershock Volume Pressures
Page 216
I II Figure, (Ptx)l
TI Input
L constant j
.Il
ML
A L
(_..s_) 3
TtEs
r- II f(AICS) i
L___d AT
(Wfo) 2
If:
(Wfo)I <(Wfo)2
(Wfo)1A(Wfo)2
Wfo --m
-(Wfo)1
-_Wro)2
Wf o
Figure i01. Hammershock Phase Forward Outflow
208
Page 217
m Figure I_v! i
lO0
t Input
_7 _ o
,I Figure
87
L _ __J pt/, \
1 ]
|Initial -'I Past Phase
]Condit ion_ [
[___D
When
PtI_ _--_t_ I
Terminate _un
Past
Fhase
Started
Empty-Fill
_ _ubcritical
q
(Ptx)l
(Pt._)l:
t_p--_o_ Pro
t_p_) S" Pro
)
Figure 102. }Mmmershock Phase l_e Switches
209
Page 218
gp A
' i '. ! ;i ! I I
' i ' { iI i I "I _ I I l,iX
STATION
n
I I
Figure 103. InltialConditlons - Simpson's Rule Determination of W_H
210
Page 219
t
1
_IN ×i X2 X3 XM_X
Acceptable
TERMINAL SHOCK STATION
Figure 104. Initial Conditions - Slope Method of Successive Approximations
211
Page 220
APPENDIXA
INSTANTANEOUSMOMENq%_4SIMULATIONMODELFORTHESTARTEDPHASE
The "instantaneous momentum"modeldiffers frQm the "frozen plug" model
described in the text only in the assumptions made relative to the H_lmholtz
Volume.
In the "frozen plug" concept, flow throughout the Helmholtz Volume is
assumed to be in instantaneous equilibrium with conditions Just downstream
of the terminal shock. Consequently, PzH , the pressure at the downstream
face of the Helmholtz Volume, can be computed knowing only the upstream
properties and the terminal shock velocity. PzD , static pressure at the
upstream face of the Duct Volume is then computed from continuity relation-
ships. During non-steady state conditions, PzH differs from PzD • The
difference of these pressures acting on the common interface provides
unbalanced force acting to change the momentum of the air in the Helmholtz
Volume,
(PzD " PzH ) Az " _\ g dr!
By contrast, in the "instantaneous momentum" concept, the momentum
equation for the air in the Helmhol_z Volume
PyAy "PwAw" Pz As+ WyUy" WzUz"g g d-_dC2---HgdX)d-t
Figure A-I illustrates the forces acting on the air in the Helmholtz Volume.
To evaluate the momentt=n equation, the assumption is made that Pw ,
the wall force pressure, is between and proportional to the static pressures
212
Page 221
AFPENDD( A (Continued)
at the upstream and downstream faces of the Kelmholtz Volume.
it is assumed that
Pw " KPy+ (i - K)P z
Specifically,
or
K •
Pz - Pw
PZ - Py
The further assumption is made that the factor K ccmputed for quasi-steady
state conditions is applicable to _c conditions. During quasi-stead_
state conditions,
•Therefore
-0
_-_wAw • Wz Uz - WY Uy+ P_z Az - _y, kyg g
Inasmuch as Aw • A z -Ay ,
p-_ / 1 _(Wz Uz . WpUy+ _z A zK • " \A z - Ay/_ g 6
#
Then, for dynamic conditions
Pw Aw • Pz Az " Py Ay+ P(Fz" P'YA-P_'_-z'g'Uz
Substituting the wall force equation into the moment_ equation,
An alternate fore of the above equation is
213
Page 222
APPENDIX A (Continued)
Simulation runs have shown that the "instantaneous momentum" concept,
as compared to the "frozen plug" concept, has the following characteristics.
i) The physically unrealistic discontinuity in pressures at the
interface between the Helmholtz Volume and the Duct Volume is
eliminated.
2) The dynamic response characteristics are much more sensitive to
the selected length of the Helmholtz Voltm_e. This factor enables
better matching of test and simulation data, but introduces further
uncertainties when test da_a is not available to help determine
Helmholtz Vol_e length.
3) The simulation eq_tlons are more numerous, and the ratio of
computer time to _eal time is greater.
214
Page 223
I
APPENDIX A (Continued)
X
Figure A-I. Pressures Acting On The Helmholtz Volume Air Mass
215
Page 224
=
it
REFERENCES
i. M_rtin, Arnold W. ; Wong, H. W. : Propulsion System Dynamic Simulation
Program User's Manual. NASA CR 73113
2. Ames Research Staff: Equations, Tables, and Charts for Compressible
Flow. NACA Report 1135, 1953.
3. Martin. Arnold W. : Propulsion System Dynamic Simulation Data. NASA
CR 73115
4. Moeckel, _. E. : Approximate Method for Predicting Form and Location
of Detached Shock Waves Ahead of Plane or Axially Symmetric Bodies.NACA T_ l_l, 1949.
216 CR_92 8 NASA-Langley, 1968 _ 11