87


NASA Engineering and Safety Center Technical Assessment Report
Version: 1.0
Title: National Highway Traffic Safety Administration Toyota Unintended Acceleration Investigation -
Appendix C
Page #: 2 of 87
NESC Assessment #: TI-10-00618
Table of Contents
C.1 Functional Areas with Functional Block Diagrams, Test Scenarios, and Test Results ................... 5 C.1.1 Throttle Position Control Functional Area....................................................................................... 9 C.1.1.1 Detailed Implementation Description .............................................................................................. 9 C.1.1.2 Throttle Control Loop Sensitivities and Postulated Faults ............................................................ 14 C.1.1.3 Signal Aliasing of VPA1 and VPA2 .............................................................................................. 15 C.1.2 Accelerator Pedal Control Functional Area ................................................................................... 18 C.1.2.1 Detailed Implementation Description ............................................................................................ 18 C.1.2.2 Pedal Control System Sensitivities and Postulated Faults ............................................................. 21 C.1.3 Idle Speed Control Functional Area .............................................................................................. 62 C.1.3.1 Detailed Implementation Description ............................................................................................ 62 C.1.3.2 ISC Engine Coolant Temperature .................................................................................................. 63 C.1.3.3 Idle Speed Control System Sensitivities and Postulated Faults ..................................................... 63 C.1.3.4 Engine Coolant Sensor Fault ......................................................................................................... 64 C.1.3.5 Engine Speed Signals Corruption .................................................................................................. 64 C.1.3.6 Failed Compensation for Additional Engine Loads ....................................................................... 65 C.1.3.7 Summary of Idle Speed Control Potential Faults ........................................................................... 67 C.1.4 Cruise Control Functional Area ..................................................................................................... 67 C.1.4.1 Detailed Implementation Description ............................................................................................ 67 C.1.4.2 Cruise Control System Sensitivities and Postulated Faults............................................................ 70 C.1.4.3 Vehicle Test: Enable Cruise Control and Restrain Brake Switch Plunger .................................... 71 C.1.4.4 Vehicle Test: Short Cruise Control Signal Resistively to Ground ................................................. 71 C.1.4.5 Vehicle Test: Cruise Control Shift Out Of Drive Cancel .............................................................. 71 C.1.4.6 Failed Wheel Speed Sensor ........................................................................................................... 71 C.1.5 Transmission Control Functional Area .......................................................................................... 71 C.1.6 VSC Functional Area ..................................................................................................................... 72 C.1.7 ECM Power System ....................................................................................................................... 72 C.1.7.1 Detailed Implementation Description ............................................................................................ 72 C.1.7.2 Power System Sensitivities and Postulated Faults ......................................................................... 74 C.2 Software Analysis .......................................................................................................................... 75 C.2.1 Software Functions and Implementation ....................................................................................... 75 C.2.1.1 Main CPU Functions...................................................................................................................... 76 C.2.1.2 Sub-CPU Functions ....................................................................................................................... 79 C.2.1.3 ECM Software Implementation ..................................................................................................... 79 C.2.2 System Integrity and Fail Safe Modes ........................................................................................... 81 C.2.2.1 Power On – Reset .......................................................................................................................... 81 C.2.2.2 Heartbeat .................................................................................................................................... 81 C.2.2.3 Watch Dog Timer .......................................................................................................................... 81 C.2.2.4 Hardware Data Checks .................................................................................................................. 81 C.2.2.5 Data Transfer ................................................................................................................................. 82 C.2.2.6 Software Data Checks .................................................................................................................... 82 C.2.2.7 Fuel Cut and Electronic Fuel Injection (EFI) and Ignition ............................................................ 82

NASA Engineering and Safety Center Technical Assessment Report
Version: 1.0
Title: National Highway Traffic Safety Administration Toyota Unintended Acceleration Investigation -
Appendix C
Page #: 3 of 87
NESC Assessment #: TI-10-00618
C.2.1.8 Onboard Diagnostic Interface (OBD II) ........................................................................................ 82 C.2.3 Software Study and Results ........................................................................................................... 82 C.2.3.1 Software Analysis Scope and Technologies Applied .................................................................... 83 C.2.3.2 Software Implementation Analysis Using Static Source Code Tools ............................................ 84 C.2.3.3 Software Logic Model Checking Using the SPIN Tool ................................................................ 85 C.2.3.4 Software Algorithm Design Analysis Using MATLAB Models ................................................... 86
List of Figures Figure C.1-1. Fishbone Diagram of Postulated UA Causes ............................................................... 6 Figure C.1.1.1-1. Throttle Valve Control Block Diagram ...................................................................... 10 Figure C.1.1.1-2. ThrottleValve Sensor Output Voltage Relation between VTA2 and VTA1 and the
DTCs .......................................................................................................................... 12 Figure C.1.1.1-3. Contributions to Throttle Command .......................................................................... 13 Figure C.1.1.2-1. Summary of Postulated Faults Identified by Throttle Function Fishbone Diagram ... 14 Figure C.1.1.3-1. Summary of postulated EMI faults identified from Fishbone analysis ...................... 16 Figure C.1.1.3-2. 500 Hz injected common to both VPA signals (top Yellow trace) results in driving
the motor and roughly 0.2 Hz aliasing sensed on VTA (bottom Blue trace) ............. 17 Figure C.1.2.1-1. Block Diagram of Pedal Control Function ................................................................. 19 Figure C.1.2.1-2. Range for VPA1 and VPA2 ....................................................................................... 20 Figure C.1.2.2-1. Summary of postulated faults identified by Pedal Function Fishbone Diagram ........ 22 Figure C.1.2.2-2. Pedal DTC Map, 07 Camry V6, red is P2121 wide limit ........................................... 24 Figure C.1.2.2-3. The upper operational lane with the latent fault influence and wide open throttle
location. ...................................................................................................................... 26 Figure C.1.2.2-4. Chronological steps of a dual fault in the upper operational lane .............................. 27 Figure C.1.2.2-5. Fault resistance locations for the postulated double fault of shorts to the +V supply 28 Figure C.1.2.2-6. Potentiometer sensor type pedal with latent resistive short between VPA signals .... 29 Figure C.1.2.2-7. Potentiometer Sensor Type pedal with faults outside the operational lane ................ 30 Figure C.1.2.2-8. For Hall Effect type pedals, Resistance range required for latent fault between VPA
signals and second fault of VPA2 resistive shorted to +V ......................................... 31 Figure C.1.2.2-9. Hall Effect sensor type pedal with Latent fault and second fault resistive open circuit
of VPA2 and pedal stroke affects ............................................................................... 33 Figure C.1.2.2-10. Potentiometer sensor Type Pedal with examples of resistive shorts of the VPA
signals to the +V supply and the relationship to the operational lane for the full pedal stroke .......................................................................................................................... 35
Figure C.1.2.2-11. Hall Effect sensor Type Pedal with examples of resistive shorts of the VPA signals to the +V supply and the relationship to the operational lane for the full pedal stroke .. 36
Figure C.1.2.2-12. Resistance range required for simultaneous resistive open circuit in the VPA return line for all three pedal types. [Note: common area highlighted] ................................ 37
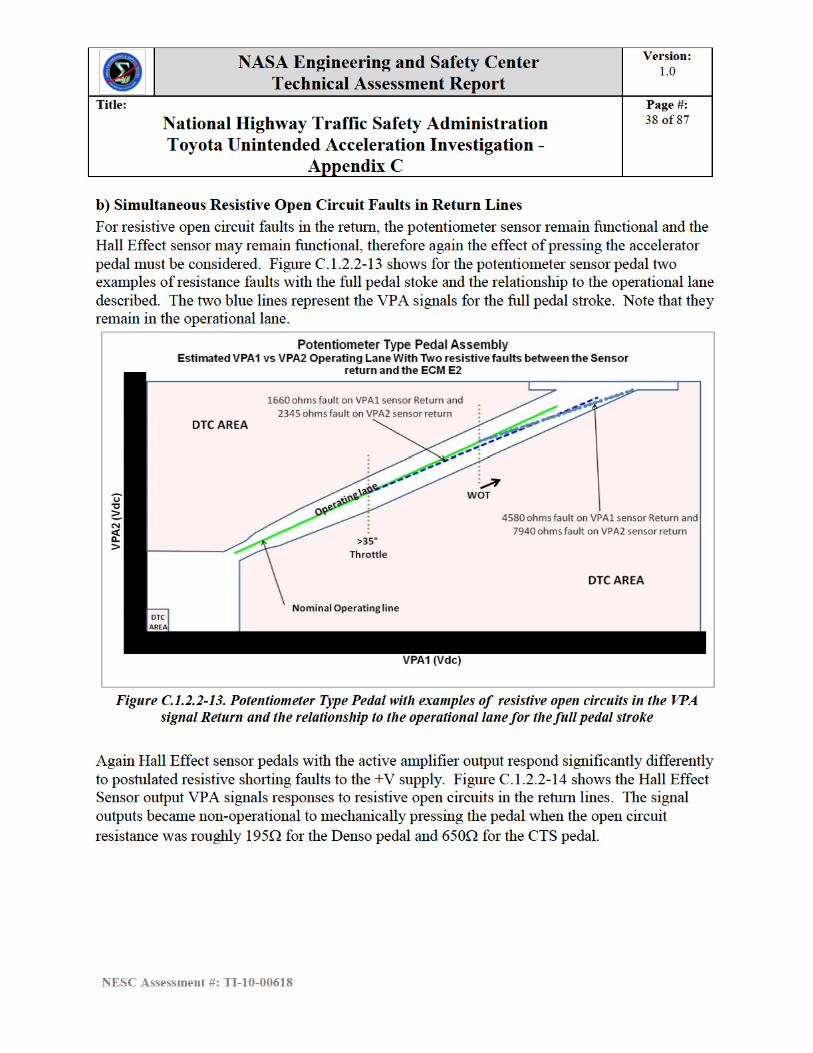
Figure C.1.2.2-13. Potentiometer Type Pedal with examples of resistive open circuits in the VPA signal Return and the relationship to the operational lane for the full pedal stroke .............. 38
Figure C.1.2.2-14. Hall Effect Pedals response to Resistive Open Circuits in return [Note the CTS pedal converges to 5.0V at approximately 8kohms] ............................................................ 39
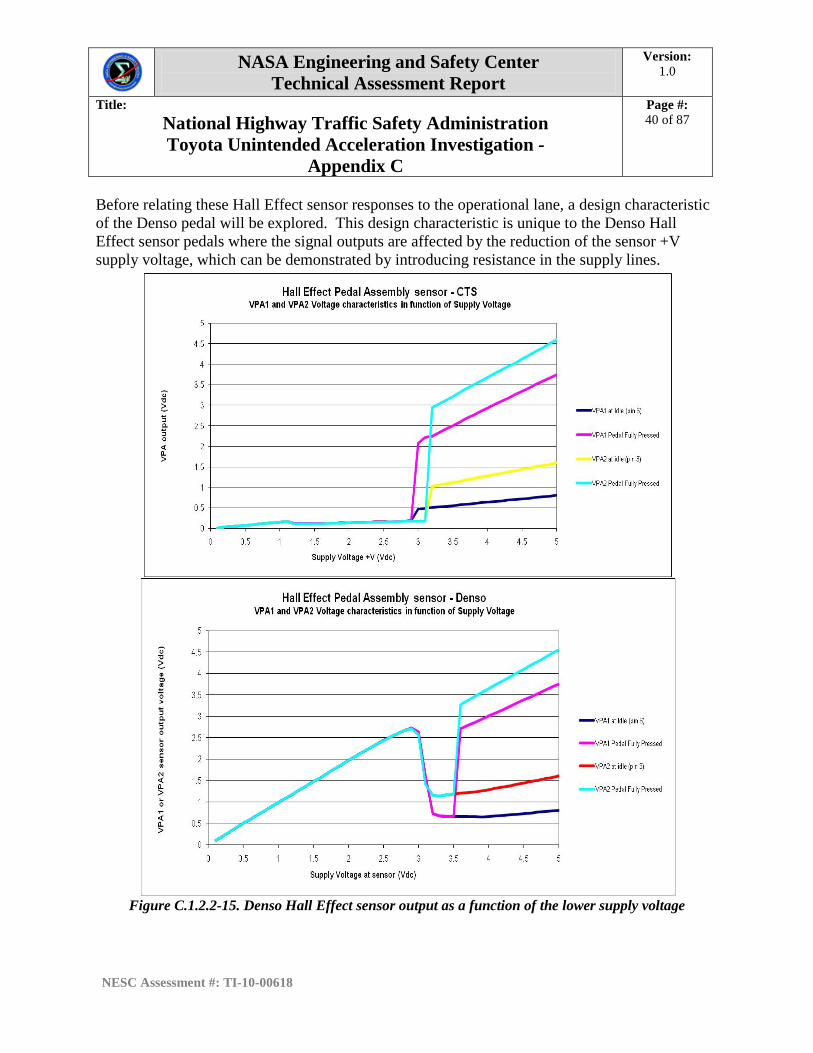
Figure C.1.2.2-15. Denso Hall Effect sensor output as a function of the lower supply voltage ............... 40 Figure C.1.2.2-16. Two Hall Effect Pedals with examples of resistive open circuits in the VPA signal
Return and the relationship to the operational lane for the full pedal stroke .............. 42

NASA Engineering and Safety Center Technical Assessment Report
Version: 1.0
Title: National Highway Traffic Safety Administration Toyota Unintended Acceleration Investigation -
Appendix C
Page #: 4 of 87
NESC Assessment #: TI-10-00618
Figure C.1.2.2-17. Resistance range required for simultaneous resistive faults between the VPA signals and the +V supply for all three pedal types ................................................................ 43
Figure C.1.2.2-20. One of two rotating contact assemblies (left), resistive elements (center), and electrical diagram (right) for the potentiometer pedal sensors showing defective accelerator pedal assembly fault region ..................................................................... 48
Figure C.1.2.2-21. Pedal Resistive Fault Event Sequence Diagram ......................................................... 50 Figure C.1.2.2-22. Simulated Pedal Fault Behavior ................................................................................. 51 Figure C.1.2.2-23. Tests Performed on the MY 2005 L4 ETC Simulator ................................................ 52 Figure C.1.2.2-24. Disassembled Accelerator Pedal Assembly Potentiometer ........................................ 54 Figure C.1.2.2-25. Shorting whisker VPA1 to VPA2 (top) and long whisker on VCPA1 (bottom) ........ 56 Figure C.1.2.2-26. The current to bring a tin whisker to its melting temperature versus the length
of the tin whisker ........................................................................................................ 57 Figure C.1.2.2-27. Lognormal cumulative probability distribution of tin whisker lengths (left) and
thicknesses (right) for a sample set ............................................................................ 58 Figure C.1.2.2-28. CTS Hall Effect Pedal Assembly Connector and Circuit Card .................................. 59 Figure C.1.2.2-29. CTS Pedal Assembly Circuit Board X-ray Detail ...................................................... 60 Figure C.1.2.2-30. X-ray of Denso Pedal Assembly ................................................................................ 61 Figure C.1.2.2-31. Denso Pedal Assembly Circuit Board X-ray Detail ................................................... 61 Figure C.1.3-1. Idle Speed Control Functional Block Diagram .......................................................... 63 Figure C.1.3-2. Summary of postulated faults identied by Idle Speed Control Function Fishbone
Diagram ...................................................................................................................... 64 Figure C.1.3.5-1. NE signal (Crankshaft, top yellow) and G (Camshaft, bottom blue) signal at idle .... 65 Figure C.1.3.6-1. Test results with coolant temperature sensor failed to 150Kohms resulting 2000 rpm
increase with vehicle in neutral .................................................................................. 66 Figure C.1.3.6-2. Upper resistance range of the Coolant Temperature Sensor including the DTC error
range ........................................................................................................................... 67 Figure C.1.4-1. Cruise Control Block Diagram ................................................................................... 68 Figure C.1.7-1. Power Supply ASIC for MY 2005 L4 ........................................................................ 73 Figure C.2-1. Software Functions and System Safety ...................................................................... 75
List of Tables Table C.1-1. Fishbone Summary of Potential UA Sources ............................................................... 7 Table C.1.2.2-1. Summary of Dual Fault Conditions ............................................................................ 44 Table C.1.2.2-2. Potentiometer Accelerator Pedal Assembly Resistances ........................................... 48 Table C.1.2.2-3. Tin whiskers observed on the tin-plated copper leads soldered to the PCB ............... 55 Table C.1.4-1. Cruise Control Switch Voltage Output ...................................................................... 69 Table C.1.4-2. Cruise Control States .................................................................................................. 69 Table C.1.4-3. Cruise Control Diagnostic Codes ............................................................................... 70 Table C.1.4-4. Cruise Control Auto Cancel ....................................................................................... 70 Table C.2.1-1. Cruise Control States .................................................................................................. 77 Table C.2.1-2. Basic Code Size Metrics Camry05 Software ............................................................. 80

NASA Engineering and Safety Center Technical Assessment Report
Version: 1.0
Title: National Highway Traffic Safety Administration Toyota Unintended Acceleration Investigation -
Appendix C
Page #: 5 of 87
NESC Assessment #: TI-10-00618
C.1 Functional Areas with Functional Block Diagrams, Test Scenarios, and Test Results
An Ishikawa (fishbone) diagram, Figure C.1-1, lists in a functional hierarchy potential failure causes of UA postulated based on the NESC team’s assessment. Each postulated failure cause was dispositioned through analysis or test and the closure of each of the elements of the fishbone was documented in a table. The analysis and disposition of fishbone elements is contained in Appendix B.

NASA Engineering and Safety Center Technical Assessment Report
Version: 1.0
Title: National Highway Traffic Safety Administration Toyota Unintended Acceleration Investigation -
Appendix C
Page #: 6 of 87
NESC Assessment #: TI-10-00618
Figure C.1-1. Fishbone Diagram of Postulated UA Causes

NASA Engineering and Safety Center Technical Assessment Report
Version: 1.0
Title: National Highway Traffic Safety Administration Toyota Unintended Acceleration Investigation -
Appendix C
Page #: 7 of 87
NESC Assessment #: TI-10-00618
The fishbone for this investigation was developed to address functional failures and, consequently, does not devolve to the part level. It is configured into 9 major areas: Throttle Function, Pedal Function, Cruise Control Function, Idle Speed Control Function, Transmission Shifting and VSC Function, Software, Environmental Effects, Power, and Mechanical Effects.
While not absolute, in general, the NESC team focused on those failures that could increase the throttle opening, without generating a DTC. Any failure or set of failures that were identified as a potential source of a UA, without generating a DTC, is discussed in the body of the report in their functional area. Those elements that have been identified as potential sources of UAs are identified by a red square in the diagram and are summarized in Table C.1-1. This is a subset of all possible failures and does not include design features that intentionally open the throttle or all possible variations of a given failure mode.
To decompose this system, the design was separated into the major control loops or functional areas in the ETCS-i that regulate engine power output: throttle control, pedal control, idle speed control, cruise control, transmission control, and VSC. The main focus of this study was in the first three control loops. Cruise control was considered a potential cause of UA because the electronics is placed in direct control of the vehicle speed. There were a number of VOQs involving cruise control. However, most of these could be traced to normal operational characteristics of the cruise control function. The maturity of cruise control systems and the multiple driver mitigations and electronic control limitations made this functional area a less likely candidate for causing UAs than the other throttle control electronic functional areas.
The remaining two control loops, transmission control and VSC were studied briefly to determine the magnitude of their influence on throttle opening. They were determined to have limited ability to influence throttle opening.

NASA Engineering and Safety Center Technical Assessment Report
Version: 1.0
Title: National Highway Traffic Safety Administration Toyota Unintended Acceleration Investigation -
Appendix C
Page #: 8 of 87
NESC Assessment #: TI-10-00618
Table C.1-1. Fishbone Summary of Potential UA Sources Major Fishbone Area
Failure Mode Category Finding Addressed in Report Section
1 Throttle Control
Postulated Throttle Position Sensors Supply (Vc) Increased Resistance F6 6.6.1.2.1 Postulated Throttle Position Sensors Return (E2) Increased Resistance with Learning
F6 6.6.1.2.2
Throttle Postulated Resistive Fault Summary F6 6.6.1.2.3, 6.9 Throttle Stuck F6 Appendix B-1 Throttle Motor Drive electronics PWM, H-Bridge, transistor failure, and or latchup
F6 Appendix B-1, Appendix-C, 6.9
Single event upset F6 Appendix B-1 EMI F7 Appendix B-1, 6.8, 6 9
2 Pedal Command
Postulated Pedal Position Sensors Supply (Vc) Increased Resistance with Learning
6.6.2.2.1
Pedal Single Faults of VPA1 or VPA2 Appendix B-2 Pedal Postulated Dual Faults placing VPA1 and VPA2 in the operational lane
F4 6.6.2.2.2, 6.9
Hall Sensor External Magnetic Fields 6.9 Signal Aliasing of VPA1 and VPA2: 6.6.2.2.3, 6.8 EMI, Noise Coupled into VPA1 and VPA2 Appendix B-2, 6.8
3 Idle Speed Control
Engine Coolant Temperature F6
6.6.3.1, 6.8 Engine Speed signals 6.6.3.4, 6.8 Compensate for Additional Engine Loads 6.6.3.5
4 Cruise Control Cruise Control Signal
F5
6.6.4.4 Cruise Control Brake Switch Cancel 6.6.4.3 Cruise Control Gear Shift Cancel 6.6.4.5 Vehicle Speed Sensor Failure Appendix B-4
5 Transmission Shifting
Sensing incorrect gear selection F6 6.6.5, Appendix B-5
6 VSC Sensing incorrect vehicle motion F6 6.6.6 7 Power +12v or +5v Ripple or Transients 6.6.7, 6.8, Appendix B-6 8 Software Coding Defects
F8 6.7, Appendix B-7 Algorithmic Flaws Task Interference Insufficient Fault Protection
9 Environmental EMI Radiated Fields F7 Appendix B-8, 6.8, 6 9 EMI Conducted Noise
EMI Transients Single Event Upset
Appendix B-8, 6.9
Electrostatic Discharge Mechanical Vibration Thermal
The following sections will cover the functional control areas starting with the inner most control loop (i.e., the throttle control). Although not a direct link to controlling the throttle, the power supply system effect on throttle opening was also evaluated and is presented at the end of the functional areas. The last three areas shown in the fishbone diagram include software error, environmental effects (e.g., mainly EMI), and mechanical effects (e.g., throttle binding). Software is addressed in Section 6.7, EMC/EMI, and mechanical effects in Section 6.8. Several external theories were also studied by the NESC team, and these are dispositioned in Section 6.9.

NASA Engineering and Safety Center Technical Assessment Report
Version: 1.0
Title: National Highway Traffic Safety Administration Toyota Unintended Acceleration Investigation -
Appendix C
Page #: 9 of 87
NESC Assessment #: TI-10-00618
It is important to recognize that the vehicle has nominal design features which will result in an increased engine speed and these are not considered faults. Some examples of nominal design features are:
• The vehicle is designed to increase the engine speed under the increased load of the air conditioning.
• The transmission torque converter lock-up is another design feature which results in an increased engine speed. See Section 6.6.5, Transmission Control.
• Under cold conditions, the vehicle is designed to idle faster and to gradually decrease the idle as the engine warms.
• The engine fuel injection and ignition timing was delayed as part of the knock sensor software. When the accelerator pedal is pressed the increased airflow combines with the fuel resulting in a driver-sensed delayed acceleration greater than when this condition is not present.
• When the cruise control is in use on hilly terrains, the automatic transmission may downshift to maintain set speed which results in significantly higher engine speeds.
C.1.1 Throttle Position Control Functional Area C.1.1.1 Detailed Implementation Description The throttle control loop maintains the throttle motor at the commanded throttle position based on throttle position sensor feedback. The throttle functional block diagram that describes this operation is shown in Figure C.1.1.1-1. The control loop consists of six major components: 1) the throttle motor and its associated mechanisms, 2) the motor drive IC, 3) two throttle position Sensors, 4) the Sub-CPU, 5) the Main CPU, and 6) the software for both the Main and Sub-CPUs. Refer to Figure C.2-1 for the Software Block Diagram.
NASA Engineering and Safety Center Technical Assessment Report
Version: 1.0
Title: National Highway Traffic Safety Administration Toyota Unintended Acceleration Investigation -
Appendix C
Page #: 10 of 87
NESC Assessment #: TI-10-00618
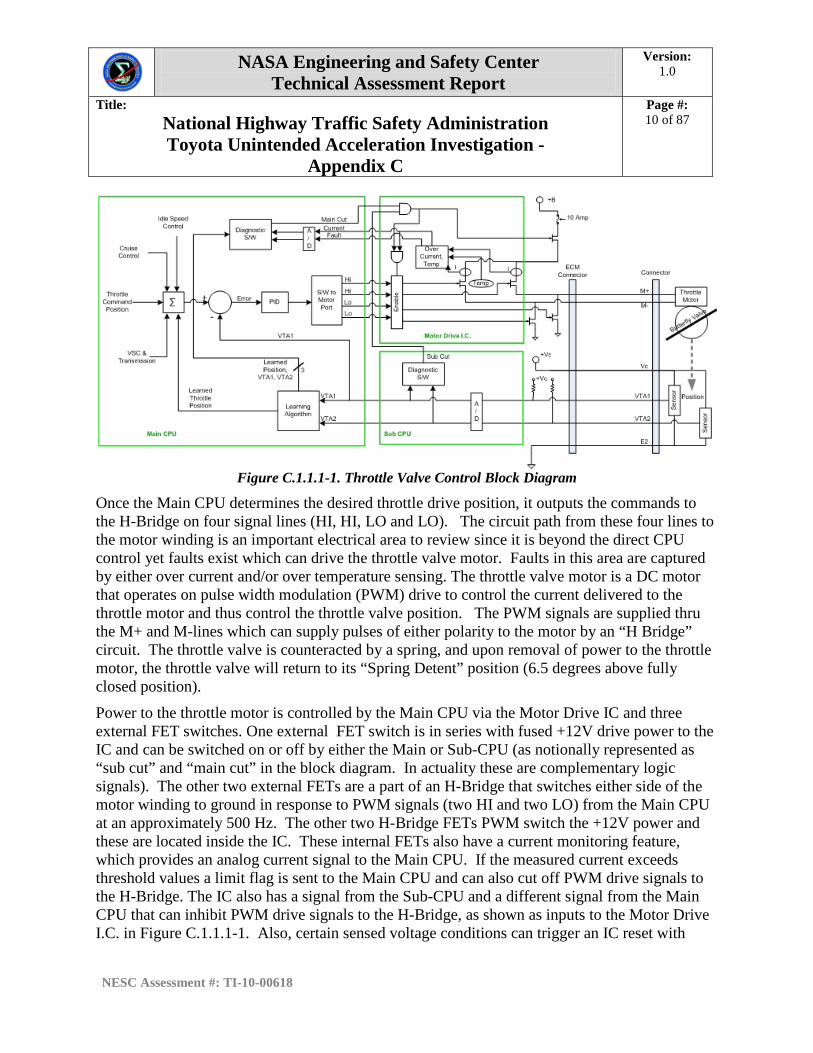
Figure C.1.1.1-1. Throttle Valve Control Block Diagram
Once the Main CPU determines the desired throttle drive position, it outputs the commands to the H-Bridge on four signal lines (HI, HI, LO and LO). The circuit path from these four lines to the motor winding is an important electrical area to review since it is beyond the direct CPU control yet faults exist which can drive the throttle valve motor. Faults in this area are captured by either over current and/or over temperature sensing. The throttle valve motor is a DC motor that operates on pulse width modulation (PWM) drive to control the current delivered to the throttle motor and thus control the throttle valve position. The PWM signals are supplied thru the M+ and M-lines which can supply pulses of either polarity to the motor by an “H Bridge” circuit. The throttle valve is counteracted by a spring, and upon removal of power to the throttle motor, the throttle valve will return to its “Spring Detent” position (6.5 degrees above fully closed position).
Power to the throttle motor is controlled by the Main CPU via the Motor Drive IC and three external FET switches. One external FET switch is in series with fused +12V drive power to the IC and can be switched on or off by either the Main or Sub-CPU (as notionally represented as “sub cut” and “main cut” in the block diagram. In actuality these are complementary logic signals). The other two external FETs are a part of an H-Bridge that switches either side of the motor winding to ground in response to PWM signals (two HI and two LO) from the Main CPU at an approximately 500 Hz. The other two H-Bridge FETs PWM switch the +12V power and these are located inside the IC. These internal FETs also have a current monitoring feature, which provides an analog current signal to the Main CPU. If the measured current exceeds threshold values a limit flag is sent to the Main CPU and can also cut off PWM drive signals to the H-Bridge. The IC also has a signal from the Sub-CPU and a different signal from the Main CPU that can inhibit PWM drive signals to the H-Bridge, as shown as inputs to the Motor Drive I.C. in Figure C.1.1.1-1. Also, certain sensed voltage conditions can trigger an IC reset with

NASA Engineering and Safety Center Technical Assessment Report
Version: 1.0
Title: National Highway Traffic Safety Administration Toyota Unintended Acceleration Investigation -
Appendix C
Page #: 11 of 87
NESC Assessment #: TI-10-00618
PWM drive signal inhibit, as well as an internal IC temperature sensor that can inhibit the PWM signals.
The throttle position sensors are used by the ETCS-i to monitor and verify the physical angle of the throttle valve. These consist of two sensors, operated in parallel, sharing the same power supply and return lines. Two basic types of throttle position sensors have been used by TMC since the inception of the ETCS-i, resistive sensors for MYs 2002 and 2003, and Hall Effect sensors for all Camry models from MY 2004 and on. The potentiometer sensor uses a mechanical contact and thus would be more prone to wear out failure modes than the non-contact Hall Effect sensor. It is important to point out that a poor electrical connection in the potentiometer contacts would lead to an open circuit which combined with the internal ECM pull up resistor would result in generation of a DTC and entry into a fail safe mode of operation. These sensors monitor the physical angle of the throttle valve via a mechanical or magnetic coupling between the sensors and the valve, for the resistive sensor or Hall Effect sensors, respectively.
To effectively understand and evaluate the range/area of valid or invalid values, the team used the software models and vehicle hardware to generate “diagnostic maps” shown in Figure C.1.1.1-2. These maps, or plots, identify the relationship between the two VTA1 and VTA2 throttle position sensor voltages, with VTA1 as the horizontal axis and VTA2 as the vertical axis. The acceptable range of throttle sensor values creates an operational “lane” on these maps where the sensor voltages can reside without generating a DTC. Other throttle sensor value relationships outside this operational lane can generate DTCs and possible fail-safe modes.

NASA Engineering and Safety Center Technical Assessment Report
Version: 1.0
Title: National Highway Traffic Safety Administration Toyota Unintended Acceleration Investigation -
Appendix C
Page #: 13 of 87
NESC Assessment #: TI-10-00618
coming from the PID control software. The duty cycle dictates the closing/opening rate which is controlled by changing the on and off times of four FETs. As previously noted, the H-Bridge drive IC is thermally protected and current limit protected and cuts off the motor drive if an over temperature or over current condition occurs.
The main function of the PID controller is to assure the throttle value is properly positioned per the desired throttle command. If the throttle valve is not in its desired position the PID receives an error signal driving the throttle motor and valve towards the desired position. If the motor does not respond and an error signal persists, the integral term of the PID controller will integrate the error resulting in more motor torque until the electronics current limit is reached setting a Stuck Open or Stuck closed DTC.
The PID controller involves three separate parameters, the proportional, the integral and derivative values, denoted P, I, and D. The proportional value determines the reaction to the current error, the integral value determines the reaction based on the sum of recent errors, and the derivative value determines the reaction based on the rate at which the error has been changing.
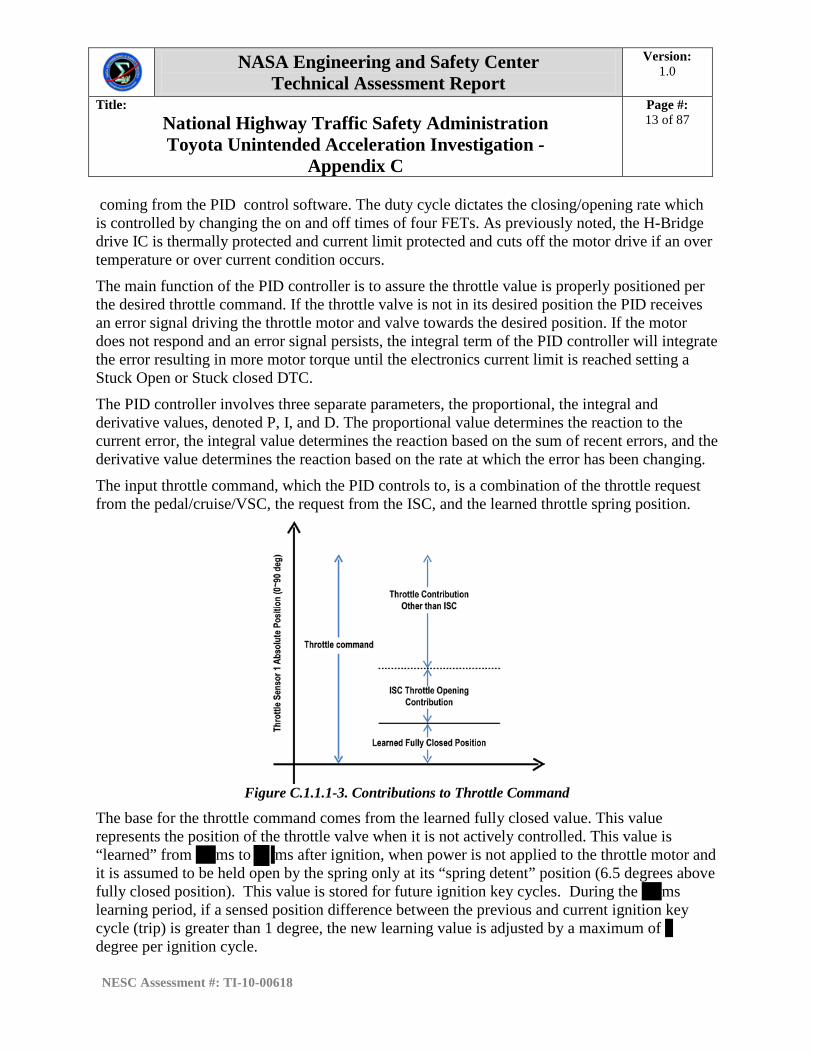
The input throttle command, which the PID controls to, is a combination of the throttle request from the pedal/cruise/VSC, the request from the ISC, and the learned throttle spring position.
Figure C.1.1.1-3. Contributions to Throttle Command
The base for the throttle command comes from the learned fully closed value. This value represents the position of the throttle valve when it is not actively controlled. This value is “learned” from ms to ms after ignition, when power is not applied to the throttle motor and it is assumed to be held open by the spring only at its “spring detent” position (6.5 degrees above fully closed position). This value is stored for future ignition key cycles. During the ms learning period, if a sensed position difference between the previous and current ignition key cycle (trip) is greater than 1 degree, the new learning value is adjusted by a maximum of degree per ignition cycle.

NASA Engineering and Safety Center Technical Assessment Report
Version: 1.0
Title: National Highway Traffic Safety Administration Toyota Unintended Acceleration Investigation -
Appendix C
Page #: 14 of 87
NESC Assessment #: TI-10-00618
The learned value is the foundation for the determination of all other throttle control, including diagnostics. The learned throttle value is used in the determination of thresholds. Note that if the throttle diagnostics determines the existence of a fault, the learning is not reset until ignition off.
C.1.1.2 Throttle Control Loop Sensitivities and Postulated Faults Figure C.1.1.2-1 shows the summary of postulated faults that might possibly produce a UA identified from the fishbone diagram analysis for the throttle control functional area. Based on the preceding understanding of the throttle control design, a fishbone diagram was generated and used to identify potential sensitive entry points into the throttle control loop. See Appendix B for the entire fishbone analysis results. In the throttle control loop two sensitivities were identified where postulated faults can produce an increase in engine speed. The fishbone identified a poor electrical connection either in the throttle position sensor and wiring, ECM circuit card, and/or ASIC hardware may combine with the learning algorithm to create the two potential faults listed below. In addition, the fishbone identified sensitivity to coupled energy which is discussed in the pedal function area.
Figure C.1.1.2-1. Summary of Postulated Faults Identified by Throttle Function Fishbone Diagram

NASA Engineering and Safety Center Technical Assessment Report
Version: 1.0
Title: National Highway Traffic Safety Administration Toyota Unintended Acceleration Investigation -
Appendix C
Page #: 15 of 87
NESC Assessment #: TI-10-00618
C.1.1.2.1 Postulated Throttle Position Sensors Supply (Vc) Increased Resistance A postulated resistance (<40Ω) increase on the throttle sensor voltage supply (Vc) wire/connectors will lower the voltage at the sensors and correspondingly the VTA signals for the position sensors. The control loop will respond by opening the throttle to compensate for the drop in voltage. This effect applies to both the Hall Effect sensors and the potentiometers. The postulated fault will result in a throttle opening of approximately 3 degrees, with no generated DTC. If large resistance is used, then the system may generate a DTC, taking appropriate action (limp home mode). A vehicle throttle Vc resistance test was performed on the MY 2005 L4 Camry by adding a serial resistance in the throttle Vc supply line. A resistance of approximately 30 to 40 ohms resulted in a throttle position increase of 3 degrees in neutral, increasing the resistance resulted in DTC P0121. However, the vehicle engine speed began to cycle consistent with the fuel cut design feature as explained in Section 6.4.
C.1.1.2.2 Postulated Throttle Position Sensors Return (E2) Increased Resistance with Learning
A postulated resistance (<25Ω) increase on the throttle sensor supply return (E2) wire/connectors will increase the sensors signal levels resulting in a lower engine speed. The learning algorithm will compensate and learn this new sensor value. If the fault is removed, the sensor voltage will drop and the control loop will compensate by opening the throttle. This effect applies to both the Hall Effect sensors and the potentiometers. By design the learning algorithm software limits the adjustment of the learned fully-closed position to degree per ignition cycle. Testing indicated a resistance up to 25 ohms in the return line will drop the engine speed as explained above; fault resistances of higher values resulted in a DTC being generated. If the fault is removed, then the engine speed will increase by approximately 200 to 500 rpm (in neutral) or degree as indicated by the software analysis.
C.1.1.3 Signal Aliasing of VPA1 and VPA2 Figure C.1.1.3-1 indicates the postulated EMI faults as identified from the fishbone analysis. Three different tests uncovered 500 Hz sensitivity; the noise injection common to both VPA signals, noise injection on VTA1 signal and the vehicle level conductive EMC testing. Spice modeling indicated the analog filter attenuation at 500Hz was -11dB, although the exact required level is not known, this level of attenuation is typically insufficient to adequately eliminate the signal for detection.

NASA Engineering and Safety Center Technical Assessment Report
Version: 1.0
Title: National Highway Traffic Safety Administration Toyota Unintended Acceleration Investigation -
Appendix C
Page #: 16 of 87
NESC Assessment #: TI-10-00618
Figure C.1.1.3-1. Summary of postulated EMI faults identified from Fishbone analysis
On a simulator, a signal was injected in both VPA signals between their return lines (EPA1 and EPA2) and the ECM common ground. The results indicated a decreasing system response as the frequency was increased. However, as the (0.4Vpp) noise source on VPA signal return was increased to a frequency of 500 Hz, a 0.2 Hz signal (beat frequency with the internal 500Hz sampling) of 0.2Vpp was observed on VTA as shown in Figure C.1.1.3-2. Note the results shown are for a simulator without air flowing through the throttle body and are intended to describe the electrical response and not intended to describe a vehicle response.

NASA Engineering and Safety Center Technical Assessment Report
Version: 1.0
Title: National Highway Traffic Safety Administration Toyota Unintended Acceleration Investigation -
Appendix C
Page #: 17 of 87
NESC Assessment #: TI-10-00618
Figure C.1.1.3-2. 500Hz injected common to both VPA signals (top Yellow trace) results in driving the
motor and roughly 0.2 Hz aliasing sensed on VTA (bottom Blue trace)
A test of injecting noise in series with the VTA1 signal resulted in a similar frequency response, although the beat or difference frequency was 2 Hz. The different beat frequency was expected since the beat frequency is the difference of the A/D convertor sampling frequency and the injected frequency.
Additionally, the vehicle-level EMC testing injected audio noise (at 2Vpp) on both VPA signals at 500 Hz resulting in a vehicle engine response of 5000 rpm. The increased engine speed was observed from 400 Hz out to the kilohertz range with a peak speed at 500 Hz. The higher frequency sensitivity suggests rectification of the injected noise and is not directly related to the 500 Hz sensitivity. The vehicle level testing indicated that the throttle increase was directly proportional to applied noise level and the influence was not a latching effect. That is, if the noise was removed the effect was removed. Recall from the earlier section that for full throttle, VPA1 must be > 3V, but cannot exceed 4.8V.
Field reports were examined for signs of noise coupling into the throttle sensors. There were two Field Technical Reports (TQCN/TOY-RQ-00074023_FTR-7QR101241 and TQCN/TOY-RQ-00074046_FTR-7QK101441A) that mention surging with a cold engine. The reports suspect a splice in the throttle sensor return wiring as the problem. The surging was eliminated by restoring the ground connection. Field report TQCN/TOY-RQ-00074514 describes a noise source coupling into the VTA signal resulting in “Surging approximately 100 rpm every 3-5 seconds”. The field report’s oscilloscope shows the VTA1 with a narrow ~2V positive pulse immediately followed by a negative 0.8V pulse in the 1 millisecond range, (no repeat rate was cited in the report). The surging was eliminated by replacing the harness. According to these field reports, noise coupling into VTA1 did not create a constant throttle command.

NASA Engineering and Safety Center Technical Assessment Report
Version: 1.0
Title: National Highway Traffic Safety Administration Toyota Unintended Acceleration Investigation -
Appendix C
Page #: 18 of 87
NESC Assessment #: TI-10-00618
When an external excitation around 500 Hz was applied to the VPA signals, an opening of throttle was observed consistent with a beat frequency with the 500Hz A/D sampling. However, no internal 500 Hz source was identified in the design or observed in EMI testing.
C.1.1.2.4 Throttle Postulated Resistive Fault Summary Testing demonstrated that both postulated resistive faults mentioned above open the throttle, but are limited to less than 5 degrees opening. The postulated high resistance in the power line is self limiting by the fact that the compensated throttle position cannot be larger than the supply voltage would allow. The time duration of an engine speed increase would be a function of the presence of the fault in the power line. As long as the power line fault was present, the increased speed would occur. The postulated fault in the return line requires learning therefore the duration will be a function of the learning. Key cycles will result in a new learned value for the throttle valve fully-closed learned value. As mentioned in Section 6.4, the fuel cut feature also can limit these postulated faults if the engine speed reaches 2500 rpm.
The circuitry between the CPU’s desired motor command output lines and the motor coils was reviewed closely for potential faults. Integrated Circuit latch-up of the FET or other devices induced by radiation single effect was considered, but discounted by the fact that the ICs are manufactured using Silicon on Insulator (SOI) latch-up immunity fabrication process. The CPU would attempt to drive the motor to the desired position resulting in either, an over current, over temperature or time-out and shut down of the throttle by the CPUs depending on which protection limit is reached first. As shown in Figure C.1.1.1-1, the Main CPU monitors the current of the two upper transistors and will disable the H-Bridge drive if over current is detected. Additionally, if a resistive short were to develop below the over current trip point, then the over temperature monitor may trip and the H-Bridge drive would be disabled. The over current monitoring is backed-up by the 10 amp fuse.
Faults in Motor Drive Circuitry:
C.1.2 Accelerator Pedal Control Functional Area C.1.2.1 Detailed Implementation Description The accelerator Pedal Functional area uses the pedal position as the main control input with the driver closing the loop. In this control loop the pedal position is read from the two pedal sensors and these position readings provide to the ETCS-i the primary driver demands for acceleration. This demanded acceleration is based upon the difference between the accelerator pedal null position at rest, and the driver’s pedal pressed position.
The two pedal sensor values are verified for acceptance against a range of values. Sensor values outside an acceptable range are detected to produce fail-safe behaviors. Both the pedal null sensor values and the range of acceptable values are dynamic. During nominal operation, the

NASA Engineering and Safety Center Technical Assessment Report
Version: 1.0
Title: National Highway Traffic Safety Administration Toyota Unintended Acceleration Investigation -
Appendix C
Page #: 19 of 87
NESC Assessment #: TI-10-00618
pedal null value is learned, and the acceptable range of values shifts to accommodate the ETCS-i operations.
When a driver’s foot is sensed as being off the accelerator pedal, the pedal returns to the released position, and the pedal sensors report this null position to the ETCS-i. The ETCS-i software contains a pedal learning algorithm that compensates for variations in this absolute sensor null position. At times when the pedal is released, during startup, nominal driving, and while in cruise control, the pedal learning can execute and determine a new null position.
The accelerator pedal system also contains software logic that expands acceptable operational ranges during operation after encountering off-nominal pedal sensor inputs or power on CPU reset. This permits the allowed values of the pedal sensors to change during vehicle operation, and alters the values that generate DTCs or determine fail-safe conditions.
The pedal functional area is shown in Figure C.1.2.1-1. For pedal position feedback, each position sensor has dedicated power and return lines. From MY 2002 to 2006, the sensors were potentiometers and in MY 2007 the sensors changed to Hall Effect sensors. For Camry, the Hall Effect sensors used are manufactured by either Denso or CTS. The two VPA signals enter the Monitor or Sub- CPU and are converted from analog to digital, and then they are passed to the Main CPU software.
Figure C.1.2.1-1. Block Diagram of Pedal Control Function
The software controls the throttle valve position by measuring the pedal command angle and comparing it to the learned pedal released value. Using the command and the learned pedal release value, pedal diagnostics are performed. When a fail-safe flag is sent from the pedal diagnostic algorithms, certain fail-safe responses are executed to limit the throttle valve opening (limp home mode). The pedal command angle, after going through the diagnostic and fail-safe processing, is converted to a throttle valve commanded angle. The throttle valve command angle from the pedal input is compared to the throttle request from the cruise control system. The

NASA Engineering and Safety Center Technical Assessment Report
Version: 1.0
Title: National Highway Traffic Safety Administration Toyota Unintended Acceleration Investigation -
Appendix C
Page #: 20 of 87
NESC Assessment #: TI-10-00618
greater value of pedal throttle command and cruise control request is then sent to the PID controller as described in the previous section.
The pedal control’s primary input comes from two pedal sensors, whose output voltages are VPA1 and VPA2. “VPA1” is used in this document instead of just “VPA” to avoid confusion when referring to the VPA signals as a group. VPA1 is used for primary control and VPA2 is used to check the validity of VPA1. VPA1 and VPA2 can range between 0V and 5V and are offset from each other by 0.8V. The nominal range is shown in Figure C.1.2.1-2.
Figure C.1.2.1-2. Range for VPA1 and VPA2
VPA1 and VPA2 sensors will provide the voltages shown in Figure C.1.2.1-2; however, the throttle position does not cover this range. The useable range refers to the pedal stroke from not pressed to fully pressed and is not a one-to-one relation to throttle position. When VPA1 is 3.0V or higher, the throttle position remains at wide open throttle, that is, it remains at 90 degrees.
The difference between pressed and released pedal positions determines the driver accelerator command. However, the sensed released pedal position is not constant. Due to differences in pedal types and to allow for recalibration during a trip, the pedal input goes through a preprocessing function that recalibrates the pedal sensor input of a released pedal to allow for input variations. The calibration process occurs any time the pedal is determined to be released. The determination of the pedal being released is based on the pedal sensor input values, software state, duration, and timing. The “learned” pedal released value is stored in static RAM (SRAM). The learning value can be reset to the default values if a fail-safe flag is sent from the pedal diagnostics. This reset implements protection against learning values as a result of inputs from faulty sensors. The learned values for pedal released ranges from degrees (absolute) for VPA1 and degrees for VPA2.When the pedal is determined to be pressed, the pedal

NASA Engineering and Safety Center Technical Assessment Report
Version: 1.0
Title: National Highway Traffic Safety Administration Toyota Unintended Acceleration Investigation -
Appendix C
Page #: 21 of 87
NESC Assessment #: TI-10-00618
sensor input is compared to the learned pedal released value and it is this difference that is used as the pedal command.
Based on individual sensor and sensor-to-sensor correlation, checks are performed to determine the validity of the sensor data entering the CPU. To effectively understand and evaluate the range/area of valid or invalid values, the team used the software models and vehicle hardware to generate “diagnostic maps” as previously described in the throttle section that identify the relationship between the two VPA1 and VPA2 pedal position sensor voltages. The acceptable range of pedal sensor values creates an operational lane on these maps. Other pedal sensor value relationships outside this operational lane can generate DTCs and possible fail-safe modes.
Expanded thresholds for acceptable pedal values can occur whenever the battery voltage has been removed and restored, during certain pedal learning failures, and when the DTC P2121 has been detected. These expanded thresholds, or DTC wide thresholds, allow a wider range of pedal voltages to be accepted as operational. Nominally, after the foot-off-pedal position has been successfully learned, the operational lane of acceptable sensor values becomes reduced in width.
The software study focused on the following:
1. Identification of conditions that could allow off-nominal pedal sensor values to be interpreted as a new valid null position. If this were to occur, when the nominal value returns it would be interpreted as a pedal command.
2. Identification of any abnormal conditions that do not produce fail-safe behaviors and do not generate DTCs.
As a result of the software study of pedal learning and these diagnostic maps, focused areas for hardware testing were selected for vehicle tests. The hardware tests of pedal control and results are presented in the following sections.
C.1.2.2 Pedal Control System Sensitivities and Postulated Faults The pedal control system was reviewed for design sensitivities which can result in an unintended increase in engine speed. The pedal function fishbone diagram, provided in Appendix B, was used to identify potential sensitive entry points into the throttle valve control loop and a summary of these faults is shown in Figure C.1.2.2-1. The fishbone identified that a poor electrical connection anywhere in either the pedal position sensor, wiring, ECM circuit card and/or ASIC hardware may create a potential fault or combine with the learning algorithm previously described to create a potential fault as listed below. In addition, the fishbone identified sensitivity to coupled energy, which is shown in Figure C.1.2.2-18.

NASA Engineering and Safety Center Technical Assessment Report
Version: 1.0
Title: National Highway Traffic Safety Administration Toyota Unintended Acceleration Investigation -
Appendix C
Page #: 22 of 87
NESC Assessment #: TI-10-00618
Figure C.1.2.2-1. Summary of postulated faults identified by Pedal Function Fishbone Diagram
C.1.2.2.1 Postulated Pedal Position Sensors Supply (Vc) Increased Resistance with Learning
An increased resistance fault of pedal voltage supply, VCP1 and VCP2 will result in a drop in VPA signals which will be compensated for by the learning algorithm. Removal of the fault then results in an increase in engine speed. This sensitivity requires postulated faults in two signals and the condition to be learned then removed which the severity is limited to 0.4V in pedal signal or 10 degrees in commanded throttle opening. The fault would be removed by the learning algorithm at the next key cycle.
This postulated failure mode requires both VPA1 and VPA2 to drop in value simultaneously. For example, for VPA1 to learn its lowest false released position just above 0.40V, VPA1 has to drop to just above 0.40V for >0.5 seconds without dropping below 0.40 and, VPA2 has to simultaneously drop below 1.4V, but cannot drop below 1.2V.
This postulated fault does require the sequence of having the fault present while the engine is started and with the pedal pressed and the software being in the mode of expanded acceptable operational range for the VPA signals. When the accelerator pedal is no longer pressed, the accelerator new learned value became its lowest possible 9.8 degrees value. If the fault is then removed, the ECM will interpret the step change as a valid pressed pedal and will increase the engine speed. The accelerator pedal system contains software logic that expands acceptable

NASA Engineering and Safety Center Technical Assessment Report
Version: 1.0
Title: National Highway Traffic Safety Administration Toyota Unintended Acceleration Investigation -
Appendix C
Page #: 23 of 87
NESC Assessment #: TI-10-00618
operational ranges during operation after encountering off-nominal pedal sensor inputs or power on CPU reset. This condition is necessary to be present for this postulated fault. The pedal learning algorithm limits a new value to 0.4V or 10 degrees of commanded throttle opening.
The NESC team demonstrated this postulated double fault by increasing the resistance of up to 1.6kohms (for maximum learned values) in both pedal sensor supply voltage (VCP1 and VCP2) signals. Lower postulated resistances in the supply lines had a lower learned value thus lesser effect in engine speed and higher resistances resulted in a DTC for the pedal signal faults. Such specific simultaneous failures affecting both VPA1 and VPA2, to such small voltage ranges (0.4 < VPA1 <0.8 and 1.2 < VPA2 <1.4) are of the same nature as the dual pedal failures described in the upper operational lane, but result in a much smaller throttle opening. Although testing verified that this postulated double fault can result in unintended throttle opening of 10 degrees or less, there were no references found in the VOQ data, field reports or warrantee data that confirms this fault is occurring in normal operation. For this fault to occur, corruption of both VCP supply voltages at the pedal would be required similar to the corruption of the VPA signals mentioned below.
C.1.2.2.2 Postulated Faults placing VPA1 and VPA2 in the operational lane Faults placing VPA1 and VPA2 within their allowable operational lane cannot be detected as a fault but rather will be interpreted as a valid pedal command and will result in increased engine speed. This sensitivity requires postulated faults in two signals which may result in a pedal command being accepted as valid, and the condition would be present as long as the fault is present.
Figure C.1.2.2-2 is a plot of VPA1 versus VPA2 and includes the DTC zones. The figure is based on measured data on the MY 2007 simulator and is similar to results obtained on a MY 2005 simulator and point checks on a vehicle.
Based on NESC testing and analysis, when the battery is reconnected, for example after maintenance, the DTC limits are set to detect VPA1 and VPA2 voltages within the DTC Wide area. Note the operational range is wider at this time. Upon starting the car, the software tests the VPA1 and VPA2 values. If these values are within the DTC Narrow area, the DTC limits are constrained to the DTC Narrow limits. The DTC Narrow limits are maintained for all subsequent ignition cycles, and VPA1 and VPA2 values outside this DTC Narrow range cause a DTC.
If VPA1 and VPA2 values are detected outside this DTC narrow range, a DTC is generated, and the DTC limits are reset to the DTC wide area. The following analysis used the normal narrow operational lane for calculations of resistance ranges for potential faults.


NASA Engineering and Safety Center Technical Assessment Report
Version: 1.0
Title: National Highway Traffic Safety Administration Toyota Unintended Acceleration Investigation -
Appendix C
Page #: 25 of 87
NESC Assessment #: TI-10-00618
DTC 2122 covers the failure mode where VPA1 is shorted to the return. DTC 2127 covers the failure mode of VPA2 shorted to ground. Note that DTC 2123 and DTC 2127 do not completely cover the lower left corner; however, escapes here are at the minimum values of VPA and will not result in any high powered unintended acceleration. There would be a different condition for an undetected fault in the gap in DTC 2128 (VPA2 shorted to +V) in the upper right hand corner of the VPA map. The DTC 2128 does not cover VPA2 faults over the entire range of VPA1; rather it only captures faults of VPA2 for VPA1 less than approximately 3.4V. Essentially there is an overlapping of the upper operational lane and the range where VPA2 pedal position sensor voltage is at the positive supply rail. Note that failures of either VPA signal to the minimum voltage (0V), maximum voltage (+V), or if the VPA signals are equal was considered a common enough failure mode to have an individual DTC. This overlapping condition allows the potential for VPA2 to fail to the +V supply and still be in the operational lane, however VPA1 is not affected by this condition.
See Figure C.1.2.2-3, the blue area represents the operational lane. Within this region the VPA signals are considered valid pedal commands and outside of it they are judged to be invalid VPA signals where a DTC will be generated. The green line represents a nominal VPA signal line where at idle VPA1 = 0.8V and VPA2 = 1.6V. The red line represents the line where VPA1 = VPA2 and note that it is outside the operational lane (but just inside the wide lane). A latent resistance fault current path between the VPA signals if it were to occur can decrease the nominal line in the downward and right direction approaching the VPA1 = VPA2 line. In order to avoid generating a DTC, such a latent resistance must not result in the VPA signals going outside the operational lane. That is, a latent resistance can move the VPA signal from the current line position to the edge of the operational lane. For a Hall Effect sensor and nominal VPA signals (green line), the minimum latent resistance is approximately 200 ohms (to stay in the operational lane if a secondary VPA2 short to +V supply occurs). However, if the VPA signals were closer to the lower operational lane limit, then the minimum latent resistance would be greater and conversely if the VPA signals were closer to the upper operational lane limit, then the minimum latent resistance would be lower.

NASA Engineering and Safety Center Technical Assessment Report
Version: 1.0
Title: National Highway Traffic Safety Administration Toyota Unintended Acceleration Investigation -
Appendix C
Page #: 26 of 87
NESC Assessment #: TI-10-00618
Figure C.1.2.2-3. The upper operational lane with the latent fault influence and wide open throttle
location.
The other key point of Figure C.1.2.2-3 is the relationship between VPA1 and the throttle position. For nominal VPA signal voltages, VPA1 greater than or equal to 3.0V corresponds to wide open throttle (WOT) or 90 degree throttle opening. For VPA1 voltages greater than 3.0V, the throttle position maintains a constant wide open throttle. This condition is true only for nominal idle voltages of VPA1 equal 0.8V and VPA2 equals 1.6V. For default learning where VPA1= 1.4V, then the wide open throttle VPA1 voltage would be 0.6V higher or VPA1 equal or greater than 3.6V.
Assuming a second anomalous resistive current path fault in the VPA signals to the 5V source Vc, Figure C.1.2.2-4 shows the chronological steps necessary for a large throttle opening event as described by the VOQ data. Starting on the left the driver is in control of the vehicle without any indication of a pending problem, then a >25 degree above idle throttle opening UA occurs due to two anomalous resistive current paths placing VPA1 and VPA2 in the upper operational lane which may last from seconds to minutes followed by the fault clearing allowing driver control again with the fault condition never occurring again in most cases and to not be detected when taken in for service in all cases. In VOQ cases analyzed, this type of UA has been reported although in the majority of incidents it was experienced only once. In no known cases (VOQ or otherwise) have the large throttle opening UA conditions been predictably under normally occurring conditions except during NESC tests. Figure C.1.2.2-4 also includes the possible

NASA Engineering and Safety Center Technical Assessment Report
Version: 1.0
Title: National Highway Traffic Safety Administration Toyota Unintended Acceleration Investigation -
Appendix C
Page #: 27 of 87
NESC Assessment #: TI-10-00618
postulated fault steps in which a UA can occur; either from a latent fault that resides in the design for a period of time then later the second fault condition occurs or also for two faults that occur simultaneously (both within 0.5 seconds time period).
Figure C.1.2.2-4. Chronological steps of a dual fault in the upper operational lane
C.1.2.2.2.1 Latent fault plus second fault The latent fault plus a secondary fault within VPA2 is of interest because it is the most plausible of the double faults postulated. Latent faults between the two VPA signals allow the two faults to occur at different times and second fault can be a short to +V supply or an open circuit return.
The latent resistance refers to resistance that can exist between the two VPA signals and go undetected by either the ECM or reading of the diagnostic data through the OBD interface. Potentiometer based sensors, due to their high impedance characteristics are likely to detect the resistances within the ranges that represent a concern. However, low impedance Hall Effect sensors may not. Figure C.1.2.2-5 indicates the location of the latent fault in relationship to the VPA signals and the relation of the latent resistance to the resistances for the dual fault to the +V supply.

NASA Engineering and Safety Center Technical Assessment Report
Version: 1.0
Title: National Highway Traffic Safety Administration Toyota Unintended Acceleration Investigation -
Appendix C
Page #: 28 of 87
NESC Assessment #: TI-10-00618
Figure C.1.2.2-5. Fault resistance locations for the postulated double fault of shorts to the +V supply
A latent fault could exist between the two VPA signals and go undetected (in Hall Effect sensors) within a limited range of resistance values and at some later time the second fault to VPA2 could occur placing the two signals in the upper operational lane. The low output impedance of the Hall Effect sensor amplifier allows the latent resistance to be present yet not impact the circuit performance. As will be shown later, the potentiometer sensor has a much higher output resistance and latent faults of the same resistance (as Hall Effect latent resistance) will result in the signals going outside the operational lane and not generate a DTC for most, but not all conditions.
Previous studies on the Hall Effect sensor pedal have shown that 200 ohm latent faults between VPA1 and VPA2 can exist and go undetected by not generating a DTC. However, the potentiometer sensor pedals with similar latent faults respond in a completely different manner. Differences in the respective output impedances of the Hall Effect sensors (ohms range) and the potentiometer sensors (kilo-ohms range), with common latent and secondary resistive short faults, will yield different responses depending on sensor type (potentiometer or Hall Effect) design.
The Hall Effect sensor pedal utilizes a low impedance amplifier driven output thus allowing resistive faults to be developed between the two VPA signals without generating a DTC. See Figure C.1.2.2-6 for the Hall Effect pedal normal functionality in the operational lane with latent resistive shorts and the resultant point if a second fault of a short to the positive voltage supply rail were to occur. To fit the chronological order, the second fault must clear itself after the UA. Therefore, a latent fault between VPA signals can be postulated for the Hall Effect sensor pedal.
The potentiometer sensor pedal has a significantly different response. The same fault condition for a Hall Effect type sensor applied to this pedal type would result in a DTC. The potentiometer


NASA Engineering and Safety Center Technical Assessment Report
Version: 1.0
Title: National Highway Traffic Safety Administration Toyota Unintended Acceleration Investigation -
Appendix C
Page #: 31 of 87
NESC Assessment #: TI-10-00618
Figure C.1.2.2-8. For Hall Effect type pedals, Resistance range required for latent fault between VPA
signals and second fault of VPA2 resistive shorted to +V
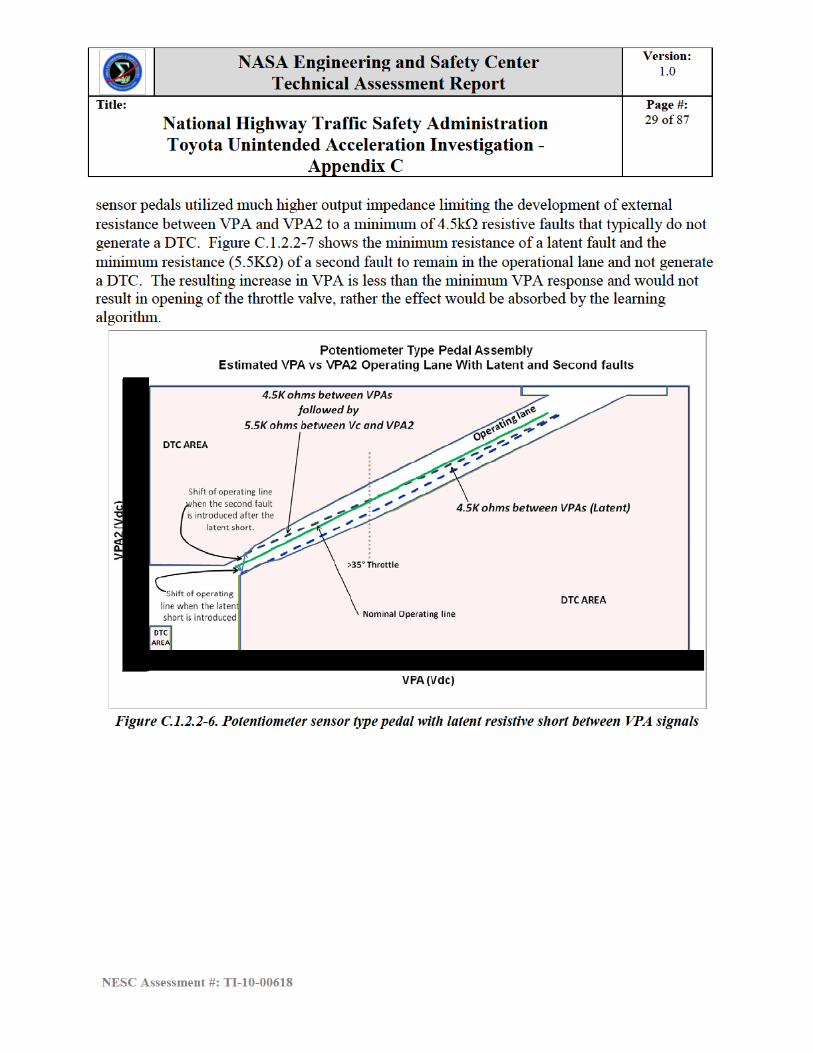
The other failure mode identified is a latent fault between the VPA signals with the second fault being a resistive open circuit on the VPA2 return line. Figure C.1.2.2-9 shows the effect of a latent fault with the second fault being an open circuit. The figure also includes the full pedal stroke. As mentioned earlier, latent resistance between VPA signals the CTS pedal must be greater than 170Ω to prevent generating a DTC during normal operations. The point of added CTS plot traces for 130 Ω to 160 Ω was to show how the resistances influence the VPA signals in the lane; it was not to imply these resistance ranges would go undetected, rather they would generate a DTC under normal operations. For the CTS plot in Figure C.1.2.2-9, the open circuit is a true open circuit; however, testing indicated that series resistance of approximately 8kΩ or greater is an equivalent open circuit. For the CTS pedal, the open circuit condition places the VPA signals near the 35 degree point of the operational lane and does not reach the full throttle position.
Note that the 170Ω case is the limit to stay inside the lane during normal vehicle operations and with the open circuit VPA2 return, it falls just outside the 35 degree point of the operational lane. For the CTS pedal tested, there wasn’t a resistance range, but rather a single resistance of approximately 170Ω which placed the VPA signals in the upper operational lane with the VPA2 return line open circuit of 8kΩ or greater (and not set a DTC). Since the fault was at the edge of
NASA Engineering and Safety Center Technical Assessment Report
Version: 1.0
Title: National Highway Traffic Safety Administration Toyota Unintended Acceleration Investigation -
Appendix C
Page #: 32 of 87
NESC Assessment #: TI-10-00618
the operational lane, due to nature variances other CTS pedals may have a narrow resistance range allowing this fault to occur and not generate a DTC.
Similarly, latent resistance between VPA signals the Denso pedal must be greater than 130Ω to prevent generating a DTC during normal operations. For the Denso pedal, the open circuit condition places the VPA signals midway between the 35-degree point and the WOT point of the operational lane. For the Denso plot in Figure C.1.2.2-9, the open circuit is a true open circuit; however, testing indicated that series resistance of approximately 800Ω or greater is essentially equivalent to an open circuit. Latent resistance of 150Ω and 160Ω placed the VPA signals on the edge of the operational lane, but as soon as the pedal was pressed a DTC was generated.
For the latent fault plus open circuit of VPA2 return postulated failure mode in the Denso pedal, the latent resistance must be greater than 130Ω but less than 160Ω and VPA2 return open circuit by greater than 800Ω. Of all the postulated failure modes, this one has the smallest resistance range and does not reach the WOT range in the operational lane. Note that there is a small portion of the lower-left corner of the operational lane where faults can occur by larger latent resistances with concurrent VPA2 open circuit return of less than 800Ω. However, since this resistance range was so restrictive and it was not at the full throttle area, it not mapped in detail.


NASA Engineering and Safety Center Technical Assessment Report
Version: 1.0
Title: National Highway Traffic Safety Administration Toyota Unintended Acceleration Investigation -
Appendix C
Page #: 34 of 87
NESC Assessment #: TI-10-00618
NOTE: On the CTS plot, traces for the 130Ω to 160Ω was to show how the resistances influence the VPA signals in the lane, it was not to imply these resistance ranges would go undetected. In summary for the latent faults, these faults do not have the timing requirement to be simultaneous; however, their resistance range is far more restrictive than the other double fault failure modes. A DTC is not set for latent faults in the specified range when applied to Hall Effect sensor type pedals which represent only 36 percent of >35 degree unintended throttle opening UA VOQs. Latent faults in the specified range applied to a potentiometer sensor type, will set a DTC (and limp home mode) but it can be cleared by a key cycle and as long as the driver only slowly presses the accelerator pedal (transition through the default position greater than 0.5 seconds), the DTC (and limp home mode) will not be entered. For all pedal types with the latent fault in place and undetected, a second fault is still required to place the VPA signals in the upper operational lane.
C.1.2.2.2.2 Simultaneous Faults A fault to place the VPA signals within the operational lane can be postulated with either pedal type, however, it requires two simultaneous (within < 0.5 second time period, so as not to set a DTC) resistive faults that must remove themselves (within the same 0.5 second period) after the UA event. The simultaneous condition is necessary because either fault occurring alone will result in generating a DTC. There are four postulated fault conditions that can place the VPA signals in the upper operational lane, either two simultaneous resistive shorts to the +V supply or two simultaneous resistive open circuits of the supply return or a combination of each fault condition, (one resistive short of a VPA signal to the +V supply and one resistive open circuit on the other VPA signal).
The term “resistive short” is used to signify the resistive condition of a partial or non-zero ohm short circuit. The resistive short for VPA1 must be different than the resistive short of VPA2 since in order to avoid generating a DTC, the difference between the VPA signals must be V +/- V. This is true regardless of any postulated faults. Additionally, VPA1 cannot short directly to the +V supply voltage; rather it must be less than V and therefore will always have an upper and lower resistance limit. This is not true for VPA2 which can fail to the +V supply voltage. a) Simultaneous Resistive Short Faults to +V supply For simultaneous resistive short faults to the +V supply, both the Hall Effect sensor and potentiometer sensor remain functional, therefore the effect of pressing the accelerator pedal must be considered. Figure C.1.2.2-10 shows the potentiometer sensor type pedal with two different cases of both VPA signals resistively shorting to +V supply. The blue lines indicate the pedal response as the pedal is pressed from the pedal’s idle position to a full stroke. During this


NASA Engineering and Safety Center Technical Assessment Report
Version: 1.0
Title: National Highway Traffic Safety Administration Toyota Unintended Acceleration Investigation -
Appendix C
Page #: 37 of 87
NESC Assessment #: TI-10-00618
34Ω. Of all the postulated simultaneous double faults, this is the only set of conditions that has a resistance range common to all three pedal types.
Figure C.1.2.2-12. Resistance range required for simultaneous resistive open circuit in the VPA return
line for all three pedal types. [Note: common area highlighted]

NASA Engineering and Safety Center Technical Assessment Report
Version: 1.0
Title: National Highway Traffic Safety Administration Toyota Unintended Acceleration Investigation -
Appendix C
Page #: 39 of 87
NESC Assessment #: TI-10-00618
Figure C.1.2.2-14. Hall Effect Pedals response to Resistive Open Circuits in return [Note the CTS
pedal converges to 5.0V at approximately 8kohms]
NASA Engineering and Safety Center Technical Assessment Report
Version: 1.0
Title: National Highway Traffic Safety Administration Toyota Unintended Acceleration Investigation -
Appendix C
Page #: 40 of 87
NESC Assessment #: TI-10-00618
Before relating these Hall Effect sensor responses to the operational lane, a design characteristic of the Denso pedal will be explored. This design characteristic is unique to the Denso Hall Effect sensor pedals where the signal outputs are affected by the reduction of the sensor +V supply voltage, which can be demonstrated by introducing resistance in the supply lines.
Figure C.1.2.2-15. Denso Hall Effect sensor output as a function of the lower supply voltage

NASA Engineering and Safety Center Technical Assessment Report
Version: 1.0
Title: National Highway Traffic Safety Administration Toyota Unintended Acceleration Investigation -
Appendix C
Page #: 41 of 87
NESC Assessment #: TI-10-00618
As shown in Figure C.1.2.2-15, the Hall Effect sensors exhibit different responses when the voltage supply is decreased. To the right of the figure, the pedal voltage at the pedal’s idle position and full stroke position can be seen. For the CTS pedal, as the supply voltages drop the output voltages also drop concurrently until roughly 3.2V, then the pedal becomes non-function and the outputs drop to a few tenths of a volts. For the Denso pedal, as the supply voltages drop the output voltages drop concurrently, however, at approximately 3V range sensor output then jumps to the supply voltage and follows the supply voltage linearly to zero. If the VPA signals converge as shown (within < V) then a DTC is set however, depending on the fault conditions, there are voltage combinations which may put the VPA signals in the operational lane and not set a DTC. For these conditions, the Denso pedal would be subject to simultaneous dual resistive open circuit in the +V supply faults similar to the other postulated faults; however, the peak VPA signal voltage is roughly 2.7V. If VPA2 was at the maximum 2.7V, then to stay in the operational lane (Difference of + ) then VPA1 can be no more than or just inside the upper operational lane. This fault is similar to the postulated simultaneous resistive faults conditions in the return, but the maximum throttle opening is significantly less. Since the consequence is significantly less (just inside the upper operational lane) determining the exact resistance ranges was not explored for this unique case.
Figure C.1.2.2-16 shows the two Hall Effect sensor pedals with two examples of resistance faults, with the full pedal stoke and relationship to the operational lane described. Note that the non-linearity of the outputs translated into cases where the VPA signals went outside the lane when the pedal was pressed for a significant portion of the pedal stroke. For the Denso pedal at the >35 degrees (absolute) throttle location, VPA2 was no longer functional, but VPA1 was still functional resulting in the pedal being outside the operational lane for the majority of the pedal stroke. The pedal outputs are non-responsive near the full throttle location resulting in the single operating point. For the CTS pedal at the >35 degree (absolute) throttle location, the pedal is fully functional and does not go outside the lane and at the full throttle location VPA2 is non-functional, but VPA1 is functional resulting in the pedal being outside the operational lane for over half of the pedal stroke. Therefore, if this postulated fault were to occur, then DTCs would be expected by the driver not removing their foot from the pedal within a 0.5 of the fault occurrence.


NASA Engineering and Safety Center Technical Assessment Report
Version: 1.0
Title: National Highway Traffic Safety Administration Toyota Unintended Acceleration Investigation -
Appendix C
Page #: 43 of 87
NESC Assessment #: TI-10-00618
other restrictions previously described would need to be uniquely tailored for each pedal type rather than common across all pedal types to avoid generating DTCs.
Figure C.1.2.2-17. Resistance range required for simultaneous resistive faults between the VPA signals
and the +V supply for all three pedal types
C.1.2.2.2.3 Summary of Dual faults placing the VPA signals in the operational lane: Dual faults can be engineered to place the VPA signals in the upper operational lane which would appear as a valid pedal command resulting in a UA. Table C.1.2.2-1 summarizes the double faults placing the VPA signals in the operational lane.

NASA Engineering and Safety Center Technical Assessment Report
Version: 1.0
Title: National Highway Traffic Safety Administration Toyota Unintended Acceleration Investigation -
Appendix C
Page #: 44 of 87
NESC Assessment #: TI-10-00618
Table C.1.2.2-1. Summary of Dual Fault Conditions
Postulated Faults
Resistance Range with no DTC and is it common?**
"Allowable or Possible" Circuit Configurations & Required Sequence With BOTH faults present, can a
DTC be generated by pressing the pedal?
CTS Hall Effect
Denso Hall Effect Potentiometer Hall Effect Potentiometer CTS
Hall Effect
Denso Hall
Effect Potentiometer
Simultaneous double resistive short of
VPA signals to +V
See Figure C.1.2.2-12. Yes, there is a common resistance range for all three
2 occurrences of "2 of 21" circuit configurations***
within 0.5 sec
2 occurrences of "2 of 21" circuit configurations
within 0.5 sec NO NO YES
Simultaneous double resistive open of
VPA signal returns
See Figure C.1.2.2-17 Yes. small overlapping resistance
range between CTS and Potentiometer
NO 2 occurrences of "2 of 21"
circuit configurations within 0 5 sec
2 occurrences of "2 of 21" circuit configurations
within 0.5 sec YES YES NO
Latent resistance between VPA signals plus resistive short of
VPA2 to +V
See Figure C.1 2 2-8 Yes. Small overlapping resistance
range
Does not apply
1st fault "1 of 21" circuit configuration followed by 2nd
fault "2 of 21" circuit configurations
Does not apply YES YES YES
Latent resistance between VPA signals plus resistive open of
VPA2 return
~170Ω latent plus
VPA2 >800Ω
130Ω < R-latent < 160Ω
Plus VPA2 open > 8000Ω
Does not apply
1st fault "1 of 21" circuit configuration followed by 2nd
fault "2 of 20" circuit configurations
Does not apply YES NO YES
**This Table does not include fault scenarios outside the operational lane but inside the wider learning lane where DTCs are reset either through the OBDII connector or by disconnecting the battery. ***See item 2 below for description of the 21 possible circuit configurations.
NASA Engineering and Safety Center Technical Assessment Report
Version: 1.0
Title: National Highway Traffic Safety Administration Toyota Unintended Acceleration Investigation -
Appendix C
Page #: 45 of 87
NESC Assessment #: TI-10-00618
The postulated faults require all four conditions to be met:
1. The two resistive faults fall in the necessary resistance range The upper operational lane (above 35 degrees throttle opening) represents roughly 7 percent of all possible combination of VPA signals, accounting for the lower lane of roughly equal size. This leaves 86 percent of the possible combinations of VPA signals which would generate a DTC. Tin whiskers, natural contamination or corrosion-induced faults tend to have a distribution of resistance and it would be expected to have more cases where the VPA signals occurred in the larger DTC area (86 percent). The simultaneous double resistive short of VPA signals to +V supply was the only postulated failure mode that had a common resistance range for all three pedal types.
2. The two faults build the necessary circuit configuration There are 6 signals of interest in the pedal subsystem: 2 power lines, 2 VPA signals and 2 returns. Assuming a simple single fault, there are 6 possible open circuit configurations plus 15 possible “one to one” shorting combinations. Therefore there are a total of 21 possible circuit configurations in the pedal signals for a simple single fault. For the majority of the postulated faults, there are only 2 allowable circuit configurations of the 21 possible circuit configurations which must occur twice
3. The two faults met the necessary sequence and time constraints
to place the VPA signal in the upper operational lane. A DTC would be generated if either one of the faults create one of the other possible circuits.
The latent fault was of interest because it allowed the first fault to reach the necessary resistance. The latent fault between VPA signals can decrease in resistance; however the resistance must decrease to at least 200Ω, but cannot decrease below 130Ω for the Denso pedal or 170Ω for the CTS pedal. For a UA condition, the latent fault may decreases in resistance over time, while in the precise resistance range, and then the second VPA2 fault must occur. The second fault occurring first or prior to the latent fault reaching the necessary narrow range will result in generating a DTC. These type latent faults are only applicable to vehicles using the Hall Effect sensors, which make up approximately 36 percent of the Camry VOQs studied. The remainder of the VOQs involved vehicle with potentiometer type sensors that are not vulnerable to this failure mechanism.
The simultaneous double faults required the resistance faults to occur within 500 ms. A single fault or a double fault greater than 500 ms apart will generate a DTC.
It was not possible to determine which condition would be more or less probable between a double fault within 500 ms or a decreasing resistance reaching the precise range, then always followed by a second fault.
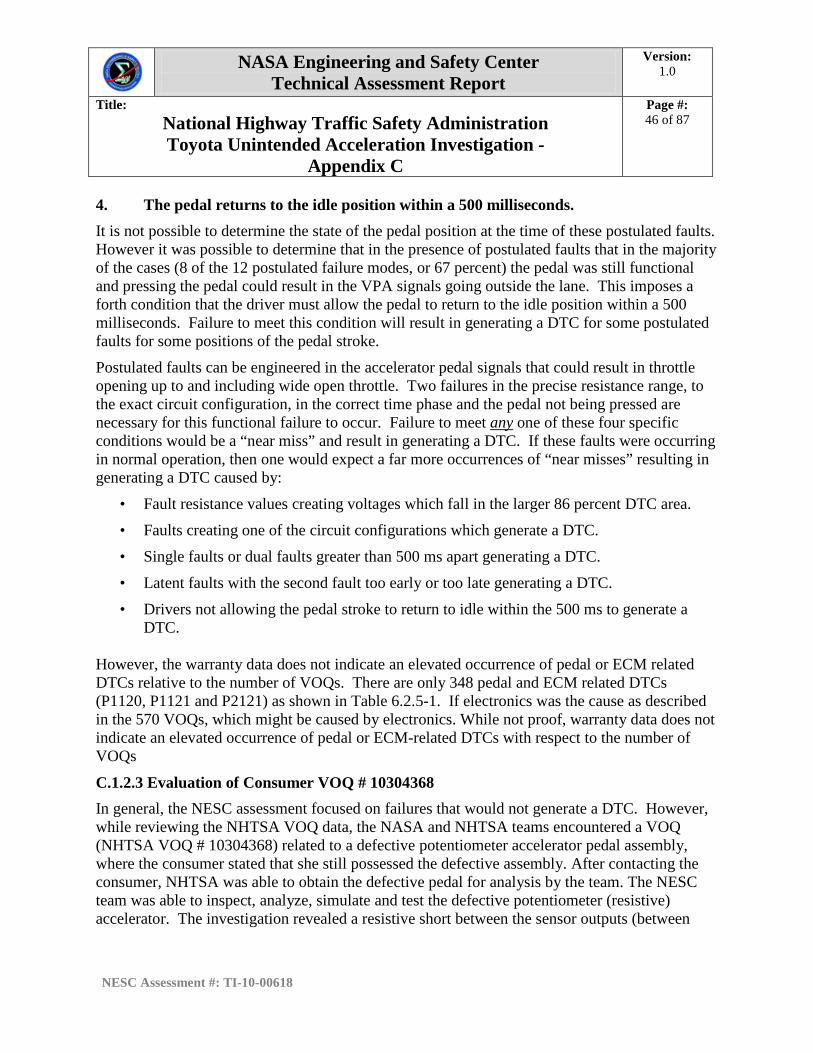
NASA Engineering and Safety Center Technical Assessment Report
Version: 1.0
Title: National Highway Traffic Safety Administration Toyota Unintended Acceleration Investigation -
Appendix C
Page #: 46 of 87
NESC Assessment #: TI-10-00618
4. The pedal returns to the idle position within a 500 milliseconds. It is not possible to determine the state of the pedal position at the time of these postulated faults. However it was possible to determine that in the presence of postulated faults that in the majority of the cases (8 of the 12 postulated failure modes, or 67 percent) the pedal was still functional and pressing the pedal could result in the VPA signals going outside the lane. This imposes a forth condition that the driver must allow the pedal to return to the idle position within a 500 milliseconds. Failure to meet this condition will result in generating a DTC for some postulated faults for some positions of the pedal stroke.
Postulated faults can be engineered in the accelerator pedal signals that could result in throttle opening up to and including wide open throttle. Two failures in the precise resistance range, to the exact circuit configuration, in the correct time phase and the pedal not being pressed are necessary for this functional failure to occur. Failure to meet any
• Fault resistance values creating voltages which fall in the larger 86 percent DTC area.
one of these four specific conditions would be a “near miss” and result in generating a DTC. If these faults were occurring in normal operation, then one would expect a far more occurrences of “near misses” resulting in generating a DTC caused by:
• Faults creating one of the circuit configurations which generate a DTC.
• Single faults or dual faults greater than 500 ms apart generating a DTC.
• Latent faults with the second fault too early or too late generating a DTC.
• Drivers not allowing the pedal stroke to return to idle within the 500 ms to generate a DTC.
However, the warranty data does not indicate an elevated occurrence of pedal or ECM related DTCs relative to the number of VOQs. There are only 348 pedal and ECM related DTCs (P1120, P1121 and P2121) as shown in Table 6.2.5-1. If electronics was the cause as described in the 570 VOQs, which might be caused by electronics. While not proof, warranty data does not indicate an elevated occurrence of pedal or ECM-related DTCs with respect to the number of VOQs
C.1.2.3 Evaluation of Consumer VOQ # 10304368 In general, the NESC assessment focused on failures that would not generate a DTC. However, while reviewing the NHTSA VOQ data, the NASA and NHTSA teams encountered a VOQ (NHTSA VOQ # 10304368) related to a defective potentiometer accelerator pedal assembly, where the consumer stated that she still possessed the defective assembly. After contacting the consumer, NHTSA was able to obtain the defective pedal for analysis by the team. The NESC team was able to inspect, analyze, simulate and test the defective potentiometer (resistive) accelerator. The investigation revealed a resistive short between the sensor outputs (between

NASA Engineering and Safety Center Technical Assessment Report
Version: 1.0
Title: National Highway Traffic Safety Administration Toyota Unintended Acceleration Investigation -
Appendix C
Page #: 47 of 87
NESC Assessment #: TI-10-00618
VPA1 and VPA2) as well as an (not as described by the manufacturer) ETCS-i response under some system conditions. Further investigation of the APA revealed the cause of the pedal resistive short as a tin whisker. This section describes the team’s activities associated with this particular defective accelerator pedal.
External visual, mechanical and electrical inspection of the defective accelerator pedal assembly:
a. Visual inspection of the pedal assembly showed normal wear (dirt on pedal surface) but no visual damage to the unit. The connector interface was relatively clean with no visual debris.
b. Mechanical operation was verified and found to be normal. No electromechanical intermittence was observed (see system electrical test).
c. The electrical characteristics of the defective pedal revealed a 248 ohm revealing a resistive short between the VPA1 and VPA2 sensor outputs, compromising the isolation between both sensors. Table C.1.2.2-2 shows the resistance values obtained during the electrical tests of the defective pedal and two other “good working pedals”. Figure C.1.2.2-20 describes the electrical configuration of the pedal with the suspected fault. All potentiometer resistances were found to be within nominal ranges, with the exception of the output isolation between each sensor as previously stated. The initial value of the isolation resistance was found to be approximately 3.5 Megohms, but while handling the unit, the resistance began to decrease, first to about 5Kohms and finally stabilizing between 250 and 238 ohms. This resistance was observed through the entire travel of the pedal (from idle to fully pressed). Also RVPA1 and RVPA2 were found to be essentially constant through the pedal stroke due to a layer of metal by design under each inner resistive half-ring which does not exist for the outer resistive half-rings.

NASA Engineering and Safety Center Technical Assessment Report
Version: 1.0
Title: National Highway Traffic Safety Administration Toyota Unintended Acceleration Investigation -
Appendix C
Page #: 48 of 87
NESC Assessment #: TI-10-00618
Figure C.1.2.2-20 is the configuration of the potentiometer accelerator pedal assembly.
Figure C.1.2.2-20. One of two rotating contact assemblies (left), resistive elements (center), and
electrical diagram (right) for the potentiometer pedal sensors showing defective accelerator pedal assembly fault region
Table C.1.2.2-2. Potentiometer Accelerator Pedal Assembly Resistances
Testing with the defective pedal on both the V6 MY 2006 and L4 MY 2005 ETC Simulators showed different responses depending on when the failure was introduced, and the number of ignition and drive cycles.
The event sequence diagram below illustrates the various responses to different operational sequences.
The first path of the event sequence diagram introduces when the resistive short while driving, a DTC is declared along with a MIL, and fail-safe limp home mode is active including throttle brake override capability irrespective of the accelerator pedal position.
The second path shows after an ignition key cycle the DTC and MIL remain. However, the vehicle responds differently depending on how the accelerator is pressed. When the accelerator is pushed slowly, the vehicle has a jumpy response, and is capable of full throttle without throttle
VPA Sensorn = 1
VPA2 Sensorn = 2
VPA Sensorn = 1
VPA2 Sensorn = 2
VPA Sensorn = 1
VPA2 Sensorn = 2
Ro"n" + Rx"n" 3480 3363 4130 4265 3389 3292Ro"n" + RVPA"n" 3080 2458 3663 3109 2965 2403Rx"n" + RVPA"n" 686 1149 777 1447 632 1091
RshuntRo"n" 2937 2336 3508 2963.5 2861 2302
RVPA"n" 143 122 155 145.5 104 101Rx"n" 543 1027 622 1301.5 528 990
APA = Accelerator Pedal Assembly
L4 MY2005 Simulator APA
248 Open Circuit Open CircuitCalculated
Resistances(Ohms)
MeasuredResistances
(Ohms)
Complaint Pedal Assembly V6 MY2006Simulator APA

NASA Engineering and Safety Center Technical Assessment Report
Version: 1.0
Title: National Highway Traffic Safety Administration Toyota Unintended Acceleration Investigation -
Appendix C
Page #: 49 of 87
NESC Assessment #: TI-10-00618
brake override. When the accelerator pedal is pushed quickly, the fail-safe limp home mode is active including brake override.
After the third ignition / drive cycle the MIL turns off, the DTC remains stored with throttle response depending on pedal application as described above.
After the battery is disconnected and then reconnected or the DTCs are otherwise cleared, the DTC and MIL does not return with throttle response depending on pedal application as described above.
As shown on the 5th path, if the resistive short occurs while the vehicle is off, starting the vehicle with the accelerator pedal partially depressed will not set a DTC. The accelerator responds as described above.

NASA Engineering and Safety Center Technical Assessment Report
Version: 1.0
Title: National Highway Traffic Safety Administration Toyota Unintended Acceleration Investigation -
Appendix C
Page #: 50 of 87
NESC Assessment #: TI-10-00618
Figure C.1.2.2-21. Pedal Resistive Fault Event Sequence Diagram


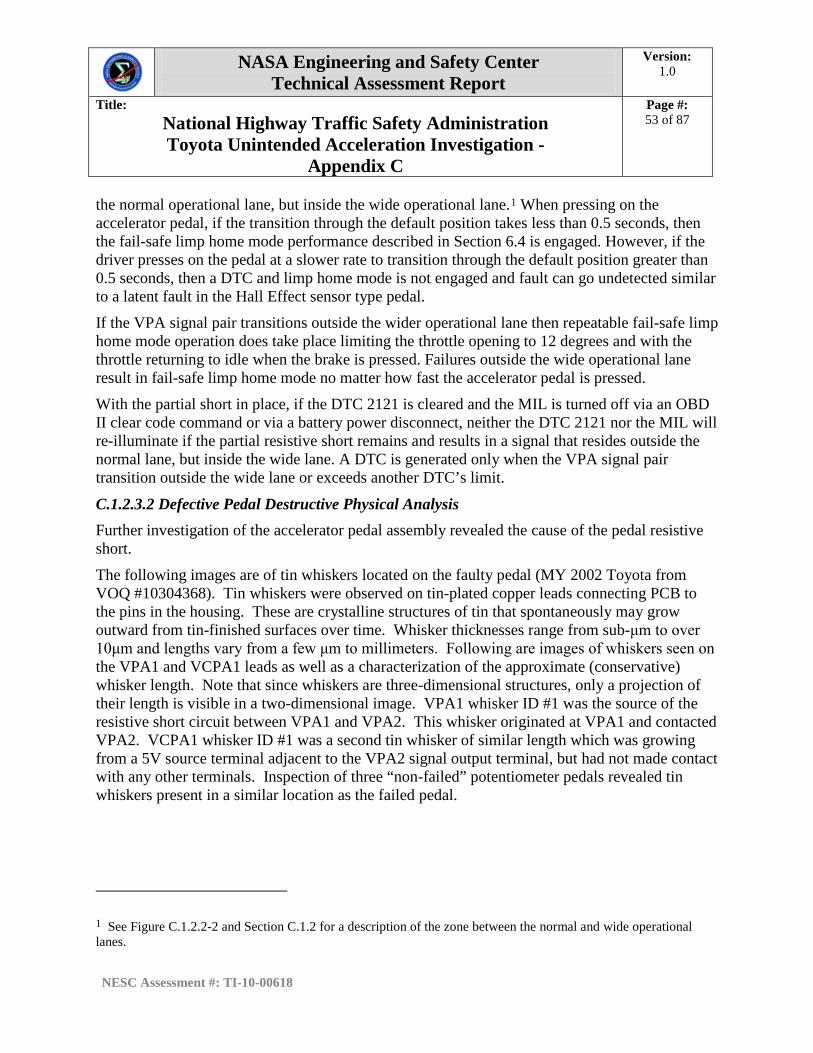
NASA Engineering and Safety Center Technical Assessment Report
Version: 1.0
Title: National Highway Traffic Safety Administration Toyota Unintended Acceleration Investigation -
Appendix C
Page #: 53 of 87
NESC Assessment #: TI-10-00618
the normal operational lane, but inside the wide operational lane.1
If the VPA signal pair transitions outside the wider operational lane then repeatable fail-safe limp home mode operation does take place limiting the throttle opening to 12 degrees and with the throttle returning to idle when the brake is pressed. Failures outside the wide operational lane result in fail-safe limp home mode no matter how fast the accelerator pedal is pressed.
When pressing on the accelerator pedal, if the transition through the default position takes less than 0.5 seconds, then the fail-safe limp home mode performance described in Section 6.4 is engaged. However, if the driver presses on the pedal at a slower rate to transition through the default position greater than 0.5 seconds, then a DTC and limp home mode is not engaged and fault can go undetected similar to a latent fault in the Hall Effect sensor type pedal.
With the partial short in place, if the DTC 2121 is cleared and the MIL is turned off via an OBD II clear code command or via a battery power disconnect, neither the DTC 2121 nor the MIL will re-illuminate if the partial resistive short remains and results in a signal that resides outside the normal lane, but inside the wide lane. A DTC is generated only when the VPA signal pair transition outside the wide lane or exceeds another DTC’s limit.
C.1.2.3.2 Defective Pedal Destructive Physical Analysis Further investigation of the accelerator pedal assembly revealed the cause of the pedal resistive short.
The following images are of tin whiskers located on the faulty pedal (MY 2002 Toyota from VOQ #10304368). Tin whiskers were observed on tin-plated copper leads connecting PCB to the pins in the housing. These are crystalline structures of tin that spontaneously may grow outward from tin-finished surfaces over time. Whisker thicknesses range from sub-μm to over 10μm and lengths vary from a few μm to millimeters. Following are images of whiskers seen on the VPA1 and VCPA1 leads as well as a characterization of the approximate (conservative) whisker length. Note that since whiskers are three-dimensional structures, only a projection of their length is visible in a two-dimensional image. VPA1 whisker ID #1 was the source of the resistive short circuit between VPA1 and VPA2. This whisker originated at VPA1 and contacted VPA2. VCPA1 whisker ID #1 was a second tin whisker of similar length which was growing from a 5V source terminal adjacent to the VPA2 signal output terminal, but had not made contact with any other terminals. Inspection of three “non-failed” potentiometer pedals revealed tin whiskers present in a similar location as the failed pedal.
1 See Figure C.1.2.2-2 and Section C.1.2 for a description of the zone between the normal and wide operational lanes.

NASA Engineering and Safety Center Technical Assessment Report
Version: 1.0
Title: National Highway Traffic Safety Administration Toyota Unintended Acceleration Investigation -
Appendix C
Page #: 54 of 87
NESC Assessment #: TI-10-00618
Figure C.1.2.2-24. Disassembled Accelerator Pedal Assembly Potentiometer

NASA Engineering and Safety Center Technical Assessment Report
Version: 1.0
Title: National Highway Traffic Safety Administration Toyota Unintended Acceleration Investigation -
Appendix C
Page #: 55 of 87
NESC Assessment #: TI-10-00618
Table C.1.2.2-3. Tin whiskers observed on the tin-plated copper leads soldered to the PCB
Lead Name Whisker ID # Whisker Length Greater than (um)
EP1 1 700
EP1 2 100
EP1 3 100
VCPA1 1 1500
VCPA1 2 500
VCPA1 3 350
VCPA1 4 200
VPA2 1 300
VPA2 2 300
VPA2 3 75
VPA1 1 1900
VPA1 2 350
VPA1 3 75
EP2 1 130
VCPA2 1 200
VCPA2 2 500
VCPA2 3 500
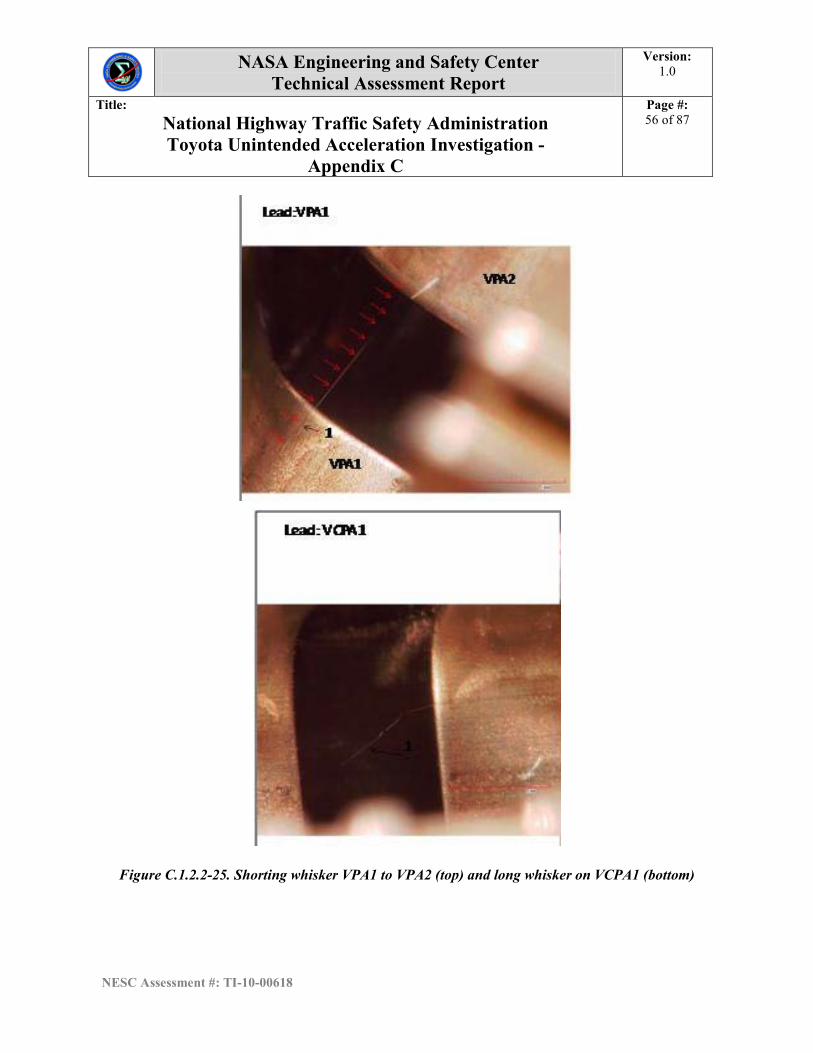
NASA Engineering and Safety Center Technical Assessment Report
Version: 1.0
Title: National Highway Traffic Safety Administration Toyota Unintended Acceleration Investigation -
Appendix C
Page #: 56 of 87
NESC Assessment #: TI-10-00618
Figure C.1.2.2-25. Shorting whisker VPA1 to VPA2 (top) and long whisker on VCPA1 (bottom)
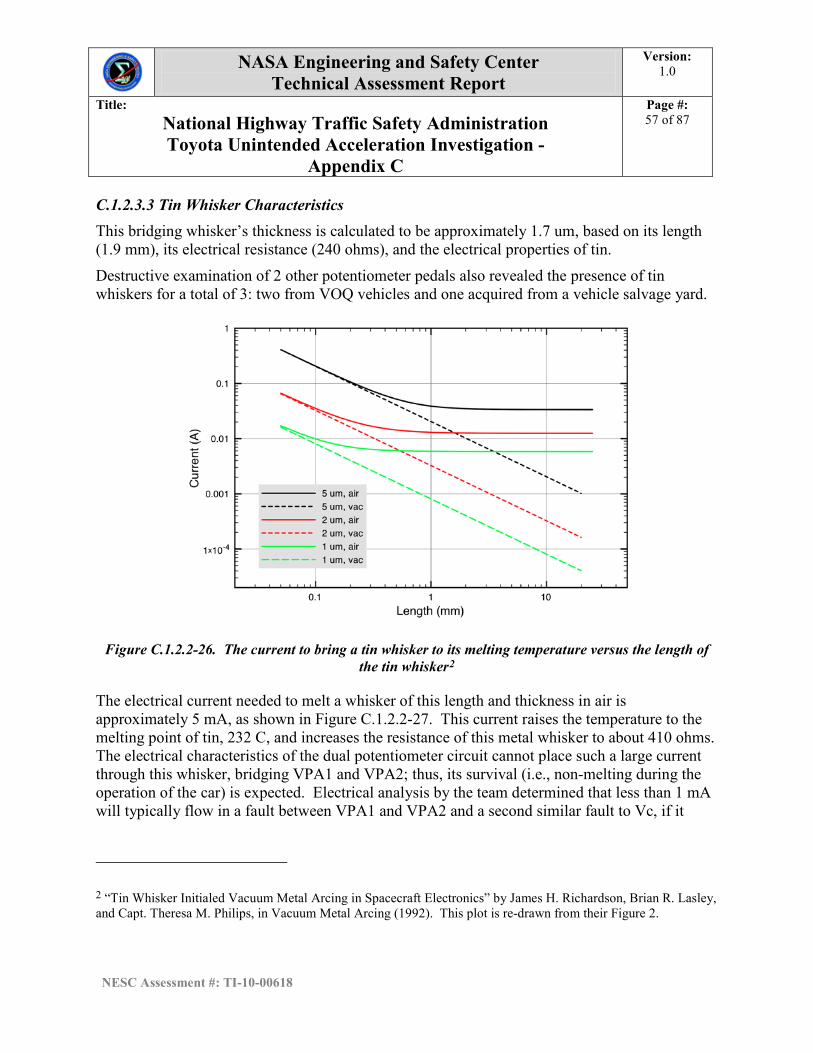
NASA Engineering and Safety Center Technical Assessment Report
Version: 1.0
Title: National Highway Traffic Safety Administration Toyota Unintended Acceleration Investigation -
Appendix C
Page #: 57 of 87
NESC Assessment #: TI-10-00618
C.1.2.3.3 Tin Whisker Characteristics This bridging whisker’s thickness is calculated to be approximately 1.7 um, based on its length (1.9 mm), its electrical resistance (240 ohms), and the electrical properties of tin.
Destructive examination of 2 other potentiometer pedals also revealed the presence of tin whiskers for a total of 3: two from VOQ vehicles and one acquired from a vehicle salvage yard.
Figure C.1.2.2-26. The current to bring a tin whisker to its melting temperature versus the length of
the tin whisker2
The electrical current needed to melt a whisker of this length and thickness in air is approximately 5 mA, as shown in Figure C.1.2.2-27. This current raises the temperature to the melting point of tin, 232 C, and increases the resistance of this metal whisker to about 410 ohms. The electrical characteristics of the dual potentiometer circuit cannot place such a large current through this whisker, bridging VPA1 and VPA2; thus, its survival (i.e., non-melting during the operation of the car) is expected. Electrical analysis by the team determined that less than 1 mA will typically flow in a fault between VPA1 and VPA2 and a second similar fault to Vc, if it
2 “Tin Whisker Initialed Vacuum Metal Arcing in Spacecraft Electronics” by James H. Richardson, Brian R. Lasley, and Capt. Theresa M. Philips, in Vacuum Metal Arcing (1992). This plot is re-drawn from their Figure 2.

NASA Engineering and Safety Center Technical Assessment Report
Version: 1.0
Title: National Highway Traffic Safety Administration Toyota Unintended Acceleration Investigation -
Appendix C
Page #: 58 of 87
NESC Assessment #: TI-10-00618
were to occur, would result in a higher current, approximately 5 ma, through that fault, but not enough to ensure melting.
Figure C.1.2.2-27. Lognormal cumulative probability distribution of tin whisker lengths (left) and thicknesses (right) for a sample set
The lengths and thicknesses of metal whiskers are random variables, each characterized by probability distribution functions. To date, these distributions are approximated by lognormal distributions. A study3
3 Evaluation of Environmental Tests for Tin Whisker Assessment,” Lyudmyla Panaschenko, Master’s thesis, University of Maryland 2009
demonstrated that there is no correlation between length and thickness. Typical results from the study are shown in Figure C.1.2.2-27. The median length for this population is about 150 um, but about 0.5 percent are as long as 2 mm. The median thickness of this population is about 3.3 um. A whisker of thickness 1.7 um (or less) happens about 17 percent of the time. Other populations could give somewhat different values.
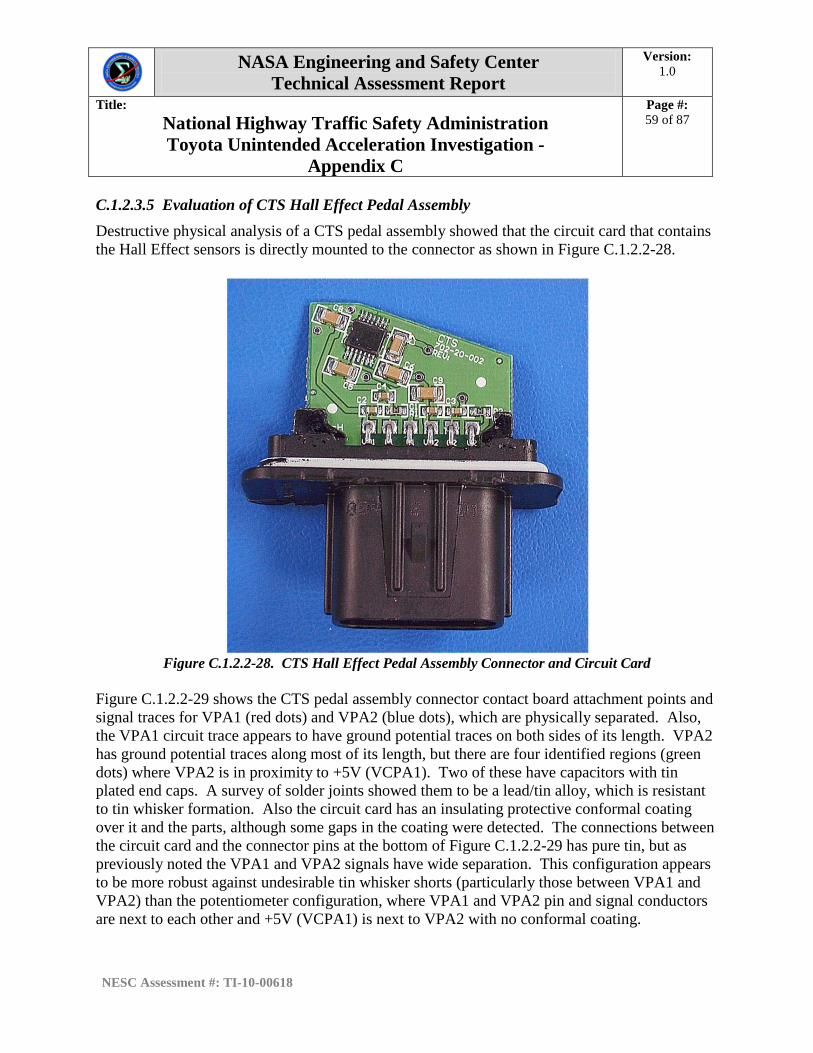
NASA Engineering and Safety Center Technical Assessment Report
Version: 1.0
Title: National Highway Traffic Safety Administration Toyota Unintended Acceleration Investigation -
Appendix C
Page #: 59 of 87
NESC Assessment #: TI-10-00618
C.1.2.3.5 Evaluation of CTS Hall Effect Pedal Assembly Destructive physical analysis of a CTS pedal assembly showed that the circuit card that contains the Hall Effect sensors is directly mounted to the connector as shown in Figure C.1.2.2-28.
Figure C.1.2.2-28. CTS Hall Effect Pedal Assembly Connector and Circuit Card
Figure C.1.2.2-29 shows the CTS pedal assembly connector contact board attachment points and signal traces for VPA1 (red dots) and VPA2 (blue dots), which are physically separated. Also, the VPA1 circuit trace appears to have ground potential traces on both sides of its length. VPA2 has ground potential traces along most of its length, but there are four identified regions (green dots) where VPA2 is in proximity to +5V (VCPA1). Two of these have capacitors with tin plated end caps. A survey of solder joints showed them to be a lead/tin alloy, which is resistant to tin whisker formation. Also the circuit card has an insulating protective conformal coating over it and the parts, although some gaps in the coating were detected. The connections between the circuit card and the connector pins at the bottom of Figure C.1.2.2-29 has pure tin, but as previously noted the VPA1 and VPA2 signals have wide separation. This configuration appears to be more robust against undesirable tin whisker shorts (particularly those between VPA1 and VPA2) than the potentiometer configuration, where VPA1 and VPA2 pin and signal conductors are next to each other and +5V (VCPA1) is next to VPA2 with no conformal coating.

NASA Engineering and Safety Center Technical Assessment Report
Version: 1.0
Title: National Highway Traffic Safety Administration Toyota Unintended Acceleration Investigation -
Appendix C
Page #: 60 of 87
NESC Assessment #: TI-10-00618
Figure C.1.2.2-29. CTS Pedal Assembly Circuit Board X-ray Detail
C.1.2.3.6 Evaluation of Denso Hall Effect Pedal Assembly X-ray and destructive physical analysis of the Denso Hall Effect sensor provided construction details as shown in Figures C.1.2.2-30 and C.1.2.2-31.
Hall Effect Sensor

NASA Engineering and Safety Center Technical Assessment Report
Version: 1.0
Title: National Highway Traffic Safety Administration Toyota Unintended Acceleration Investigation -
Appendix C
Page #: 62 of 87
NESC Assessment #: TI-10-00618
The Denso pedal assembly is a different construction than the CTS pedal. The circuit board and parts are essentially embedded in a solid plastic potting material. Therefore, although there are capacitors with the possibility of pure tin end caps and lead wires on the Hall Effect sensors which may also have tin-plated leads, the plastic material serves as a barrier against tin whisker shorting. Based on this analysis, the Denso Hall Effect pedal assembly appears to be robust against undesirable tin whisker shorting for both VPA1 to VPA2 shorts and for shorts of signal to 5V power (Vc).
While inspection of each of the different types of accelerator pedal assembly was extensive, overall physical inspection for presence or likelihood of tin whiskers was limited to accelerator pedals and was not performed on other components of the ETC. One MY 2007 ECM was examined and tin whiskers were not present in it.
C.1.3 Idle Speed Control Functional Area C.1.3.1 Detailed Implementation Description The idle speed control loop is a feed forward control system that maintains the engine running when no driver input is present (idle) and derives engine speed from the NE+ crankshaft signal as the primary feedback control. In addition the ISC controls functions to compensate for conditions like creep control, increases in oil temperature, variable valve timing, alternator loads, air conditioner loads, catalyst temperature, idle while moving, stall prevention, electric loads other than the alternator, variations in the throttle valve assembly, emissions control system purging, power steering, startup/ignition, and engine temperature to smooth the driving experience and engine operation. The ISC throttle angle request is added to the learned throttle detent position after the throttle requests from the other idle speed control functions have been determined. ISC calculates the amount of air required, in gm/s, and converts this value to a throttle angle request. Within the ISC function there is a predictor function, in the form of a look-up table, which converts the amount of air to a throttle angle. This predictor function includes a learning value to compensate for deposits in the throttle assembly. The ISC contribution is comprised of three main components: 1) The ISC learning compensation, 2) the ISC target engine speed/actual speed feedback control, and 3) engine loads.
The maximum throttle angle contribution from ISC is estimated from the software analysis as 15 degrees increase, but investigation into the software shows it can have a possible maximum of 15.5 degrees when all sensors exhibit maximum influence. Testing of the software model (258,048 iterations), showed a maximum combined effect of 11.6 degrees. The software tests indicated the engine coolant temperature sensor as having the greatest influence. Testing by failing the engine coolant temperature sensor to the lowest value of a Camry MY 2005 L4 showed a maximum of 4.2 degrees increase in throttle angle due for this single sensor failure.

NASA Engineering and Safety Center Technical Assessment Report
Version: 1.0
Title: National Highway Traffic Safety Administration Toyota Unintended Acceleration Investigation -
Appendix C
Page #: 63 of 87
NESC Assessment #: TI-10-00618
Figure C.1.3-1. Idle Speed Control Functional Block Diagram
The accelerator pedal position, transmission position indicator, neutral switch (NSW), the vehicle speed (SPD) and the brake indicators (STP) are used to determine when the engine is idling. The electrical load switch, the air conditioning switch and the engine coolant temperature are used to add an additional level to the target value depending on the need for increased engine speed. The crankshaft position (NE+) is used in conjunction with the camshaft position (G+) signal to set the proper timing of the engine intake/exhaust valves position and the fuel injection timing.
C.1.3.2 ISC Engine Coolant Temperature The ISC uses the water coolant temperature (software value ethw) representing the measurement taken at the water temperature sensor, as an input to various software modules within the ISC to determine throttle valve angle contribution to maintain idle. Many of these calculations are done based on the measured water temperature. Operation of fuel cut is further described in section C.27.2.7.
C.1.3.2 “Idle On” Fuel Cut Function There is protection against excessive engine speed commanded from the ISC through the fuel cut function. The fuel cut function will engage when the engine speed reaches a threshold. The fuel cut threshold will change as a function of the engine coolant temperature. Once fuel cut is engaged the engine speed will drop until it reaches a fuel cut disengage limit.
C.1.3.3 Idle Speed Control System Sensitivities and Postulated Faults Figure C.1.3.3-1 shows the summary of postulated faults identified by the fishbone for the Idle Speed Control functional area. Based on the understanding of the idle speed control design as described, the idle speed control system was reviewed for sensitivities where a postulated fault could result in an increase in engine speed. The fishbone was used to identify potential sensitive entry points into the idle speed control loop. The fishbone identified a poor electrical

NASA Engineering and Safety Center Technical Assessment Report
Version: 1.0
Title: National Highway Traffic Safety Administration Toyota Unintended Acceleration Investigation -
Appendix C
Page #: 64 of 87
NESC Assessment #: TI-10-00618
connection, wiring or faulty engine coolant temperature sensor that may create the potential fault listed below. The next section details postulated faults and effects for the ISC.
Figure C.1.3-2. Summary of postulated faults identied by Idle Speed Control Function Fishbone
Diagram
C.1.3.4 Engine Coolant Sensor Fault In the ISC, the only sensor signal that produced a noticeable (2000 rpm in neutral) increase in engine speed was the coolant temperature sensor (hardware label THW) failing to a higher resistance.
C.1.3.5 Engine Speed Signals Corruption In the ISC, the engine speed is controlled to a target engine speed, thus causing the ECM to think the engine is slower than actual should result in an increased engine speed. The testing attempted to “fool the ECM” by trying to create a slower engine speed by corrupting the engine speed feedback signal or crankshaft position (NE+) signal.

NASA Engineering and Safety Center Technical Assessment Report
Version: 1.0
Title: National Highway Traffic Safety Administration Toyota Unintended Acceleration Investigation -
Appendix C
Page #: 65 of 87
NESC Assessment #: TI-10-00618
Figure C.1.3.5-1. NE signal (Crankshaft, top yellow) and G (Camshaft, bottom blue) signal at idle
The crankshaft position (NE+) is used in conjunction with the camshaft position (G+) signal to set the proper timing of the engine intake/exhaust valves position and the fuel injection timing. Any corruption of these two signals that fails to maintain the proper timing relative to the engine speed will stall the engine. Therefore, the testing focused on creating small changes to the crankshaft sensor signals. The crankshaft signal is approximately 13V peak to peak, approximately 600 Hz at idle and increases in magnitude and frequency at higher engine speeds. The ECM converts this signal into a digital clock signal by a zero crossing detection circuit. Therefore, the zero crossing detection circuitry was tested to sensitivities to offsets. The result was that it was easy to stall the engine. No increase in engine speed was observed in the vehicle with an offset on the crankshaft signal induced by sine, square and saw tooth waveforms from 1 Hz up to approximately 90 KHz.
C.1.3.6 Failed Compensation for Additional Engine Loads The ISC learning algorithm uses the following signals to determine if an increase in the target engine speed is required. These signals are for a MY 2005 Camry:
• Electronic Load Switch #1 (ELS1)
• Electronic Load Switch #3 (ELS3)
• Air Conditioning Switch (A/CS)
• Coolant Water Temperature Sensor(THW) The electronic load switches are a binary input (ON/OFF) signals to the ECM based on the status of electrical loads that cause increased alternator loading on the engine, and testing shown no

NASA Engineering and Safety Center Technical Assessment Report
Version: 1.0
Title: National Highway Traffic Safety Administration Toyota Unintended Acceleration Investigation -
Appendix C
Page #: 66 of 87
NESC Assessment #: TI-10-00618
observable increase in engine speed with the vehicle in neutral. The air conditioning switch is also a binary input and testing showed a sustained ~200 increase in rpm with the vehicle in neutral. The testing involved providing the ECM with false ON when the load was not present. The engine speed increased as a result of the air conditioner cycling and is discussed in the nominal design feature (Section C.1). The engine increase will occur coincident with the air conditioning switch state regardless if the air conditioner load is present or not.
The water coolant temperature sensor provides an analog input proportional to temperature, colder temperature is higher resistance. When the sensor has failed to a higher resistance there is a range where the engine speed will increase by 2000 rpm (vehicle in neutral) without generating a DTC. Figure C.1.3.6-1 shows the test results for the test where the vehicle was started with the coolant temperature sensor set to ~80C, then failed to a higher temperature (130 ohms or 244F) at 30 seconds into the test then failed to a lower temperature (150Kohms or -40F) at approximately 1 minute into the test. As shown in the block diagram, Figure C.1.4-1, this engine speed increase is in addition to the other throttle requests.
A mapping of the coolant temperature sensor resistance to the ECM’s reported temperature through the Techstream was performed. The upper resistance range with respect to the DTC range is shown in Figure C.1.3.6-2. As the resistance of THW sensor input increases, the ECM input approaches the upper limit of the supply voltage. The DTC occurs at 4.92V or 80mV from an ideal 5.00V supply. The return wire of the sensor has additional connections to other electronic devices in the vehicle.
Figure C.1.3.6-1. Test results with coolant temperature sensor failed to 150Kohms resulting 2000 rpm
increase with vehicle in neutral

NASA Engineering and Safety Center Technical Assessment Report
Version: 1.0
Title: National Highway Traffic Safety Administration Toyota Unintended Acceleration Investigation -
Appendix C
Page #: 67 of 87
NESC Assessment #: TI-10-00618
Figure C.1.3.6-2. Upper resistance range of the Coolant Temperature Sensor including the DTC error
range
For the coolant temperature sensor, the ECM software look-up table increases the target rpm directly proportional to the temperature reaching a maximum at -40C. When tested on a vehicle, the vehicle would not start when the engine was warm. Additionally, as the engine warmed the vehicle did not run smoothly, therefore the driver would have other indication the vehicle was not operating properly. These symptoms were not seen in the VOQs and there is no incidence of DTCs or repairs, therefore this postulated failure is not supported by the available data.
C.1.3.7 Summary of Idle Speed Control Potential Faults A poor electrical connection at the coolant sensor, circuit connectors, or in the wiring, could result in an increased resistance. The fault could occur as long as the vehicle is achieving nominal operating temperature, approximately 20 minutes; however, it would eventually generate a DTC P0115. Since the water coolant sensor changed the throttle by less than 5 degrees, it would not explain the greater than 25 degrees above idle unintended throttle valve opening acceleration events.
C.1.4 Cruise Control Functional Area C.1.4.1 Detailed Implementation Description Cruise control maintains the vehicle speed within set limits while cruising with foot off the accelerator pedal and uses the vehicle wheel speed as the primary control signal. Figure C.1.4-1 shows the cruise control block diagram. The cruise control function is implemented through a single variable voltage input that is manipulated by the driver through a switch.

NASA Engineering and Safety Center Technical Assessment Report
Version: 1.0
Title: National Highway Traffic Safety Administration Toyota Unintended Acceleration Investigation -
Appendix C
Page #: 68 of 87
NESC Assessment #: TI-10-00618
Figure C.1.4-1. Cruise Control Block Diagram
The switch selects a resistance that is interpreted by the cruise control logic as a variable voltage that sets the state of the cruise control as shown in Table C.1.4-1. The four switch resistors produce a voltage divider of the battery voltage that combine to represent the five cruise control switch states: Main, Resume, Set, Cancel, Off. Table C.1.4-2 describes the conditions for setting of each of the cruise control switch states. Vehicle wheel speed is determined through a combination meter from sensors on the two front wheels. The system checks whether vehicle speed reading changes more than percent from one reading to the next, and if so cruise control will be auto canceled. If the speed drops more than 9 mph below the set point, cruise control will auto cancel.

NASA Engineering and Safety Center Technical Assessment Report
Version: 1.0
Title: National Highway Traffic Safety Administration Toyota Unintended Acceleration Investigation -
Appendix C
Page #: 69 of 87
NESC Assessment #: TI-10-00618
Table C.1.4-1. Cruise Control Switch Voltage Output
Cruise Control Switch Voltage Cruise Control Switch State CC voltage (CCV) <= (0.168 * Battery Voltage(BV)) Main On/Off (0.168 * BV) > CCV >= (0.3685 * BV) Resume On/Off (0.3685 * BV) > CCV >= (0.584 * BV) Set On/Off (0.584 * BV) > CCV >= (0.7934 * BV) Cancel On/Off (0.7934 * BV) > CCV Off
Additionally, there are noise removal functions to smooth out signal irregularities.
The actual setting of a cruise control state requires one of the cruise control switches to be pressed and then released. In software, this results in a state change being registered followed by the “Off” state. When the driver engages the cruise control switch, the switch is pushed in; this corresponds with Main, Resume, Set, or Cancel. When the driver lets off of the switch, it returns to the normal position corresponding to the “Off” state.
In addition to the cruise control states described above, there are manipulations of the same cruise control switch that allow for other states that are described in Table C.1.4-2.
Table C.1.4-2. Cruise Control States
Cruise Control State
Activation Description
Coast Set switch is engaged for longer than 0.6 seconds
While engaged, coast will decrease the speed of the vehicle. When disengaged the new vehicle speed becomes the set speed.
Tap Down Set switch is engaged Each time the set switch is engaged the vehicle speed will decrease by 1.6 kph and becomes the new set speed.
Accel Resume switch is engaged for longer than 0.6 seconds
While engaged, accel will increase the speed of the vehicle. When disengaged the new vehicle speed becomes the set speed.
Tap Up Resume switch is engaged
Each time the resume switch is engaged the vehicle speed increases by 1.6 kph and becomes the new set speed.
The cruise control operation may be manually canceled through four different inputs:
1. Cancel switch is engaged
2. Main switch is turned off

NASA Engineering and Safety Center Technical Assessment Report
Version: 1.0
Title: National Highway Traffic Safety Administration Toyota Unintended Acceleration Investigation -
Appendix C
Page #: 70 of 87
NESC Assessment #: TI-10-00618
3. Brake is depressed
4. Shift from drive
Four diagnostic codes are shown in Table C.1.4-3 that describes the cruise control failures. Table C.1.4-3. Cruise Control Diagnostic Codes
P0571 Brake Switch Circuit Abnormal
Checks coherency of the two brake switches.
P0500 Vehicle Speed Sensor Abnormal
Checks whether a speed pulse is registered by the vehicle within 140 seconds of ignition on.
P0503 Vehicle Speed Sensor Intermittent/Erratic/High
Checks whether vehicle speed reading changes more than 25 percent from one reading to the next.
P0607 Cancellation Circuit Abnormal
Checks various voltages, data mirrored in RAM, and brake switch state. Voltages checked include +B low voltage, ignition switch low voltage, Watchdog interrupt (WI) low voltage, and STA low voltage.
Auto cancel refers to the function of automatically canceling the cruise control set speed because of certain conditions or diagnostic outputs. There are three subsets of auto cancel described in Table C.1.4-4.
Table C.1.4-4. Cruise Control Auto Cancel
Low Speed Cancels when the vehicle speed is less than 36 kph, or 16 kph below the set speed.
Diagnostics(No code) Cancels when there is an abnormality detected in the electronic throttle or there is a contradiction in the two accelerator pedal position sensors, or there is an abnormality in the intake air mass flow valve or if the data mirrored in RAM is not nominal.
Diagnostics(P0571, P0500, P0503, P0607)
Cancels if any of the following DTCs occur: (P0571, P0500, P0503, P0607).
C.1.4.2 Cruise Control System Sensitivities and Postulated Faults The software study focused on the following:
1. Failure modes of the Cruise Control switch that causes an acceleration behavior and no DTC or indication.

NASA Engineering and Safety Center Technical Assessment Report
Version: 1.0
Title: National Highway Traffic Safety Administration Toyota Unintended Acceleration Investigation -
Appendix C
Page #: 71 of 87
NESC Assessment #: TI-10-00618
2. Failure modes that prevent the Cruise Control from being reset or cancelled.
3. Failure of the speed sensors.
As a result of the software study, focused areas for hardware testing were selected for vehicle tests. The following summarizes several tests performed on a MY 2005 Camry at the VRTC.
C.1.4.3 Vehicle Test: Enable Cruise Control and Restrain Brake Switch Plunger The brake switch consists of one normally-open switch and one normally-closed switch. Both are mechanically connected with a switch plunger.
With the cruise control enabled and the brake switch plunger disabled, the cruise control remained activated and functioning even when brake pedal applications were induced. The system maintained the set speed until enough brake force was applied to decrease vehicle speed by approximately 9 mph or below the 25 mph threshold of operation causing the system to fully disengage. No DTC was generated.
C.1.4.4 Vehicle Test: Short Cruise Control Signal Resistively to Ground With the cruise control engaged, a 240 Ohm resistive short of the cruise control signal wire to ground caused the Cruise Control to remain engaged and the vehicle accelerated to the maximum speed threshold of the system. This test simulated the ACCEL button in a failed closed position. If the brake pedal was applied with the short present, the system canceled. After releasing the brake pedal, if the short is recycled, the system would resume to the previously set speed, and can be canceled again by pressing the brake.
C.1.4.5 Vehicle Test: Cruise Control Shift Out Of Drive Cancel With the Cruise Control enabled, the system canceled when the transmission was manually downshifted or shifted to neutral. The system could be resumed to the previously set speed when the transmission was placed back in Drive and the resume button was depressed.
C.1.4.6 Failed Wheel Speed Sensor If a fault in the vehicle speed determination indicates a lower speed than the vehicle, the cruise control function will increase the throttle to increase vehicle speed. Signal Line and Voltage Ripple tests were performed during EMI Conducted Susceptibility tests, Section 6.8.3.11, with no effect seen on the vehicle speed control when in cruise control.
C.1.5 Transmission Control Functional Area The ETCS-i uses a transmission shifting signal as an input to its determination of throttle command. The transmission control software has a hard limit of 5 degrees to the throttle command. The only area evaluated for effect on ETCS-i was torque converter lock-up, and the acceleration was determined to be minimal,. The torque converter converts the power from the engine, seamlessly and smoothly to the transmission. In order to improve fuel economy, the

NASA Engineering and Safety Center Technical Assessment Report
Version: 1.0
Title: National Highway Traffic Safety Administration Toyota Unintended Acceleration Investigation -
Appendix C
Page #: 72 of 87
NESC Assessment #: TI-10-00618
torque converter is equipped with a lock-up clutch, which locks as the vehicle speed reaches approximately 40 mph. This lock-up is controlled by the CPU and engages in the top gears, and will disengage with changes in accelerator pedal movement.
C.1.6 VSC Functional Area VSC primary function is to keep the vehicle in a correct attitude or orientation on the road. Traction Control (TRAC) is contained within the VSC function and is intended to keep the difference between the drive wheels’ speed and the vehicle speed minimal to control wheel slip during accelerator pedal application. The stability control will cause the vehicle to brake and decrease the throttle angle if the vehicle yaw rate varies from the commanded vehicle yaw rate. The commanded yaw rate as based on the steering wheel and the vehicle yaw rate is sensed from 2 microelectromechanical systems (MEMS) gyros. The braking request from the stability control will also cancel Cruise Control, if it is active.
MY05 does not increase throttle through VSC. If a speed sensor fails, then the VSC function will stop (DTCs C0200, C0205, C0210, and C0215). The drive wheel speed is averaged between the values of the two front wheel speeds.
DTCs for the two front wheels (C0200 and C0205) check whether a speed sensor pulse has been received after 0.04 seconds. These DTCs are only checked if the vehicle speed is greater than 25 mph.
The ability of VSC to increase the throttle was discussed with the TMC engineers, but not studied in great detail. The VSC was optional to MY 2010 and, based on the discussions, does not have the ability to increase the throttle until after MY 2007.
C.1.7 ECM Power System Although not a functional control loop related to vehicle operations directly, electrical power is necessary for the control loops to function properly, therefore just as important as any control loop. A thorough review of the power system did not identify any failure modes which would result in a throttle increase other than the modes already identified as influences to the major control loops.
C.1.7.1 Detailed Implementation Description Figure C.1.7-1 is a simplified diagram of the power supply ASIC used in the MY 2005 Camry L4.
NASA Engineering and Safety Center Technical Assessment Report
Version: 1.0
Title: National Highway Traffic Safety Administration Toyota Unintended Acceleration Investigation -
Appendix C
Page #: 73 of 87
NESC Assessment #: TI-10-00618
The Vc supply regulator has
foldback current limiting that limits the current into an external short circuit to approximately

NASA Engineering and Safety Center Technical Assessment Report
Version: 1.0
Title: National Highway Traffic Safety Administration Toyota Unintended Acceleration Investigation -
Appendix C
Page #: 74 of 87
NESC Assessment #: TI-10-00618
520 mA which was verified by NESC testing. The Vc is also used outside the ECM to power the throttle and pedal position sensors and other vehicle sensors in addition to circuitry inside the ECM. The
C.1.7.2 Power System Sensitivities and Postulated Faults There are no identified single point failures in the power supply that can trigger vehicle UA.
Lastly, since the Vc output is used to
power various sensors in the vehicle a short of this +5V line to the battery voltage may be possible. This was tested on a MY 06 V6 simulator by gradually shorting the external Vc to the +12V source through a variable resistance. At a voltage greater than approximately 8V the ECM became non-functional and permanently damaged (Vc decreased to approximately 2.5V), but no unexpected opening of the throttle was observed. EMI testing audio ripple and spikes were injected on both the +12V and +5V Vc lines at the ECM and no UA was reported. Low voltage output of a single regulator should cause ECM anomalies that can be detected by DTCs. Lastly, open output capacitors may result in increased power supply noise and/or oscillation. The previously noted ripple injection tests for the ECM +12 and +5V Vc lines were performed without UA incident. The undervoltage detection circuits previously described protect the system against low Vc voltage and low +12V affecting the CPUs and other electronics.


NASA Engineering and Safety Center Technical Assessment Report
Version: 1.0
Title: National Highway Traffic Safety Administration Toyota Unintended Acceleration Investigation -
Appendix C
Page #: 76 of 87
NESC Assessment #: TI-10-00618
The desired engine speed and power determines the throttle position, the fuel injection quantity, and ignition timing. To increase engine speed to the maximum limit requires the correct and precise control of airflow, ignition timing, and fuel injection. Opening the throttle is necessary, but not sufficient to cause this maximum increase in engine speed.
The following sections describe software functions and system fail-safe features with a focus on the controls and barriers in place to control engine speed.
C.2.1.1 Main CPU Functions The Main CPU primary functions are analog and digital sensor input, control output, and functional processing of the throttle valve, fuel injectors, and ignition timing. The Main CPU also provides an independent PWM control for the H-Bridge motor drive of the throttle valve. The majority of the processing occurs within the Main CPU.
C.2.1.1.1 Pedal Command The Pedal Command function determines the driver commanded vehicle acceleration from two pedal sensor inputs. The two sensors provide pedal command input and pedal diagnostic capabilities. A valid relationship between the two sensor values must exist for the vehicle to operate normally.
The pedal command is sensed by the software as the difference between the pedal released position and the pedal pressed position. The pedal released position sensor values are learned values stored in SRAM. Under specific conditions, a software function adjusts these released position values when the pedal is not pressed. The general conditions are described below.
To learn a lower value:
To learn a higher value:
•

NASA Engineering and Safety Center Technical Assessment Report
Version: 1.0
Title: National Highway Traffic Safety Administration Toyota Unintended Acceleration Investigation -
Appendix C
Page #: 77 of 87
NESC Assessment #: TI-10-00618
When one pedal sensor is determined to have failed, a “Limp Mode Fail Safe” is entered. In this mode, the failure is annunciated, and the acceleration commanded from the pedal is constrained. This allows the driver to control the vehicle at a limited engine speed.
If diagnostics detect a second pedal failure while in this “Limp Mode Fail Safe”, the engine idles.
C.2.1.1.2 Cruise Control The cruise control function automates the vehicle commanded acceleration to maintain a set speed. The cruise control modes are Cancel, Main, Resume, and Set. When enabled, the cruise control driver commands are as follows:
Table C.2.1-1. Cruise Control States Cruise Control State
Activation Description
Coast Set switch is engaged for longer than 0.6 seconds
While engaged, coast will decrease the speed of the vehicle at a rate of 0.06 g (or 2.12 kph/s). When disengaged the new vehicle speed becomes the set speed.
Tap Down Set switch is engaged Each time the set switch is engaged the vehicle speed will decrease by 1.6 kph and becomes the new set speed.
Accel Resume switch is engaged for longer than 0.6 seconds
While engaged, accel will increase the speed of the vehicle at a rate of 0.06 g (or 2.12 kph/s). When disengaged the new vehicle speed becomes the set speed.
Tap Up Resume switch is engaged Each time the resume switch is engaged the vehicle speed increases by 1.6 kph and becomes the new set speed.
The cruise control states are commanded through one analog input. The single voltage determines the position of the cruise control input switch. Hardware failures of this switch were presented in Section C.1.4.
The cruise control operation may be cancelled by software diagnostics that indicate an anomaly with the brake switch, vehicle speed sensing, and software data mirror failures.
The cruise control operation may be manually canceled through four different driver actions:
1. Cancel switch is engaged 2. Main switch is turned off 3. Brake is depressed 4. Shift from drive
Cancelling cruise control tests were also presented in Section C.1.4.

NASA Engineering and Safety Center Technical Assessment Report
Version: 1.0
Title: National Highway Traffic Safety Administration Toyota Unintended Acceleration Investigation -
Appendix C
Page #: 78 of 87
NESC Assessment #: TI-10-00618
C.2.1.1.3 Compensate for VSC VSC primary function is to keep the vehicle in a correct attitude or orientation on the road. The stability control will cause the vehicle to brake and decrease the throttle angle if the vehicle yaw rate varies from the commanded vehicle yaw rate. The commanded yaw rate is based on the steering wheel and the vehicle yaw rate is sensed from 2 MEMS gyros. Braking request from the stability control will also cancel Cruise Control, if it is active.
Traction Control’s (TRAC) exists within the VSC software. The TRAC primary function is to keep the difference between the drive wheels’ speed and the vehicle speed minimal. In MY 2005 Camry vehicles, the TRAC function only decreases throttle.
VSC calculates the vehicle speed, which is used by TRAC, from 4 wheel sensors, one sensor per wheel. If a speed sensor fails, then the VSC function will stop (DTCs C0200, C0205, C0210, and C0215). The drive wheel speed is averaged between the values of the two front wheel speeds.
C.2.1.1.4 Transmission Shifting Transmission shifting contribution to the control of the throttle valve is applied through the Idle Speed Control (ISC).
C.2.1.1.5 Add Idle Engine Speed In order to keep the engine speed above a stall condition, engine idle speed control commands the engine speed based on engine loads, including transmission shifting, and engine temperature. Engine temperature determines the unloaded idle speed. Additional loads, such as headlights or air conditioning loads, require an increase in the engine speed. These increases are summed with the unloaded idle speed. This summed engine idle contribution is added to the one selected throttle command to determine throttle valve position. Only one of the throttle command inputs is selected as the basis for positioning the throttle valve. The driver pedal, cruise control, and stability control are mutually exclusive.
It should be noted that the common notion of an idle engine occurring only when the vehicle is stopped and the driver’s foot is off the pedal does not apply here. Engine idle speed contributes to the total throttle command whenever the engine is running. C.2.1.1.6 Control Throttle Motor This total throttle command is converted to the required pulse width (PWM duty cycle) to drive the throttle motor against its return springs. When driven, the throttle motor rotates the throttle valve. The throttle valve position is sensed by two sensors. A valid relationship must exist between the two sensor values for the vehicle to operate normally. The position sensors provide closed-loop feedback to the throttle motor driver. The throttle motor driver adjusts the pulse width to drive the throttle motor until the sensed position matches the commanded position.

NASA Engineering and Safety Center Technical Assessment Report
Version: 1.0
Title: National Highway Traffic Safety Administration Toyota Unintended Acceleration Investigation -
Appendix C
Page #: 79 of 87
NESC Assessment #: TI-10-00618
To control the throttle valve position, the throttle valve fully-closed position is learned. This learned value is adjusted a maximum of degree at each engine startup, when the throttle is closed under spring tension, and the throttle motor is not powered. The commanded throttle position is relative to this learned fully-closed position value. The general conditions for learning the throttle valve fully-closed position are as follows:
The ASIC H-Bridge provides the power and pulses to drive the throttle motor. The H-Bridge requires inputs from both the Main and Sub CPUs to operate, and it is able to power the throttle motor only when both CPUs outputs are available. During any CPU reset, the CPU outputs to the H-Bridge that drive the throttle motor are pulled-low, disabling the motor drive.
Motor current is an indicator of how hard the throttle motor is being driven. If the throttle valve does not mechanically move, the motor will be driven hard to try to meet the commanded position. When the motor drive current crosses the over-current threshold, the sub CPU removes its input to the ASIC H-Bridge and this disables the motor drive.
If a throttle valve position sensor fails, power is cut to the throttle motor.
C.2.1.2 Sub-CPU Functions The Sub CPU primary functions are analog and digital sensor input, control output, passing inputs to the Main CPU, diagnostics for the brake switch, and diagnostics for the cruise control main switch. The Sub-CPU also provides an independent hardware enable for the H-Bridge motor drive of the throttle valve. It does not implement a dual processing path in parallel with the Main CPU functions.
C.2.1.3 ECM Software Implementation The ECM (engine control module) for the MY 2005 Camry uses a NEC V850 E1 processor. The software for the ECM is written in ISO/ANSI C4, and compiled for production use with the GreenHills5
compiler suite version 3.4.0. The code relies on the use of the Greenhills compiler
4 http://en.wikipedia.org/wiki/ANSI C 5 http://www.ghs.com/

NASA Engineering and Safety Center Technical Assessment Report
Version: 1.0
Title: National Highway Traffic Safety Administration Toyota Unintended Acceleration Investigation -
Appendix C
Page #: 80 of 87
NESC Assessment #: TI-10-00618
with pragma directives6
Table C.2.1-2. Basic Code Size Metrics Camry05 Software
that is discussed below. Some basic statics on the source code are summarized in Table C.2.4-1.
C code #Files SLOC NCSL Comments NCSL/File SLOC/NCSL Comments/NCSL sources 1,761 463,473 256,647 241,683 145.7 1.8 0.9 headers 1,067 100,423 39,564 67,064 37.1 2.5 1.6
The ECM is designed to meet a range of real-time constraints for engine control. The real-time operating system used is based on the OSEK7 standard for distributed control units in vehicles, which is supported by AUTOSAR8
The execution of a task can be interrupted, for short durations of time, by hardware interrupts, e.g., to signal the arrival of inputs or network data. A total of interrupt levels are defined, 5 are dedicated to hardware traps (e.g., for attempts to execute illegal instructions or to access non-existing memory locations.
(Automotive Open System Architecture) of which TMC is a core member. The operating system is based on the execution of tasks, each with a fixed and statically assigned priority. The MY 2005 Camry code contains tasks that execute at fixed priority levels between 1 and .
The priority levels are statically assigned and do not change dynamically.
6 http://gcc.gnu.org/onlinedocs/cpp/Pragmas.html 7 http://en.wikipedia.org/wiki/OSEK, http://portal.osek-vdx.org/files/pdf/specs/os223.pdf 8 http://en.wikipedia.org/wiki/AUTOSAR

NASA Engineering and Safety Center Technical Assessment Report
Version: 1.0
Title: National Highway Traffic Safety Administration Toyota Unintended Acceleration Investigation -
Appendix C
Page #: 81 of 87
NESC Assessment #: TI-10-00618
A higher priority task in effect locks out the execution of lower-priority tasks without the need to use explicit synchronization locks. The TMC code makes frequent use of this principle to avoid the use of explicit locks or semaphores. The only mechanism used is that of an interrupt-mask to prevent an executing task from being interrupted or preempted for short durations of time.
C.2.2 System Integrity and Fail Safe Modes C.2.2.1 Power On – Reset The Power On – Reset function in the power supply ASIC contains voltage threshold monitoring based on sufficient supply voltages. Both CPUs are held in a reset state until the proper voltages are available. A heartbeat error between CPUs or low supply voltage can trigger the power supply ASIC to reset both CPUs. Both CPUs remain reset until the supply voltage and the heartbeat is restored.
During power on reset, the CPU outputs to the H-Bridge that drive the throttle motor are pulled-low, disabling the motor drive.
C.2.2.2 Heartbeat The heartbeat pulse train signal from the Main CPU is provided to the power ASIC and also to the Sub-CPU. The Sub-CPU watchdog pulse train is provided to the Main CPU. The Main CPU can reset the Sub-CPU and the power ASIC can reset the Main CPU and Sub-CPU. The heartbeat pulse train is software generated and acts as an external indication of proper CPU hardware and software operation.
During any CPU reset, the CPU outputs to the H-Bridge that drive the throttle motor are pulled-low, disabling the motor drive.
C.2.2.3 Watch Dog Timer Implemented in hardware, one watchdog timer exists in the sub CPU, and one exists in the Main CPU. Each watchdog timer is initiated at startup, and requires constant re-initiation by software. If a watchdog timer expires without being re-initiated by software, the CPU hardware is reset and restarts. The software function that re-initiates the watchdog timer executes in the lowest priority task. If this lowest priority task does not execute, it indicates abnormal processing or timing within either the software or hardware.
During watch dog timer reset, the CPU outputs to the H-Bridge that drive the throttle motor are pulled-low, disabling the motor drive.
C.2.2.4 Hardware Data Checks Implemented in hardware, error detection and correction (EDAC) logic can detect and correct a hardware error in a memory location for single bit errors. This detection and correction occurs without affecting the software execution. If a hardware error occurs in a memory location

NASA Engineering and Safety Center Technical Assessment Report
Version: 1.0
Title: National Highway Traffic Safety Administration Toyota Unintended Acceleration Investigation -
Appendix C
Page #: 82 of 87
NESC Assessment #: TI-10-00618
altering two bits, it can be detected, but not corrected. EDAC is intended to detect and correct hardware errors in memory locations, and does not detect or correct software errors.
C.2.2.5 Data Transfer Data is transferred between the two CPUs on a synchronous serial data bus. The serial data transfer implements no data checks and implements no retry capability. The data is transferred and refreshed every 8ms.
C.2.2.6 Software Data Checks A subset of software data is protected by implementing software data mirroring. When the data is written, a second location is written with the complement of the data. When the data is read, the second location is also read and checked. If the check fails, a default value is used.
When this software data mirroring is used, it protects data from being overwritten, such as by stack or buffer overflows.
C.2.2.7 Fuel Cut and Electronic Fuel Injection (EFI) and Ignition When the pedal position sensors indicate the driver foot is off the pedal, a fuel cut function is used to limit maximum engine speed. An exception is when cruise control is engaged. When cruise control is engaged, this fuel cut function is disabled.
The moment the pedal is disengaged, the engine speed is sensed, and this level determines whether fuel cut is enabled. Fuel cut is enabled when this engine speed is above the fuel cut threshold. Following fuel removal from the engine, the speed decreases. When the engine speed reduces below the fuel cut recovery threshold, fuel is restored to the engine.
EFI controls the ignition timing based upon crank shaft timing, and controls the fuel and airflow mixture based upon the airflow through the throttle valve.
C.2.1.8 Onboard Diagnostic Interface (OBD II) An onboard diagnostic serial interface allows technicians to analyze specific data values sampled from the ETC system. It also has the capability to modify values and the behavior of the system. The interface is enabled when connected to external diagnostic equipment.
C.2.3 Software Study and Results The software study applied analysis and modeling tools to the MY 2005 Camry source code. Models were developed of functional areas to achieve an integrated understanding of the system behavior and simulations were run on these models to explore areas of interest. These simulations were confirmed against vehicle hardware, and the models were further refined. Ultimately, the software study supported the development of specific vehicle hardware tests.

NASA Engineering and Safety Center Technical Assessment Report
Version: 1.0
Title: National Highway Traffic Safety Administration Toyota Unintended Acceleration Investigation -
Appendix C
Page #: 83 of 87
NESC Assessment #: TI-10-00618
Major CPU and software failures are protected through Sub-CPU and Main CPU checks, watchdog, heartbeat, and voltage monitoring. Data corruption is protected through EDAC and software-implemented data mirroring. Data limits are applied to detect sensor and output failures.
Described in the previous sections, specific tests were selected and tested on Camry vehicles. Many of these tests were the result of software code paths and variables that were identified as influencing the throttle valve position. During the software study, code paths and variables that possessed ALL of the following attributes were identified as candidates for testing on the Camry vehicles.
1. The candidate code path or variable data would require a mechanism to create sensor or data errors. External sensor or external control failures were tested extensively. Internal software data corruption could not be demonstrated.
2. The sensor or data error would need to persist to match reported UA behaviors. Most sensor and control data in the system is updated every compute cycle (at most every 16 msec); however, for the UA to persist, the sensor or data error would need to persist and would not be corrected or updated.
3. The sensor or data error would need to have an influence upon opening the throttle position, and possibly, increasing fuel flow and ignition timing.
4. The sensor or data error would need to occur without producing any error code or initiating the entry into any fail-safe mode.
The following section provides a brief introduction to the context of the study into possible software causes for UA in TMC vehicles. Detailed description of the software analysis is provided in Appendix A.
C.2.3.1 Software Analysis Scope and Technologies Applied The study focused on the MY 2005 Camry L4 (inline four cylinder engine) ECM software.
The study started mid April 2010 and ran through mid August 2010. Initially, the software study was supported by the TMC facility in Torrance, California. The effort expanded to two facilities; one in Torrance and one in San Jose, California. This second facility became operational in June 2010. Software tools provided by TMC included the Atlas translation software system for rough online translations from Japanese into English, and a version of the compiler suite that TMC uses to compile their source code. The proximity of the work area to TMC Headquarters facilitated a direct interaction between the NESC software team and the TMC engineers. The discussions took place in English and Japanese, with the help of an interpreter who provided two-way translations during all regularly scheduled and impromptu meetings and discussions.

NASA Engineering and Safety Center Technical Assessment Report
Version: 1.0
Title: National Highway Traffic Safety Administration Toyota Unintended Acceleration Investigation -
Appendix C
Page #: 84 of 87
NESC Assessment #: TI-10-00618
The software team performed an analysis of the MY 2005 Camry L4 ECM software to investigate if there can be plausible triggers for UA in the TMC engine control software. As part of this study, the NESC team also analyzed the overall structure of this software.
The fishbone diagram in Appendix B provides the general context for this study. The fishbone diagram groups potential software causes in four broad categories. In this report, the team addressed each of these categories:
1. Coding defects (implementation)
Implementation in software, just as in hardware, can introduce defects when translating from design to code. To some extent, the software language used determines the types of defects that can be introduced. Coding standards can reduce the introduction of these defects by constraining the implementation techniques used and enhancing code inspections. For this study, tools were used to automate the code inspections by analyzing the source code and evaluating it against coding standards.
2. Algorithm flaws (design logic)
The design and logic of a system can be analyzed to determine if the system functions as intended. Models of the functional system were developed, and these models facilitated the communication of the system behavior to the entire team. Analysis of these models, both manual and automated, produced areas of interest and prioritized the study efforts.
3. Task interference (race conditions, data corruption)
The design and implementation of the timing and order of the tasks within the system involves scheduling and control of task dependencies. Task dependencies can be execution order, data update and data usage sequencing, synchronous execution to an event, and asynchronous execution to an event. When control is not designed or implemented correctly, race conditions occur or data corruption occurs.
4. Insufficient fault protection
Fault protection is required in any hardware and software system. Hardware failures and unexpected software states need to be recognized and mitigated.
C.2.3.2 Software Implementation Analysis Using Static Source Code Tools The initial focus in analyzing the Camry MY 2005 source code has been on a thorough static source code analysis of the ECM source code to find possible coding defects and potential vulnerabilities in the code.

NASA Engineering and Safety Center Technical Assessment Report
Version: 1.0
Title: National Highway Traffic Safety Administration Toyota Unintended Acceleration Investigation -
Appendix C
Page #: 85 of 87
NESC Assessment #: TI-10-00618
Tools Used:
• Coverity9
•
– is currently one of the leading static source code analysis tools on the market. It excels at finding common coding defects and suspicious coding patterns in large code bases, taking a relatively short amount of time. The tool also supports custom-written checkers that can verify compliance with user-defined additional coding rules. This capability is put to use by using a small set of such Extend checkers. Coverity aims to reduce the number of warnings it issues to a minimum, by a careful filtering process that seeks to identify the most relevant or critical issues.
CodeSonar10
•
– is a second strong static source code analysis tool from Grammatech that uses a different technology for detailed inter-procedural source code analysis. CodeSonar analysis typically takes longer to complete than comparable tools, but can reveal more subtle types of defects and suspect coding patterns, requiring deeper path analysis (which can be more time consuming). The version of CodeSonar used was extended with checkers for JPL’s coding standard. In this study, separate results for the coding standard checks from the default results were used.
Uno11
C.2.3.3 Software Logic Model Checking Using the SPIN Tool
- is a research tool for performing static source code analysis, originating at Bell Labs. It is designed to perform a simpler, fast analysis for intercepting primarily the three most common types of software defects in programs: the use of uninitialized variables, Nil-pointer dereferences, and out-of-bounds array indexing. The tool can be extended with user-defined checks.
Another technology used was that of logic model checking. The leading tool in this domain is the Spin verifier, which was developed by one of the authors of this report.
Tools Used:
• Spin12
- is an open-source software tool for the formal verification of distributed software systems. It is used frequently for the verification of mission or safety critical system designs. The tool was originally developed at Bell Laboratories in the Computing Sciences Research Center, and has been available since 1991. In April 2002, the tool was awarded the ACM System Software Award for 2001. It is possible to use this tool both for the exhaustive verification of high level design models of a system and for the
9 http://coverity.com/ 10 http://grammatech.com/products/codesonar/overview.html 11 http://spinroot.com/uno/ 12 http://spinroot.com/spin/

NASA Engineering and Safety Center Technical Assessment Report
Version: 1.0
Title: National Highway Traffic Safety Administration Toyota Unintended Acceleration Investigation -
Appendix C
Page #: 86 of 87
NESC Assessment #: TI-10-00618
detailed exploration of implementation level code in multi-tasking or multi-threaded systems.
• Swarm13
C.2.3.4 Software Algorithm Design Analysis Using MATLAB Models
– is a preprocessing system for Spin that can maximize use of available compute resources in large compute clouds or grids. It can also be used to make optimal use of all the CPU cores on a single compute server, to allow for a comprehensive analysis of large and complex software systems with a swarm of small verification jobs that jointly span the search space.
Model-Based Design (MBD) is a mathematical and visual method of addressing problems associated with designing complex control systems. It is used in many motion-control systems, industrial equipment, aerospace, and automotive applications.
MBD provides an efficient approach for establishing a common framework for communication throughout the design process while supporting the development cycle ("V" diagram). In MBD, development is manifested in the following steps: modeling a system, analyzing and synthesizing a controller for the system, simulating the system, and integrating all these phases by implementing the system.
This study of the MY 2005 Camry software, model-based design techniques were applied to create high-fidelity models of the software functions and behaviors. TMC documentation and discussions with their engineering experts initiated the process. Source code analysis continued the process by increasing the accuracy of the models. And testing upon the Camry simulators and actual Camry vehicles confirmed the accuracy of the models. Efforts were made to incorporate as much actual source code into the models for further increased fidelity of the models.
This MBD approach also supported the dissemination of the software functions and behaviors to the team as a whole. Presentations of the software in this manner efficiently communicated the software within the MY 2005 Camry microcontrollers without exposing the native source code.
Tools used are as follows:
• MATLAB – is a product family providing a high-level programming language, an interactive technical computing environment, and functions for algorithm development, data analysis and visualization, and numeric computation.
13 http://spinroot.com/swarm/

NASA Engineering and Safety Center Technical Assessment Report
Version: 1.0
Title: National Highway Traffic Safety Administration Toyota Unintended Acceleration Investigation -
Appendix C
Page #: 87 of 87
NESC Assessment #: TI-10-00618
• Simulink - is an environment for multi-domain simulation and MBD for dynamic and embedded systems. It provides an interactive graphical environment and a customizable set of block libraries that let you design, simulate, implement, and test systems.
• Stateflow - extends Simulink with a design environment for developing state charts and flow diagrams. Stateflow software provides the language elements required to describe complex logic in a natural, readable, and understandable form. It is tightly integrated with MATLAB and Simulink products, providing an efficient environment for designing embedded systems that contain control, supervisory, and mode logic. Models can be created of embedded software that combine logical behavior, such as fault management and mode switching, with algorithmic behavior, such as feedback control and signal conditioning.
• SystemTest – automated model testing of Simulink models as a “black box”. Test values are provided to the proper model inputs; outputs of the model are tested against properties to obtain fail/pass results.
• aiT from AbsInt - statically computes tight bounds for the worst-case execution time (WCET) of tasks in real-time systems. aiT directly analyzes binary executables and takes the intrinsic processor cache and pipeline behavior into account.


