NASA Instrument Incubator Program (IIP) Multi-Band Uncooled Radiometer Instrument (MURI) 6/14/18 NASA ESTO IIP PI: Phil Ely, Leonardo DRS Co I: Ray Wagoner, Leonardo DRS Science Team Co I: John Kerekes, Rochester Institute of Technology (RIT) NASA Grant # 80NSSC18K0114
Transcript
NASA Instrument Incubator Program (IIP)
Multi-Band Uncooled Radiometer Instrument
(MURI)6/14/18
NASA ESTO IIP PI: Phil Ely, Leonardo DRS
Co I: Ray Wagoner, Leonardo DRS
Science Team Co I: John Kerekes, Rochester Institute of Technology (RIT)
TRL at Start of Program = 3TRL at Completion of Year 3 of Program = 6
3
Pie
zo S
tage
Po
siti
on
Final Piezo Stage Position
Time to Allow Piezo to Reach
Constant Velocity
Snap 1 = 3 Stacked Frames
Frames 1, 2 & 3
Period of Constant Velocity Where Image is stabilized and Frames can be stacked Together with no smear
Time for Piezo to Return toStarting PositionFor next Snap
Snap 1
Snap 2
Snap 3
DirectionOf Travel
Time
Overlap betweenSnaps
Snap 2 = 3 Stacked Frames
Frames 4, 5 & 6StartingPiezoStage Position
Piezo Stage Assembly
Example of Piezo Stage Movement
DRS Patent Pending for Piezo Stabilization
4
Pictoral Example of Piezo Stage Image Stabilization
Aircraft/Sensor MotionOver the Ground
Piezo Stage Not Being Moved – Image Smear Occurs
MoveablePiezo Stage
Staring Focal PlaneMounted toPiezo Stage
Lens
Object on GroundBeing Imaged
Image on Focal Plane – Frame 1
Image on Focal Plane – Frame 2
Image on Focal Plane – Frame 3Showing 3 successive frames: Image moving on the Staring Focal Plane due to Aircraft Velocity Over the ground would Cause Smear over multiple frames
Piezo Stage Static
Aircraft/Sensor MotionOver the Ground
Piezo Stage Being Movedat Constant Velocity to match Aircraft motion- NoImage Smear
MoveablePiezo Stage
Staring Focal PlaneMounted toPiezo Stage
Lens
Object on GroundBeing Imaged
Image on Focal Plane – Frame 1
Image on Focal Plane – Frame 2
Image on Focal Plane – Frame 3
Piezo Stage Moving
Showing 3 successive frames with the Piezo StageMoving at the same Relative Velocity as the aircraft: the image is stabilized on the Staring Focal Plane and no image smearing occurs, image frames can be added together to improve signal to noise ratio
For illustration Purposes. Without Piezo Stage, Image would Move ~4pixels per Frame in Airborne Instrument
5
0
0.2
0.4
0.6
0.8
1
1.2
RER
Distance from Edge in Pixels
RER Static vs Backscan and No Backscan at 280kts GS
280 kts (Backscan) = 0.52953
280 kts (No Backscan) =
0.34141
Static(x1) = 0.52759
RER ComparisonStatic vs. Backscan = 0.37 %Static vs. No Backscan = 35.3 %
Rotary Stage moves in yaw (CCW) to simulate aircraft forward velocity
Control Loop measures yaw velocity and commands backscan of piezo at appropriate velocity to desmearimage
2deg FOV Collimator projecting a slanted edge for measuring RER
PC/Frame Grabber collects multiple stabilized frames for stacking
Lab Demo Shows Piezo Backscan Works
DRS Patent Pending for Piezo Stabilization
6
• DRS has completed the MURI Radiometer Instrument design (Year 1)
• With lab testing, DRS has demonstrated that the piezo backscan approach works
and can provide a constant velocity to match the anticipated aircraft velocity
• We are in Year 2 and are receiving the instrument hardware from suppliers and are
starting instrument Assembly; Sensor software is being completed
• In Year 3, we will complete instrument integration and laboratory testing followed by
field testing on an airborne platform
Program Status: Where we are Today
Piezo Stage Assembly
f/1, 120mm EFL LWIR Lens Assembly w/ Motor Focus
Piezo Controller
Thermal Radiation Shield
4 LWIR UFPAs & Camera Electronics
CMLB Bias Board
7
Demo Concept & System Architecture
T=0 T=503msec T=1006msec T=1509msec
The collection sequence consists of:• Twin Otter aircraft typically flies at 15000ft
and 120-150kts
• Collection during piezo-backscan
• Piezo returns to nadir position
• Aircraft motion carries nadir pointing LOS to
next image position (with some overlap)
• This gives us a maximum of 6 colors with
existing packaging
MURI Aircraft Demo For Earth Science Applications
Demonstration Data Collection In 6 LWIR Wavebands
MURI
Detector
layout
T=0 T=655msec T=1310msec T=1865msec
Only 4 bands shown for this illustration
MURI Sensor has 0.65m GSD @ 15,000 ft AltitudeIFOV is Equivalent to 100m GSD at 705Km Landsat Orbit
8
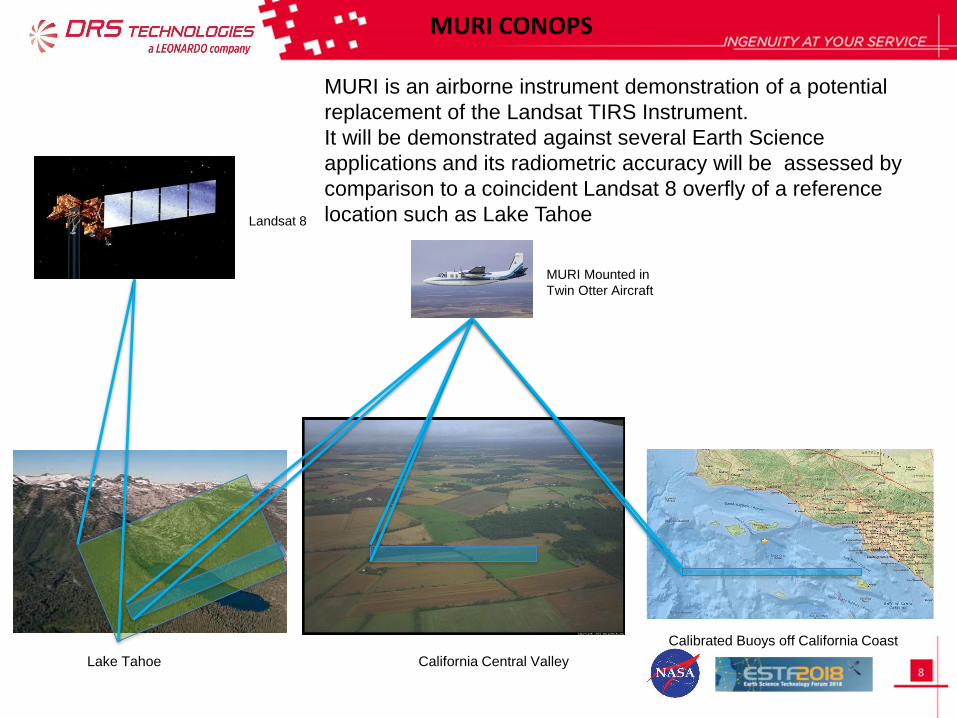
MURI CONOPS
MURI Mounted in
Twin Otter Aircraft
Landsat 8
Lake Tahoe California Central Valley
Calibrated Buoys off California Coast
MURI is an airborne instrument demonstration of a potential
replacement of the Landsat TIRS Instrument.
It will be demonstrated against several Earth Science
applications and its radiometric accuracy will be assessed by
comparison to a coincident Landsat 8 overfly of a reference
location such as Lake Tahoe
9
Landsat Coincident Underflight
10
3 Major Challenges Being Addressed on DRS’ IIP MURI Program
Using Microbolometers for Earth Imaging from Low Earth Orbit
Issue #1: Long time constant of microbolometers (typically ~ 12msec) make them susceptible to image smear when imaging from LEO satellites travelling @ ~7km/sec or aircraft flying at 125 Knots
Solution #1: Implement piezo backscan of FPA to precisely match the image velocity on the FPA and hence stabilize image (i.e. eliminate image smear)
Issue #2: NETD of bolometers are significantly degraded when used with the narrow spectral band filters typically used for multi-band earth imaging
Solution # 2: Maintain use of f/1 optics, fabricate bolometers with an even longer time constant (~20msec) to get a 40% improvement in NETD and then frame stack 14 frames to improve NETD another sqrt(14)= ~3.7X
Issue #3: Bolometers’ output signal are sensitive to temperature of objects in the scene but also their surrounding environment temperature (lens temp, camera housing temp, etc.) make achieving a radiometric accuracy of < 2% challenging.
Solution #3: Stabilize and control the lens and focal plane assembly temperatures, and utilize DRS’ proprietary TCOMP algorithms which perform a radiometric correction to the data from a laboratory calibration which accounts for FPA and lens temperature in a polynomial correction.
MURI Instrument Challenges Using Bolometers
11
Overall MURI System Architecture
Multi-Band Uncooled Radiometer Imager (MURI)
MURI Bench Test and Flight System Configuration
MURI
Shock/ Vibration Isolators
Color Context Camera
Host Computer with Frame Grabber /
Data Recorder
Chiller
Aircraft Interface Structure
Aircraft
Electronics Enclosure
System Controller
Piezo Controller
Camera Mounting Structure
12
UFPAs / Piezo / Piezo Mount Subassembly
• Precision assembly alignments made
with DRS precision alignment equipment
and/or CMM, and tooling
Piezo stage is centered to piezo
mount
UFPA/CMLB assembly mounts to
piezo stage
Radiation shield mounted to front
and thermal straps to the back of
CMLB, help achieve radiometric
accuracy
- Radiation shield helps to
control incident flux
- Thermal Straps and
heater help control UFPA
temperature
Camera electronics mounted off
piezo stage and connected with flex
cables
• 4 UFPAs (each with a butcher block filter
in front of it) mounted with precision
machined shims and optimized epoxy
thickness for final planarity adjustment to
lens image plane
13
UFPA Package Ge Window and MURI Spectral Filters
0
10
20
30
40
50
60
70
80
90
100
2 4 6 8 10 12 14 16 18 20 22 24
Ge Window (Blue Curve) and Butcher Block Spectral Filters Transmission for MURI Instrument
Wavelength (um)
Tran
smis
sio
n (
%)
14
Water Chiller
Heater Control
CMLB Bottom Side
Thermal strap
heaters (2)
UFPA temp control sensors (4)
Thermal strap temp monitors (2)
Forward Lens Heat Sink Aft Lens Heat Sink
Piezo Mount Heat Sink w/ temp monitor (1)
Lens temp monitors (5)
Radiation shield temp monitor (1)
Thermal Control and Monitoring
Thermal Control and Monitoring is Critical to Achieve Desired Radiometric Accuracy.DRS will also Employ TCOMP Algorithms for the Necessary Radiometric Precision.
15
U6160 640x480 UFPA Tailored for MURI
• U6160 640x480 UFPA is in production at DRS• For MURI thermal time constant is being
tailored (lengthened to 20msec) to improve NETD for narrow band operation
• Spectral response adequately covers the spectrum for MURI, but can be extended into the MWIR with a customized AR coated window (Bolometer response with Si window shown below)
• Projected instrument level NETD @300K of <100mK and <60mK projected for LANDSAT TIRS 1 (CWL=10.9um) & TIRS 2 (CWL = 12.05um) bands respectively
640x480 U6160 MicrobolometerArray Package
SEM of 17um Bolometer Pixel
Aspect Ratio of Bolometer’s Serpentine Legs Determine Time Constant
16
MURI IIP Program Summary
• All Hardware is On Order for MURI Radiometer Integration
• DRS has received some Hardware and is Making Progress on Integration of Radiometer
• Incremental Testing of Instrument Will Take Place as we wait on Delivery of Longest Lead Items (i.e. Butcher Block Filters) which are due in 4th Qtrof 2018; Final Instrument Checkout & Calibration in Q1 & Q2 2019
• Making Arrangements for Twin Otter Flight Testing in Summer/Fall of 2019
• On Track for Successful Demonstration of MURI Instrument for Earth Science Applications in 2019
DRS Thanks NASA ESTO for the Opportunity to Build and Demonstrate a PrototypeUncooled Multi Band Radiometer Imager for Future Earth Imaging Applications