NASA Strategic Planning Document: A Comprehensive Plan for the Long-Term Calibration and Validation of Oceanic Biogeochemical Satellite Data NASA/SP–2007–214152 July 2007 Stanford B. Hooker, Charles R. McClain, and Antonio Mannino https://ntrs.nasa.gov/search.jsp?R=20070027283 2018-04-29T05:19:05+00:00Z
Transcript
NASA Strategic Planning Document: A Comprehensive Plan for the Long-Term Calibration and Validation of Oceanic Biogeochemical Satellite Data
NASA/SP–2007–214152
July 2007
Stanford B. Hooker, Charles R. McClain, and Antonio Mannino
Since its founding, NASA has been ded i cat ed to the ad vance ment of aeronautics and space science. The NASA Sci en tifi c and Technical Information (STI) Pro gram Offi ce plays a key part in helping NASA maintain this im por tant role.
The NASA STI Program Offi ce is operated by Langley Re search Center, the lead center for NASA s scientifi c and technical in for ma tion. The NASA STI Program Offi ce pro vides ac cess to the NASA STI Database, the largest col lec tion of aero nau ti cal and space science STI in the world. The Pro gram Offi ce is also NASA s in sti tu tion al mech a nism for dis sem i nat ing the results of its research and de vel op ment ac tiv i ties. These results are published by NASA in the NASA STI Report Series, which includes the following report types:
• TECHNICAL PUBLICATION. Reports of com plet ed research or a major signifi cant phase of research that present the results of NASA pro-grams and include ex ten sive data or the o ret i cal analysis. Includes com pi la tions of sig nifi cant scientifi c and technical data and in for ma tion deemed to be of con tinu ing ref er ence value. NASA s counterpart of peer-re viewed formal pro fes sion al papers but has less stringent lim i ta -tions on manuscript length and ex tent of graphic pre sen ta tions.
• TECHNICAL MEMORANDUM. Scientifi c and tech ni cal fi ndings that are pre lim i nary or of spe cial ized interest, e.g., quick re lease reports, working papers, and bib li og ra phies that contain minimal annotation. Does not contain extensive analysis.
• CONTRACTOR REPORT. Scientifi c and techni-cal fi ndings by NASA-sponsored con trac tors and grantees.
• CONFERENCE PUBLICATION. Collected pa pers from scientifi c and technical conferences, symposia, sem i nars, or other meet ings spon sored or co spon sored by NASA.
• SPECIAL PUBLICATION. Scientifi c, tech ni cal, or historical information from NASA pro grams, projects, and mission, often con cerned with sub-jects having sub stan tial public interest.
• TECHNICAL TRANSLATION. En glish-language trans la tions of foreign sci en tifi c and tech ni cal ma-terial pertinent to NASA s mis sion.
Specialized services that complement the STI Pro-gram Offi ceʼs diverse offerings include cre at ing custom the sau ri, building customized da ta bas es, organizing and pub lish ing research results . . . even pro vid ing videos.
For more information about the NASA STI Pro gram Offi ce, see the following:
• Access the NASA STI Program Home Page at http://www.sti.nasa.gov/STI-homepage.html
• Fax your question to the NASA Access Help Desk at (301) 621-0134
• Telephone the NASA Access Help Desk at (301) 621-0390
• Write to: NASA Access Help Desk NASA Center for AeroSpace In for ma tion 7115 Standard Drive Hanover, MD 21076–1320
National Aeronautics and Space Administration
Goddard Space Flight CenterGreenbelt, Maryland 20771
NASA/SP–2007–214152
July 2007
Stanford B. Hooker, Charles R. McClain, and Antonio ManninoNASA/Goddard Space Flight Center, Greenbelt, Maryland
A Comprehensive Plan for the Long-Term Calibration andValidation of Oceanic Biogeochemical Satellite Data
Available from:
NASA Center for AeroSpace Information National Technical Information Service7115 Standard Drive 5285 Port Royal RoadHanover, MD 21076-1320 Springfield, VA 22161Price Code: A17 Price Code: A10
Stanford B. Hooker, Charles R. McClain, and Antonio Mannino
Stanford B. Hooker, Charles R. McClain, and Antonio Mannino
Abstract
The primary objective of this planning document is to establish a long-term capability for calibrating and vali-dating oceanic biogeochemical satellite data. It is a pragmatic solution to a practical problem based primarilyon the lessons learned from prior satellite missions. All of the plan’s elements are seen to be interdependent, soa horizontal organizational scheme is anticipated wherein the overall leadership comes from the NASA OceanBiology and Biogeochemistry (OBB) Program Manager and the entire enterprise is split into two components ofequal stature: calibration and validation plus satellite data processing. The detailed elements of the activity arebased on the basic tasks of the two main components plus the current objectives of the Carbon Cycle and Ecosys-tems Roadmap. The former is distinguished by an internal core set of responsibilities and the latter is facilitatedthrough an external connecting-core ring of competed or contracted activities. The core elements for the cali-bration and validation component include a) publish protocols and performance metrics; b) verify uncertaintybudgets; c) manage the development and evaluation of instrumentation; and d) coordinate international part-nerships. The core elements for the satellite data processing component are e) process and reprocess multisensordata; f) acquire, distribute, and archive data products; and g) implement new data products. Both componentshave shared responsibilities for initializing and temporally monitoring satellite calibration. Connecting-coreelements include (but are not restricted to) atmospheric correction and characterization, standards and trace-ability, instrument and analysis round robins, field campaigns and vicarious calibration sites, in situ database,bio-optical algorithm (and product) validation, satellite characterization and vicarious calibration, and imageprocessing software. The plan also includes an accountability process, creating a Calibration and ValidationTeam (to help manage the activity), and a discussion of issues associated with the plan’s scientific focus.
1. IntroductionThe global mapping of the oceanic biosphere is accom-
plished through the determination of radiometric quan-tities. Specifically, the values of the spectral radiancesat the top of the atmosphere, from which (after atmos-pheric correction), the spectral radiances emerging fromthe ocean surface, LW (λ), are extracted (λ denotes wave-length). These so-called water-leaving radiances are a crit-ical part of the success of an ocean color—or alternatively,ocean reflectance—satellite mission, which is determinedby the quality of the remote sensing data and the avail-ability of the derived products. The former is provided bya calibration and validation paradigm, and the latter by adata processing capability. Both components require sev-eral important activities, discussed in more detail below,and the need to achieve an agreed upon accuracy requirescooperation between the organizational elements.
Because of the focus on satellite observations, the ulti-mate success and future expansion of the OBB Program isinexorably tied to launching new missions based on novelresearch topics and assuring the quality of the ensuing sat-ellite data. Both of these objectives require effective in-teractions between the scientific research community andthe calibration and validation activity. The plan espousedhere is based on more than just synergism—the goal is tointegrate the two work areas into a single enterprise.
The long-term OBB programmatic requirements are ar-ticulated in an Advanced Science Plan, On the Shores of aLiving Ocean: The Unseen World , which was drafted by
a subset of the scientific community led by the OBB Pro-gram Manager†. The designated mission themes from thisplan, along with the corresponding high-priority researchquestions, highlight the science and mission concepts thecalibration and validation activity must help enable.
The mission themes span a range of scales and applica-tions: a) global separation of pigments and ecosystem com-ponents, b) high spatial and temporal resolution of coastalwaters, c) active assessment of plant physiology and com-position, and d) determination of mixed layer depths. Thecorresponding research questions span equally large scales:
How are oceanic ecosystems and their attendantbiodiversity influenced by climate or environmentalchanges, and how will these evolve over time?How do carbon and other elements transition be-tween oceanic pools and pass through the Earthsystem, and how do biogeochemical fluxes impactthe ocean and planetary climate over time?How (and why) are the diversity and geographi-cal distribution of coastal marine habitats changing,and what are the implications for human health?How do hazards and pollutants impact the hydrog-raphy and biology of the coastal zone and humanactivities, and can the effects be mitigated?
The successful implementation of the science and mis-sion concepts inevitably leads to technology development
† The Advanced Science Plan is available from the following
A Comprehensive Plan for the Long-Term Calibration and Validation of Oceanic Biogeochemical Satellite Data
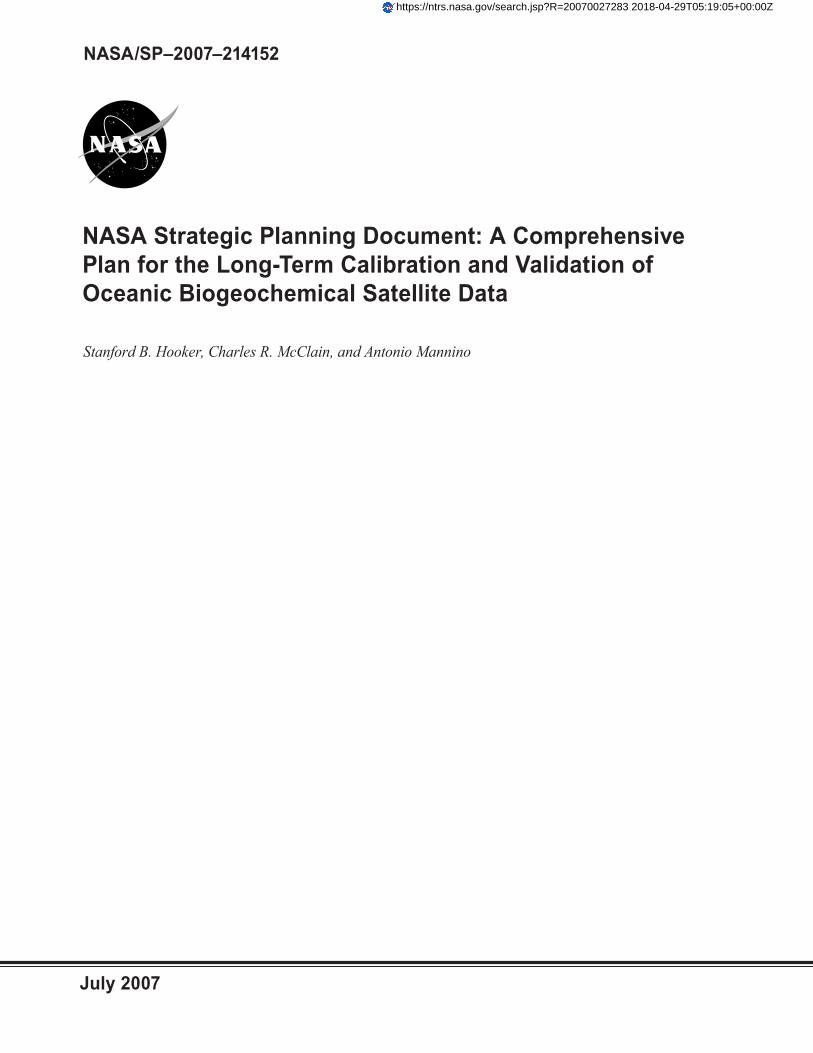
Fig. 1. An integrated depiction of the four scientific research areas (with pictorial representations), theprimary elements of the global calibration and validation activity (center), and the principal programmaticresponsibilities divided into four categories (colored arrows). The satellite missions are discussed in Sect. 1.2.
issues, which further impact the measurements and analy-ses to be performed, as well as the methods and metrologiesto be used. Although this increasing level of detail makes itdifficult to summarize the needed functions, requirements,and objectives in a solitary depiction, it is useful to doso, because all must be fulfilled within a single structure—the OBB Program. An integrated perspective of the mainresearch areas, the primary calibration and validation ele-ments, and the principal programmatic responsibilities areshown in Fig. 1. These three partitions establish the scaleand complexity of what must be undertaken. The remain-der of this document is devoted to how the calibration andvalidation component can be accomplished at the requisitequality to support the other two.
1.1 Calibration and ValidationIn remote sensing applications, “calibration” and “val-
idation” can have alternative meanings to different indi-viduals and communities. Some think of the two as being
distinct and separate activities, while others view themas tightly connected and interdependent. Calibration isfrequently defined as the prelaunch characterization fol-lowed by the continuing analysis of the onboard sensor cal-ibrators once on-orbit operations commence. Validation isusually thought of as the development of data processingschemes (e.g., atmospheric correction and derived geophys-ical quantities), plus the verification of product accuraciesusing ground-truth data. It is not unusual for these ele-ments to be considered part of the same function.
For the purposes of this document, “calibration” is as-sociated with those activities needed to ensure a properprelaunch characterization of the satellite sensor, trackingthe postlaunch sensor performance over time, plus the vi-carious† adjustment of the sensor’s prelaunch calibration
† In this context, “vicarious” simply admits that the preferredrigor of actually calibrating a satellite sensor on orbit is not apractical possibility, so a substitute—but agreeably robust—procedure is being used instead.
2
Stanford B. Hooker, Charles R. McClain, and Antonio Mannino
to match high-quality in situ observations. The “valida-tion” component consists of the myriad tasks required toestablish the efficacy of the data products derived froman algorithm† applied to the observations recorded by aproperly calibrated sensor. A more compact vocabulary issimply to refer to this entire enterprise as “vicarious cal-ibration and product validation,” and, ultimately, as theeven more succinct (and originally ambiguous) “calibrationand validation.”
The overlap between calibration and validation occursbecause both activities require ground-truth—more prop-erly sea-truth—observations. Calibration requires greateraccuracy than validation, so applying data from the latterto the former is usually not considered. The Sea-viewingWide Field-of-view Sensor (SeaWiFS) Project, for exam-ple, requires a radiometric accuracy to within 5% absoluteand 1% relative, and chlorophyll a (Chl a) concentration‡to within 35% over a range of 0.05–50.0 mg m−3 (Hookerand Esaias 1993).
The difficulty in using validation data for calibrationexercises is not associated with less rigorous techniques be-ing used for validation measurements; it is simply a conse-quence of the dynamic range of the two activities—in fact,the same protocols are used in both cases. Vicarious cal-ibration requires a sampling site wherein the contributionof natural variability—atmospheric and oceanic—is mini-mized, so the total uncertainty is properly reduced. Thisis most simply (but not exclusively) satisfied at a site withpredominantly clear properties (skies and waters) with asimplistic particle distribution (exclusively marine aerosolsfor the atmosphere and in-water properties that dependprimarily on Chl a). Such a small range in parameters rep-resents almost a single point in the global expression of adata product, so validation requires multiple sites whereinthe associated natural variability will presumably degradethe uncertainty budget required for calibration.
1.2 Project Offices
Whether or not calibration and validation are inter-twined or separated can also depend on the complexityof the mission. For SeaWiFS, the activities are integratedinto a single function closely coordinated with the data pro-cessing group (made possible because all the elements arecollocated). In the Moderate Resolution Imaging Spectro-
† “Model” would be a more appropriate term, but the sim-plicity of most of the relationships involved—parameter yis obtained directly from observation x using a straightfor-ward and easily implemented mathematical equation (e.g.,the derivation of the chlorophyll a concentration from re-flectance ratios with a polynomial function)—makes “algo-
rithm” a widely accepted choice.
‡ In fact, field-to-satellite comparisons (or matchups) are madewith respect to the total chlorophyll a (TChl a) concentra-tion, denoted [TChl a].
radiometer (MODIS) program§, which reflects the originalEarth Observing System (EOS) paradigm, sensor calibra-tion is handled by one group, the MODIS CharacterizationSupport Team (MCST), and product validation is the re-sponsibility of the (land, ocean, and atmosphere) scienceteams (which may not have a close relationship with theMCST and might use their own vicarious calibrations).
The MODIS program and the structure of the MODISocean team is very similar to the NIMBUS-7 ExperimentTeam (NET) for the Coastal Zone Color Scanner (CZCS).Recently, the NASA Earth Science Program has adopted amore centralized (SeaWiFS) approach under the missions-to-measurements strategy, wherein, a single group handlesthe data processing plus many of the calibration and vali-dation functions. Ocean biogeochemistry was the first dis-cipline to adopt this model with the GSFC Ocean BiologyProcessing Group assuming that role.
Aside from any organizational options, the strategiesfor executing the underlying tasks have also evolved. Forthe purposes of this document, a brief review of the rel-evant programs is appropriate, because this helps defendthe strengths of the recommended approach. In addition,the Advanced Science Plan is embracing a broader set ofscience objectives than before, which must be reflected inthe calibration and validation strategy.
The CZCS was a proof-of-concept mission with mod-est science and data processing goals that were brought tofruition—and greatly exceeded—during the 1980s. Fieldcampaigns for algorithm development were conducted priorto launch in 1978, and postlaunch validation experimentswere concentrated in the first year of operations (Gordon etal. 1980 and 1983). The main problem was characterizingthe degradation of the visible bands without a monitoringcapability. Evans and Gordon (1994) evaluated the decayby assuming constant clear-water radiances, but the les-son was that a robust calibration program spanning theduration of the mission would be needed in the future.
The SeaWiFS and MODIS missions, designed with theCZCS experience in mind, were developed in parallel andleveraged a number of joint developments, e.g., the at-mospheric correction scheme and the Marine Optical Buoy(MOBY) vicarious calibration site (Clark et al. 1997). Asnoted above, the organizational and financial structureswere very different. The SeaWiFS calibration and vali-dation activity (McClain et al. 1992) had a well definedbudget with considerable flexibility in apportioning fundsbetween internal and external components. As a result, thedocumentation of field protocols, the development of newinstruments (e.g., the SeaWiFS Transfer Radiometer andSeaWiFS Quality Monitor), plus the calibration, pigment,and data analysis round robins, were directly supported(Hooker and McClain 2000, and McClain et al. 2004).
§ There are two MODIS instruments, which were launched onthe Terra and Aqua satellites, and are denoted MODIS-Tand MODIS-A, respectively.
3
A Comprehensive Plan for the Long-Term Calibration and Validation of Oceanic Biogeochemical Satellite Data
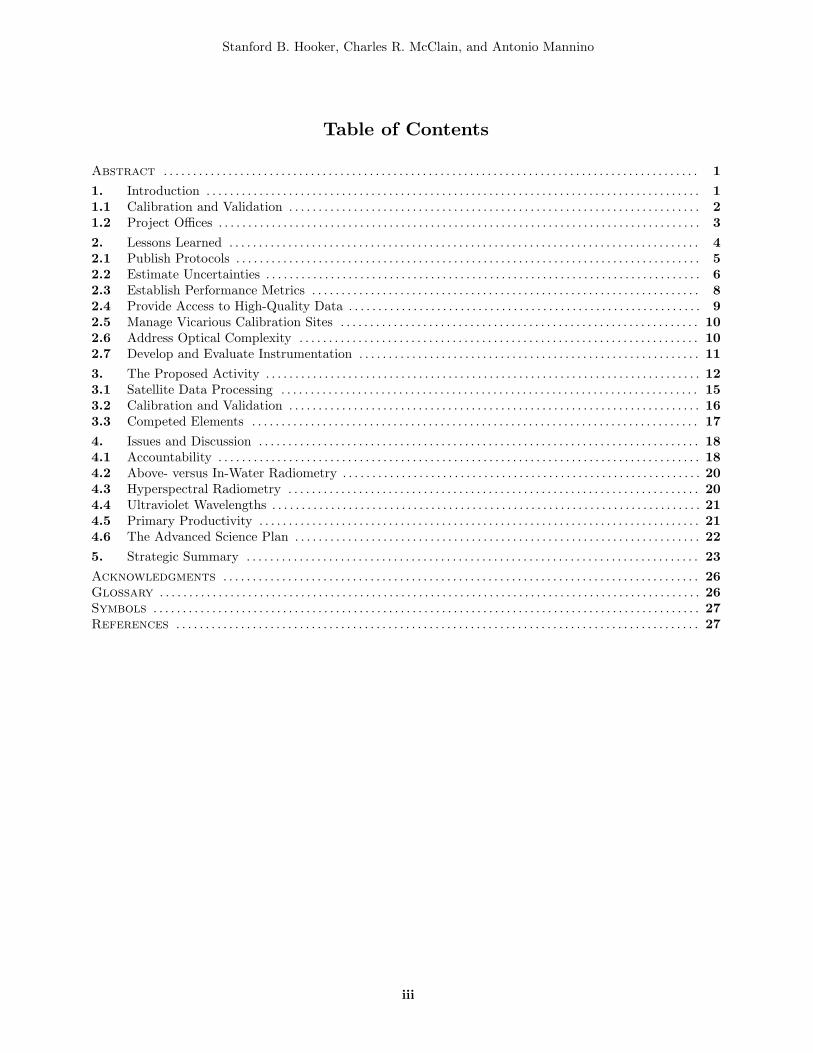
Fig. 2. The normalized radiances (with respect to the first measurement) derived from SeaWiFS images ofthe full Moon. The colored circles correspond to the generalized wavelengths: blue for 412, 443, and 490 nm;green for 510 and 555 nm; red for 670 nm; and black for the near-infrared (NIR) bands 765 and 865 nm.
SeaWiFS did not have a formal instrument team likethe MODIS ocean team (Esaias et al. 1998), and reliedheavily on the latter while supporting additional field worksuch as the Atlantic Meridional Transect (AMT) cruises(Aiken et al. 2000). Both SeaWiFS and MODIS use on-board calibration techniques to track sensor stability—capabilities CZCS did not have, but were outlined by Gor-don (1987), and MOBY is the only data source for adjust-ing the calibration gains after the time dependencies areremoved (Barnes et al. 2001 and Eplee et al. 2001).
The Sensor Intercomparison and Merger for Biologicaland Interdisciplinary Oceanic Studies (SIMBIOS) activitywas not a flight project, but its goal was the intercalibra-tion and product validation of ocean color sensors (Mc-Clain and Fargion 1999, and McClain et al. 2002). Theorganizational structure was a SeaWiFS and MODIS hy-brid, in the sense that it had a project manager and acollocated data analysis and processing group, but it alsohad a science team very similar to the MODIS ocean team(the latter was included in the SIMBIOS science team).SIMBIOS assumed the responsibility of continuing and ex-panding a number of activities initiated by the SeaWiFSprogram at a time when the SeaWiFS budget was rampingdown after launch (as originally planned).
SeaWiFS calibration and validation currently continuesonly at a level needed to support the lunar and solar analy-ses, as well as occasional reprocessings to keep the atmos-pheric correction and bio-optical algorithms up to date.The MODIS ocean team was recompeted in 2003 and isexpected to continue throughout the Aqua and Terra mis-sions. SeaWiFS and MODIS were originally envisioned to
be primary elements of an international effort to develop along-term time series of global satellite observations (Ab-bott et al. 1994), an objective that has been realized. Al-though continuous observations were a stated priority inthe early 1990s, much remained to be learned about pro-ducing a climate data record (CDR), and its importanceto science-quality research (McClain et al. 2006).
Maintaining a CDR time series is a continuing goal andwill depend on whether the National Polar Orbiting En-vironmental Satellite System (NPOESS) Visible and In-frared Imaging Radiometer Suite (VIIRS) delivers high-quality data, because no NASA ocean color mission afterMODIS is approved. Nonetheless, mission concepts con-tinue to be developed and provide needed insights into thecapabilities and requirements for next-generation space-borne sensors, for example, the Global Ocean Carbon,Ecosystems, and Coastal Processes (GOCECP) mission.
2. Lessons LearnedA primary CZCS lesson was that accurately tracking
sensor stability over the course of a mission is essential.Consequently, the SeaWiFS design included solar and lu-nar calibration gains, a solar diffuser, and a strategy formonthly images of the Moon at approximately a 7◦ phaseangle, whereas MODIS incorporated a solar diffuser with astability monitor. Both approaches have proven to be ro-bust, although, years after launch, the methodologies con-tinue to be refined. Figure 2 presents the SeaWiFS lunartime series and shows the degradation in SeaWiFS variessmoothly over time and occurs primarily in the NIR bands
4
Stanford B. Hooker, Charles R. McClain, and Antonio Mannino
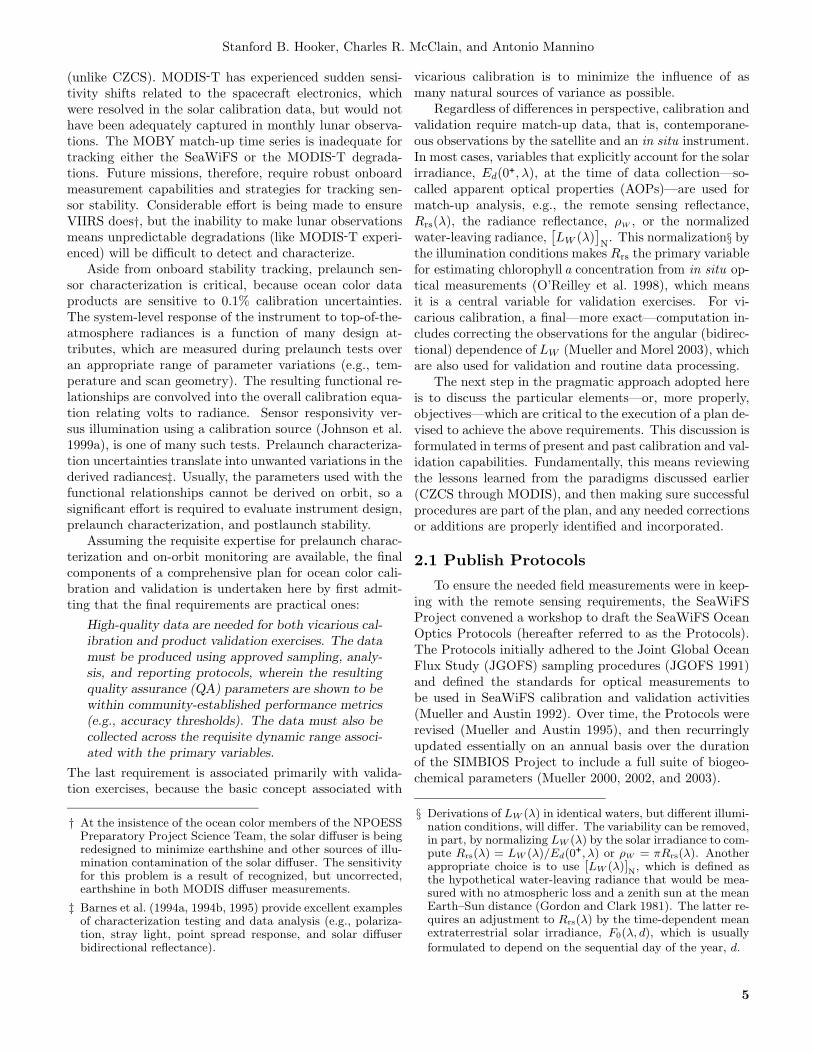
(unlike CZCS). MODIS-T has experienced sudden sensi-tivity shifts related to the spacecraft electronics, whichwere resolved in the solar calibration data, but would nothave been adequately captured in monthly lunar observa-tions. The MOBY match-up time series is inadequate fortracking either the SeaWiFS or the MODIS-T degrada-tions. Future missions, therefore, require robust onboardmeasurement capabilities and strategies for tracking sen-sor stability. Considerable effort is being made to ensureVIIRS does†, but the inability to make lunar observationsmeans unpredictable degradations (like MODIS-T experi-enced) will be difficult to detect and characterize.
Aside from onboard stability tracking, prelaunch sen-sor characterization is critical, because ocean color dataproducts are sensitive to 0.1% calibration uncertainties.The system-level response of the instrument to top-of-the-atmosphere radiances is a function of many design at-tributes, which are measured during prelaunch tests overan appropriate range of parameter variations (e.g., tem-perature and scan geometry). The resulting functional re-lationships are convolved into the overall calibration equa-tion relating volts to radiance. Sensor responsivity ver-sus illumination using a calibration source (Johnson et al.1999a), is one of many such tests. Prelaunch characteriza-tion uncertainties translate into unwanted variations in thederived radiances‡. Usually, the parameters used with thefunctional relationships cannot be derived on orbit, so asignificant effort is required to evaluate instrument design,prelaunch characterization, and postlaunch stability.
Assuming the requisite expertise for prelaunch charac-terization and on-orbit monitoring are available, the finalcomponents of a comprehensive plan for ocean color cali-bration and validation is undertaken here by first admit-ting that the final requirements are practical ones:
High-quality data are needed for both vicarious cal-ibration and product validation exercises. The datamust be produced using approved sampling, analy-sis, and reporting protocols, wherein the resultingquality assurance (QA) parameters are shown to bewithin community-established performance metrics(e.g., accuracy thresholds). The data must also becollected across the requisite dynamic range associ-ated with the primary variables.
The last requirement is associated primarily with valida-tion exercises, because the basic concept associated with
† At the insistence of the ocean color members of the NPOESSPreparatory Project Science Team, the solar diffuser is beingredesigned to minimize earthshine and other sources of illu-mination contamination of the solar diffuser. The sensitivityfor this problem is a result of recognized, but uncorrected,earthshine in both MODIS diffuser measurements.
‡ Barnes et al. (1994a, 1994b, 1995) provide excellent examplesof characterization testing and data analysis (e.g., polariza-tion, stray light, point spread response, and solar diffuserbidirectional reflectance).
vicarious calibration is to minimize the influence of asmany natural sources of variance as possible.
Regardless of differences in perspective, calibration andvalidation require match-up data, that is, contemporane-ous observations by the satellite and an in situ instrument.In most cases, variables that explicitly account for the solarirradiance, Ed(0+, λ), at the time of data collection—so-called apparent optical properties (AOPs)—are used formatch-up analysis, e.g., the remote sensing reflectance,Rrs(λ), the radiance reflectance, ρW , or the normalizedwater-leaving radiance,
[LW (λ)
]N. This normalization§ by
the illumination conditions makes Rrs the primary variablefor estimating chlorophyll a concentration from in situ op-tical measurements (O’Reilley et al. 1998), which meansit is a central variable for validation exercises. For vi-carious calibration, a final—more exact—computation in-cludes correcting the observations for the angular (bidirec-tional) dependence of LW (Mueller and Morel 2003), whichare also used for validation and routine data processing.
The next step in the pragmatic approach adopted hereis to discuss the particular elements—or, more properly,objectives—which are critical to the execution of a plan de-vised to achieve the above requirements. This discussion isformulated in terms of present and past calibration and val-idation capabilities. Fundamentally, this means reviewingthe lessons learned from the paradigms discussed earlier(CZCS through MODIS), and then making sure successfulprocedures are part of the plan, and any needed correctionsor additions are properly identified and incorporated.
2.1 Publish Protocols
To ensure the needed field measurements were in keep-ing with the remote sensing requirements, the SeaWiFSProject convened a workshop to draft the SeaWiFS OceanOptics Protocols (hereafter referred to as the Protocols).The Protocols initially adhered to the Joint Global OceanFlux Study (JGOFS) sampling procedures (JGOFS 1991)and defined the standards for optical measurements tobe used in SeaWiFS calibration and validation activities(Mueller and Austin 1992). Over time, the Protocols wererevised (Mueller and Austin 1995), and then recurringlyupdated essentially on an annual basis over the durationof the SIMBIOS Project to include a full suite of biogeo-chemical parameters (Mueller 2000, 2002, and 2003).
§ Derivations of LW (λ) in identical waters, but different illumi-nation conditions, will differ. The variability can be removed,in part, by normalizing LW (λ) by the solar irradiance to com-pute Rrs(λ) = LW (λ)/Ed(0+, λ) or ρW = πRrs(λ). Anotherappropriate choice is to use [LW (λ)]N, which is defined asthe hypothetical water-leaving radiance that would be mea-sured with no atmospheric loss and a zenith sun at the meanEarth–Sun distance (Gordon and Clark 1981). The latter re-quires an adjustment to Rrs(λ) by the time-dependent meanextraterrestrial solar irradiance, F0(λ, d), which is usually
formulated to depend on the sequential day of the year, d.
5
A Comprehensive Plan for the Long-Term Calibration and Validation of Oceanic Biogeochemical Satellite Data
The Protocols represent a unique accomplishment, anda significant lesson they confirm is that the state of theart is advanced by quantifying methodological uncertain-ties. An uncertainty analysis can only commence if therequisite procedures can be accurately implemented, whichmeans they must be properly documented. Once this in-formation is available, a next-generation capability can bemeasured against the current one to determine whetheror not progress is being made. In addition, an uncertaintyanalysis can show how much of the reported variance is real(and, thus, mostly unavoidable) and how much is artificial(usually removable—or at least reducible).
The utility of a set of Protocols that are endorsed andmaintained by a broader community, therefore, far exceedsthe simple accomplishment of providing the procedures foraccomplishing certain tasks or measurements. As long asthey are a work in progress, updating the Protocols pro-vides a periodic review of the state of the art and givesnew ideas or procedures a forum for evaluation. This op-portunity to discuss and document how the basic tools formeeting calibration and validation requirements are beingsatisfied is a critical element of a successful program.
2.2 Estimate Uncertainties
To maintain internal consistency between calibrationsof in situ radiometers and the satellite sensor, the Sea-WiFS Project (as part of the Protocols) required trace-ability of calibration standards to the National Institute ofStandards and Technology (NIST), which is now a require-ment for all domestic (ocean color) satellite missions. TheProject also implemented a series of SeaWiFS Intercalibra-tion Round-Robin Experiments (SIRREXs) to investigateand minimize uncertainties associated with AOP instru-ments, because the SeaWiFS sea-truth uncertainty budgetcan only be satisfied if each contributing uncertainty is onthe order of 1–2% (Hooker and McClain 2000). As a gen-eralized description, this constitutes so-called 1% radiom-etry ; in other words, uncertainty sources in the calibrateduse of a sensor must be kept at about the 1% level.
In the progression from the first to the third SIRREX(Mueller 1993, Mueller et al. 1994, and Mueller et al. 1996,respectively), uncertainties in the traceability to NIST forintercomparisons of spectral lamp irradiance and sphereradiance improved from 7–8% to 1–2%, respectively. Thefourth through seventh SIRREX activities further investi-gated laboratory and field protocols (Johnson et al. 1996,Johnson et al. 1999b, Riley and Bailey 1998, and Hooker etal. 2002, respectively), and showed calibration uncertain-ties of about 2–3% were routinely achievable if the Pro-tocols were carefully executed†. More recently, SIRREX-8revealed the immersion factors supplied by a commercial
† The SIMBIOS Radiometric Intercomparison (SIMRIC) ac-tivity largely confirmed this level of achievement (Meister et
al. 2002 and 2003).
manufacturer were more than 10% in error at some wave-lengths (Zibordi et al. 2002a), and there are other examplesof the need for independent instrumentation evaluations(e.g., Mueller 1995 and Hooker and Maritorena 2000).
The uncertainties associated with data processing aretied to the original instrument characterizations and sam-pling protocols, but there are subjective aspects that arenot completely resolved by a single protocol. The firstSeaWiFS Data Analysis Round Robin (DARR-94) investi-gated the uncertainties in the data processing of in-wateroptical profiles and showed differences in commonly usedmethods for determining primary optical parameters wereabout 3–4% of the aggregate mean estimate (Siegel et al.1995). The focus of the second DARR (DARR-00) was todetermine if these results could be improved upon (Hookeret al. 2001). In terms of overall spectral averages, many ofthe DARR-00 intercomparisons were to within 2.5%, andif the processing options were made as similar as possible,agreement to within less than 1% was routinely possiblefor two of the processors. Much higher uncertainties weredocumented, however, and many of these were associatedwith data products critical to calibration and validation.
Optical parameters do not account for all of the valida-tion requirements. The proper determination of [TChl a]is central to the objectives of all ocean color missions.The SeaWiFS High Performance Liquid Chromatography(HPLC) Analysis Round-Robin Experiment (SeaHARRE)investigated the uncertainties in the quantitation of marinepigments (Hooker et al. 2000a and Hooker et al. 2005). TheSeaHARRE-1 results (Claustre et al. 2004) showed the de-termination of [TChl a] was to within 8% (well within re-mote sensing requirements‡), whereas the quantitation ofthe common carotenoids was less accurate and on the orderof 24%. The average SeaHARRE-2 [TChl a] uncertaintywas 11.4%, but only 7.8% for a quality-assured subset offour methods (denoted A′). Using a QA procedure basedon a limit of quantitation (LOQ) threshold and choosingthe A′ subset as the proxy (or reference) for truth in theuncertainty calculations, reduced the average [TChl a] un-certainty to 5.9% (and 17.2% for the other laboratories).Applying an LOQ threshold to the SeaHARRE-1 data re-sulted in a similar uncertainty in [TChl a] of 5.5%.
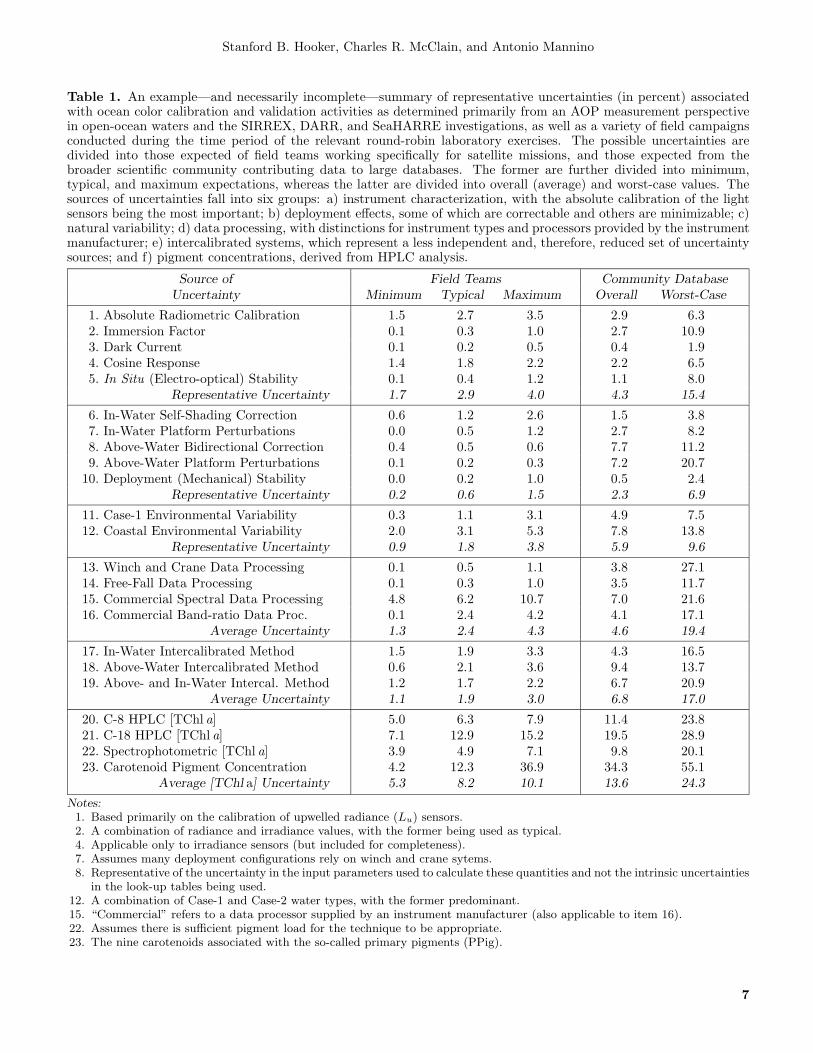
The recurring (essentially annual) inquiries into uncer-tainties establish an increasingly detailed calibration andvalidation uncertainty budget, which is presented in Ta-ble 1. The entries show the difficulty of maintaining theaforementioned radiometric 1% uncertainty requirements,as well as the ensuing increase in variance when data froma diverse set of contributors are used for algorithm develop-ment or validation activities. This is an important point,
‡ Based on an agreement to within 35% (the SeaWiFS require-ment) and assuming the sources of uncertainty combine in-dependently (i.e., in quadrature), an upper accuracy range
of about 25% is probably acceptable,√
352/2, although 15%
would presumably permit significant algorithm refinement.
6
Stanford B. Hooker, Charles R. McClain, and Antonio Mannino
Table 1. An example—and necessarily incomplete—summary of representative uncertainties (in percent) associatedwith ocean color calibration and validation activities as determined primarily from an AOP measurement perspectivein open-ocean waters and the SIRREX, DARR, and SeaHARRE investigations, as well as a variety of field campaignsconducted during the time period of the relevant round-robin laboratory exercises. The possible uncertainties aredivided into those expected of field teams working specifically for satellite missions, and those expected from thebroader scientific community contributing data to large databases. The former are further divided into minimum,typical, and maximum expectations, whereas the latter are divided into overall (average) and worst-case values. Thesources of uncertainties fall into six groups: a) instrument characterization, with the absolute calibration of the lightsensors being the most important; b) deployment effects, some of which are correctable and others are minimizable; c)natural variability; d) data processing, with distinctions for instrument types and processors provided by the instrumentmanufacturer; e) intercalibrated systems, which represent a less independent and, therefore, reduced set of uncertaintysources; and f) pigment concentrations, derived from HPLC analysis.
Source of Field Teams Community DatabaseUncertainty Minimum Typical Maximum Overall Worst-Case
Average [TChl a] Uncertainty 5.3 8.2 10.1 13.6 24.3
Notes:1. Based primarily on the calibration of upwelled radiance (Lu) sensors.2. A combination of radiance and irradiance values, with the former being used as typical.4. Applicable only to irradiance sensors (but included for completeness).7. Assumes many deployment configurations rely on winch and crane sytems.8. Representative of the uncertainty in the input parameters used to calculate these quantities and not the intrinsic uncertainties
in the look-up tables being used.12. A combination of Case-1 and Case-2 water types, with the former predominant.15. “Commercial” refers to a data processor supplied by an instrument manufacturer (also applicable to item 16).22. Assumes there is sufficient pigment load for the technique to be appropriate.23. The nine carotenoids associated with the so-called primary pigments (PPig).
7
A Comprehensive Plan for the Long-Term Calibration and Validation of Oceanic Biogeochemical Satellite Data
Table 2. The performance metrics for the four categories established for validating the determination of marinepigments using an HPLC method: concentration (average precision, ξ, and accuracy, |ψ|, for TChl a and theprimary pigments, PPig†); separation (minimum resolution, Rs, and average retention time precision, ξt
R);
average injection precision, ξinj (the average of an early- and late-eluting pigment standard, e.g., Perid andChl a); and calibration (the average absolute percent differences of the residuals to the calibration fit for Chl a,|ψ|res, and the precision of the dilution devices, ξcal). The PPig and TChl a performance metrics are based onusing the analysis of a mixture of laboratory standards and replicate field samples with approximately equalweights applied to each (remembering that uncertainties are assumed to combine in quadrature and that thelatter presupposes the inclusion of replicate filter collection during field sampling). The corresponding valuesfor the Horn Point Laboratory (HPL) method (Van Heukelem and Thomas 2001) are given as an example, theoverall performance of which is considered “state-of-the-art,” because the average score of the weights is 3.7,(4 + 4 + 4 + 3 + 3 + 4 + 4 + 4 + 3 + 4)/10.
Performance Weight, TChl a PPig Separation‡ Injection§ (ξinj) Calibration¶Category, and Score ξ |ψ| ξ |ψ| Rs ξt
† The primary pigments are total chlorophyll a, b, and c, plus nine carotenoids (Hooker et al. 2005).
‡ Rs is determined from a critical pair involving a primary pigment. The retention time precision entries are computedfrom coefficient of variation values based on sequential replicate injections of pigments identified in a mixture of pigmentstandards. In the absence of a diverse set of early- through late-eluting pigments, a practical alternative is to computeξt
Rusing Perid, Fuco, Diadino, Chl a, and ββ-Car based on three sequential injections.
§ The ξinj terms are calculated from the average of replicate injections of an early- and late-eluting pigment in the samerun (Perid is chosen to include the possible effects of peak assymetry, which is not presented as a separate parameter).
¶ The |ψ|res values are based on calibration points within the range of concentrations typical of the SeaHARRE-2 fieldsamples. To determine this metric for an arbitrary sample set, |ψ|res is computed using those calibration points withinthe range of concentrations expected in the field samples to be analyzed.
because both types of work proceed most effectively whenthe data dispersion is natural and not artificial. In the ab-sence of a QA parameter or a performance metric, a mix-ture of high quality to worst-case data are brought togetherwith no objective way to properly separate them.
2.3 Establish Performance Metrics
Performance metrics are a powerful product of an in-vestigation into uncertainties, because they have the po-tential of removing the burden of maintaining an overlydiverse set of protocols (that have to be continually up-dated) or agreeing on a single protocol that satisfies thecurrent suite of community problems. Community prior-ities will necessarily evolve, and at times rather rapidly,so it is perhaps appealing to be able to set performancemetrics for each problem rather than revise one or moreapproved methods for each problem. The metrics can beapplied to any candidate methodology, and provide all theevaluation criteria needed to determine whether or not itis suitable for the applicable task.
For marine pigment concentrations, the community metpart of the performance-based burden, because it agreedon an accuracy metric for Chl a concentration, but therewas no consensus for any other pigment or criteria other
than accuracy. Consequently, the SeaHARRE participantsarbitrarily adopted the Chl a metric for all data products,and developed a set of performance criteria for all the pig-ments, which are presented in Table 2 as an example ofwhat an approach based on performance metrics mightlook like. The four different category labels were selectedfor convenience, and simply provide a scale of capabili-ties. In some cases, this score might coincide with one ofthe chosen categories, like “semiquantitative,” but in othercases there might be reasons for a separate “validated”category. This language was not part of the HPLC work,because the use and application of HPLC methods is moreextensive than the narrower ocean color (marine pigment)perspective adopted for the SeaHARRE activities.
Each category in a performance metric is assigned aweight and score, so the overall capability of a method isbased on summing the applicable weights for each perfor-mance parameter, dividing by the number of parameters,and comparing the result to the category scores. This pro-cess permits any method to be evaluated against a) an-other method that is already properly validated, and b) thestated requirement for the type of work being pursued. Forexample, if product validation requires “semiquantitative”data, then a method with an overall score of 1.5 or more,would be suitable for the task. The classification could
8
Stanford B. Hooker, Charles R. McClain, and Antonio Mannino
also be recorded when data are submitted to a database,so future users could use only those data in keeping withtheir research objectives. In other words, if only “state-of-the-art” data are applicable, then the database can besearched for only this quality of data.
As long as there is some range in performance thresh-olds and they are set so most methods qualify for the mid-dle portion, the use of metrics allows analysts to under-stand which criteria associated with their individual meth-ods need to be enhanced to advance the overall capabil-ity of their method. In some cases, this will be a ratherstraightforward exercise of discovering which procedurescan be improved by using more accurate components ortechniques; in other cases, the development of new ap-proaches might be needed to overcome long-standing limi-tations. The latter represents new research that might notoccur in the absence of a performance requirement.
Because performance metrics provide a quantitative as-sessment of quality, they can be used to establish what con-stitutes a properly validated capability within each subcat-egory (e.g., calibration) or across an entire method (e.g.,the HPL Method). Establishing the individual parame-ters and scores is by necessity quantitative, but the de-tails of the underlying work remains hidden at the scoringlevel. Consequently, the step-by-step best practice, whichis frequently presented in a protocol, is not available in astrictly performance-based approach. This might not beconsidered a significant loss of information for experiencedanalysts, but for new practitioners, it represents an impor-tant reason for maintaining detailed protocols. Protocols,uncertainty budgets, and performance metrics represent anatural progression: protocols are a tool to define the un-certainties (as expressed in this document), that will even-tually lead to performance metrics, that will ultimatelyallow for any protocol to be exclusively evaluated by themetrics.
2.4 Provide Access to High-Quality Data
Ensuring access to high-quality data is an ongoing re-quirement that is expressed as a diversity of tasks in avariety of program functions. The diversity is driven bythe concept of “access,” but within the context of facilita-tion. What this means is any group with the responsibilityof providing the scientific community with access to thedata needed to fulfill a set of research objectives must beprepared to facilitate the procedures used to gain access.
In a straightforward sense, access to in situ data is sat-isfied with a simple archive of all the data sets relevantto the entire calibration and validation activity (Hookeret al. 1994). Inevitably, the utility of an archive is bestexploited by including the retrieval of historical data sets,which is quickly followed by the implementation of qualitycontrol, documentation, and cataloging procedures. Theseenhancements place continuing programming requirements
on maintaining a suitable database structure for the evolv-ing complexity of the archive, as well as the evolving so-phistication of the user-friendly interface (Werdell et al.2003).
Access to high-quality satellite data is usually a moresophisticated undertaking, because of the volume of infor-mation involved. When more than one satellite is in opera-tion, or if multiple missions have been archived, an efficientmechanism is needed to acquire, process, and reprocessthe data. Remembering that the proper initialization ofthe first data are collected after launch, plus the contin-uing application of the atmospheric correction algorithmare inherent functions. The corresponding products mustbe distributed and archived, all the while being temporallymonitored for any signs of satellite calibration problems.Ultimately, the user community is only satisfied if an ade-quate capability to browse and order data is also available.
The programming needs for facilitated data access canextend to a variety of sophisticated requirements. The Sea-WiFS Project, for example, determined satellite data isbest exploited if user-friendly, end-to-end processing toolsfor the most common computer systems were made avail-able by the Project. The outgrowth of this undertakingwas the SeaWiFS Data Analysis System (SeaDAS), whichis a simplified version of the operational processing system(Fu et al. 1996 and Baith et al. 2001). SeaDAS was pri-marily supported by separate funding from the OBB Pro-gram, but required additional Project involvement and re-sources (hardware, system administration, etc.). SeaDASwould not have been possible, however, without a closeworking relationship between the SeaDAS team and theProject staff who had a detailed understanding of the mul-tiple levels of processing codes, which are incorporated intoSeaDAS.
One lesson from the DARR activity discussed earlierwas instrument manufacturers are not necessarily the mostreliable sources for high-quality in situ data processors.Furthermore, the experiences gained in extensive field cam-paigns, like the AMT program (Aiken et al. 2000), showedin situ data are as likely to require archival reprocessingas satellite data. In the case of the AMT data, this wasdriven by the evolving understanding of instrument un-certainties, like the characterization of immersion factors.One way to ensure the data in an archive are kept at thesame quality level is to reprocess all the applicable dataonce this need is apparent. Developing in situ data pro-cessors, first for AOPs and then for inherent optical prop-erties (IOPs) is not as daunting a requirement as it mightfirst seem, because some calibration and validation dataalready have a single point of processing (and, thus, repro-cessing). The SeaWiFS Photometer Revision for IncidentSurface Measurements (SeaPRISM) data, for example, areprocessed and made available by the Aerosol Robotic Net-work (AERONET), which maintains sun photometer sitesaround the world (Holben et al. 1998).
9
A Comprehensive Plan for the Long-Term Calibration and Validation of Oceanic Biogeochemical Satellite Data
Another way to ensure the data in an archive are ofequal quality is to have only one data source. HPLC pig-ment analyses for many NASA investigators, for example,are provided by a single laboratory, as part of a contracted(but competed) service that began during the SIMBIOStime frame (Van Heukelem et al. 2002). A potential pit-fall of this approach is any biases or problems associatedwith the central facility will corrupt a significant amountof data. An accepted way to prevent the likelihood of thelatter is to make sure the chosen laboratory has a robustQA capability (including traceability to the proper stan-dards, participation in analysis round robins, etc.) andsatisfies an agreed upon performance metric†.
2.5 Manage Vicarious Calibration Sites
As discussed earlier, the SeaWiFS and MODIS vicar-ious calibration strategies were based on a single site inconjunction with accurately tracking sensor stability us-ing onboard (lunar and solar) calibration techniques. Theviability of this approach depends on additional assump-tions such as knowledge of the polarization sensitivity andhow it changes over time. In the case of SeaWiFS, the po-larization scrambler minimizes this effect and because thefore optics (telescope, scrambler, and half-angle mirror) areprotected by the telescope housing, changes in polarizationsensitivity are likely to be small. In the case of MODIS,which has significant polarization sensitivity, the scan mir-ror is exposed and the reflectivity of the mirror has changedappreciably. This implies that the polarization sensitivityhas also changed, to some degree; other properties like re-sponse versus scan (RVS) have also changed.
The ability to compare contemporaneous SeaWiFS andMODIS observations (Franz et al. 2005) allowed refine-ments to the polarization and RVS corrections for MODISthat would not have been possible without SeaWiFS, al-though no methodology for tracking changes in MODISpolarization sensitivity has been developed. For VIIRS,there will only be the onboard solar diffuser (plus stabilitymonitor), very limited lunar calibration data, and what-ever field data are available to track sensor performance.Given that effects like polarization sensitivity are a strongfunction of solar and sensor viewing geometries, a singlecalibration site will bias the vicarious calibration as a meanvalue for the specific range of geometries associated withthe latitude of the site. Consequently, a network of sitesare needed to span the full range of latitudes being ob-served. Because the calibration of the spaceborne sensorneeds to be accurate at the 0.2% level, the calibration sitesmust also be intercalibrated at this level.
† Originally, the Center for Hydro-Optics and Remote Sensing(CHORS) provided HPLC analyses for the OBB Program,but during SeaHARRE-3, significant problems were discov-ered with the CHORS method. Since then, HPL has beencontracted for these services.
For sensors that do not tilt, MODIS showed the loca-tion of a single calibration site at a low latitude, even fornon-noontime orbits, is severely affected by sun glint dur-ing the summer months, which reduces the number of vi-carious calibration matchups. While sun glint can be mod-eled and removed rather well for moderate contaminationlevels, it is highly polarized, making accurate sensor char-acterization even more essential. In the present SeaWiFSand MODIS processing, much of the glint-contaminatedportions of the data are retrieved, but MODIS saturatesin the NIR bands making the data unusable. It should benoted that the VIIRS 748 nm atmospheric correction bandhas a single gain and will saturate in sun glint.
One approach to achieving the needed level of consis-tency in vicarious calibration is to have a field networkthat uses a common instrument design, a common deploy-ment strategy, a common data analysis methodology, andcommon calibration standards. The latter should includethe active involvement of qualified personnel from the in-stitution maintaining the calibration standards, and thenetwork should be managed by the same group to ensurethese practices are enforced. The AERONET is a goodexample of a large network maintained under the steward-ship of one group but with an international participation.The distribution of sites requires local logistical support,access to sites, routine site and instrument servicing, etc.These collaborations need to be resolved at the interna-tional agency level with formal agreements. An interna-tional steering or advisory group, which includes represen-tatives from the nations hosting the sites and their con-tributing space agencies, is also needed.
Regardless of the chosen vicarious calibration approach,all of the collected data need to be publicly available, forexample, through the SeaWiFS Bio-Optical Archive andStorage System (SeaBASS). This transparency is needednot only to permit other investigators to scrutinize thequality of the data, but also so they can pursue alternativeresearch inquiries. The development of new algorithms andtheir attendant data products, for example, might requirea different vicarious calibration procedure, perhaps tied toa particular atmospheric correction scheme and radiationtransfer code, than what the overall activity is using. Ingeneral, it is always rewarding to facilitate the use of di-verse techniques, because intercomparison of all applicablemethods usually leads to the discovery of problems whosecorrection improves the overall capability.
2.6 Address Optical ComplexityA significant challenge for future ocean color research
will be to maintain the level of success achieved in deep-ocean (Case-1‡) waters in the coastal ocean and marginal
‡ By definition, the optical properties of Case-1 waters aresolely determined by the phytoplankton and its derivativeproducts (Morel and Prieur 1977), whereas Case-2 opticalproperties are also determined by other material, e.g., fromterrestrial or bottom origin.
10
Stanford B. Hooker, Charles R. McClain, and Antonio Mannino
seas, which means the influence of dissolved and particu-late constituents will be increasingly important. In thesemore predominantly Case-2 waters with significant ver-tical structure and optical complexity, AOP above-watermethods are likely to be superior to in-water AOP mea-surements, because they can measure the surface layerdirectly without instrument shading, and surface pertur-bation problems are easily removed—although platformshading and reflection sources must be properly minimized(Hooker and Zibordi 2005).
Dissolved and particulate constituents were not a sig-nificant part of the Case-1 investigations discussed above,because SeaWiFS and MODIS were designed for Case-1waters, and the principal water components were assumedto covary; in fact, in keeping with the definition of Case-1waters, the primary contribution was simply the marinephytoplankton. This does not mean the large effort ex-pended in the open ocean is not applicable to the follow-onproblem set. Indeed, the proper perspective is to use thelessons learned in the optically simpler Case-1 environmentto establish a starting point, or foundation, for investigat-ing the optically more complex Case-2 environment.
2.7 Develop and Evaluate InstrumentationAs mentioned earlier, the quantification of uncertain-
ties demands an evolving understanding of measurementuncertainties, which requires detailed evaluations of instru-ment characterizations. This evolution leads naturally tothe development of modified designs from existing tech-nologies or completely new concepts, which steadily ad-vance the state of the art. The former is potentially themore attractive, because if commercial off-the-shelf hard-ware (COTS) can be successfully adapted to a calibrationand validation requirement, a significant amount of devel-opment cost (and time) is saved.
The SeaWiFS and SIMBIOS projects invested directlyin instrument evaluation and development, which led tomany important accomplishments. Two of the more no-table, which are directly applicable to the plan presentedhere, are the aforementioned SeaPRISM capability and theBouee pour l’acquisition de Series Optiques a Long Terme†(BOUSSOLE) project. Both are examples of using COTShardware for calibration and validation requirements.
SeaPRISM is a modified fully-autonomous, commercialsun photometer, used by AERONET, which measures thesea surface and sky after performing the normal sun andsky measurements needed for sun photometry. A proto-type unit was developed in partnership with the Joint Re-search Centre‡ (JRC) and field commissioned at the Ac-
† Literally translated from French as the “buoy for the acquisi-tion of a long-term optical series.” “Boussole” is the Frenchword for “compass.”
‡ The principal investigator (PI) who worked with CIMELElectronique (Paris, France), the manufacturer of the sunphotometer, to make sure the sampling protocol would pro-duce the highest-quality data was Giuseppe Zibordi.
qua Alta Oceanographic Tower (AAOT) in the northernAdriatic Sea (Hooker et al. 2000b). The prototype wasassessed for the validation of remote sensing radiometricproducts in coastal waters (Zibordi et al. 2002b), and aone-year time series of data were compared with simul-taneous in-water measurements for a wide variety of sunelevations and environmental conditions. The average rel-ative percent difference§ (RPD) values between the above-and in-water LW (λ) determinations were less than 2% inthe 412–555 nm spectral interval (Zibordi et al. 2004).
The good validation results achieved with SeaPRISMled to a separate investigation of using the instrument forvicarious calibration. The gain factors computed from aone-year demonstration phase data are presented in Ta-ble 3 (remembering that the gain factors are the aforemen-tioned adjustments to the responses of the SeaWiFS chan-nels to force agreement with the in situ data). The Sea-PRISM prototype did not have a complete overlap with thesatellite channels, because AERONET required a certainminimum number of sun photometer wavelengths (this re-striction has been dropped). The close agreement betweenthe SeaWiFS vicarious gains computed from SeaPRISMand MOBY data (even though the SeaPRISM data arefrom a coastal deployment site), shows how well a low-costalternative methodology based on COTS hardware mightwork, but it is not the only applicable example.
Table 3. The vicarious calibration gain factors forSeaWiFS determined using SeaPRISM and MOBY.The relative percent difference, RPD, is computedwith MOBY as the reference value.
Unlike SeaPRISM, the BOUSSOLE project was specifi-cally established to collect vicarious calibration data and isan alternative in-water buoy developed in partnership withthe Laboratoire d’Oceanographie de Villefranche¶ (LOV).The innovative aspects of the design include a taught-cable mooring, which does not require a separate surfaceflotation buoy, and a tubular transparent-to-swell super-structure ensures a minimal shading perturbation from themooring plus a very stable mounting system for the instru-ments (Antoine et al. 2006).
§ The RPD is defined as 100(X − Y )/Y , where X is an in-dependent observation, Y is the dependent reference value,and the factor of 100 yields units of percent.
¶ The PI who conceived the buoy and worked with Satlantic,Inc. (Halifax, Canada), the manufacturer of the radiometers,to make sure the optical measurements would be of the high-est quality was David Antoine.
11
A Comprehensive Plan for the Long-Term Calibration and Validation of Oceanic Biogeochemical Satellite Data
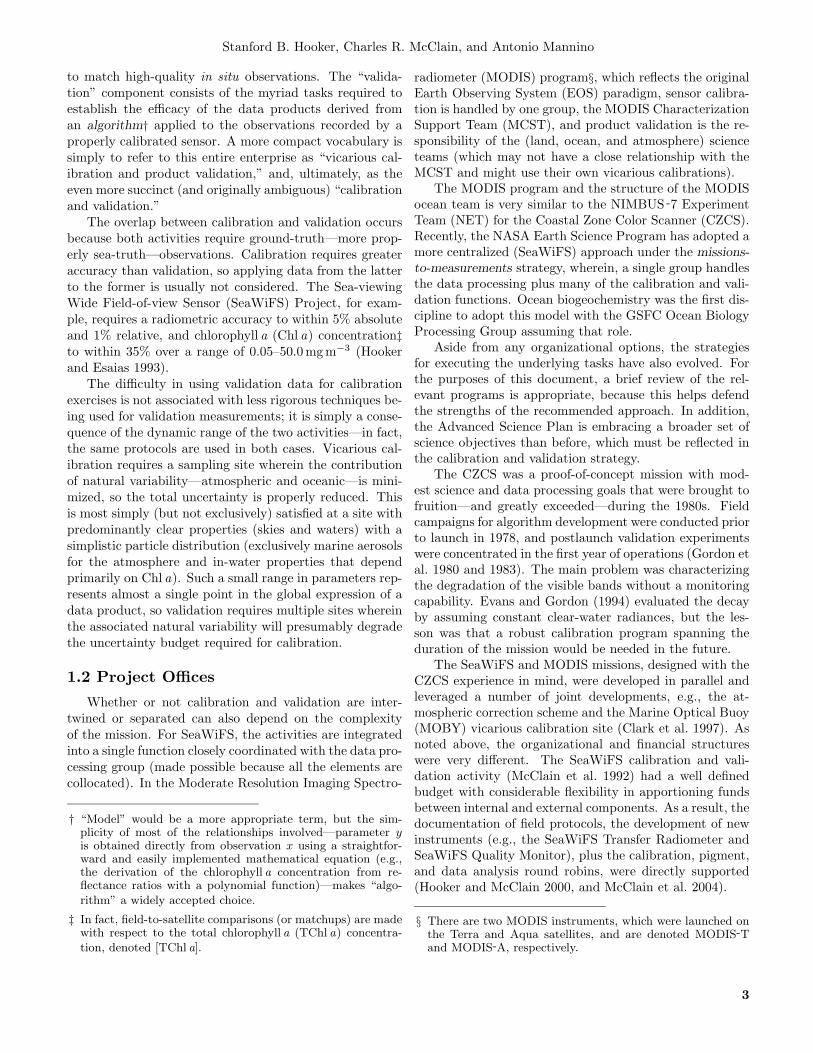
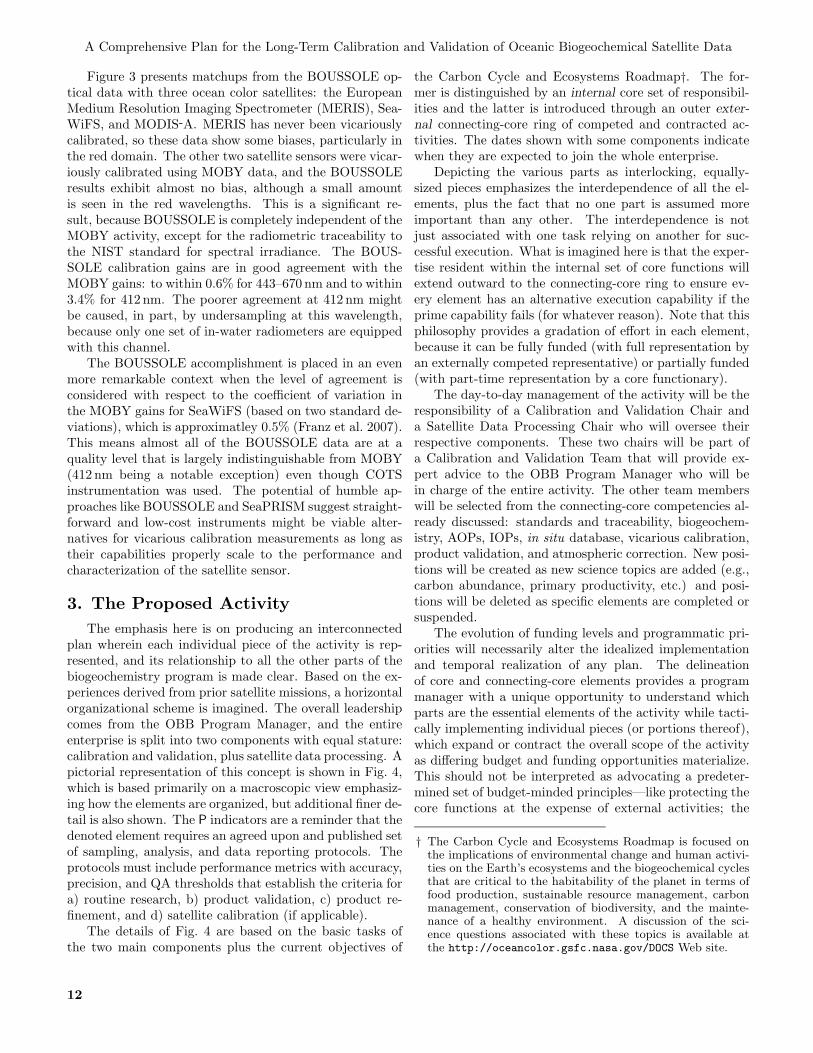
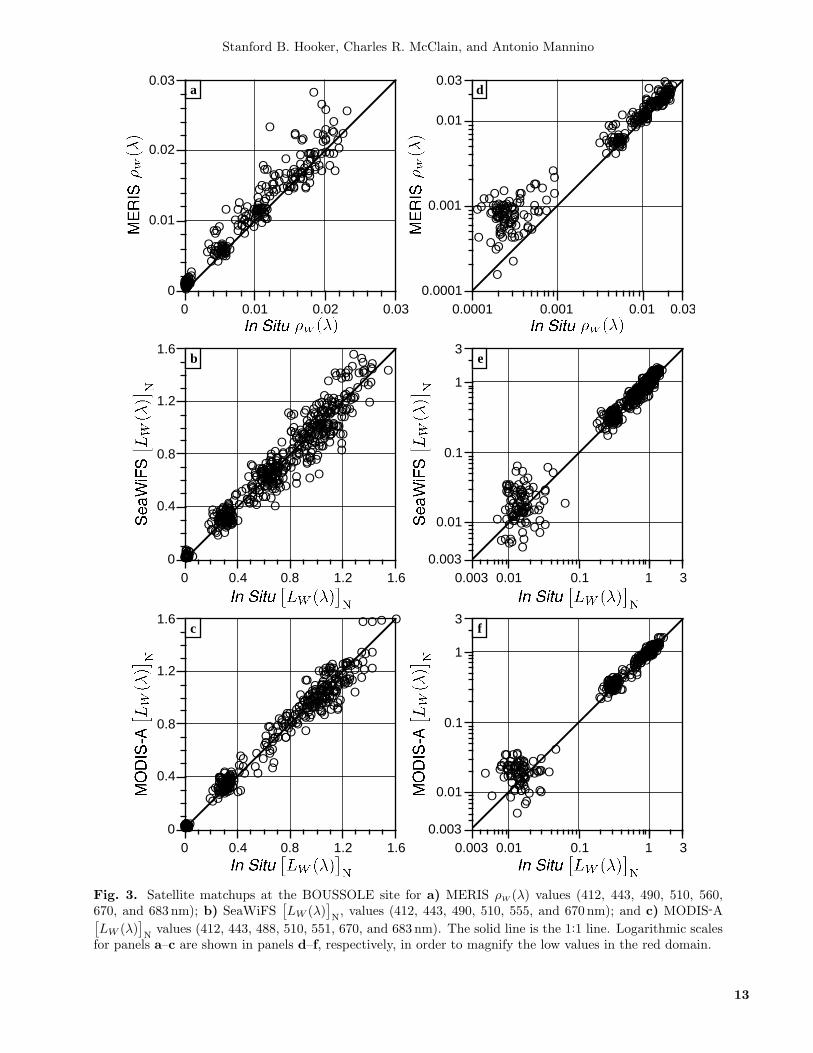
Figure 3 presents matchups from the BOUSSOLE op-tical data with three ocean color satellites: the EuropeanMedium Resolution Imaging Spectrometer (MERIS), Sea-WiFS, and MODIS-A. MERIS has never been vicariouslycalibrated, so these data show some biases, particularly inthe red domain. The other two satellite sensors were vicar-iously calibrated using MOBY data, and the BOUSSOLEresults exhibit almost no bias, although a small amountis seen in the red wavelengths. This is a significant re-sult, because BOUSSOLE is completely independent of theMOBY activity, except for the radiometric traceability tothe NIST standard for spectral irradiance. The BOUS-SOLE calibration gains are in good agreement with theMOBY gains: to within 0.6% for 443–670 nm and to within3.4% for 412 nm. The poorer agreement at 412 nm mightbe caused, in part, by undersampling at this wavelength,because only one set of in-water radiometers are equippedwith this channel.
The BOUSSOLE accomplishment is placed in an evenmore remarkable context when the level of agreement isconsidered with respect to the coefficient of variation inthe MOBY gains for SeaWiFS (based on two standard de-viations), which is approximatley 0.5% (Franz et al. 2007).This means almost all of the BOUSSOLE data are at aquality level that is largely indistinguishable from MOBY(412 nm being a notable exception) even though COTSinstrumentation was used. The potential of humble ap-proaches like BOUSSOLE and SeaPRISM suggest straight-forward and low-cost instruments might be viable alter-natives for vicarious calibration measurements as long astheir capabilities properly scale to the performance andcharacterization of the satellite sensor.
3. The Proposed ActivityThe emphasis here is on producing an interconnected
plan wherein each individual piece of the activity is rep-resented, and its relationship to all the other parts of thebiogeochemistry program is made clear. Based on the ex-periences derived from prior satellite missions, a horizontalorganizational scheme is imagined. The overall leadershipcomes from the OBB Program Manager, and the entireenterprise is split into two components with equal stature:calibration and validation, plus satellite data processing. Apictorial representation of this concept is shown in Fig. 4,which is based primarily on a macroscopic view emphasiz-ing how the elements are organized, but additional finer de-tail is also shown. The P indicators are a reminder that thedenoted element requires an agreed upon and published setof sampling, analysis, and data reporting protocols. Theprotocols must include performance metrics with accuracy,precision, and QA thresholds that establish the criteria fora) routine research, b) product validation, c) product re-finement, and d) satellite calibration (if applicable).
The details of Fig. 4 are based on the basic tasks ofthe two main components plus the current objectives of
the Carbon Cycle and Ecosystems Roadmap†. The for-mer is distinguished by an internal core set of responsibil-ities and the latter is introduced through an outer exter-nal connecting-core ring of competed and contracted ac-tivities. The dates shown with some components indicatewhen they are expected to join the whole enterprise.
Depicting the various parts as interlocking, equally-sized pieces emphasizes the interdependence of all the el-ements, plus the fact that no one part is assumed moreimportant than any other. The interdependence is notjust associated with one task relying on another for suc-cessful execution. What is imagined here is that the exper-tise resident within the internal set of core functions willextend outward to the connecting-core ring to ensure ev-ery element has an alternative execution capability if theprime capability fails (for whatever reason). Note that thisphilosophy provides a gradation of effort in each element,because it can be fully funded (with full representation byan externally competed representative) or partially funded(with part-time representation by a core functionary).
The day-to-day management of the activity will be theresponsibility of a Calibration and Validation Chair anda Satellite Data Processing Chair who will oversee theirrespective components. These two chairs will be part ofa Calibration and Validation Team that will provide ex-pert advice to the OBB Program Manager who will bein charge of the entire activity. The other team memberswill be selected from the connecting-core competencies al-ready discussed: standards and traceability, biogeochem-istry, AOPs, IOPs, in situ database, vicarious calibration,product validation, and atmospheric correction. New posi-tions will be created as new science topics are added (e.g.,carbon abundance, primary productivity, etc.) and posi-tions will be deleted as specific elements are completed orsuspended.
The evolution of funding levels and programmatic pri-orities will necessarily alter the idealized implementationand temporal realization of any plan. The delineationof core and connecting-core elements provides a programmanager with a unique opportunity to understand whichparts are the essential elements of the activity while tacti-cally implementing individual pieces (or portions thereof),which expand or contract the overall scope of the activityas differing budget and funding opportunities materialize.This should not be interpreted as advocating a predeter-mined set of budget-minded principles—like protecting thecore functions at the expense of external activities; the
† The Carbon Cycle and Ecosystems Roadmap is focused onthe implications of environmental change and human activi-ties on the Earth’s ecosystems and the biogeochemical cyclesthat are critical to the habitability of the planet in terms offood production, sustainable resource management, carbonmanagement, conservation of biodiversity, and the mainte-nance of a healthy environment. A discussion of the sci-ence questions associated with these topics is available atthe http://oceancolor.gsfc.nasa.gov/DOCS Web site.
12
EE
E
E
E
E E
E
E
E
E E
E
E
E
E
E
E
E
EE
E
E
E
EE
E
E
E
EE
E
E
E
EE
E
E
E
E
EE
E
E
E
EE
E
E
EEE
E
E
E
EE
E
E
E
EE
E
E
E
EE
E
E
E
EE
E
E
E
EE
E
E
EE
E
E
E
E
E
E
EE
E
E
EE
E
E
EE
E
E
E
E
E
E
E
E
E
E
E
E
E
E
E
E
E
E
E
E
E
E
E
E
E
E
E
E
E
E
E
E
E
E
E
E
E
E
E
E
E
E
E
E
E
E
EE
E
E
EE
E
E
EE
E
E
EE
E
E
E
E
E
E
E
E
E
E
E
E
E
E
E
E
E
E
EE
E
E
EE
E
E
EE
E
E
E
EE
E
E
E
EE
E
E
E
EE
E
E
E
EE
E
E
E
E
EE
E
E
EEE
E
E
EE
E
E
E
EE
E
E
E
EEE
E
E
EE
E
E
E
E
EE
E
E
EE
E
E
E
EE
E
E
E
E
E
E
E
E
E
E
EE
E
E
EE
E
E
EE
E
E
EE
E
E
EE
E
E
EE
E
E
E
E
E
E
EE
E
E
E
E
E
E
E
E
E
E
E
E
E
E
EE
E
E
E
E
E
E
EE
E
E
E
EE
E
E
E
EE
E
E
EEE
E
E
E
EE
E
E
E
EE
E
E
EE
E
E
E
E
EEE
E
E
E
EEE
EE
E
EEEEE
E
EE
E
E
E
E
E
E
E
E
E
E
EE
E
E
E
E
E
EE
EE
E0
0.4
0.8
1.2
1.6
0 0.4 0.8 1.2 1.6
c
E
EE
E
E
E
EE
E
E
E
E
E E
E
E
E
E
EE
E
E
E
E
EE
E
E
E
E
EE
E
E
E
E
EE
E
E
E
E
E E
E
E
E
E
EE
E
E
E
E
EE
E
E
E
E
E
EE
E
E
E
E
EE
E
E
E
E
EE
E
E
E
E
EE
E
E
E
E
EE
E
E
E
E
EE
E
E
E
E
E
E
E
E
EE
E
E
E
EEE
E
E
EE
E
E
E
EE
E
E
E
EE
E
E
E
E
EE
E
E
EE
E
E
E
EE
E
E
E
E
E
E
E
E
E
E
E
E
E
E
E
E
E
E
E
E
E
E
E
E
E
E
E
E
E
E
E
E
E
E
E
E
E
E
EE
E
E
E
E
E
E
E
E
EE
E
E
E
EE
E
E
E
E
E
E
E
E
E
E
E
E
EE
E
E
E
EE
E
E
E
E
E
E
E
E
EE
E
E
E
E
E
E
E
E
E
E
E
E
E
E
E
E
E
E
E
E
E
E
E
E
E
E
E
E
E
E
E
E
E
E
E
E
E
E
E
E
E
E
E
EE
E
E
E
E
E
E
E
E
E
E
E
E
E
E
E
E
E
E
EE
E
E
E
E
E
E
E
E
E
E
E E
E
E
E
E
EE
E
E
E
E
EE
E
E
E
E
EE
E
E
E
E
E
EE
E
E
E
E
EE
E
E
E
E
EE
E
E
E
E E
E
E
E
E
E
EE
E
E
E
EE
E
E
E
E
EE
E
E
E
E
E
E
E
E
EE
E
E
E
EE
E
E
E
E
E
E
E
E
EE
E
E
E
E
E
E
E
E
E
E
E
E
E
E
E
E
E
E
E
E
E
E
E
EE
E
E
E
E
E
E
E
E
E
EE
E
E
E
E
EE
E
E
E
E
EE
E
E
E
E
EE
E
E
E
E
EE
E
E
E
E
EE
E
E
E
E
EE
E
E
E
E
E
E
E
E
EE
E
E
E
E
E
EE
E
E
E
EE
E
E
E
E
EE
E
E
E
E
EE
E
E
E
E
EEE
E
EE
EEEE
E
EE
E
E
E
E
EE
E
E
E
E
E
E
E
E
E
E
EE
E
E
E
E
EE
E
E
E
E0
0.4
0.8
1.2
1.6
0 0.4 0.8 1.2 1.6
b
a
EEE
E
EE
EEE
E
EE
EEE
E
EE
EE
E
E
EE
E
E
E
E
EE
E
E
E
E
EE
E
E
E
E
EE
E
E
E
E
EE
E
E
E
E
EE
E
E
E
E
EE
E
E
E
E
EE
E
E
E
E
EE
E
E
E
E
EE
E
E
E
E
EE
E
E
E
E
EE
E
E
E
E
EE
E
E
E
E
EE
E
E
E
E
E
EE
E
E
E
E
E
EE
E
E
E
E
E
EE
EE
E
E
E
EE
E
E
E
E
E
EE
E
E
E
E
EE
E
E
E
E
EE
E
E
E
E
EE
E
E
E
E
EE
E
E
E
E
EE
E
E
E
E
EE
EE
E
E
E
EE
E
E
E
E
E
EE
E
E
E
E
E
EE
EE
E
E
E
EE
E EE
E
E
EE
EEE
E
E
EE
EEE
E
E
EE
EEE
E
E
EE
E
E
E
E
E
EEEE
EEE
E
E
EEEE
E
E
E
E
E
EEEE
E
EEEE
EEEE
E
E
E
E
E
EEEE
EE
E
E
E
EEE
EE
E
E
E
EEEE0
0.01
0.02
0.03
0 0.01 0.02 0.03
EEE
E
EE
EEE
E
EE
EEEE
EE
EEE
E
E
E
EE
E
E
E
EE
E
E
EE
EE
E
E
EE
EE
E
E
EE
EE
E
E
EE
EEE
E
EE
EE
E
E
EE
EE
E
E
EE
EE
E
E
EE
EE
E
E
EE
EEE
E
EE
EE
E
E
E
E
EE
E
E
EE
EEE
E
E
EE
EEE
E
E
E
E
EEE
E
E
EE
EEE
E
E
EE
EEE
E
E
EE
EE
E
E
E
E
EE
E
E
EE
EE
E
E
EE
EE
E
E
EE
EE
E
E
EE
EEE
E
EE
EEE
E
E
EE
EEE
E
E
EE
EEE
E
E
EE
EEEE
E
EE
EEEE
E
EE
EEEE
E
EE
EEEE
E
EE
EEEE
E
EE
EEE
E
E
E
EE
E
EEEE
E
E
EE
E
EEE
E
E
EEE
E
EEEEE
E
EE
E
EEE
E
E
E
EE
E
EEE
E
E
E
EE
EEE
E
E
E
EEE
0.0001
0.001
0.01
0.03
0.0001 0.001 0.01 0.03
d
EEEE
E
E
EEEE
E
E
EEE
E
E
E
EEE
E
E
E
EEE
E
E
E
EEE
E
E
E
EEE
E
E
E
EEE
E
E
E
EEE
E
E
E
EEEE
E
E
EEE
E
E
E
EEEE
E
E
EEE
E
E
E
EEE
E
E
E
EEE
E
E
E
EEEE
E
E
EEE
E
E
EEE
E
E
EEEE
E
EEEE
E
EEE
E
E
EEE
E
E
EEE
E
E
EEE
E
E
EEE
E
E
EEE
E
E
EEE
E
E
EEE
E
E
EEE
E
E
EEE
E
E
EEE
E
E
EEE
E
E
EEE
E
E
EEE
E
E
EEE
E
E
EEE
E
EEE
E
E
EEE
E
E
EEE
E
E
EEE
E
E
EEE
E
E
EEE
E
E
EEE
E
E
EEE
E
E
EEE
E
E
EEE
E
E
EEE
E
E
EEE
E
E
EEE
E
E
EEE
E
E
EEE
E
E
EEE
E
E
EEE
E
E
EEE
E
E
EEEE
E
E
EEEE
E
E
EEE
E
E
E
EEEE
E
E
EEEE
E
E
EEEE
E
E
EEE
E
E
E
EEEE
E
E
EEEE
E
E
EEEE
E
E
EEEE
E
E
EEEE
E
E
EEE
E
E
EEE
E
E
EEE
E
E
EEE
E
E
EEE
E
E
EEE
E
E
EEE
E
E
EEE
E
E
EEE
E
E
EEE
E
E
EEE
E
E
EEE
E
E
EEE
E
E
E
EEEE
E
E
EEE
E
E
E
EEE
E
E
E
EEE
E
E
E
EEEE
E
E
EEE
E
E
E
EEE
E
E
EEEE
E
E
EEEE
E
E
EEE
E
E
E
EEE
E
E
E
EEE
E
E
E
EEEE
EEEEEE
E
EEEE
E
E
EEEE
E
E
EEEE
E
E
EEEE
E
E
EEEE
E
E
0.003
0.01
0.1
1
3
0.003 0.01 0.1 1 3
e
EEE
E
E
EEE
E
E
EEE
E
EEE
E
E
EEE
E
E
EEE
E
E
EEE
E
E
EEE
E
E
EEE
E
E
EEE
E
E
EEE
E
E
EEE
E
E
EEE
E
E
EEE
E
E
EEE
E
E
EEE
E
E
EE
E
E
EE
E
E
EE
E
E
EE
E
E
EE
E
E
EE
E
E
EE
E
E
EE
E
E
EE
E
E
EE
E
E
EE
E
E
EE
E
E
EE
E
E
EE
E
E
EE
E
E
EE
E
E
EE
E
E
EE
E
E
EE
E
E
EE
E
E
EE
E
E
EE
E
E
EE
E
E
EE
E
E
EE
E
E
EE
E
E
EEE
E
E
EEE
E
E
EEE
E
E
EEE
E
E
EEE
E
E
EEE
E
E
EEE
E
E
EEE
E
E
EEE
E
E
EEE
E
E
EEE
E
E
EEE
E
E
EEE
E
E
EE
E
E
EE
E
E
EE
E
E
EE
E
E
EE
E
E
EE
E
E
EE
E
E
EE
E
E
EE
E
E
EE
E
E
EE
E
E
EE
E
E
EE
E
E
EE
E
E
EE
E
E
EE
E
E
EE
E
E
EEE
E
E
EEE
E
E
EEE
E
E
EEE
E
E
EEE
E
E
EEE
EE
E
EEE
EE
E
EEE
EE
E
EEEEE
E
EEE
EE
E
EEE
EE
E
EEE
EE
E
EEE
EE
E
0.003
0.01
0.1
1
3
0.003 0.01 0.1 1 3
f
Stanford B. Hooker, Charles R. McClain, and Antonio Mannino
Fig. 3. Satellite matchups at the BOUSSOLE site for a) MERIS ρW (λ) values (412, 443, 490, 510, 560,670, and 683 nm); b) SeaWiFS
[LW (λ)
]N, values (412, 443, 490, 510, 555, and 670 nm); and c) MODIS-A[
LW (λ)]N
values (412, 443, 488, 510, 551, 670, and 683 nm). The solid line is the 1:1 line. Logarithmic scalesfor panels a–c are shown in panels d–f, respectively, in order to magnify the low values in the red domain.
13
Sponsored(and Interdisci-plinary) FieldCampaigns
In SituDatabase
(SeaBASS)
Atmosphericand AerosolCharacteri-
zations
P
NewScienceTopics
2006
NorthAmericanCarbon
Program(NACP)
Standardsand
Traceability
CoastalCarbon
Abundance P
2007
Optical(Apparent and
Inherent)Properties
Biogeo-chemical
(Particulateand Dissolved)
Constituents
SatelliteVicarious
Calibration
Calibration andValidation
Component
ImageProcessingSoftware
(SeaDAS)Bio-OpticalAlgorithm
(and Product)Validation
OceanicPrimary
Productivity
P
2008
Physiologyand Functional
Types(PFTs)
P
2009
P
P
Satellite DataProcessingComponent
P
AERONETCoastal Data(SeaPRISM)
2006
OceanicCarbon
Abundance
2006 P
Instrumentand
AnalysisRound Robins
2006
AtmosphericCorrectionAlgorithm
SatelliteSensor(VIIRS)
Character-ization
2006
In SituData
ProcessingSoftware
2008
P
AerosolHeight
(CALIPSO)
2006
Developand Evaluate
Instrumentation
PublishProtocolsand Per-formanceMetrics
VerifyUncertainty
Budgets
Acquire,Distribute,
and ArchiveData Products
Process andReprocessMultisensor
Data
Initialize andTemporally
MonitorSatellite
Calibration
CoordinateInternationalPartnerships
ImplementNew DataProducts
VicariousCalibration
Site(s)
P
SouthernOceanCarbon
Program(SOCP)
2008
A Comprehensive Plan for the Long-Term Calibration and Validation of Oceanic Biogeochemical Satellite Data
Fig. 4. The organizational framework for the proposed activity showing the details of the calibration andvalidation (red) plus the satellite data processing (blue) components. (CALIPSO is the Cloud-Aerosol Lidarand Infrared Pathfinder Satellite Observations.)
14
Stanford B. Hooker, Charles R. McClain, and Antonio Mannino
point here is to simply admit that the annual capabilitiesof the plan are a function of the funding available and anyrescoping (led by the OBB Program Manager with advicefrom the Calibration and Validation Team) should be donewith an understanding of the short- and long-term inter-dependencies of the various elements.
3.1 Satellite Data ProcessingThe execution of the SeaWiFS and MODIS missions
demonstrated one of the most important aspects of thecalibration and validation process is a strong link withthe data processing system. This is only possible if bothcomponents are properly organized, staffed, and integratedwith one another at the core level of responsibilities. Forthe satellite data processing component, the latter includesthe following tasks:
Acquiring, distributing, and archiving data prod-ucts (including continuity products associated withclimate analyses);Processing the satellite data from the lowest to high-est levels† from all the applicable satellites (whichmight include historical missions);Participating in the temporal monitoring of the sat-ellite sensor’s performance; andReprocessing all the data products when changesin the scientific or engineering understanding of thedata dictates it.
Note that the last item occurs, and is scheduled, only as aresult of a continuing dialogue with the scientific commu-nity, and is not done in isolation.
The design and construction of a data processing sys-tem capable of satisfying the core tasks given above is notthe subject of this document, but it is worth noting whatarchitectural functions are required, because they are im-mediately applicable to the final set of core and connecting-core tasks. Using the SeaWiFS processing system as anexample (McClain et al. 2004), the five key functions are:a) processing large volumes of data in a timely fashion,b) automating as many of the tasks as possible, c) allow-ing changes to the processing methods to be easily imple-mented, d) accommodating multiple processing streams,and e) providing easily understood documentation and in-terfaces. Although the successful implementation of thesefunctions do not always directly relate to the connecting-core tasks, they provide the needed degree of efficiency to
† The extent of data processing—usually referred to as thelevel—begins with the (raw) data received on the ground,which is denoted level -0. Calibrated and geolocated data(level -1) are used to derive the geophysical (level -2) prod-ucts (e.g., the chlorophyll a concentration), which are usu-ally space-time averaged and binned onto a standard grid(level -3). The level -1 and level -2 products include metadataidentifying the ancillary fields required for level -2 processing.Complete details for each level are available in the SeaWiFSTechnical Report Series (Firestone and Hooker 2004).
permit the people involved to spread their expertise out-ward through the connecting-core elements.
Again using the SeaWiFS experience as a model, theconnecting-core elements that the core scientists have par-ticipated in are:
• Applying the atmospheric correction algorithm;• Vicariously calibrating the satellite sensor;• Validating the bio-optical algorithms and the asso-
ciated data products;• Incorporating new sources of applicable data (e.g.,
in situ SeaPRISM observations from AERONETand remote sensing measurements from CALIPSO);
• Maintaining the in situ database (SeaBASS) andproviding satellite overpass schedules and near-realtime data support to field campaigns;
• Implementing new global and regional data prod-ucts; and
• Refining the image processing software (SeaDAS).
This list represents a diverse set of skill and knowledge setsand firmly establishes the viability of relying on a core setof capabilities that connects all the programmatic piecestogether. Just as importantly, it also shows the widercommunity can be properly joined to the basic functionsthrough a connecting-core interface.
The reason a strong link with the data processing sys-tem is so critical is the amount of analysis that must takeplace to maintain the accuracy of the data products. Whilesimple evaluations based on a few scenes can be easily con-ducted on small systems, analyses spanning an entire mis-sion on a global scale can only be conducted efficiently andquickly on a main processing system. Batch processing onthis scale for calibration and validation purposes is pos-sible because a properly designed processing system—likethat built for SeaWiFS and, ultimately, MODIS—has allthe level -0 satellite and ancillary data online and can beeasily configured for customized analyses.
The processing system designed from the earliest stagesof the SeaWiFS Project accommodated offline processingin support of the calibration and validation element (Mc-Clain et al. 2004). This flexibility permitted the incor-poration of MODIS sea surface temperature processing asan independent (parallel) processing stream without anyinterruption in the routine ocean color processing. Priorto each SeaWiFS (versions 1.0–5.1) and MODIS (versions1.0–1.1) reprocessings, extensive testing of algorithm re-finements were conducted (e.g., revised MODIS polariza-tion tables, updated ozone ancillary data, and inclusionof the bidirectional correction). At present, tests are nor-mally run on both SeaWiFS and MODIS with the samealgorithms, so the results can be compared across bothmissions. The capability is facilitated by using a standardprocessing code, MSL12, across all sensors. These tests pro-vide complete information on global and regional biases
15
A Comprehensive Plan for the Long-Term Calibration and Validation of Oceanic Biogeochemical Satellite Data
and trends that cannot be identified based on more lim-ited analyses. Within the first two-years of the SeaWiFSprocessing group having the responsibility for MODIS pro-cessing, over 80 such time-series analyses were executed,which led to major improvements in both data sets.
The procedure for setting up the tests is straightfor-ward. The calibration and validation lead analyst providesthe modified code, plus the input parameters and tables ina prescribed format, to the processing system lead. Typ-ically, the time-series tests use four consecutive days ofeach month. The processing system is automated usingdatabases to control the processing sequence and data han-dling. Once the processing is initiated, it takes only a fewhours to complete, including the level -3 processing. Oncethe level -3 products are available, various standard globaland regional time series and statistical analyses are com-puted and posted for the calibration and validation groupto inspect. This level of cooperation and responsivenessis best achieved by having the calibration and validationgroup collocated and under the same management struc-ture as the data processing group.
Throughout the time period of the SeaWiFS mission,reprocessings have been executed approximately once ev-ery 18 months. In each case, the calibration and validationgroup posted the results of the tests along with the recom-mended algorithm revisions for community comment priorto the actual reprocessing. The generation of science qual-ity data that incorporates the new understanding of sensorcalibration, atmospheric corrections, and bio-optical algo-rithms necessitates these reanalyses. The field of oceancolor remote sensing is expanding rapidly as a result of theSeaWiFS and MODIS missions, so the OBB Program mustprovide state-of-the-art data sets that incorporate theseadvances in a timely manner. The only way to achieve thisis to have a data system that is designed to be adaptableand responsive to the calibration and validation require-ments. An additional benefit is that the SeaDAS systemis managed as part of the data processing system and in-corporates all the refinements of each reprocessing in syn-chrony with the reprocessing (i.e., updates of SeaDAS arereleased with each reprocessing to ensure consistency).
3.2 Calibration and Validation
The calibration and validation of an ocean color satel-lite includes spacecraft, atmospheric, sea surface, subsur-face (or in situ), laboratory, and data analysis tasks, allof which require pre- and postlaunch activities. The mostimportant goal of this effort is to produce water-leaving ra-diances within an agreed upon uncertainty level and chlo-rophyll a concentration range (hereafter referred to as thesatellite performance metric). The partitioning of the nec-essary work plan into its functional parts can be accom-plished several different ways. The approach adopted hereis based on the experience acquired during the executionof the SeaWiFS mission and follows directly from Fig. 4.
For recent remote sensing missions, the satellite perfor-mance metric requires field instruments with a calibrationand measurement capability in keeping with a 1% radiom-etry requirement, so the quadrature sum of uncertaintiesis to within the overall uncertainty budget. Because thesechallenging in situ measurements will frequently be ac-quired from a variety of field instruments over the missionlifetime, a measurement assurance program is required.This program consists of several activities:
An accurate prelaunch characterization and calibra-tion of the spaceborne instrument;Multiple vicarious calibration sites in clear watersand atmospheres to provide time series of water-leaving radiances for postlaunch vicarious calibra-tion (which hopefully includes international part-nerships to expand the global coverage, especiallyinto the Southern Hemisphere);Clearly defined protocols with performance metricsfor established data collection methodologies;Direct comparison to the appropriate national stan-dards laboratory (NIST in most cases) to verify un-certainty budgets;Managing the development and evaluation of instru-mentation to ensure measurement uncertainties arequantified and minimized; andTemporal monitoring, quality assurance, and dataanalysis procedures for tracking the postlaunch per-formance of the satellite sensor and the validity ofthe derived products.
The net culmination of many of these activities is the de-ployment of the instruments and methodologies on spon-sored and interdisciplinary field campaigns. In this con-text, “sponsored” refers to joint-agency expeditions (e.g.,NACP or SOCP) and “interdisciplinary” stresses the newparadigm for calibration and validation wherein optical,biological, and chemical expertise are deployed with equalstature (the original paradigm emphasized primarily opti-cal measurements). Under this plan, the Calibration andValidation Activity will help coordinate the needed fieldcampaigns, publicize and negotiate ship time opportunitiesas well as atmospheric and aerosol characterization exper-iments, and facilitate the sampling needs of new sciencetopics.
Although sponsored cruises will be part of researchannouncements (usually with broad science objectives),separate campaigns with focused calibration and valida-tion objectives—but with competed participation—will beneeded. These specific experiments will be organized tocollect the optical, biogeochemical, and atmospheric datarequired to address the underlying question or hypothesiswhile properly characterizing the environmental conditionsof the experimental site. The point here is to establishthe tenets of the inquiry, choose the experimental location,provide the sampling platform (a ship, offshore structure,
16
Stanford B. Hooker, Charles R. McClain, and Antonio Mannino
airplane, etc.), and then select the participating scientistsfrom a competed announcement.
It is natural to think of many field campaigns in termsof ship transects, but time series will be one of the mostimportant data collection opportunities. The advantage ofa time series is it provides a proven pathway for quantifyingthe quality of the data being archived, but only if it extendsover a significant amount of time (in terms of the timescale of the underlying processes). Indeed, for climate-quality data, time spans on the order of 10 years or moreare rather easily imagined. Lengthy field work is usuallyvery expensive, so community support and accountabilitywill be essential for such activities (Sect. 4.1).
Coastal ocean experiments will be designed to eval-uate and refine instruments and protocols used to sam-ple and analyze optical and biogeochemical measurements,particularly those involving issues unique to the coastalzone (plumes, shallow water, vertical complexity, turbidity,etc.). Major field campaigns will be organized or synchro-nized with other institutional partners and governmentagencies (when possible) as new programmatic elementsare implemented by the OBB Program (e.g., vicarious cal-ibration sites and the SOCP campaign). The managementof the vicarious calibration sites will involve coordinatingship time for routine maintenance (instrument calibrationand exchange, etc.) as well as ensuring that IOP and bio-geochemical validation data are collected and processedaccording to the established protocols.
Calibration and validation activities will be aligned tomeet the requirements of new science topics as they are in-troduced: oceanic carbon abundance, coastal carbon abun-dance, oceanic primary productivity, and physiology andfunctional types. Coordination of the field campaigns andprotocol evaluation experiments associated with the newscience topics will be pursued before the topic is intro-duced to ensure a mature capability is available when it isneeded most. Protocol issues that need to be resolved in-clude a) choosing a method† and protocol that is the mostappropriate for quantifying gross or net primary produc-tivity, and b) developing a carbon reference material foruse when measuring particulate organic carbon (POC). Apossible solution for the latter might be modeled after whatis being done to verify measurements of dissolved organiccarbon (DOC). Over the past several years, the scientificcommunity has relied on a consensus reference material(deep water from the Sargasso Sea) distributed by the Uni-versity of Miami (Department of Marine and AtmosphericChemistry). Protocols for current and new optical instru-mentation will be required to provide a rigorous measureof quality and consistency for the in situ database (e.g.,scattering sensors, fluorometers, etc.).
† Candidate methods include 14C or 13C incubations, enrichedor natural abundance oxygen isotopes, plus classic light- anddark-bottle incubations.
As the ocean color community continues developmentof algorithms for IOP satellite products—particle and col-ored dissolved organic matter (CDOM) absorption or par-ticle backscatter, for example—the quality of the valida-tion data becomes more critical. This is particularly im-portant when the IOP data are used to derive biogeochem-ical products (e.g., deriving the POC from beam attenu-ation). Protocols generated from workshops sponsored byNASA in the late 1990s for particle and CDOM absorp-tion (Mitchell et al. 2000 and 2003) should be updatedto promote consistency in protocols and data processing,for analysis of samples collected in coastal waters, and totake into account advances in instrumentation (e.g., liquidcapillary waveguide absorption instruments). Commercialvendors continue to develop new in-water IOP instruments(absorption, attenuation and scattering sensors, as well asfluorometers). Measurements from the new instrumentsshould be compared with the previous instruments andwith discrete bench-top measurements. This will requireIOP instrument and analysis round robins.
3.3 Competed Elements
An integral part of the plan is to use the peer-reviewedprocess to fill the majority of the connecting-core elements;a small number of these elements will be filled using con-tracts where appropriate. In keeping with the duality ofresponsibility in connecting-core elements (internal and ex-ternal scientific participation), if budget levels do not per-mit external participation for all of these positions, some ofthem can be filled by internal (core) scientists (if deemedappropriate by the OBB Program Manager) to ensure aminimum level of representation.
The competed (and contracted) activities encompass abroad range of scientific topics and tasks: a) atmosphericand aerosol characterizations, including improvements andnew approaches for atmospheric correction algorithms; b)improved or new data products (global and regional algo-rithms for AOPs, IOPs, biogeochemical constituents andprocesses, etc.); c) characterization of new satellite sensors(VIIRS and future sensors); d) sponsored and interdisci-plinary field campaigns (NACP, SOCP, vicarious calibra-tion sites, etc.); and e) fundamental scientific research con-sistent with the Carbon Cycle and Ecosystems Roadmapand relevant to calibration and validation. Additional ar-eas of endeavor in keeping with NASA programmatic ob-jectives will be added when necessary.
Improving atmospheric correction algorithms will re-quire advances in modeling, as well as field activities tobetter characterize the atmosphere and aerosols. Currentefforts include utilizing the 1.24 and 1.64µm bands onMODIS and incorporating new data streams from satel-lite sensors (e.g., CALIPSO) and surface instruments (Sea-PRISM). Development of regional algorithms for currentor new ocean color data products will be needed to meet
17
A Comprehensive Plan for the Long-Term Calibration and Validation of Oceanic Biogeochemical Satellite Data
NASA objectives in coastal and deep-ocean waters. Ad-vances in the next generation of ocean color satellite sen-sors, such as hyperspectral capability and bands in the nearultraviolet (UV), will necessitate calibration and validationfield campaigns, as well as the development of new algo-rithms and models. Contracts with certain laboratoriesto conduct biogeochemical analyses (e.g., HPLC pigments,POC, DOC, etc.) may be used to maintain a consistentuncertainty level for the in situ measurements (as is beingdone presently for HPLC pigments).
A recolored version of Fig. 4, wherein the competed(green) and shared (yellow) connecting-core elements areexplicity denoted, is presented in Fig. 5. The latter in-cludes competed, contracted, and internal contributions,the mixture of which is determined largely by the topictype. For example, the calibration and validation compo-nent is expected to be involved in the management of thevicarious calibration site(s), which means it will also be in-volved in the optical properties element (at least the AOPportion), as well as the standards and traceability element.Almost all of the satellite data processing connecting-coreelements are shared responsibility elements, because therehas to be an internal competence to interact with the com-munity contributions in these elements.
Calibration and Validation Team members will a) es-tablish and review calibration and validation requirementsfor the vicarious calibration sites, field campaigns, and newscience topics; b) plan field experiments to address perti-nent calibration and validation issues (e.g., AOP, IOP, andbiogeochemical data collection in Case-2 waters); c) main-tain up-to-date protocols for their respective elements; d)assist with coordinating instrument and analysis roundrobins; e) review compliance of core, competed, and con-tracted activities with established Protocols; f) enforce ac-countability and transparency for the wider scientific com-munity; and g) provide recommendations to the NASAprogram manager regarding calibration and validation ac-tivities, including field campaigns and new science top-ics. The Team will meet (physically or via conference call)quarterly or as needed to satisfy its obligations.
4. Issues and DiscussionThe development of the plan presented here focused on
the lessons learned from ocean color missions already suc-cessfully planned and launched. At first glance, this mightappear to be a rather myopic perspective, but the futurefor ocean color—in terms of satellite missions—is currentlyvery similar to the past. The satellites approved for launchare all fixed-wavelength sensors with very similar spec-tral, orbital, and performance specifications to what hasalready been flown. At some point, however, this will notbe true, and the types of scientific investigations and meth-ods needed to satisfy the Advanced Science Plan will verylikely require different satellite designs, which, in turn, willrequire alternative field studies and instrumentation.
Properly forecasting what is needed for a long-termplan automatically requires choices between competing vi-sions. Although the authors of this plan have done theirbest to make sensible choices—at least in terms of the hereand now, plus the lessons learned from prior missions—apriori there is no way to know if these choices will with-stand the test of time without initiating the entire process.Nonetheless, some safeguards can be put into place, whichis to say an accountability procedure can be defined, andsome of the most likely issues associated with the perspec-tive adopted here can be discussed.
4.1 AccountabilityOne aspect of past missions that changed from launch
to launch was how the scientists involved were held ac-countable for successfully completing their various tasks.The plan described here will be one of the substantial as-pects of the OBB Program, so accountability is a requiredcomponent. The plan is based on uncompeted (core) aswell as competed and contracted (connecting-core) tasks,and the procedures for fulfilling the latter provide a certainamount of built-in accountability (i.e., peer review), butimplementing the former basically does not. The lessonslearned from prior missions—especially MODIS—establishthe necessity of an independent core group to provide ob-jective performance evaluations of calibration and valida-tion activities. One of the best mechanisms for maintain-ing objectivity is to have annual reviews of the science anddeliverables involved.
The first level of accountability resides with the OBBProgram Manager who will be in charge of the overall ac-tivity. A second level of accountability is provided by twoupper-level oversight opportunities: a) the Calibration andValidation Team, and b) an annual external review of theentire enterprise. The annual review will consist of tele-conference reviews of the (contracted) connecting-core el-ements and a public review of the core elements with thebroader ocean color community invited. The two typesof reviews are envisioned to save on travel and logisticswhile maintaining an effective review capability. If thereare important issues or results within the connecting-coretasks that need public input, separate presentations willbe scheduled during the next review opportunity.
The annual review of connecting-core tasks will be over-seen by the Calibration and Validation Team, whereas thecore tasks will be reviewed by an Evaluation Board withparticipation from the public audience. The EvaluationBoard Chair will be the OBB Program Manager who willselect whatever representation is deemed appropriate (thecomposition of the board will most likely change over timein concert with the evolution in the types of science topicsand technical challenges). Recommended revisions fromthe annual reviews will be evaluated by the OBB ProgramManager, and any corrective measures will be implementedby the appropriate Calibration and Validation Chair orSatellite Data Processing Chair.
18
Sponsored(and Interdisci-plinary) FieldCampaigns
In SituDatabase
(SeaBASS)
Atmosphericand AerosolCharacteri-
zations
P
NewScienceTopics
2006
NorthAmericanCarbon
Program(NACP)
Standardsand
Traceability
CoastalCarbon
Abundance P
2007
Optical(Apparent and
Inherent)Properties
Biogeo-chemical
(Particulateand Dissolved)
Constituents
SatelliteVicarious
Calibration
Calibration andValidation
Component
ImageProcessingSoftware
(SeaDAS)Bio-OpticalAlgorithm
(and Product)Validation
OceanicPrimary
Productivity
P
2008
Physiologyand Functional
Types(PFTs)
P
2009
P
P
Satellite DataProcessingComponent
P
AERONETCoastal Data(SeaPRISM)
2006
OceanicCarbon
Abundance
2006 P
Instrumentand
AnalysisRound Robins
2006
AtmosphericCorrectionAlgorithm
SatelliteSensor(VIIRS)
Character-ization
2006
In SituData
ProcessingSoftware
2008
P
AerosolHeight
(CALIPSO)
2006
Developand Evaluate
Instrumentation
PublishProtocolsand Per-formanceMetrics
VerifyUncertainty
Budgets
Acquire,Distribute,
and ArchiveData Products
Process andReprocessMultisensor
Data
Initialize andTemporally
MonitorSatellite
Calibration
CoordinateInternationalPartnerships
ImplementNew DataProducts
VicariousCalibration
Site(s)
P
SouthernOceanCarbon
Program(SOCP)
2008
Stanford B. Hooker, Charles R. McClain, and Antonio Mannino
Fig. 5. The Fig. 4 organizational framework recolored to emphasize competed (green) and shared (yellow)elements. The latter includes competed, contracted, and internal contributions. The core elements are shownin the original blue and red color scheme.
19
A Comprehensive Plan for the Long-Term Calibration and Validation of Oceanic Biogeochemical Satellite Data
To ensure transparency and effective communicationswith the community, core and connecting-core scientistswill provide annual reports of their activities to the Cali-bration and Validation Team, which will be published asa NASA Technical Memorandum. In addition, review pre-sentations will be made available through an appropriateWeb site, and summaries of the comments and recommen-dations from the Evaluation Board, as well as the agreedupon corrective measures (if any), will also be posted.
A third level of accountability will be applied at thelower level of the individual elements and will involve twostrategems: a) for elements with shared responsibilitiesbetween internal core functions and external connecting-core activities, the scientists involved will review and cri-tique the work from their companion representatives; andb) the tasks associated with each element will be executedas part of one or more science objectives, which have beenapproved by the wider community. The point of the latteris to make sure all elements have a scientific context. Itwill be the responsibility of the principal scientist in eachelement to establish the scientific goal(s) of the element,and to present the scientific accomplishments of the ele-ment at the annual review. For data collection activities,in particular, the science objectives are seen as an essentialQA opportunity to ensure all of the data are of the highestquality possible. This means the scientists must have sci-entific goals that require a continuing assessment of dataquality (and not a reliance on a centralized data center todetect data quality or reporting issues).
Lastly, there is a community-wide responsibility in thisapproach, as well, because the entire enterprise is only vi-able if the community participates and supports its evolu-tion. In particular, the community is responsible for beingdirectly active in many elements (to name a few):
• Participating as a member of the Calibration andValidation Team;
• Refining and approving the Protocols and perfor-mance metrics;
• Defining new algorithms and confirming the valida-tion procedures to be used;
• Collecting field data for sponsored (and interdisci-plinary) field campaigns, atmospheric and aerosolcharacterizations, as well as vicarious calibrationsites, and submitting all these data to SeaBASS forpublic use;
• Enhancing the capabilities of SeaDAS to keep pacewith new requirements and science topics;
• Providing expertise in the proper measurement ofAOPs, IOPs, and biogeochemical (particulate anddissolved) constituents and processes;
• Improving the capabilities of the atmospheric cor-rection algorithm;
• Taking part in instrument and data analysis roundrobins; and
• Ensuring the widest—domestic and international—participation of ocean color scientists.
The last item deserves additional consideration, becauseresearch is a global enterprise, and a significant part ofthe problem set and solutions are directly attributableto international scientists, institutes, and programs (e.g.,AERONET, SeaPRISM, and BOUSSOLE are significantinternational accomplishments). A noted accomplishmentof the SIMBIOS project was its success in uniting the inter-national community and gaining their support in pursuingocean color objectives.
4.2 Above- versus In-Water RadiometryAlthough the capabilities of the above-water approach
for determining water-leaving radiances have been shownto be equivalently capable as traditional in-water methods(Hooker et al. 2004 and Zibordi et al. 2004), disagreementas to the applicability of above-water methods to calibra-tion and validation exercises persists†. At one level, this isan odd situation, because the spaceborne instrument is anabove-water sensor—so above-water radiometry is clearlya tractable problem—but on another level, it is rather an-ticipated, because it takes time for scientific cultures toabsorb new methodologies and change the way the scien-tific process is executed.
The encouraging above-water vicarious calibration re-sults presented for the SeaPRISM prototype (Sect. 2.7) aresimply an affirmation that this methodology is availablefor exploitation. In addition to providing an off-the-shelfalternative to an in-water technique, it is important to re-member the above-water approach a) does not suffer anysignificant bio-fouling problems, b) does not require anyself-shading corrections (although platform perturbationsmust be properly minimized), and c) does not have any-where near the vulnerability of an in-water mooring (fromsevere weather, pleasure craft, or commercial fisherman).
4.3 Hyperspectral RadiometryThere are no hyperspectral satellites on orbit or waiting
to be launched (VIIRS, for example, is a fixed wavelengthsensor). Nonetheless, at least two potential ocean colormission concept instruments are being designed with somehyperspectral and near-ultraviolet band capability. A fu-ture ocean color satellite with hyperspectral capability mayimprove the characterization of oceanic constituents, but inthe interim, the good vicarious calibration results achievedwith SeaPRISM and BOUSSOLE—which are both basedon commercially available, fixed-wavelength radiometers—suggest low-cost alternatives to vicarious calibration are
† In terms of the data submitted to SeaBASS, for example,the majority of the radiometric data are from in-water profil-ers, although the percentage contribution from above-waterinstrument systems is steadily increasing (currently about
45%).
20
Stanford B. Hooker, Charles R. McClain, and Antonio Mannino
accessible. Potential applications for hyperspectral sen-sors include improving Chl a algorithms in certain regions(Chang et al. 2004), resolving bottom effects on water-leaving radiances (Chang et al. 2004), detecting harmfulalgal blooms and accessory pigments that could be usedto determine phytoplankton taxonomy (Lee and Carder2004), and discriminating the multiple constituents thatcontribute to absorption and scattering properties of theocean.
The present designs for both the Coastal Ocean Car-bon Observations and Applications (COCOA) and OceanCarbon, Ecosystem, and Near-Shore (OCEaNS) missionconcepts incorporate bands in the UV and hyperspectralcapability. Regardless of what actually materializes fromthese plans, it seems appropriate to begin the process ofagreeing on revisions to the field sampling and data anal-ysis protocols in anticipation of the initial work that willbe needed to understand how best to support a hyper-spectral mission. In addition, there is the need to agreeon what constitutes “hyperspectral” sampling, because formany problems, a great deal of progress can be made bysimply adding greater spectral diversity (i.e., many morechannels) to existing radiometer designs (for example, 13-or 19-channel radiometers can be built in the same formfactor used to produce 7-channel instruments).
4.4 Ultraviolet WavelengthsImprovements in atmospheric correction algorithms are
essential for obtaining accurate water-leaving radiances.For clear waters, the ocean is optically black in the NIR,so these bands (765 and 865 nm for SeaWiFS) are used toestimate aerosol radiance levels and to select the most ap-propriate aerosol optical model in order to extrapolate theNIR aerosol correction to the visible bands. This black-pixel assumption for the NIR bands is not valid for pro-ductive or turbid coastal waters because of backscatteringby particles. Current atmospheric correction models alsotend to overcorrect for aerosols (Siegel et al. 2000, Baileyet al. 2003, and McClain et al. 2004).
In many coastal waters, absorbing aerosols and highin-water particle loads invalidate the black-ocean assump-tion for the NIR bands and complicate standard atmos-pheric correction algorithms. Negative LW (λ) values forthe 412 nm band (and at times for the 443 nm band) onSeaWiFS and MODIS occur frequently in coastal waters,especially for nearshore waters and estuaries. Atmosphericcorrection difficulties caused by absorbing aerosols extendfar beyond coastal waters. For example, Saharan dust par-ticles and biomass burning aerosols are transported acrossthe Atlantic Ocean from Africa to the Caribbean.
The addition of UV bands can be used to flag and im-prove atmospheric correction algorithms in the presenceof absorbing aerosols. The combination of UV and longerNIR bands (greater than 1µm) may significantly improvethe current black-pixel assumption for Case-2 waters. Cur-rent Chl a algorithms do not perform well in certain coastal
waters, because of atmospheric correction issues and thehigh concentrations of in-water constituents (detritus, sus-pended minerals, phytoplankton, and CDOM), which haveoverlapping absorbance spectra at blue wavelengths.
Wavelengths in the UV part of the spectrum might beexploited to distinguish the absorption signals of CDOM,Chl a, detritus, and minerals (due to high UV absorbanceby CDOM relative to the other components), yielding newalgorithms for coastal waters. Furthermore, UV bandsmay promote the detection of harmful algal blooms such asred tides, because they produce UV absorbing compoundscalled mycosporine-like amino acids (Laurion et al. 2003).A mitigating factor is going to be whether or not the lightinstruments involved can be adequately calibrated in theUV domain. Most commercial sources of instrument cali-bration have a suitable capability in the visible part of thespectrum, but the capabilities in the UV portion remainlargely unquantified.
4.5 Primary ProductivityAn important ecological property derived from oceanic
remote sensing data is net primary production (NPP). Thismeasurement is important, because it is a general indicatorof the current health, and a monitor of future change, of anaquatic ecosystem. NPP can be defined as the amount ofdaily photosynthetically fixed carbon available to the firstheterotrophic level (Lindeman 1942) or as gross photosyn-thesis minus diel respiration by the photosynthesizing or-ganism (for the oceans, this is largely phytoplankton). Un-fortunately, NPP cannot be directly measured from space,but it can be estimated from information on incident pho-tosynthetically available radiation (PAR), phytoplanktonbiomass and its vertical distribution, mixed layer light lev-els, and the distribution of growth-limiting factors (e.g.,micro- and macronutrients). Reducing uncertainties inNPP estimates requires validation of these required inputvariables, in addition to direct comparisons between mea-sured and modeled NPP values for the water column.
Chlorophyll, or total pigment concentration, is an es-sential part of any NPP model. Uncertainties in remotesensing chlorophyll (pigment) products propagate throughto NPP estimates and must be both minimized and wellcharacterized. Presently, a primary source of uncertaintyin chlorophyll (pigment) products derives from the inaccu-rate separation of pigment and CDOM absorption (Siegelet al. 2005). Approaches for addressing this issue and as-sociated measurement requirements are discussed above inSect. 4.4. In coastal or other optically complex waters, un-certainties in chlorophyll (pigment) retrievals can be sig-nificant and lead to large uncertainties in NPP estimatesand carbon fluxes. In addition to using advanced productsderived from spectral-matching algorithms (as opposed toband ratios), improved assessments of phytoplankton pig-ment absorption may be achieved through remote sensingmeasurements of Chl a fluorescence coupled with water-leaving radiance measurements in the long-wave ultraviolet
21
A Comprehensive Plan for the Long-Term Calibration and Validation of Oceanic Biogeochemical Satellite Data
region (Huot et al. 2007). This approach requires an accu-rate assessment of incident PAR, fluorescence line heights,and fluorescence quantum yields. The latter two demandnew and expanded field measurements, which will have tobe properly validated and characterized.
Surface Chl a concentration is the traditional metricfor phytoplankton biomass in NPP models. Chlorophyll(pigment) concentration, however, is not only a functionof phytoplankton abundance, but is also strongly influ-enced by growth conditions within the mixed layer. Thisphysiological variability is at the heart of major uncer-tainties in NPP products and remains a challenge to con-strain. Historical approaches to this issue have involvedthe parameterization of physiological NPP model variablesusing relationships with specific physical properties—forexample, temperature and incident PAR (Antoine et al.1996, Behrenfeld and Falkowski 1997, and Behrenfeld etal. 2002)—or climatological descriptions of ecophysiologi-cal provinces derived from carbon fixation measurementsusing 14C methods (Longhurst et al. 1995). These ap-proaches, however, are highly empirical and considerableeffort (including field and laboratory research) is needed totransition them to more mechanistic descriptions. If thetransition can be made and applied to satellite data, thentwo important inquires can be addressed: a) traditionalbehaviors in photosynthetic assimilation efficiencies, thatis, carbon fixed per unit pigment biomass or absorption;and b) the properties whose mechanistic underpinnings arenot yet fully understood, for example, covariations in light-limited and light-saturated pigment-normalized photosy-thetic rates (Behrenfeld et al. 2004).
A different approach to ocean productivity modelingwas recently proposed based on assessing phytoplanktoncarbon biomass using remote sensing particulate backscat-tering coefficients (bbp) from spectral-matching algorithms(Behrenfeld et al. 2005 and Westberry et al. 2007). The un-derlying concept of this approach is that bbp covaries withparticle abundance and, because of the relatively conservednature of the particle size spectrum in natural waters,phytoplankton carbon. The advantage of the approachis that covariations in chlorophyll and carbon biomass re-flect shifts in phytoplankton abundance, while their inde-pendent behavior tracks spatial and temporal variations inphysiological status.
With this carbon-based approach, satellite observationsprovide information on both phytoplankton abundance andphysiology. To derive NPP in this manner, variabilityin the physiological term—the carbon-to-chlorophyll ra-tio (C:Chl)—must be partitioned into a component at-tributable to photoacclimation (i.e., adjustments in C:Chlcaused by changing light conditions) and a component as-cribed to nutrient stress. The former requires an accu-rate description of incident PAR, mixed layer depths, andspectral attenuation coefficients, plus an improved under-standing of community photoacclimation strategies and re-lationships between C:Chl growth rates. The carbon-based
approach will also benefit from the inclusion of new rela-tionships accounting for light absorption by the full com-plement of photosynthetically-active pigments.
4.6 The Advanced Science PlanThe designated mission themes from the Advanced Sci-
ence Plan, along with the corresponding high-priority re-search questions (Sect. 1), highlighted the science, tech-nology, and mission concepts that the calibration and val-idation activity must help enable (Fig. 1). The associatedresearch questions result in the identification of five mis-sion and sensor scenarios in the following priority:
An advanced oceanic radiometer (1 km spatial res-olution) in low Earth orbit (LEO) to be enhancedwith measurements of aerosol height and propertieson a subsequent mission,A geostationary radiometer capable of surveyingcoastal regions at an improved spatial resolution(250 m or less) several times a day,A LEO high-spatial resolution (e.g., approximately25 m) radiometer for estuarine and nearshore stud-ies at even higher resolution,A variable fluorescence lidar, andA capability to estimate global mixed layer depths.
The last scenario may not be a direct satellite observation,but could be a model product generated with the assimi-lation of global satellite observations of SST, wind speeds,downwelling irradiation, etc.
To support the mission themes and assist in answer-ing the research questions, the calibration and validationactivity will contribute the following to the ensuing scien-tific investigations: a) provide continuous and consistenthigh-quality satellite-derived radiometric and biogeochem-ical data products; b) establish protocols—including levelsof uncertainties and performance metrics—consistent withthe agreed-upon requirements for in situ and laboratorymeasurements; c) engage the broader scientific communityto participate in calibration and validation activities (fieldprograms, round robins, workshops, etc.); d) provide AOP,IOP, and biogeochemical observations satisfying the qual-ity requirements for calibration and validation activities; e)enable the development of new hardware and software, aswell as its subsequent evaluation; and f) evaluate calibra-tion and validation requirements for new campaigns (e.g.,NACP, SOCP, etc.), missions (e.g., hyperspectral and UVradiometry capabilities), and measurements (e.g., physiol-ogy and functional types).
The implementation timeline for the satellite missionsrequired to support the Advanced Science Plan involvesthree temporal horizons. The immediate (next 1–5 y) timeframe will rely on current (SeaWiFS and MODIS) and op-erational (VIIRS) ocean color missions, which will be pro-viding water-leaving radiances at the standard limited setof wavebands to support the continuation of the historical
22
Stanford B. Hooker, Charles R. McClain, and Antonio Mannino
chlorophyll record. None of these sensors satisfy the obser-vational requirements to answer the four science questionsposed above, and the recommendation is to construct andlaunch a hyperspectral radiometer with global imaging ca-pabilities within this time period, or as soon as technolog-ically possible. The expectation for the near-term (5–10 y)is the exploitation of the aforementioned advanced hyper-spectral imager in conjunction with VIIRS and heritage(climatic) data. Towards the end of this period, the launchof a second-generation hyperspectral imager (with a scan-ning polarimeter and aerosol lidar) is anticipated, whichwould build upon the successes of the first hyperspectralsensor. The long-term (10–25 y) assessment assumes anadvanced hyperspectral imager will have been flown suc-cessfully for at least 10 y, after which, the technology wouldbe ready for transition to an operational phase (to replacethe prior generation of fixed-wavelength instruments).
In terms of vicarious calibration, the schedule and re-quirements for the Advanced Science Plan do not conflictwith what is being done right now. In fact, the highest-priority mission—the hyperspectral imager—builds on Sea-WiFS and MODIS achievements. If changes are made tohow vicarious calibration data are collected, the ability tosupport a hyperspectral mission with the selected alterna-tive will have to be assessed. Because ocean color mea-surements are not fully independent, from a spectral pointof view, a reduced dimensional (spectral) representationmight be viable if it provides significant resource savingsor reduced uncertainties. The future missions will unequiv-ocally require new work, but this does not have to occurimmediately: the new calibration and validation activitiescan be phased in with the execution of the correspondingscience plan components.
Product validation will continue in much the same wayas it has in the past, i.e., PI-supported research with inde-pendent field observations for comparison. SeaBASS willbe continued and expanded to support this work. It isexpected, however, that the suite of products will growsubstantially from the current set of archive products, andthis will require a more coordinated effort to best uti-lize the available ship time and to ensure observations arecollected over the broadest possible range of bio-opticalprovinces. One of the recurring limitations of the pastprograms (SeaWiFS, MODIS, and SIMBIOS) was the in-ability to get complete data sets for algorithm development(e.g., AOPs, IOPs, phytoplankton pigments, CDOM, etc.)that were collected contemporaneously. As a result, uncer-tainties remain in terms of algorithm performance (e.g.,chlorophyll a). In addition, the Advanced Science Planoutlines objectives, such as hazards and habitats, that havenot been a focus in the past. This will require a new setof data product specifications, measurement requirementsand strategies, protocols, and algorithms. Similarly, de-pending on the nature of the fluorescence lidar and its de-rived products, new strategies for validation sampling andmeasurements will probably be needed.
5. Strategic SummaryThe primary objective of this planning document is to
provide the organizational framework for addressing thelong-term need to calibrate and validate oceanic biologicaland biogeochemical satellite data. The philosophy adoptedhere is to accept this as a practical problem that can beaddressed with pragmatic solutions based primarily on theexperience gained from prior satellite missions. A hor-izontal organizational scheme is anticipated wherein theoverall leadership comes from the OBB Program Managerand a Calibration and Validation Team. The entire en-terprise is split into two components of equal stature: a)calibration and validation, and b) satellite data processing.The respective success of these primary functions dependprimarily (but not exclusively) on the radiometric accu-racy of the on-orbit and in situ measurements, as well asthe availability of the near-real time and archived (repro-cessed) product suite.
The desire to create a level playing field extends intothe disciplines required to make calibration and valida-tion activities successful. In the planning for SeaWiFS andMODIS, the calibration and validation paradigm (Hookerand McClain 2000) emphasized the optical measurementswith the biological and biogeochemical contributions rele-gated to secondary or tertiary importance (with the excep-tion of chlorophyll a). Although such a philosophy mighthave been scientifically justified by the emphasis on theopen ocean for those missions, the acknowledged futureof ocean color includes a much wider array of significantlymore complex problems both in the open and coastal ocean(Sect. 4.6). In fact, for many of the anticipated research ar-eas significant contributions are expected from the model-ing community, which was only represented in the originalparadigm as part of the atmospheric correction algorithm.Consequently, the approach here is to ensure all of theneeded disciplines are included at the same priority leveland with no preconceived notions of resource allocations.
All of the plan’s elements are seen to be interdependent,that is, they connect together like puzzle pieces, and whenthey are properly joined, a comprehensive capability forthe entire activity emerges. For example, the calibrationand validation paradigm is completely integrated with thesatellite data processing capability. The full extent of theresulting competency depends very much on the resourcesavailable, but a much smaller internal core functionalityprovides enough of the total effort that significant progresscan be made even during reduced budget cycles.
The scalability of the plan—that is, the scope of in-dividual topics, the range and diversity of research ob-jectives, and the number of investigators involved—is pri-marily accomplished through external connecting-core ele-ments. These elements can be a combination of contractualagreements and peer-reviewed competitions, which are ex-plicitly tied to the Carbon Cycle and Ecosystems FocusArea. The internal core scientists are expected to have
23
A Comprehensive Plan for the Long-Term Calibration and Validation of Oceanic Biogeochemical Satellite Data
a breadth of skills and knowledge that extends through-out the connecting-core elements to ensure a strong unionbetween the scientific community and the plan’s principalelements, but the size of the group is not expected to ex-pand or decrease appreciably over time (unless unforseensignificant changes in the broader program occur).
The detailed elements of the activity are based on thebasic tasks of the two main components plus the currentobjectives of the OBB Program. The core elements forthe calibration and validation component include a) pub-lish protocols and performance metrics to ensure all dataare to within community-approved specifications; b) verifyuncertainty budgets and use the results to update a totaluncertainty budget; c) manage the development and evalu-ation of instrumentation needed to satisfy the present andscheduled research goals of the overall activity; and d) co-ordinate international partnerships to provide the greatestdiversity of global data, skills, and ideas. The core ele-ments for the satellite data processing component are e)process and reprocess multisensor data; f) acquire, dis-tribute, and archive data products; and g) implement newdata products. Both main components have shared respon-sibilities for initializing and temporally monitoring satellitecalibration with the most accurate methods available.
Connecting-core investigations include (but are not re-stricted to) atmospheric correction and characterization,standards and traceability, instrument and analysis roundrobins, field campaigns and vicarious calibration sites, insitu database, bio-optical algorithm (and product) valida-tion, satellite characterization and vicarious calibration,and image processing software. An underlying objectivewithin these activities is to ensure access to the highest-quality satellite and field data possible using sole-sourcecapabilities where appropriate, e.g., an in situ database(SeaBASS), an image processing environment (SeaDAS),a central laboratory for pigment analysis, and a (recom-mended) capability for processing field data with a singleprocessor (first for AOP and then for IOP data).
Public access to the data collected and used in cali-bration and validation activities is an important part ofthe plan. The philosophy advocated here is to make alldata, including the calibration data (i.e., the satellite ra-diance and relevant in situ measurements) available to thecommunity at large through the SeaBASS database, sothose requiring unique processing procedures can imple-ment them. The collection of high-quality data is an ardu-ous task, however, the scientists producing such data needan appropriate amount of time to publish the scientificaccomplishments associated with the data. Consequently,the entire community must agree and support a data policyfor the collection and sharing of field observations.
The plan also includes an accountability process (whichincludes annual reviews evaluated by a team of experts andopen to the wider community), creation of a Calibrationand Validation Team (to help manage and oversee the ac-tivity), and a discussion of issues associated with the plan’s
scientific focus. To ensure the latter has the broadest im-pact and that the scientists involved have a vested interestin the quality of the work being done, each element willhave a set of scientific objectives. The latter must be en-dorsed by the wider community, and the work performedwill be evaluated during the annual review. Core scientistsare also expected to publish their achievements in technicalreports and the peer-reviewed literature. The publicationrequirement is a distinguishing feature, because when re-sults cannot get published or if no attempt is made to doso, it means the scientific process has failed, and the com-munity is left with more questions than answers, which isnot an acceptable outcome.
The OBB Program has traditionally focused on water-leaving radiances and chlorophyll a concentrations in theopen ocean, as well as some experimental products (e.g.,particulate inorganic carbon). The future product suitewill be broadened, very likely move towards semi-analyticalmodels (requiring IOPs plus other biogeochemical mea-surements), and place more emphasis on coastal (optically-complex) waters. This change in perspective will requireadvances in all aspects of the calibration and validationparadigm.
The challenges for satellite, field, and laboratory mea-surements will come from a diversity of disciplines and con-siderable preparation will be required to achieve success.The carbon-based modeling approach provides a good ex-ample of what is needed to improve a data product, inthis case NPP: improved products from spectral-matchingalgorithms, advanced spaceborne sensors using consider-ably greater spectral resolution and range, characterizedrelationships between particulate backscattering and phy-toplankton carbon and its sensitivity to shifts in particlesize distribution, and assessed relationships between thespectral slope of particulate backscattering and the par-ticle size distribution (Loisel et al. 2006). Improvementswill also be needed in characterizing mixed layer light con-ditions (including the remote sensing of physiological mix-ing depths), as well as relating nutrient-dependent changesin carbon-to-chlorophyll ratios to growth rates and howthese relationships differ between different types of nutri-ent stress (e.g., nitrogen limitation versus iron limitation).
The generation of consistent, high-quality data fromnew—and most likely more sophisticated—spaceborne in-struments, multiple ocean color satellites, or a mix of theseplus other types of satellite sensors, all require a diversesuite of very focused and closely coordinated activitiesranging from the design and characterization of satelliteinstruments to the collection of field and laboratory datasets. There are many lessons learned from the SeaWiFS,MODIS, and SIMBIOS experiences. One of the most im-portant is simply the calibration and validation programrequires a core group working full time on coordinating theactivities and resolving the technical issues associated withdata quality.
24
Stanford B. Hooker, Charles R. McClain, and Antonio Mannino
Although the internal core group of scientists are ex-pected to participate in many aspects of calibration andvalidation, the connecting-core researchers, the Calibrationand Validation Team, and the wider scientific communityare expected to help resolve a large diversity of problemsand provide a community-wide approval of the procedures,priorities, and resources applied. Some of the most im-portant issues are how best to a) satisfy the requirementfor vicarious calibration sites, b) properly address opticalcomplexity in coastal waters, c) develop bio-optical algo-rithms, and d) select the remote sensing data products.The SeaWiFS and MODIS experiences have demonstratedthe need for multiple vicarious calibration sites, but thetechnology to be applied and the geographic distributionhave yet to be determined. All of these issues could beresolved in parallel with the optical complexity issue if acommon—but unequivocally suitable—measurement tech-nique is chosen for all these issues. If a common (or cen-tralized) deployment platform and instrument suite can beagreed upon, there is a chance for significant savings, bothin terms of cost and overall uncertainties.
Anticipating unknown problems is always difficult, butbuilding a flexible structure that can rapidly adapt to theunexpected is one of the best ways to be prepared. Theaforementioned scalability of the plan proposed here ispart of the philosophy of building a flexible capability. Areal-world example of an unforeseen problem requiring aflexible response might be the need for a high-latitude,temporary vicarious calibration site for polarization stud-ies. A low-cost, easily deployed capability—rather than afixed site with a mostly static infrastructure—would pro-vide many solution scenarios for unexpected problems (aslong as the data are within the requisite performance re-quirements).
One of the challenges with an approach based on multi-ple vicarious calibration sites, whether they are temporaryor not, is properly reconciling the differences in the satellitegains derived from each site. Assuming the in situ mea-surement capability at all sites are equally competent, theenvironmental conditions (e.g., aerosols, wind speed, sunglint contamination, etc.) will vary and produce a vari-ance in the satellite gains. Quality control procedures willhave to be developed (similar to those already being used,but expanded to accommodate the larger range in the vari-ables) to ensure only the data from the best environmentalconditions are used.
An excellent example of a centralized approach usingmultiple sites has already been demonstrated with the in-creasingly diverse deployment of SeaPRISM units. Thisabove-water radiometry capability has matured sufficientlyto satisfy the accuracy requirements for product validationwhile also providing excellent measurements in opticallycomplex waters throughout the world ocean with almostnegligible instrument fouling (Zibordi et al. 2006). Otheradvantages of this approach are it is based on commer-cial instrumentation, and the infrastructure to calibrate
the sensors, deploy the instruments (especially in coastalsites), and process the data already exists (AERONET).
A compelling inquiry, therefore, is determining whatenhancements (e.g., sensor characterizations) are neededto certify a commercial device like SeaPRISM is accept-able for vicarious calibration exercises. A significant ad-vantage of a network approach over a single site is howquickly the observations for a reliable gain factor analy-sis can be accrued. It took about three years of MOBYdata, for example, to obtain the necessary 40 data points(Franz et al. 2007). Regardless of what solution is pursued,COTS hardware should be considered, because it providesa lower-cost and more flexible alternative to one-of-a-kindand hard-to-replicate instrumentation. The BOUSSOLEbuoy, for example, is providing very good vicarious calibra-tion data using low-cost and easily replicated radiometers.
Perhaps most importantly, both SeaPRISM and BOUS-SOLE achieved a high level of success without using hy-perspectral sensors. This shows the most difficult aspectof the vicarious calibration problem is most likely the (not-so-simple) requirement of making high quality observationsin the harsh marine environment—that is, measurementswith a documented uncertainty in keeping with establishedperformance metrics—rather than puzzling out the intrica-cies of spectral response functions in spaceborne and in situradiometers. This discussion of more practical alternativesis not meant to minimize the significance of understand-ing the spectral characteristics of the instruments involved;it is instead a candid affirmation that the fight is ulti-mately in the field and well beyond the nonetheless impor-tant work done in the laboratory. As the spectral diversityof remote sensing spreads into the UV and NIR or acrossmany more channels, the ensuing complexity might requirean alternative point of view, but for the fixed-wavelengthsatellites currently in operation or planned for launch (e.g.,VIIRS), a rather basic and low-cost approach to vicariouscalibration appears tenable and worth investigating.
Much has been learned since the early 1990s, and theplan presented here takes advantage of this knowledge topropel the entire calibration and validation enterprise intonew areas of endeavor.
This document is based on providing a pragmatic solu-tion to a practical problem, with the pragmatism comingfrom the lessons learned during the execution of histori-cal and current (U.S.) ocean color satellite missions. Itis worth noting in conclusion that an alternative—muchmore distributed—approach for calibrating and validatingsatellite-based ocean biology and biogeochemical measure-ments was tried during the EOS era, but it failed to deliverin many significant aspects of the overall enterprise. Con-sequently, the EOS approach is being revisited, which maylead to its replacement with the collocated architecture es-poused in this plan—and the tightly integrated approachhas already demonstrated a capability of delivering at therequired level of accuracy and timeliness.
25
A Comprehensive Plan for the Long-Term Calibration and Validation of Oceanic Biogeochemical Satellite Data
Acknowledgments
A number of individuals, groups, and organizations made sig-nificant contributions to NASA ocean color research that werecritical in establishing the foundation of accomplishments—that is, the lessons learned—used in the plan presented here.For the authors, this legacy begins with Orbital Sciences Cor-poration (OSC), Santa Barbara Research Center, and ORBIM-AGE who built, launched, and continue to maintain SeaWiFS: aspacecraft and instrument that has worked exceptionally well.It is important to remember, however, that several differentGSFC engineering groups provided critical assistance to OSCin diagnosing problems with the spacecraft, launch vehicle, andinstrument prior to launch.
During the prelaunch phase, NASA senior managers, partic-ularly Bill Townsend, Dixon Butler, and Stan Snyder, weresteadfast in their support. In addition, Bob Kirk and MaryCleave oversaw the early phases through the acceptance of theSeaWiFS instrument and guided much of the spacecraft ac-ceptance and launch, respectively. Throughout the process ofgetting the mission approved and launched, several Ocean Bio-geochemistry Program Managers assisted and represented theProject at NASA headquarters (Marlon Lewis, Greg Mitchell,Robert Frouin, Jim Yoder, Janet Campbell, John Marra, ChuckTrees, and Paula Bontempi).
A number of international collaborations were—and continueto be—sources of key accomplishments, such as the PlymouthMarine Laboratory in the United Kingdom (Jim Aiken), theJoint Research Center in Italy (Giuseppe Zibordi), and the Lab-oratoire d’Oceanographie de Villefranche in France (David An-toine, Herve Claustre, and Andre Morel). Several members ofthe MODIS oceans team made a variety of major contributionsincluding Wayne Esaias, Dennis Clark, Bob Evans, HowardGordon, and Ken Carder.
More recently, the MCST has provided essential support insolving MODIS-A problems and will be an important part-ner in resolving MODIS-T data quality issues. The MCSThas been led by Jack Xiong under the sensor PI, Vince Sa-lomonson. The collaboration with the MCST has also lead toa close working relationship with the analog group for VIIRS,the NPOESS Preparatory Project Instrument CharacterizationSupport Team, also under Jack Xiong’s leadership. These col-laborations have lead to valuable insights into both the MODISand VIIRS sensors as well as characterization methodologiesand data. The collaborations with NIST (primarily Carol John-son) were invaluable to the calibration of not only the SeaWiFSinstrument, but also the in situ data.
The SIMBIOS program made many contributions to NASAocean color activities, especially in the area of internationalcooperation and an international science team. The projectworked extensively on the MOS, OCTS, POLDER, KOMP-SAT, and MODIS-T data sets. Jim Mueller worked at GSFCfor one year as an IPA to assist in getting the project started,and Giulietta Fargion is thanked for her invaluable participa-tion in project management.
Throughout the time period of all these endeavors, ScienceApplications International Corporation and its subcontractors(Science Systems and Applications, Inc., and Futuretech Cor-poration) provided, and continue to provide, a talented anddedicated support staff. The ocean color research communityhas given unwavering support and guidance to the various sat-ellite missions, which has been a great encouragement.
Finally, the broader scientific community is recognized for shar-ing their ideas and insights in a public review of the first draft ofthis document. The scientists who took time from their preciousresearch activities or government duties to carefully ponder thecomplexities of such a far-reaching plan and make useful com-ments are gratefully acknowledged. The individuals who wereapproached after the review are thanked for their willingnessto provide comments or material to address specific aspects ofthe document (notably Mike Behrenfeld).
Glossary
AAOT Acqua Alta Oceanographic TowerAERONET Aerosol Robotic Network
AMT Atlantic Meridional TransectAOPs Apparent Optical Properties
BOUSSOLE Bouee pour l’acquisition de Series Optiques aLong Terme (buoy for the acquisition of a long-term optical series).
CALIPSO Cloud-Aerosol Lidar and Infrared PathfinderSatellite Observations
CDOM Colored Dissolved Organic MatterCDR Climate Data RecordChl a Chlorophyll a
CHORS Center for Hydro-Optics and Remote SensingCIMEL Not an acronym, but the name of a sun pho-
tometer manufacturer.COCOA Coastal Ocean Carbon Observations and Ap-
plicationsCOTS Commercial Off-the-ShelfCZCS Coastal Zone Color Scanner
DARR Data Analysis Round-RobinDARR-94 The first DARR activity (1994).DARR-00 The second DARR activity (2000).
DOC Dissolved Organic Carbon
EOS Earth Observing System
GOCECP Global Ocean Carbon, Ecosystems, and Coast-al Processes
HPL Horn Point LaboratoryHPLC High Performance Liquid Chromatography
Rrs(λ) Spectral remote sensing reflectance.Rs Minimum resolution (between two pigments).
[TChl a] Total chlorophyll a concentration.
X Independent observation.
Y Dependent (reference) value.
λ Wavelength (of light).
ξ Average precision.ξcal Precision of the (calibration) dilution devices.ξinj Average injection precision.ξt
RAverage retention time precision.
ρW Radiance reflectance.
|ψ| Average accuracy (based on the average absolutepercent difference.
|ψ|res Average absolute percent differences of the residualsto the calibration fit for Chl a.
References
Abbott, M.R., O.B. Brown, H.R. Gordon, K.L. Carder, R.E.Evans, F.E. Muller-Karger, and W.E. Esaias, 1994: OceanColor in the 21st Century: A Strategy for a 20 -Year TimeSeries. NASA Tech. Memo. 104566, Vol. 17, S.B. Hookerand E.R. Firestone, Eds., NASA Goddard Space FlightCenter, Greenbelt, Maryland, 20 pp.
Aiken, J., N. Rees, S. Hooker, P. Holligan, A. Bale, D. Robins,G. Moore, R. Harris, and D. Pilgrim, 2000: The Atlan-tic Meridional Transect: Overview and synthesis of data.Prog. Oceanogr., 45, 257–312.
Antoine, D., J-M. Andre, and A. Morel, 1996: Oceanic pri-mary production 2. Estimation at global scale from satel-lite (coastal zone color scanner) chlorophyll. Global Bio-geochem. Cycles, 10, 57–69.
, M. Chami, H. Claustre, A. Morel, G. Becu, B. Gen-tili, F. Louis, J. Ras, E. Roussier, A.J. Scott, D. Tailliez,S.B. Hooker, P. Guevel, J-F. Deste, C. Dempsey, and D.Adams, 2006: BOUSSOLE: A Joint ESA, CNES, CNRS,and NASA Ocean Color Calibration and Validation Ac-tivity. NASA Tech. Memo. 2006–214147, NASA GoddardSpace Flight Center, Greenbelt, Maryland, 59 pp.
Bailey, S.W., W.D. Robinson, and B.A. Franz, 2003: “Modifi-cations to SeaWiFS NIR correction.” In: Patt, F.S., R.A.Barnes, R.E. Eplee, Jr., B.A. Franz, W.D. Robinson, G.C.Feldman, S.W. Bailey, J. Gales, P.J. Werdell, M. Wang, R.Frouin, R.P. Stumpf, R.A. Arnone, R.W. Gould, Jr., P.M.Martinolich, V. Ransibrahmanakul, J.E. O’Reilly, and J.A.Yoder, 2003: Algorithm Updates for the Fourth SeaWiFSData Reprocessing, NASA Tech. Memo. 2003–206892,Vol. 22, S.B. Hooker and E.R. Firestone, Eds., NASA God-dard Space Flight Center, Greenbelt, Maryland, 26–28.
27
A Comprehensive Plan for the Long-Term Calibration and Validation of Oceanic Biogeochemical Satellite Data
Baith, K., R. Lindsay, G. Fu, and C.R. McClain, 2001: Dataanalysis system developed for ocean color satellite sensors.Eos, Trans., Amer. Geophys. Union, 82, 202.
Barnes, R.A., W.L. Barnes, W.E. Esaias, and C.R. McClain,1994a: Prelaunch Acceptance Report for the SeaWiFS Ra-diometer. NASA Tech. Memo. 104566, Vol. 22, S.B. Hook-er, E.R. Firestone, and J.G. Acker, Eds., NASA GoddardSpace Flight Center, Greenbelt, Maryland, 32 pp.
, A.W. Holmes, W.L. Barnes, W.E. Esaias, C.R. McClain,and T. Svitek, 1994b: SeaWiFS Prelaunch RadiometricCalibration and Spectral Characterization. NASA Tech.Memo. 104566, Vol. 23, S.B. Hooker, E.R. Firestone, andJ.G. Acker, Eds., NASA Goddard Space Flight Center,Greenbelt, Maryland, 55 pp.
, A.W. Holmes, and W.E. Esaias, 1995: Stray Light in theSeaWiFS Radiometer. NASA Tech. Memo. 104566, Vol.31, S.B. Hooker, E.R. Firestone, and J.G. Acker, Eds.,NASA Goddard Space Flight Center, Greenbelt, Mary-land, 76 pp.
, R.E. Eplee, Jr., G.M. Schmidt, F.S. Patt, and C.R. Mc-Clain, 2001: The calibration of SeaWiFS, part 1: Directtechniques, Appl. Opt., 40, 6,682–6,700.
Behrenfeld, M.J., and P.G. Falkowski, 1997: Photosyntheticrates derived from satellite-based chlorophyll concentra-tion. Limnol. Oceanogr., 42, 1–20.
, E. Maranon, D.A. Siegel, and S.B. Hooker, 2002: A pho-toacclimation and nutrient based model of light-saturatedphotosynthesis for quantifying oceanic primary production.Mar. Ecol. Prog. Ser., 228, 103–117.
, O. Prasil, M. Babin, and F. Bruyant, 2004: In search ofa physiological basis for covariations in light-limited andlight-saturated photosynthesis. J. Phycology., 40, 4–25.
, E. Boss, D.A. Siegel, and D.M. Shea, 2005: Carbon-based ocean productivity and phytoplankton physiologyfrom space. Global Biogeochem. Cycles, 19, GB1006, doi:10.1029/2004GB002299.
Chang, G., K. Mahoney, A. Briggs-Whitmire, D.D.R. Kohler,C.D. Mobley, M. Lewis, M. Moline, E. Boss, M. Kim, W.Philpot, and T.D. Dickey, 2004: The new age of hyper-spectral oceanography. Oceanogr., 17, 16–23.
Clark, D., H.R. Gordon, K.J. Voss, Y. Ge, W. Broenkow, andC. Trees, 1997: Validation of atmospheric correction overthe oceans. J. Geophys. Res., 102, 17,209–17,217.
Claustre, H., S.B. Hooker, L. Van Heukelem, J-F. Berthon, R.Barlow, J. Ras, H. Sessions, C. Targa, C. Thomas, D. vander Linde, and J-C. Marty, 2004: An intercomparison ofHPLC phytoplankton pigment methods using in situ sam-ples: Application to remote sensing and database activi-ties. Mar. Chem., 85, 41–61.
Eplee, R.E., Jr., W.D. Robinson, S.W. Bailey, D.K. Clark, P.J.Werdell, M. Wang, R.A. Barnes, and C.R. McClain, 2001:The calibration of SeaWiFS, part 2: Vicarious techniques,Appl. Opt., 40, 6,701–6,718.
Esaias, W.E., M.R. Abbott, I. Barton, O.B. Brown, J.W.Campbell, K.L. Carder, D.K. Clark, R.H. Evans, F.E.Hoge, H.R. Gordon, W.M. Balch, R. Letelier, and P.J. Min-nett, 1998: An overview of MODIS capabilities for oceanscience observations. IEEE Trans. Geosci. Remote Sens.,36, 1,250–1,265.
Evans, R.H., and H.R. Gordon, 1994: CZCS system calibration:A retrospective examination. J. Geophys. Res., 99, 7,293–7,307.
Firestone, E.R., and S.B. Hooker, 2004: SeaWiFS PostlaunchTechnical Report Series Final Cumulative Index. NASATech. Memo. 2004–206892, Vol. 29, S.B. Hooker and E.R.Firestone, Eds., NASA Goddard Space Flight Center,Greenbelt, Maryland, 44 pp.
Franz, B.A., P.J. Werdell, G. Meister, S.W. Bailey, R.E. Eplee,Jr., G.C. Feldman, E. Kwiatkowska, C.R. McClain, F.S.Patt, and D. Thomas, 2005: The continuity of ocean colormeasurements from SeaWiFS to MODIS. Proc. SPIE,Earth Observing Systems X, San Diego, California.
, S.W. Bailey, P.J. Werdell, C.R. McClain, 2007: Sensor-independent approach to the vicarious calibration of satel-lite ocean color radiometry. Appl. Opt., (in press).
Fu, G., B.D. Scheiber, K.J. Settle, M. Darzi, C.R. McClainand K.R. Arrigo, 1996: SeaDAS: A processing package forocean color satellite imagery, Proc. Twelfth Int. Conf. onInteractive Inform. and Processing Systems for Meteorol.,Oceanogr., and Hydrol., American Meteorological Society,Boston, Massachusetts, 451–456.
Gordon, H.R., 1987: Calibration requirements and methodol-ogy for remote sensors viewing the ocean in the visible.Remote Sens. Environ., 22, 103–126.
, D.K. Clark, J.L. Mueller, and W.A. Hovis, 1980: Phy-toplankton pigments from the NIMBUS-7 Coastal ZoneColor Scanner: Comparisons with surface measurements.Science, 210, 63–66.
, and , 1981: Clear water radiances for atmosphericcorrection of coastal zone color scanner imagery. Appl.Opt., 20, 4,175–4,180.
, , J.W. Brown, O.B. Brown, R.H. Evans, and W.W.Broenkow, 1983: Phytoplankton pigment concentrationsin the Middle Atlantic Bight: Comparison of ship determi-nations and CZCS estimates. Appl. Opt., 22, 20–36.
Holben, B.N., T.F. Eck, I. Slutsker, D. Tanre, J.P. Buis, A.Setzer, E. Vermote, J.A. Reagan, Y.J. Kaufman, T.Nakajima, F. Lavenu, I. Jankowiak, and A. Smirnov, 1998:AERONET—A federated instrument network and data ar-chive for aerosol characterization. Remote Sens. Environ.,66, 1–16.
Hooker, S.B., and W.E. Esaias, 1993: An overview of the Sea-WiFS project. Eos, Trans., Amer. Geophys. Union, 74,241–246.
, C.R. McClain, J.K. Firestone, T.L. Westphal, E-n. Yeh,and Y. Ge, 1994: The SeaWiFS Bio-Optical Archive andStorage System (SeaBASS), Part 1. NASA Tech. Memo.104566, Vol. 20, S.B. Hooker and E.R. Firestone, Eds.,NASA Goddard Space Flight Center, Greenbelt, Mary-land, 40 pp.
28
Stanford B. Hooker, Charles R. McClain, and Antonio Mannino
, and S. Maritorena, 2000: An evaluation of oceanographicradiometers and deployment methodologies. J. Atmos.Ocean. Technol., 17, 811–830.
, and C.R. McClain, 2000: The calibration and validationof SeaWiFS data. Prog. Oceanogr., 45, 427–465.
, H. Claustre, J. Ras, L. Van Heukelem, J-F. Berthon,C. Targa, D. van der Linde, R. Barlow, and H. Sessions,2000a: The First SeaWiFS HPLC Analysis Round-Robin Experiment (SeaHARRE-1). NASA Tech. Memo.2000–206892, Vol. 14, S.B. Hooker and E.R. Firestone,Eds., NASA Goddard Space Flight Center, Greenbelt,Maryland, 42 pp.
, G. Zibordi, J-F. Berthon, S.W. Bailey, and C.M. Pietras,2000b: The SeaWiFS Photometer Revision for IncidentSurface Measurement (SeaPRISM) Field Commissioning.NASA Tech. Memo. 2000–206892, Vol. 13, S.B. Hookerand E.R. Firestone, Eds., NASA Goddard Space FlightCenter, Greenbelt, Maryland, 24 pp.
, G. Zibordi, J-F. Berthon, D. D’Alimonte, S. Maritorena,S. McLean, and J. Sildam, 2001: Results of the Second Sea-WiFS Data Analysis Round Robin, March 2000 (DARR-00). NASA Tech. Memo. 2001–206892, Vol. 15, S.B. Hook-er and E.R. Firestone, Eds., NASA Goddard Space FlightCenter, Greenbelt, Maryland, 71 pp.
, S. McLean, J. Sherman, M. Small, G. Lazin, G. Zi-bordi, and J.W. Brown, 2002: The Seventh SeaWiFS Inter-calibration Round-Robin Experiment (SIRREX-7),March 1999. NASA Tech. Memo. 2002–206892, Vol. 17,S.B. Hooker and E.R. Firestone, Eds., NASA GoddardSpace Flight Center, Greenbelt, Maryland, 69 pp.
, G. Zibordi, J-F. Berthon, and J.W. Brown, 2004: Above-water radiometry in shallow, coastal waters. Appl. Opt.,43, 4,254–4,268.
, and G. Zibordi, 2005: Platform perturbations in above-water radiometry. Appl. Opt., 44, 553–567.
, L. Van Heukelem, C.S. Thomas, H. Claustre, J. Ras, L.Schluter, J. Perl, C. Trees, V. Stuart, E. Head, R. Bar-low, H. Sessions, L. Clementson, J. Fishwick, C. Llewellyn,and J. Aiken, 2005: The Second SeaWiFS HPLC AnalysisRound-Robin Experiment (SeaHARRE-2). NASA Tech.Memo. 2005–212785, NASA Goddard Space Flight Cen-ter, Greenbelt, Maryland, 112 pp.
Huot, Y., C.A. Brown, and J.J. Cullen, 2007: Simultaneousinversion of reflectance, the diffuse attenuation coefficient,and sun-induced fluorescence in coastal waters. J. Geo-phys. Res., (in press).
Johnson, B.C., S.S. Bruce, E.A. Early, J.M. Houston, T.R.O’Brian, A. Thompson, S.B. Hooker, and J.L. Mueller,1996: The Fourth SeaWiFS Intercalibration Round-RobinExperiment (SIRREX-4), May 1995. NASA Tech. Memo.104566, Vol. 37, S.B. Hooker and E.R. Firestone, Eds.,NASA Goddard Space Flight Center, Greenbelt, Mary-land, 65 pp.
, E.A. Early, R.E. Eplee, Jr., R.A. Barnes, and R.T. Caf-frey, 1999a: The 1997 Prelaunch Radiometric Calibrationof SeaWiFS. NASA Tech. Memo. 1999–206892, Vol. 4,S.B. Hooker and E.R. Firestone, Eds., NASA GoddardSpace Flight Center, Greenbelt, Maryland, 51 pp.
, H.W. Yoon, S.S. Bruce, P-S. Shaw, A. Thompson, S.B.Hooker, R.E. Eplee, Jr., R.A. Barnes, S. Maritorena,and J.L. Mueller, 1999b: The Fifth SeaWiFS Intercali-bration Round-Robin Experiment (SIRREX-5), July 1996.NASA Tech. Memo. 1999–206892, Vol. 7, S.B. Hooker andE.R. Firestone, Eds., NASA Goddard Space Flight Center,75 pp.
Joint Global Ocean Flux Study, 1991: JGOFS Core Measure-ments Protocols. JGOFS Report No. 6, Scientific Commit-tee on Oceanic Research, 40 pp.
Laurion, I., F. Blouin, and S. Roy, 2003: The quantitative filtertechnique for measuring phytoplankton absorption: Inter-ference by MAAs in the UV waveband. Limnol. Oceanogr.Meth., 1, 1–9.
Lee, Z., and K.L. Carder, 2004: Absorption spectrum of phy-toplankton pigments derived from hyperspectral remote-sensing reflectance. Remote Sens. Environ., 89, 361–368.
Lindeman, R.L., 1942: The trophic-dynamic aspect of ecology.Ecology, 23, 399–418.
Loisel, H., J-M. Nicolas, A. Sciandra, D. Stramski, and A.Poteau, 2006: Spectral dependency of optical backscatter-ing by marine particles from satellite remote sensing of theglobal ocean. J. Geophys. Res., 111, C09024 doi:10.1029/2005JC003367.
Longhurst, A., S. Sathyendranath, T. Platt, and C. Caverhill,1995: An estimate of global primary production in theocean from satellite radiometer data. J. Plankton Res.,17, 1,245–1,271.
McClain, C.R., W.E. Esaias, W. Barnes, B. Guenther, D. En-dres, S.B. Hooker, B.G. Mitchell, and R. Barnes, 1992:SeaWiFS Calibration and Validation Plan. NASA Tech.Memo. 104566, Vol. 3, S.B. Hooker and E.R. Firestone,Eds., NASA Goddard Space Flight Center, Greenbelt,Maryland, 41 pp.
, and G.S. Fargion, 1999: SIMBIOS Project 1998 AnnualReport. NASA Tech. Memo. 1999–208645, NASA God-dard Space Flight Center, Greenbelt, Maryland, 105 pp.
, W. Esaias, G. Feldman, R. Frouin, W. Gregg, and S.Hooker, 2002: The Proposal for the NASA Sensor Inter-calibration and Merger for Biological and InterdisciplinaryOceanic Studies (SIMBIOS) Program, 1995. NASA Tech.Memo. 2002–210008, NASA Goddard Space Flight Center,Greenbelt, Maryland, 54 pp. plus graphical plates.
, G.C. Feldman, and S.B. Hooker, 2004: An overview ofthe SeaWiFS project and strategies for producing a climateresearch quality global ocean bio-optical time series. DeepSea Res. II, 51, 5–42.
29
A Comprehensive Plan for the Long-Term Calibration and Validation of Oceanic Biogeochemical Satellite Data
, S. Hooker, G. Feldman, and P. Bontempi, 2006: Satel-lite data for ocean biology, biogeochemistry, and climateresearch. Eos, Trans., Amer. Geophys. Union, 87, 337,343.
Meister, G., P. Abel, K. Carder, A. Chapin, J. Cooper, C.Davis, M. Godin, D. Goebel, G. Fargion, R. Frouin, D.Korwan, R. Maffione, C. McClain, S. McLean, D. Men-zies, A. Poteau, J. Robertson, and J. Sherman, 2002: TheFirst SIMBIOS Radiometric Intercomparison (SIMRIC-1),April–September 2001. NASA Tech. Memo. 2002–210006,NASA Goddard Space Flight Center, Greenbelt, Mary-land, 60 pp.
, , R. Barnes, J. Cooper, C. Davis, D. English,G. Fargion, M. Feinholz, R. Frouin, F. Hoge, D. Kor-wan, G. Lazin, C. McClain, S. McLean, D. Menzies, A.Poteau, J. Robertson, J. Sherman, K. Voss, and J. Yungel,2003: The Second SIMBIOS Radiometric Intercomparison(SIMRIC-2), March–November 2002. NASA Tech. Memo.2002–210006, Vol. 2, NASA Goddard Space Flight Center,Greenbelt, Maryland, 65 pp.
Mitchell, G., A. Bricaud, K. Carder, J. Cleveland, G. Ferrari,R. Gould, M. Kahru, M. Kishino, H. Maske, T. Moisan,L. Moore, N. Nelson, D. Phinney, R. Reynolds, H. Sosik,D. Stramski, S. Tassan, C.C. Trees, A. Weidemann, J.Wieland, and A. Vodacek, 2000: “Determination of spec-tral absorption coefficients of particles, dissolved materialand phytoplankton for discrete water samples.” In: Far-gion, G.S., and J.L. Mueller, Eds., Ocean Optics Protocolsfor Satellite Ocean Color Sensor Validation, Revision 2.NASA Tech. Memo. 2000–209966/Rev2, NASA GoddardSpace Flight Center, Greenbelt, Maryland, 125–153.
, M. Kahru, J. Wieland, and M. Stramska, 2003: “De-termination of spectral absorption coefficients of particles,dissolved material and phytoplankton for discrete watersamples.” In: Mueller, J.L., G.S. Fargion, and C.R. Mc-Clain, Eds., Ocean Optics Protocols for Satellite OceanColor Sensor Validation, Revision 4, Volume IV. NASATech. Memo. 2003–211621/Rev4–Vol.IV., NASA GoddardSpace Flight Center, Greenbelt, Maryland, 39–64.
Morel, A., and L. Prieur, 1977: Analysis of variations in oceancolor. Limnol. Oceanogr., 22, 709–722.
Mueller, J.L., 1993: The First SeaWiFS IntercalibrationRound-Robin Experiment, SIRREX-1, July 1992. NASATech. Memo. 104566, Vol. 14, S.B. Hooker and E.R. Fire-stone, Eds., NASA Goddard Space Flight Center, Green-belt, Maryland, 60 pp.
, 1995: “Comparison of irradiance immersion coefficientsfor several marine environmental radiometers (MERs).”In: Mueller, J.L., R.S. Fraser, S.F. Biggar, K.J. Thome,P.N. Slater, A.W. Holmes, R.A. Barnes, C.T. Weir, D.A.Siegel, D.W. Menzies, A.F. Michaels, and G. Podesta, CaseStudies for SeaWiFS Calibration and Validation, Part 3.NASA Tech. Memo. 104566, Vol. 27, S.B. Hooker, E.R.Firestone, and J.G. Acker, Eds., NASA Goddard SpaceFlight Center, Greenbelt, Maryland, 3–15.
, 2000: “Overview of measurement and data analysis pro-tocols.” In: Fargion, G.S., and J.L. Mueller, Ocean OpticsProtocols for Satellite Ocean Color Sensor Validation, Re-vision 2. NASA Tech. Memo. 2000–209966, NASA God-dard Space Flight Center, Greenbelt, Maryland, 87–97.
, 2002: “Overview of measurement and data analysis pro-tocols.” In: Mueller, J.L., and G.S. Fargion, Ocean OpticsProtocols for Satellite Ocean Color Sensor Validation, Re-vision 3, Vol. 1. NASA Tech. Memo. 2002–210004/Rev3–Vol1, NASA Goddard Space Flight Center, Greenbelt,Maryland, 123–137.
, 2003: “Overview of measurement and data analysis meth-ods.” In: Mueller, J.L., and 17 Coauthors, Ocean Op-tics Protocols for Satellite Ocean Color Sensor Vali-dation, Revision 4, Volume III: Radiometric Measurementsand Data Analysis Protocols. NASA Tech. Memo. 2003–211621/Rev4–Vol.III, NASA Goddard Space Flight Cen-ter, Greenbelt, Maryland, 1–20.
, and R.W. Austin, 1992: Ocean Optics Protocols for Sea-WiFS Validation. NASA Tech. Memo. 104566, Vol. 5, S.B.Hooker and E.R. Firestone, Eds., NASA Goddard SpaceFlight Center, Greenbelt, Maryland, 43 pp.
, B.C. Johnson, C.L. Cromer, J.W. Cooper, J.T. Mc-Lean, S.B. Hooker, and T.L. Westphal, 1994: The Sec-ond SeaWiFS Intercalibration Round-Robin Experiment,SIRREX-2, June 1993. NASA Tech. Memo. 104566, Vol.16, S.B. Hooker and E.R. Firestone, Eds., NASA GoddardSpace Flight Center, Greenbelt, Maryland, 121 pp.
, and R.W. Austin, 1995: Ocean Optics Protocols for Sea-WiFS Validation, Revision 1. NASA Tech. Memo. 104566,Vol. 25, S.B. Hooker, E.R. Firestone, and J.G. Acker, Eds.,NASA Goddard Space Flight Center, Greenbelt, Mary-land, 66 pp.
, B.C. Johnson, C.L. Cromer, S.B. Hooker, J.T. McLean,and S.F. Biggar, 1996: The Third SeaWiFS Intercali-bration Round-Robin Experiment (SIRREX-3), 19–30 Sep-tember 1994. NASA Tech. Memo. 104566, Vol. 34, S.B.Hooker, E.R. Firestone, and J.G. Acker, Eds., NASA God-dard Space Flight Center, Greenbelt, Maryland, 78 pp.
, and A. Morel, 2003: “Fundamental Definitions, Relation-ships and Conventions.” In: Mueller, J.L., and 4 Coau-thors, Ocean Optics Protocols for Satellite Ocean ColorSensor Validation, Revision 4, Volume I: RadiometricMeasurements and Data Analysis Protocols. NASA Tech.Memo. 2003–211621/Rev4–Vol.I, NASA Goddard SpaceFlight Center, Greenbelt, Maryland, 11–30.
O’Reilly, J.E., S. Maritorena, B.G. Mitchell, D.A. Siegel, K.L.Carder, S.A. Garver, M. Kahru, and C. McClain, 1998:Ocean color chlorophyll algorithms for SeaWiFS. J. Geo-phys. Res., 103, 24,937–24,953.
Riley, T., and S. Bailey, 1998: The Sixth SeaWiFS/SIMBIOSIntercalibration Round-Robin Experiment (SIRREX-6)August–December 1997. NASA Tech. Memo. 1998–206878, NASA Goddard Space Flight Center, Greenbelt,Maryland, 26 pp.
30
Stanford B. Hooker, Charles R. McClain, and Antonio Mannino
Siegel, D.A., M.C. O’Brien, J.C. Sorensen, D.A. Konnoff, E.A.Brody, J.L. Mueller, C.O. Davis, W.J. Rhea, and S.B.Hooker, 1995: Results of the SeaWiFS Data AnalysisRound-Robin (DARR-94), July 1994. NASA Tech. Memo.104566, Vol. 26, S.B. Hooker and E.R. Firestone, Eds.,NASA Goddard Space Flight Center, Greenbelt, Mary-land, 58 pp.
, M. Wang, S. Maritorena, and W. Robinson, 2000: At-mospheric correction of satellite ocean-color imagery: theblack pixel assumption. Appl. Optics, 39, 3,582–3,591.
, S. Maritorena, N.B. Nelson, and M.J. Behrenfeld, 2005:Independence and interdependencies among globalocean color properties: Reassessing the bio-optical assump-tion. J. Geophys. Res., 110, C07011, doi:10.1029/2004JC002527.
Van Heukelem, L., and C. Thomas, 2001: Computer-assistedhigh-performance liquid chromatography method develop-ment with applications to the isolation and analysis of phy-toplankton pigments. J. Chromatogr. A., 910, 31–49.
, , and P.M. Glibert, 2002: Sources of Variability inChlorophyll Analysis by Fluorometry and High-Performance Liquid Chromatography in a SIMBIOS Inter-calibration Exercise. NASA Tech. Memo. 2002–211606,G.S. Fargion and C.R. McClain, Eds., NASA GoddardSpace Flight Center, Greenbelt, Maryland, 50 pp.
Werdell, P.J., S. Bailey, G. Fargion, C. Pietras, K. Knobel-spiesse, G. Feldman, and C. McClain, 2003: Unique data
Westberry, T., M.J. Behrenfeld, D.A. Siegel, E. Boss, 2007:Carbon-based primary productivity modeling with verti-cally resolved photophysiology. Global Biogeochem. Cycles,(submitted).
Zibordi, G., D. D’Alimonte, D. van der Linde, J-F. Berthon,S.B. Hooker, J.L. Mueller, G. Lazin, and S. McLean, 2002a:The Eighth SeaWiFS Intercalibration Round-Robin Ex-periment (SIRREX-8), September–December 2001. NASATech. Memo. 2002–206892, Vol. 21, S.B. Hooker andE.R. Firestone, Eds., NASA Goddard Space Flight Cen-ter, Greenbelt, Maryland, 39 pp.
, S.B. Hooker, J-F. Berthon, and D. D’Alimonte, 2002b:Autonomous above-water radiance measurements from anoffshore platform: A field assessment experiment. J. At-mos. Oceanic Technol., 19, 808–819.
, F. Melin, S.B. Hooker, D. D’Alimonte, and B. Holben,2004: An autonomous above-water system for the valida-tion of ocean color radiance data. Trans. IEEE Trans.Geosci. Remote Sens., 42, 401–415.
, B. Holben, S.B. Hooker, F. Melin, J-F. Berthon, I.Slutsker, D. Giles, D. Vandemark, H. Feng, K. Rutledge,G. Schuster, and A. Al Mandoos, 2006: A network forstandardized ocean color validation measurements. Eos,Trans., Amer. Geophys. Union, 84, 293, 297.
31
REPORT DOCUMENTATION PAGE Form Approved OMB No. 0704-0188
The public reporting burden for this collection of information is estimated to average 1 hour per response, including the time for reviewing instructions, searching existingdata sources, gathering and maintaining the data needed, and completing and reviewing the collection of information. Send comments regarding this burden estimate or any other aspect of this collection of information, including suggestions for reducing this burden, to Department of Defense, Washington Headquarters Services, Directoratefor Information Operations and Reports (0704-0188), 1215 Jefferson Davis Highway, Suite 1204, Arlington, VA 22202-4302. Respondents should be aware thatnotwithstanding any other provision of law, no person shall be subject to any penalty for failing to comply with a collection of information if it does not display a currentlyvalid OMB control number. PLEASE DO NOT RETURN YOUR FORM TO THE ABOVE ADDRESS.1. REPORT DATE (DD-MM-YYYY) 2. REPORT TYPE 3. DATES COVERED (From – To)
4. TITLE AND SUBTITLE 5a. CONTRACT NUMBER
5b. GRANT NUMBER
5c. PROGRAM ELEMENT NUMBER
6. AUTHOR(S) 5d. PROJECT NUMBER
5e. TASK NUMBER
5f. WORK UNIT NUMBER
7. PERFORMING ORGANIZATION NAME(S) AND ADDRESS(ES) 8. PERFORMING ORGANIZATIONREPORT NUMBER
9. SPONSORING/MONITORING AGENCY NAME(S) AND ADDRESS(ES) 10. SPONSORING/MONITOR'S ACRONYM(S)
11. SPONSORING/MONITORINGREPORT NUMBER
12. DISTRIBUTION/AVAILABILITY STATEMENT
13. SUPPLEMENTARY NOTES
14. ABSTRACT
15. SUBJECT TERMS
16. SECURITY CLASSIFICATION OF: 17. LIMITATION OF ABSTRACT
18. NUMBER OFPAGES
19b. NAME OF RESPONSIBLE PERSON
a. REPORT b. ABSTRACT c. THIS PAGE19b. TELEPHONE NUMBER (Include area code)
Standard Form 298 (Rev. 8-98)Prescribed by ANSI Std. Z39-18
This document establishes a long-term capability for calibrating and validating oceanic biogeochemical satellite data, and involves two components of equal stature:calibration and validation plus satellite data processing. The sub-elements are based on the basic tasks of the two main components plus the current objectives of theCarbon Cycle and Ecosystems Roadmap. The former is distinguished by an internal core set of responsibilities and the latter is facilitated through an external connecting-core ring of competed or contracted activities. The core elements for calibration and validation include publish protocols and performance metrics;verify uncertainty budgets; manage the development and evaluation of instrumentation; and coordinate international partnerships. The core elements for satellitedata processing are process and reprocess multisensor data; acquire, distribute, and archive data products; and implement new data products. Both componentsshare responsibilities for initializing and temporally monitoring satellite calibration. Connecting-core elements involve atmospheric correction and characterization,standards and traceability, instrument and analysis round robins, field campaigns and vicarious calibration sites, in situ database, bio-optical algorithm validation,satellite characterization and vicarious calibration, and image processing software. The plan also includes an accountability process, creating a Calibration andValidation Team, and a discussion of issues associated with the plan's scientific focus.
Ocean Color, SeaWiFS, MODIS, Ocean Biogeochemistry, Calibration and Validation�
03-07-2007 Special Publication
NASA Strategic Planning Document: A Comprehensive Plan for the Long-TermCalibration and Validation of Oceanic Biogeochemical Satellite Data�
2007-00805-0�
Stanford B. Hooker, Charles R. McClain, and Antonio Mannino�
Goddard Space Flight CenterGreenbelt, MD 20771�
National Aeronautics and Space AdministrationWashington, DC 20546-0001�
Unclassified-Unlimited, Subject Category: 48Report available from the NASA Center for Aerospace Information, 7115 Standard Drive, Hanover, MD 21076. (301)621-0390�