NASA TECHNICAL NOTE NASA TN D c. / "- -6345 ANALYTIC STUDIES OF SOUND PRESSURES INSIDE THE DUCT OF DUCTED PROPELLERS by Joseph A. Drischler Langley Reseurch Center ~umpton, 'vu. 23365 ' . , . . I . ' .. . ' ., NATIONAL AERONAUTICS AND SPACE ADMINISTRATION WASHINGTON, D. C. SEPTEMBER 1971 f 1 11 1 https://ntrs.nasa.gov/search.jsp?R=19710024533 2018-07-14T04:29:22+00:00Z
Transcript
NASA TECHNICAL NOTE NASA TN D c. / "- -6345
ANALYTIC STUDIES OF SOUND PRESSURES INSIDE THE DUCT OF DUCTED PROPELLERS
by Joseph A. Drischler
Langley Reseurch Center ~umpton, 'vu. 23365
' . ,
. . I . '
.. . ' .,
NATIONAL AERONAUTICS AND SPACE ADMINISTRATION WASHINGTON, D. C. SEPTEMBER 1971
1. Report No. NASA TN D-6345 I 2. Government Accession No.
4. Title and Subtitle ~~
A N A L Y ~ C STUDIES OF SOUND PRESSURES INSIDE THE DUCTOFDUCTEDPROPELLERS
7. Author(s)
Joseph A. Drischler
9. Performing Organization Name and Address
.NASA Langley Research Center Hampton, Va. 23365
12. Sponsoring Agency Name and Address
National Aeronautics and Space Administration Washington, D.C. 20546
~
15. Supplementary Notes ..
3. Recipient's C a t a l o g No.
5. Report Date September 1971
6. Performing Organization Code
8. Performing Organization Report No.
L-7378 10. Work Unit No.
136-80-01-04 11. Contract or Grant No.
13. Type of Report and Period Covered
Technical Note 14. Sponsoring Agency Code
L"" ~ ~
I ." - - .~
16. Abstract -
The sound-pressure field of a rotating ducted propeller in forward flight is analyzed by replacing the duct by an infinite coaxial circular cylinder and assuming that the blade- loading distribution associated with the thrust and the torque can be represented by a dis- tribution of acoustic pressure doublets acting at the propeller disk. Trend studies are made to ascertain the effect on the pressure distribution inside the duct of variations in propeller loading, tip clearance, free-stream Mach number, tip Mach number, and hub-tip ratio. The effect on the pressure distribution of concentrating the loading at various radial positions on the propeller blade is also investigated.
L - ~ _ _ ~ - ."
17. Key Words (Suggested by Authoris))
Ducted propellers Sound pressure Noise
1 18. Distribution Statement
Unclassified - Unlimited
I 1 - I .. ~ - " I
19. Security Claaif. (of this report) 20. Security Classif. (of this page) 22. Rice' 21. NO. of pages
Unclassified Unclassified $3.00 39 . " . -. . - ~
~~ -~
For sale by the National Technical Information Service, Springfield, Virginia 22151
.
ANALYTIC STUDIES OF SOUND PRESSURES INSIDE THE DUCT
OF DUCTED PROPELLERS
By Joseph A. Drischler Langley Research Center
The sound-pressure field of a rotating ducted propeller in forward flight is analyzed by replacing the duct by an infinite coaxial circular cylinder and assuming that the blade- loading distribution associated with thrust and torque can be represented by a distribution of acoustic pressure doublets acting at the propeller disk. Trend studies are made to ascertain the effect on the pressure distribution inside the duct of variations in propeller loading, tip clearance, free-stream Mach number, tip Mach number, and hub-tip ratio. The effect on the pressure distribution of concentrating the loading at various radial posi- tions on the propeller blade is also investigated.
One of the significant findings of the investigation is that the loading distribution (with the pame total thrust and torque), the blade-tip clearance, and the free-stream Mach number produce considerable variations in the radial sound-pressure distribution in the field near the propeller disk but produce insignificant variations at distances greater than about one duct radius from the propeller disk. Increasing the blade-tip clearance by only a few percent of the propeller diameter decreases the overall sound- pressure level by about 6 dB in the vicinity of the propeller tip. Increasing the free- stream Mach number generally increases the sound-pressure levels inside the duct, with the greatest increases occurring near the propeller disk and along the duct wall. At a Mach number of M = 0.7 the sound-pressure levels along the duct wall are from 3 dB to 6 dB higher than for M = 0.
INTRODUCTION
At present, various types of aircraft being developed utilize ducted fans or pro- pellers. The presence of a duct increases the propulsion performance at low speeds and permits a seduction of propeller diameter. The presence of the duct presents a struc- tural problem not only for fans and propellers but also for compressors, and a knowledge of the sound field inside the duct is required to develop criteria for light-weight struc- tures of sufficient acoustic-fatigue life, particularly in the critical region near the pro- peller disk.
In reference 1 the sound pressures inside the duct of a ducted propeller were calcu- lated. The duct consisted of two infinite concentric circular cylinders, the inner cylinder representing the center body, and the wave equation was solved by the method of separa- tion of variables. The thrust and the drag (torque) forces on the propeller were combined to give a resultant force in the axial direction; no free-stream velocity through the duct was considered. In reference 2 the wave equation was also solved by the same technique. A free-stream velocity was introduced and the loading on the propeller was left arbitrary. In reference 3 Tyler and Sofrin also solved the wave equation by separation of variables and used assumed duct-velocity distributions to calculate the far-field sound pressures. However, the solutions were not combined to represent loadings on the ducted propeller nor was the pressure distribution in the duct derived. Neither reference 2 nor refer- ence 3 presents any numerical results on ducted propellers. The purpose of the present paper is to present a solution of the wave equation based on Fourier transform techniques and to present numerical results for the effects on the pressure distribution in the duct of variations in propeller loading, tip clearance, free-stream Mach number, tip Mach number, and hub-tip ratio. The effect on pressure distribution of concentrating the loading at various radial positions on the propeller blade was also investigated.
" . .
SYMBOLS
a hub radius
A source strength
Anm(p),Bnm(p) undetermined functions needed to satisfy boundary conditions
b outer duct radius
B number of blades
C speed of sound
Hnm (r 1 quantity defined by equation (A23)
Inm quantity defined by equation (A12)
Jn, Yn Bessel functions of first kind and second kind, respectively
k nondimensional frequency parameter, - = - nS2b wb C C
2
M
Me
Mt
n = n'B
n'
Q
Q GO)/P
Qnm
r CP
Re
SPL
SPLOV
t
T
V
%
free-stream Mach number, V/c
effective tip Mach number
rotational tip Mach number
harmonic number
summation indices
pressure in n'th harmonic due to thrust and to torque, respectively
total torque
torque per unit nondimensional length
quantity defined by equation (A9)
cylindrical coordinates
cylindrical coordinates normalized to outer duct radius b
nondimensional center of pressure
effective distance on span of propeller blade
sound-pressure level, decibels
overall sound-pressure level, decibels
time
total thrust
free-stream velocity
quantity defined by equation (A23)
3
variable of integration
notation defined by equation (A15)
included angle of propeller blade considered in reference 1
nondimensional propeller tip radius
Dirac delta function
imaginary part of k
see equation (A6)
mth root Of Tn' PnmU = 0 0 coordinates of source point
nondimensional coordinates of source point
thrust distribution, per unit nondimensional length
hub-tip ratio, a/b
velocity potential
function in. eguation (1) denoting loading distribution BP T(P)
B QGO) or - PQ
T
frequency of n'th harmonic
propeller angular velocity
ANALYSIS
The sound-pressure field of a rotating ducted propeller is analyzed on the assump- tion that the pressure distribution over the propeller, associated with the thrust and the torque, can be represented by a distribution of rotating acoustic pressure doublets acting
4
IP
at the propeller disk and subject to uniform rectilinear motion. This work is a general- ization of the work done by Garrick and Watkins, for a free propeller reported in refer- ence 4. It is further assumed that the pressure field near the propeller can be adequately predicted by analyzing the field between two infinite coaxial circular cylinders, the inner cylinder representing the center body, usually small in ducted propellers and large in prop-fans or compressors. The analysis does not take into account reflections, such as would occur at inlets; however, these reflections are generally small for ducted fans, except possibly very near the inlet, because of the cutoff phenomena for subsonic spinning modes.
Figure 1 is a schematic of the ducted-propeller disk and the coordinate system associated with the mathematical model used in the present analysis. The entire analysis is presented in the appendix where is derived the velocity potential o r Green's function which satisfies the wave equation for a pulsating source rotating with angular velocity SZ and moving in the negative z-direction with velocity V. By properly representing the forces due to thrust and torque (or drag) these sources are superimposed to yield the pressure distribution inside the duct due to B blades rotating with angular velocity SZ.
RESULTS AND DISCUSSION
Four distributions of thrust and torque are utilized to determine their effect on the pressure distribution inside the duct. The distributions are chosen so as to have the center of pressure between the 0.6- and 0.8-spanwise stations and to be representative of
. the loadings of most ducted propellers. All distributions are normalized so as to yield the same total thrust T and total torque Q; that is,
r 6
and
where 6 and a are the nondimensional tip and hub radius, respectively.
By letting x ( p ) denote either o r the four cases considered a re T PQ
5
. .
Case I
Case I1
Case 111
Case IV
xco) = 3P2
,63 - 03
x@) = J8
J8 (’lp) dp 1
and
0 6
(J8 (‘1) = O)
In all cases 6 is chosen to equal 1.0 except for s0m.e studies of tip clearance in Case Tv which are discussed subsequently. Case I assumes that all the thrust and all the torque a r e concentrated at an effective radius equal to 0.8 of the duct radius. This same assumption is discussed in reference 4 for a free propeller. Case 11 represents a para- bolic loading distribution and Case 111 is loaded according to J8(hlp> which has its center of pressure at approximately 0.75 the blade radius with J8(’1) = 0 where X1 is the first root of Jg(x) = 0. Case IV represents a linear loading distribution. For comparison, the four basic types of propeller loading are presented in figure 2 for a hub- tip ratio of 0.2. The values for the centers of pressure are also given.
Values of thrust, torque, blade radius and number, rotational speed, and blade angle for a particular ducted propeller were obtained from reference 1 and a r e given with other pertinent data in table I. These data are used throughout the present report for all numerical studies unless otherwise stated. Measurements and calculations were made in the U.S. Customary units. The values a r e presented herein in the International System of Units (SI) with the equivalent values given parenthetically in the U.S. Customary Units.
Radial Pressure Distribution
In figures 3 to 6 the overall root-mean-square (rms) radial pressure distribution is presented for M = 0 at various values of z, the distance from the propeller disk. The nondimensional radial coordinate varies from r = 0.2 at the hub to r = 1.0 at the
6
duct wall. It can be seen in figure 3 that large differences occur in overall sound- pressure level SPL, among all four cases, the greatest difference being in Case I at r = 0.8 where the loading is concentrated. Farther downstream (figs. 4 to 6) the effect of the loading distribution becomes less apparent and, although not presented, at a station approximately one duct radius from the propeller disk, differences in the SPLov among the four cases become indistinguishable. This is as expected since examination of equations (A24) and (A25) indicates that the pressure drops off exponentially as the dis- tance from the propeller disk increases. At z = 0 the exponent of the exponential vanishes and more terms are needed to define the SPL,. A further indication of this trend may be noted in figure 7 where the SPLov along the duct wall (r = 1.0) is plotted against z. At z = 1.0, although not shown, further calculations indicate that the first term dominates and the values of SPLov in all four cases converge to within 1 dB.
Whereas figures 3 to 7 show the SPLov, figures 8 to 10, in which sound-pressure level SPL is plotted against harmonic number n' , show the contribution of each harmonic to the values presented in figure 7 for SPLov along the duct wall at r = 1.0.
In figure 8, which represents the SPL in the propeller disk, it appears that all harmonics shown contribute significantly to the SPLov, an indication that the 20 terms used in the series and as mentioned in the appendix were insufficient to determine the pressure in the plane at z = 0. This is due to the fact the exponent of the exponential is zero in the propeller disk whereas, downstream of the disk (at z = 0.06 and at z = 0.1 in figs. 9 and 10, respectively), since the series converges rapidly, the contribution from the higher harmonics falls off with increasing harmonic number. It may also be noted in figures 9 and 10 that downstream of the propeller disk, in the first two harmonics, values of SPL agree to within 3 dB for all four cases; however, in the higher harmonics there are large differences which a r e believed to be due to the details of the different loading distributions.
Effect of Tip Clearance
In reference 1 a r e presented the results of some experimental measurements of the effect of tip clearance on the overall sound-pressure level in the duct. These measure- ments a r e taken on the propeller for which the parameters are given in table I except that values of thrust and torque are replaced by T = 5224.6 N (1174.6 lbf) and Q = 1783 J (1315 ft-lbf) to correspond with the experimental results presented in figure 17 of reference 1.
In the present paper only Case IV (linear loading) is considered to illustrate the effect of tip clearance. The clearances used herein are the same as those of reference 1, namely, 0.95 cm (3/8 in.) and 3.81 cm (1.5 in.), which correspond to values of nondimen- sional blade tip radius equal to 0.991 and 0.964, respectively. The effect on the SPLov
7
across the propeller disk is shown in figure 11 and along the duct wall (r = l.O), in fig- ure 12. Here it can be seen (fig. 11) that the tip clearance is effective in reducing the SPLov over only the outer 5 percent of the disk and has a negligible effect on the remaining portion of the disk. However, as mentioned previously, and in the appendix, the results for z = 0 (at the propeller disk) are questionable. Along the duct wall (fig. 12) the effect seems to extend from z = 0 to approximately z = 0.2. This reduction in pressure could be significant in the structural design of ducted propellers; however, the loss of performance may be more important in determining the design criteria.
Also plotted in figure 12 are the experimental data obtained from figure 17 of refer- ence 1. The symbols with ticks represent data points taken upstream of the propeller disk and a r e included in figure 12 since the present analysis indicates equal attenuation in both directions. As can be seen in figure 12, the measured pressures upstream of the disk are greater than those downstream and the differences due to tip clearance a r e much greater than those indicated by the theory. The overall agreement between experimental and theoretical results is felt to be poor and no explanation of these differences can be given at the present time.
Effects of Free-Stream Mach Number
Two different free-stream Mach numbers were considered for comparison with the static case M = 0, namely, M = 0.3 and M = 0.7, which yield effective Mach numbers of Me = 0.73 and Me = 0.97, respectively. Only Case II (parabolic loading) was consid- ered and the overall sound-pressure level is presented for M = 0 and M = 0.7 in fig- ures 13 and 14. The results for M = 0.3 a r e not shown since they are essentially the same as those for M = 0. In figure 13, the SPLov at the duct wall shows an increase of between 3 dB and 6 dB due to Mach number effects as the station moves downstream (or upstream) from the propeller disk at z = 0 to z = 0.4. In figure 14 it can be seen that the difference decreases as the station aproaches the hub; for z = 0.1 the effect of Mach number is negligible. It may be noted here, and is discussed more fully in the appendix that, for effective Mach numbers Me = dM2+Mt2 < 1.0, Mt being the rota- tional tip Mach number, the pressure attenuates equally in both upstream and downstream directions.
Effect of Rotational Tip Mach Number
For the case of linear spanwise loading (Case IV), the effect of rotational tip Mach number is investigated for two free-stream conditions, M = 0 and M = 0.7. These results are presented in figures 15 and 16, which show the overall sound-pressure level along the duct wal l for several rotational tip Mach numbers between 0.6 to 2.0. Here it can be seen that for an effective Mach number Me = /- < 1.0 the pressure
8
decreases exponentially, an indication of attenuation of the pressure waves, whereas for Me > 1.0 the waves propagate in both directions with nearly equal amplitude all along the duct wall. The criterion for propagation, as mentioned previously, is discussed in the appendix; however, it may be illustrated by examining the exponential in equa- tions (A24) and (A25). Mien a n is a real quantity; that is, when
k2 > (1 - M2)pnm2
or
(nMt)2 > (1 - M2)pnm2
the contribution from that term in the series causes propagation; otherwise the wave decays exponentially. For example, for M = 0 and Mt = 1.2, prim must be less than 1.2n, where n = n' B, in order .for a wave to propagate in the duct. The tables of reference 5 show this inequality to be satisfied when n 2 9 (n' 1 3). This is further illustrated in figure 17 which gives the harmonic content of duct-wall pressure for M = 0 and Mt = 1.2. It may be noted that the pressure harmonics attenuate for n' = 1 and n' = 2 whereas the higher harmonics propagate.
Results are shown in figures 15 to 17 to indicate how various harmonics can decay or propagate depending on the effective Mach number. Although effective Mach numbers greater than one are physically possible fo r configurations such as prop-fans, the Mach numbers presented herein are higher than the operating range of the particular configura- tion considered in reference 1. Also, since figure 17 indicates that the propagating waves produce sound-pressure levels of nearly the same magnitude (at least to the tenth harmonic), it would appear inappropriate to sum algebraically the squares of the pressures in each mode. A further investigation should be undertaken to determine the manner in which the individual modes should be combined.
Effect of Hub-Tip Ratio
The effect on the overall sound-pressure level of changing the hub-tip ratio from a = 0.2 to a = 0.5 is illustrated in figures 18 to 20 for the linearly loaded blade (Case IV). In figure 18 the radial variation in SPLov is presented for stations z = 0.2 and z = 0.4. Here it can be seen that concentrating the loading over the outer half of the blade results in an increase in SPLov along the duct wal l of approximately 2 dB to 3 dB over that for the more lightly loaded blade even though the rotation speed, thrust, and torque are the same for both cases. This same trend is also evident in fig- ure 19, where the SPLov is given along the duct wall and the difference in decibels remains essentially constant as the station moves downstream. Also, in figure 20 where
9
the harmonic content of the overall SPL at z = 0.1 and r = 1.0 is shown, a differ- ence of approximately 2 dB exists for all 10 harmonics.
Effect of Varying Effective Radius of Concentrated Load
The concept of concentrating the thrust and the torque at some effective distance Re on the span of the blade was used by Garrick and Watkins in reference 4. The suggested value of Re = 0.8 (ref. 4) is used herein, together with values of Re = 0.6 and Re = 0.7. The results of these calculations are presented in figures 21 to 23; figure 21 shows the variation in overall sound-pressure level in the radial direction and figure 22, the variation along the duct wall. Figure 23 shows the harmonic content of the overall sound pressure along the duct wall at z = 0.1 and r = 1.0. It can be seen from figures 21 to 23 that the effective-radius concept leads to large differences in sound- pressure level near the propeller disk. By comparing figures 7 and 21 it can be seen that, even though the concentrated-loading theory yields pressure distributions which a r e essentially independent of the loading as the station moves downstream in the duct, i t should be used with caution near the propeller disk.
Comparison of Present Results With Reference 1
In reference 1, the wave equation for a propeller in an infinite coaxial circular cylinder is solved by separation of variables. The pressure on the propeller blade is assumed to be the resultant of two forces, the thrust acting in the axial direction and the drag acting in the circumferential direction at the center of pressure rcp. The resultant of these two vectors, that is,
Po =
was assumed to be distributed uniformly over the blade (a sector of angle y ) and to act in the axial direction. The absolute value of the Fourier coefficient of the n'th harmonic for the loading can be represented by
This loading differs from the loading considered in the present paper where the thrust and the torque a r e considered concentrated along radial lines and thus yielding a comparable equation
10
where Po' is representative of either the thrust force T or the drag force Q/rcp. Equations (2) and (3) have the same form as y -L 0.
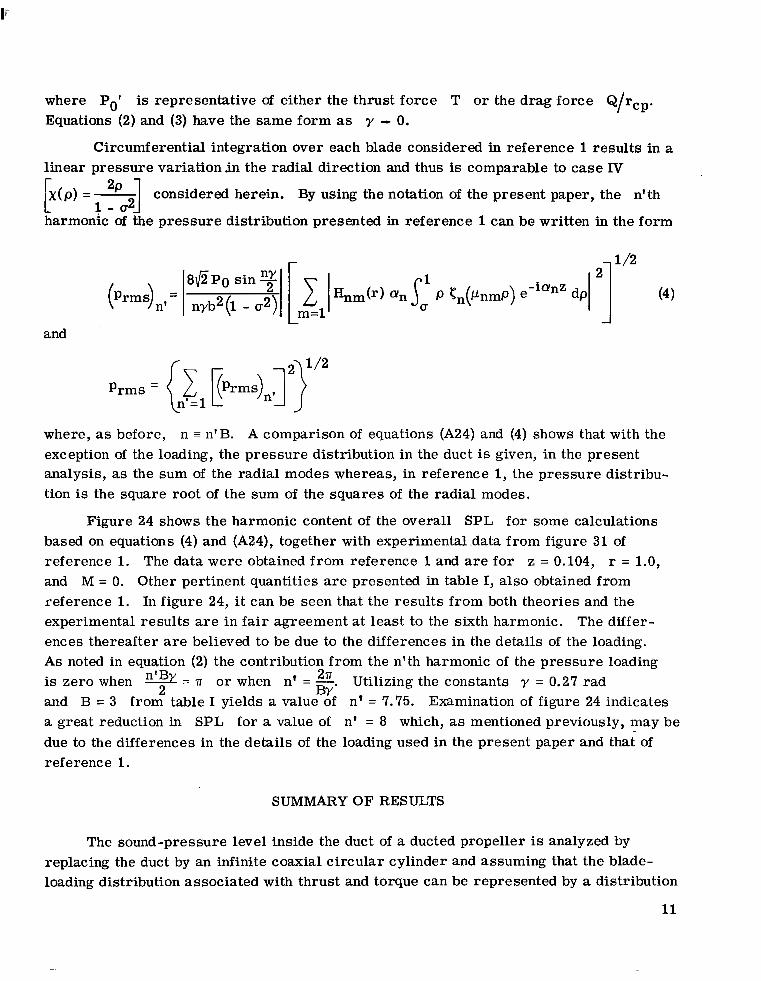
Circumferential integration over each blade considered in reference 1 results in a linear pressure variation .in the radial direction and thus is comparable to case IV
k ( p ) =A- considered herein. By using the notation of the present paper, the n'th 1 - a2
harmonic of the pressure distribution presented in reference 1 can be written in the form
where, as before, n = n'B. A comparison of equations (A24) and (4) shows that with the exception of the loading, the pressure distribution in the duct is given, in the present analysis, as the sum of the radial modes whereas, in reference 1, the pressure distribu- tion is the square root of the sum of the squares of the radial modes.
Figure 24 shows the harmonic content of the overall SPL for some calculations based on equations (4) and (A24), together with experimental .data from figure 31 of reference 1. The data were obtained from reference 1 and are for z = 0.104, r = 1.0, and M = 0. Other pertinent quantities a re presented in table I, also obtained from reference 1. In figure 24, it can be seen that the results from both theories and the experimental results are in fair agreement at least to the sixth harmonic. The differ- ences thereafter are believed to be due to the differences in the details of the loading. As noted in equation (2) the contribution from the n'th harmonic of the pressure loading is zero when 2 = T o r when n' = -. Utilizing the constants y = 0.27 rad and B = 3 from table I yields a value of n' = 7.75. Examination of figure 24 indicates a great reduction in SPL for a value of n' = 8 which, as mentioned previously, may be due to the differences in the details of the loading used in the present paper and that of reference 1.
n'B 2?T 2 BY
SUMMARY OF RESULTS
The sound-pressure level inside the duct of a ducted propeller is analyzed by replacing the duct by an infinite coaxial circular cylinder and assuming that the blade- loading distribution associated with thrust and torque can be represented by a distribution
11
of acoustic pressure doublets acting at the propeller disk. Trend studies a r e made to determine the effect on the pressure distribution inside the duct of variations in propeller loading, tip clearance, free-stream Mach number, tip Mach number, and hub-tip ratio. The effect on pressure distribution of concentrating the loading at various radial positions on the propeller blade is also investigated.
The following resul ts are observed:
1. The radial pressure distribution at least one radius downstream of the propeller disk is essentially independent of the blade loading; however, there is a significant varia- tion in the field near the propeller disk.
2. Increasing the blade-tip clearance by only a few percent of the propeller diameter has a significant effect in reducing the overall sound-pressure level along the duct wall by about 6 dB in the field near the propeller disk; however, at approximately one radius from the disk, the effect of tip clearance is negligible.
3. For the angular velocity considered, free-stream Mach numbers equal to or less than 0.3 have very little effect on the pressure distribution whereas, for M = 0.7, the sound-pressure levels along the duct wall a re f rom 3 dB to 6 dB higher than for M = 0.
4. For effective tip Mach numbers Me < 1 the sound waves attenuate in the duct whereas for Me > 1 the waves propagate, the sound-pressure level along the duct wall remaining essentially constant and changing only near the propeller disk.
5. For the case with linear distribution and the same total load, increasing the hub- tip ratio from (T = 0.2 to o = 0.5 results in an increase in sound-pressure level of approximately 2 dB to 3 dB throughout the duct.
6. Changing the location of the effective radius of the concentrated load results in significantly different sound-pressure levels near the propeller disk. As Re is increased the pressures on the outer wall increase and those on the inner wall decrease; however, as pointed out previously in item (l), as the distance downstream increases, the pressure distribution across the duct becomes independent of the load distribution.
7. As the effective radius is decreased, the sound-pressure levels in the higher harmonics rapidly decrease, so that it is necessary to calculate only a few harmonics to determine the overall sound-pressure level.
Langley Research Center, National Aeronautics and Space Administration,
Hampton, Virginia, June 23, 1971.
12
APPENDIX
SOUND-PRESSURE LEVEL INSIDE AN INFINITE ANNULAR DUCT
The purpose of the appendix is to derive the pressures due to thrust and torque in an annular duct containing uniform subsonic or supersonic f low. First, expressions are derived to give the pressures due to unit pulsating forces acting in the axial direction to simulate the thrust and in the tangential direction to simulate the torque, o r drag. By superposition, the forces a r e combined in such a way as to represent the thrust and the torque distribution on a propeller in the duct. A Fourier time expansion of the thrust and the torque is made to account for the rotating blades. This procedure allows each blade harmonic to be treated as a distribution of pulsating forces.
Derivation of Pressure Due to Concentrated Pulsating Force
in Duct of Infinite Length
The velocity potential due to a pulsating source of strength A in an annular duct with free-stream velocity V directed along the positive Zo-axis is governed by the wave equation
2 @ 0 = & & + $ ) 1 @ o + p g 6 to - Po) 6 (zo - Co) - 0') 2 Ae-iwt
with boundary conditions such that the velocity normal to the, duct walls be zero; that is,
ro=a where ro = a, the inner or hub radius, and ro = b, the outer o r wall radius. In equa- tion (Al), ro, 8, and zo are the coordinates of the field point and po, e' , and 5 , those of the source point. Figure l(a) is a schematic of the propeller disk and the coor- dinate system associated with equation (Al). Figure l(b) is the mathematical model used in the present analysis. The coordinates are normalized with respect to the outer-duct radius where r = u (cr = 2) and r = 1.0 correspond to the hub and the outer wall, respectively, and the duct is of infinite length (-rn < z < w).
By letting $o = $eeiwt and normalizing all coordinates with respect to b, equa- tion (Al) becomes
13
APPENDIX - Continued
and
r=u r=l
where M = - and k = -. In the following analysis it is assumed that k is a complex quantity with a positive imaginary part. This assumption is equivalent to introducing a
damping term - a'o into the wave equation (Al). As is seen later, in connection with equation (A12), this device moves the singularities off the path of integration and simpli- fies the evaluation of certain integrals. The final solution is obtained by letting the imaginary part of k approach zero. A further discussion of this can be found, for example, in reference 6.
V wb C C
at
The solution of equation (A2) is assumed to have the form
where Jn(pr) and Yn(yr) are Bessel functions of the first and second kind, respec- tively, and An@) and B,(P) are arbi t rary functions of /3 which must be chosen so as to satisfy the boundary conditions of equation (A3). The functions An@) and Bn(P) a r e determined by substituting the expression in the square bracket in equation (A4) into equation (A3). Thus, equation (A4) becomes
in which the eigenfunctions Pn(Pnmr) a r e given by
and prim is the mth eigenvalue of the characteristic equation
where the primes are used in equations (A5), (A6), and (A7) to indicate differentiation of the function with respect to its argument. Reference 5 contains tables listing values of
Pnm for n = 0 to n = 25 and m = 1 to m = 10 with values of 0 ranging from 0 to 0.9 in steps of 0.1. It may also be noted that
14
APPENDIX - Continued
where E is the notation used by Tyler and Sbfrin in reference 3.
Substitution of equation (A5) into equation (A2) yields
- "- Pb A 6(r - p ) 6(z - e ) 6(0 - el) (A8)
Using the orthogonal relations
and
(n + n')
(n = n') 1
ogether with the inverse Fourier transform with respect to P yields the expression
f€ equation (A10) is substituted into equation (A5), the result can be written in the form
15
APPENDIX - Continued
where
and
Here @(r,p,g,ii) is the Green's function which represents the velocity potential at r,O,z due to a concentrated source of strength Ae -iwt located at p,O',< in a fluid with free- stream velocity V.
Evaluation of Inm, Equation (A12)
The integral Inm can be evaluated by the theory Of residues. To accomplish this i t is necessary to investigate the zeros of the denominator of the integrand, namely
M(k + i e ) f Jk2 - (1 - M2)/Jnm2 + 2ike
1 - M2 P=-- ~ ~
where E is the positive imaginary part of k and, as mentioned previously, has the effect of moving the poles off the path of integration. For M > 1.0 it can be shown that both poles lie in the lower half of the @plane. In the limit as E - 0 the path of inte- gration passes above both poles which a r e located at
p = - f Jk2 + (M2 - 1)pnm2] M2 - 1
and the value of the integral is, for M > 1.0,
= o
16
APPENDIX - Continued
For M < 1.0 one pole lies in the upper half of the @-plane and the other in the lower half of the @-plane. In the limit as E - 0 the path of integration passes between the poles which are located at
@*=l(Mk* 1 - M2 ga"Mlr,zi where the upper sign applies when the pole is in the upper half of the plane and the lower sign when the pole is in the lower half of the plane. By adopting the notation
+ /- = +i / (1 - M2)pnm2 - k2 equation (A15) can be rewritten
where the sign convention defined in equation (A15) applies. With use of this definition there can easily be obtained, for M < 1.0
7
{k2 - (1 - M2)pnm 2
17
Substituting either equation (A14) for M > 1.0 or equation (A17) for M < 1.0 into equation (All) yields the velocity potential for a concentrated source of strength Ae By the proper choice of A i t is shown in reference 4 that, for a force
-iwt
acting in the z-direction, the pressure at any field point rO,B,zO can be obtained by differentiating the velocity potential with respect to zo and replacing A by T (Po,d' ,so) Po dP0 de' so that
or in nondimensional quantities
I
APPENDIX - Continued
where T(p,O',<) is the thrust per unit area. Similariy, if A is related to
a force in the tangential direction, the pressure can be expressed as
and Q(p,O',<) is the torque per unit area. The problem now remains to express (in a Fourier series) the thrust and the torque as a distribution of concentrated forces of the form Ae -iwt so that each term of the expansion is of the form for which equation (All) was developed.
Fourier Expansion of Thrust and Torque Distribution on Rotating Blades
Each element of the propeller blade is acted on by the surface-pressure distribution which may be resolved into a thrust force in the direction of the Z-axis and a force asso- ciated with the torque acting in the circumferential direction. A description of these forces, including a discussion of the effect of blade thickness on the sound pressure, and their Fourier expansions are given in reference 4. The present analysis to this point has been general in regard to the distribution of thrust ana torque; now the analysis is specialized t o the case of forces on a propeller which lies in the plane where z = 0 and rotates with angular 51. Further, the forces are assumed to be distributed radially along B angle between the blades being and to be concentrated circumferentially at
This can be represented by
(p = 0,1,2, . . . (B-1))
where Q is representative of either the thrust T(p0,B') O r the drag force Q per unit area and Jlo(po) represents the thrust or the drag force per unit length. This series when expanded in its Fourier form becomes
18
a APPENDIX - Continued
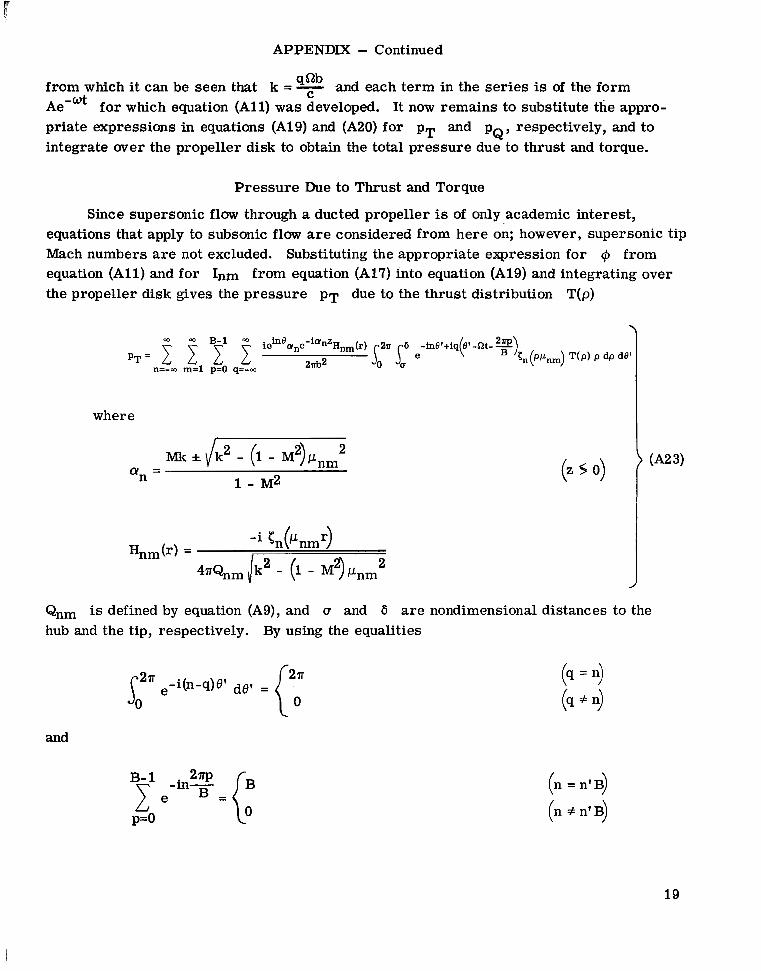
from which it can be seen that k = c and each term in the series is of the form Ae-ot for which equation (All) was developed. It now remains to substitute the appro- priate expressions in equations (Al9) and (A20) for pT and pQ, respectively, and to integrate Over the propeller disk to obtain the total pressure due to thrust and torque.
Pressure Due to Thrust and Torque
Since supersonic flow through a ducted propeller is of only academic interest, equations that apply to subsonic flow are considered from here on; however, supersonic tip Mach numbers are not excluded. Substituting the appropriate expression for Cp from equation (Al l ) and for Inm from equation (A17) into equation (A19) and integrating over the propeller disk gives the pressure p~ due to the thrust distribution T(p)
where
Mk f /k2 - (1 - M2)pnm 2
1 - M2 On - -
Qnm is defined by equation (A9), and o and 6 a re nondimensional distances to the hub and the tip, respectively. By using the equalities
and
p=o
(n = nl3)
(n + n' B)
19
APPENDIX - Continued
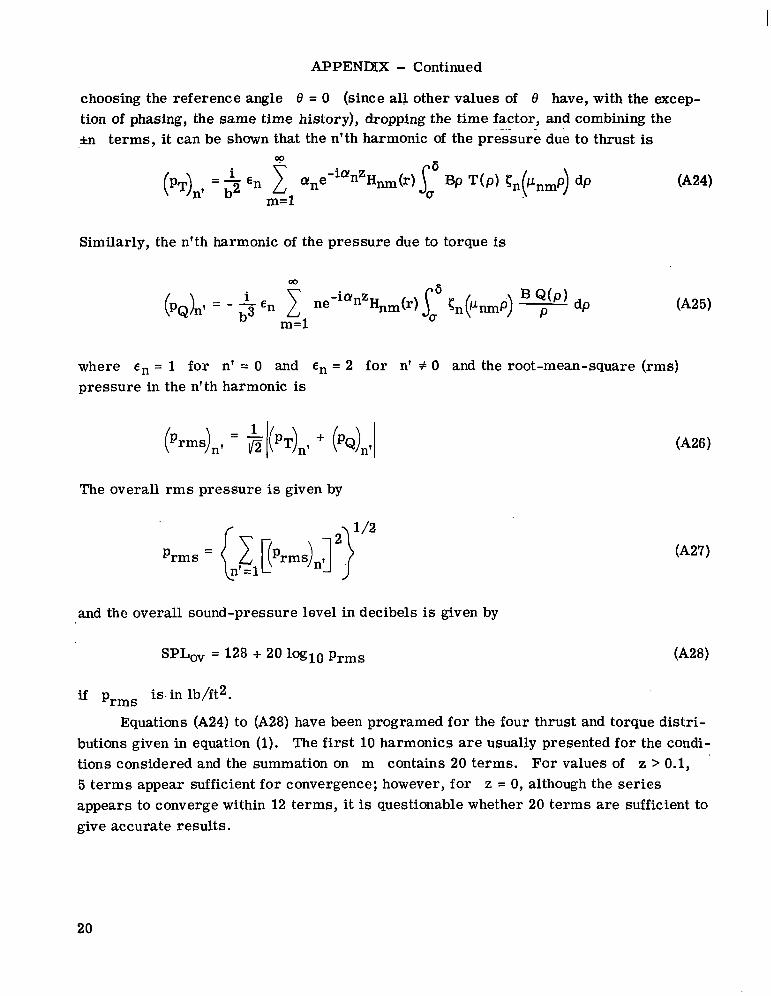
choosing the reference angle 8 = 0 (since all other values of 8 have, with the excep- tion of phasing, the same time history), dropping the time factor, and combining the fn terms, it can be shown that the n'th harmonic of the pressure due to thrust is
. ~ " . .
Similarly, the n'th harmonic of the pressure due to torque is
where En = 1 for n' = 0 and En = 2 for n' f 0 and the root-mean-square (rms) pressure in the n'th harmonic is
The overall rms pressure is given by
and the overall sound-pressure level in decibels is given by
if Prms is. in lb/ft2.
Equations (A24) to (A28) have been programed for the four thrust and torque distri- butions given in equation (1). The first 10 harmonics are usually presented for the condi- tions considered and the summation on m contains 20 terms. For values of z > 0.1, 5 terms appear sufficient for convergence; however, for z = 0, although the series appears to converge'within 12 terms, it is questionable whether 20 te rms a re sufficient to give accurate results.
20
APPENDIX - Concluded
Criteria for Attenuation o r Propagation of Wave in Duct
Examination of equations (A24) and (A25) shows that, when Cyn is complex, certain terms in the series indicate oscillations or propagation downstream whereas when an is imaginary, they indicate exponential decay as z increases. This leads to an investi- gation of whether k2 - (1 - M2)pm2 is greater than or l ess than zero. By substituting n q for k and since Me2 = M2 + Mt2 the expression can be rewritten as
Me2 - 1 Z ( l - M 2 ) ( y I-Lnm - l)(*+ 1)
where, when the upper inequality in equation (A29) is satisfied, propagation is indicated and, when the lower inequality is satisfied, decay o r attenuation occurs. The quantities to be examined are Me 2 1.0 and M p 1.0 For Me < 1.0, which implies that M < 1.0, the left-hand side of equation (A29) becomes negative and the lower inequality is satisfied since, as indicated in reference 7, prim > n and all waves attenuate. For Me > 1.0, two alternatives exist, that is, M > 1.0 o r M < 1.0. For M > 1.0, the right-hand side of equation (A29) becomes negative, the upper inequality'is satisfied, and all waves propagate. For M <-1 .O, when the approximate asymptotic expansion of the mth zero
pnrn '"rD - mB (see ref. 7) is considered it can be seen that, for a fixed m, a value can .,&vays be assigned to n for which the upper inequality is satisfied and that all circum- ferential modes for which the mode number is equal to or greater than this value of n propagate in the duct. It may also be noted (ref. 7) that, for large values of n, the eigenvalues are approximately the zeros of Yn'(pnm) = 0, the f i rs t eigenvalue being
pn,l n + 1.82n 1/3
When this expression is substituted into equation (A29) i t can be seen that Me2 - 1 is of the order of lh2I3, again an indication that for a large enough value of n the upper inequality is satisfied and all modes with mode numbers greater than or equal to this value of n also propagate. This is also illustrated in figure 17 and mentioned in the text, that for Mt = Me = 1.2 and M = 0, the first two modes attenuate whereas the remaining modes propagate. It therefore can be concluded that for Me > 1.0 an infinite number of modes, but not all, propagate and for Me < 1.0 all modes attenuate.
21
REFERENCES
1. Fricke, W.; Bissell, J. R.; Bamberg, W. T.; and Martina, C. K.: Analytical and Experimental Studies of Sound Pressures on Ducted Propellers. NASA CR-66270, 1966.
2. Slutsky, Simon: Discrete Noise Generation and Propagation by a Fan Engine. Paper presented at AFOSR-UTIAS Symp. on Aerodyn. Noise (Toronto), May 20-21, 1968.
3. Tyler, J. M.; and Sofrin, T. G.: Axial Flow Compressor Noise Studies. SAE Trans., V O ~ . 70, 1962, pp. 309-332.
4. Garrick, I. E.; and Watkins, Charles E.: A Theoretical Study of the Effect of Forward Speed on the Free-Space Sound-Pressure Field Around Propellers. NACA Rep. 1198, 1954. (Supersedes NACA TN 3018.)
5. Bauer, Helmut F.: Tables of Zeros of Cross Product Bessel Functions J ' (OY ' (kt) - Jp'(kt)Yp'(() = 0. Math. Comput., vol. 18, no. 85, Jan. 1964, pp. 128-135. MTP-AERO-63-50, NASA George C. Marshall Space Flight Center, 1963.
P P
6. Morse, Philip M.; and Feshbach Herman: Methods of Theoretical Physics. Pt. II, McGraw-Hill Book Co., Inc., 1953, pp. 1334, 1335.
7. Abramowitz, Milton; and S t e p , Irene A., eds.: Handbook of Mathematical Functions With Formulas, Graphs, and Mathematical Tables. Nat. Bur. Stand., Appl. Math. Ser. 55, U.S. Dep. Com., June 1964.
22
TABLE 1.- DATA FOR DUCTED PROPELLER
TESTED IN REFERENCE 1
T . . . . . . . . . . . 6921 N (1556 lbf)
Q . . . . . . . . . . 2766 J (2040 ft-lbf)
C2 . . . . . . . . 2000 rpm = 209 rad/sec
b . . . . . . . . . . . . 1.067 m (3.5 ft)
. . . . . . . . . . . . . . . . . . . . . .
y . . . . . . . . . . . . . . . . 0.27 rad
0 . . . . . . . . . . . . . . . . . . . 0 . 2
c . . . . . . . 335 m/sec (1100 ft/sec)
23
I
~.
(a) Cross section of disk and duct.
(b) Coordinate system associated with its mathematical model.
Figure 1.- Schematic of ducted-propeller disk.
24
3 . 0
2.5
2 . 0
X(P) 1. 5
1. 0
.5
(
Case
0 I
II
111
IV
"""
- "
P 1. 0
Figure 2.- Four basic propeller loadings ~ ( p ) , where x(p) is representative of either BP Tb) B Q(P) or -. U = 0.2.
T PQ
25
/ /
I /
/ I
I I
I
1300 I I I 1 I . 2 . 4 . 6 .8 1.0
r
Figure 3.- Radial variation of sound-pressure level at propeller disk at z = 0. M = 0.
Case
IT III JY
0 I ”””
”
140 - / /
/ ’ 0 /
130 -
0 120. I I 1 . I
0 . 2 . 4 . 6 . a 1.0 r
Figure 4.- Radial variation of sound-pressure level at station z = 0.1. M = 0.
26
I
160-
150 -
SPLov, dl3 140 -
130 -
0
/ /
Case
II 111 Iv
0 I """
"
I 0
. 2 . 4 . 6 .8 1. 0 1200 I 1 1 I I -
r
Figure 5 . - Radial variation of sound-pressure level at station z = 0.2. M = 0.
130 :_I 1200 I I I I I
.2 . 4 . 6 .8 1. 0
r
Case I 11 'E1 Iv
Figure 6.- Radial variation of sound-pressure level at station z = 0.4. M = 0.
27
170 I-
140 0 A L A
. 1 .2 . 3 .4 Z
Figure 7.- Variation of sound-pressure level along duct wall at r = 1.0. M = 0.
Case
Figure 8.- Variation of sound-pressure level with harmonic number at station z = 0. r = 1.0; M = 0.
28
Case
II rn Iv
160 - 0 I " - -"
150 - .. -. 0 .. \
\ \
SPL,dB 140- 0 -\ \ -"
0
0 130 -
0
0
120- I I I I 6 0 2 4 6 8 10
n'
Figure 9.- Variation of sound-pressure level with harmonic number at station z = 0.06. r = 1.0; M = 0 .
SPL, dB
160 -
150 -
140 -
130 -.
120 -
110 I - I I I 0
1 -~ I 2 4 6 a 10
n'
Case I II In Iv
Figure 10.- Variation of sound-pressure level with harmonic number at station z = 0.1. r = 1.0; M = 0.
29
111. I. . . "..
170 - 6
1 1.0 4 I .991 SPLov, dB 160 - I
I I I L .964
150 I I 1 I I .' 2 .. 4 .6 . 8 1.0 r
Figure 11.- Effect of tip clearance on sound-pressure level in radial direction at z = 0. M = 0; T = 5224.6 N (1174.6 lbf); Q = 1783 J (1315 ft-lbf); Case IV.
fY z < o
d z < o ' "O .964
Exp. (Fig. 17, ref. 1)
1.0 Present *991 I theory .964
" ""_
Figure 12.- Effect of tip clearance on sound-pressure level along duct wall at r = 1.0. M = 0; T = 5224.6 N (1174.6 lbf); Q = 1783 J (1315 ft-lbf); Case IV.
30
M - 0 "- .7
l40L .1 I .2 I . 3 I .4 I Z
180 -
170 - '
150 -
140 I I I I .1 .2 . 3 .4
Z
Figure 13.- Effect of free-stream Mach number (M = 0 and M = 0.7) on sound-pressure level in downstream direction for r = 1. Case 11.
18(
17r
SPL,,, dB 161
158
14
M
I I I I I . 2 .4 .6 .8 1.0
r
2
0
.1
Figure 14.- Effect of free-stream Mach number (M = 0 and M = 0.7) on radial pressure distribution at two downstream locations, z = 0 and z = 0.1. Case 11.
31
w N
""""_ 0.8 1.0 1.2 1.5 2.0
""- - .- -" - - - - " - "- """
180 r
dB
I / 0' I 0 0 '\ \ \ '. '
0 - 0
130 I I I I I I I I I '\
-1.0 -. 8 -. 6 -. 4 -. 2 0 .2 . 4 .6 .8 1.0 2
Figure 15.- Effect of rotational tip Mach number on sound-pressure level for M = 0. r = 1.0; Case IV.
Mt Me 0. 6 0.92
. 8 1.06 1.0 1.22 1.2 1.39 1.5 1.65 2.0 2.22
"-"""" """ """"_ "" - -" """
1 9 0 1 ~ - - - - - - - - - - 1.0 "_""""-I-"I"-"
.8 "" " - "- - --- - "_."~""".-"""
170-
160-
150-
z
Figure 16.- Effect of rotational tip Mach number on sound-pressure level for M = 0.7. r = 1.0; Case IV.
SPL, dB
n’
3 170 -
t
-1.0 -. 8 -. 6 -. 4 -. 2 0 . 2 . 4 .6 . 8 1.0 Z
Figure 17.- Harmonic content of duct-wall pressure for M = 0 and $ = 1.2. r = 1; Case IV.
U
7" 0.5
.2
I
Figure 18.- Radial variation of sound-pressure level for values of hub-tip ratio of 0 = 0.2 and a = 0.5 at z = 0.2 and z = 0.4. M = 0; Case IV.
" O L 170
U
" 0.5 .2
150 -
140 I I I I I (I .1 . 2 . 3 . 4
Z
Figure 19.- Variation of sound-pressure level at duct wall for values of hub-tip ratio of a = 0.2 and a = 0.5. M = 0 ; r = 1.0; Case IV.
35
”- 0.5 .2
SPL, dl3
160-
150 -
140 -
130 0
160-
150 -
140 -
130 I - I I L I 0 2 4 6 8 10
n’
I - I I L I 2 4 6 8 10
n’
- .. i I : - J ~ P 20.- Variation of sound-pressure level with harmonic number for values
oi hb-tip ratio of u = 0.2 and u = 0.5. z = 0.1; M = 0; r = 1.0; Case IV.
0
/ /
I . 2
Re .8
.7
,6
.. I .4
r
L A . 6 .8 1.0
(a) z = 0.2.
Re 150 -
I /-- .8
0," .7 .6
140 -
SPLOV' dB
130 -
/ I I - I I I 120 0 . 2 .4 .6 .8 1.0
r
(b) z = 0.4.
Figure 21.- Radial variation of sound-pressure level for values of effective radius Re = 0.8, Re = 0.7, and Re = 0.6 at z = 0.2 and z = 0.4. M = 0; Case I.
37
,,I Re .8 .7 .6
140-A .1 . 2 . 3 J .4
Figure 22.- Variation of sound-pressure level along duct wall for values of effective radius Re = 0.8, Re = 0.7, and Re = 0.6. M = 0; r = 1.0; Case I.
SPL, dB
160-
150 -
140 -
130 -
120 -
110 -
100 I I I 0 2 4 6
n'
Figure 23.- Variation of sound-pressure level with harmonic number for values of effective radius Re = 0.8, Re = 0.7, and Re = 0.6. z = 0.1; M = 0; r = 1.0; Case I.
38
SPL, dl3
0 Exp. (Ref. 1) ""- Theory (Ref. 1)
Present theory (Case IV)
170-
160 - % \ \
150 -
140 -
\ 130 - \
\ /
c /
\ /
' / / 120 - \ I
' I L
110- - 0 2 4 6 8 10
n'
Figure 24.- Comparison of experimental and theoretical results shown in figure 31 of reference 1 with results of present analysis. z = 0.104; M = 0; r = 1.0; Case IV.
NASA-Langley, 1971 - 1 L-7378
I -
39
NATIONAL AERONAUTICS AND SPACE ADMISTRATION WASHINGTON, D.C. 20546
POSTAGE AND FEES PAID
NATIONAL AERONAUTICS AND SPACE ADMINISTRATION
~
OFFICIAL BUSINESS FIRST CLASS MAIL PENALTY FOR PRIVATE USE $300 USMAIL
.- U
018 001 Cl U 0 1 710910 S00903DS DEPT OF THE AIR FORCE AF SYSTEHS CONUAND AF WEAPONS LBB (RLDL) ATTN: E LOU BOWNAW, CHIEF TECH LIBRARY K I R T L R N D AFB NH 87117
POSTMASTER: If Undeliverable (Section 158 Postal Manual) Do Not Return
“The aeronautical and space activities of the United States shall be conducted so as to colttribute . , . t o the expansion of human knowl- edge of phenomena in the atv~osphere and space. The Administration shall provide for the widest practicable and appropriate dissemination of information concerning its activities and the resdts thereof.”
-NATIONAL AERONAUTICS AND SPACE ACT OF 1958
NASA SCIENTIFIC AND TECHNICAL PUBLICATIONS
TECHNICAL REPORTS: Scientific and TECHNICAL TRANSLATIONS: Information technical information considered important, published in a foreign language considered complete, and a lasting contribution to existing to merit NASA distribution in English. knowledge.
TECHNICAL NOTES: Information less broad derived from or of value to NASA activides. in scope but nevertheless of importance as a Publications include conference prpceedings, contribution to existing knowledge. monographs, data compilations, handbooks,
TECHNICAL MEMORANDUMS: Information receiving limited distribution TECHNOLOGY UT~LIZATION because of preliminary data, security classifica- PUBLICATIONS: Information on technology tion, or other reasons. used by NASA that may be of particular
CONTRACTOR REPORTS: Scientific and interest in commercial and other non-aerospace applications. Publications include Tech Briefs,
technical information generated under a NASA Technology Utilization Reports and contract or grant and considered an important contribution to existing knowledge.
Technology Surveys.
SPECIAL PUBLICATIONS: Information
sourcebooks, and special bibliographies.
Details on the availability of these publications may be obtained trorn:
SCIENTIFIC AND TECHNICAL INFORMATION OFFICE
NATIONAL AERONAUTICS AND SPACE ADMINISTRATION Washington, D.C. PO546