GPO PRICE CFSTI PRICE(S) s s NASA TN D-3149 / fl Hard copy (HC) Microfiche (M F) ff 653 Juk 65 a 8 z P * - < % ,/.7 (PAQESI 2 (NASA CR OR TMX OR AD NUMBER) (CATEGORY) INFLUENCE OF PROGRAMING TECHNIQUES AND OF VARYING LIMIT LOAD FACTORS ON MANEUVER LOAD FATIGUE TEST RESULTS by Patrick L. Corbin di2d Eugene C. Nuumann Langley Research Center Ldngiey Station, Hampton, Va. W AT ONAL AERONAUTICS AND SPACE ADMlNlSTRATlOW - WASHINGTON, D. C. - JANUARY 1966 https://ntrs.nasa.gov/search.jsp?R=19660005423 2018-05-23T00:11:38+00:00Z
Transcript
GPO PRICE
CFSTI PRICE(S)
s s
N A S A TN D-3149
/ fl
Hard copy (HC)
Microfiche (M F)
ff 653 Juk 65
a 8 z P * - < % ,/.7
(PAQESI 2
(NASA CR OR TMX OR AD NUMBER) (CATEGORY)
INFLUENCE O F PROGRAMING TECHNIQUES A N D OF VARYING LIMIT LOAD FACTORS ON MANEUVER LOAD FATIGUE TEST RESULTS
by Patrick L. Corbin di2d Eugene C. Nuumann
Langley Research Center Ldngiey Station, Hampton, Va.
W AT ONAL AERONAUTICS AND SPACE ADMlNlSTRATlOW - WASHINGTON, D. C. - JANUARY 1966
INFLUENCE OF PROGRAMING TECHNIQUES AND OF VARYING LIMIT
LOAD FACTORS ON MANEUVER LOAD FATIGUE TEST RESULTS
By Patrick L. Corbin and Eugene C. Naumann
Langley Research Center Langley Station, Hampton, Va.
NATIONAL AERONAUT ICs AND SPACE ADMINISTRATION
For sale by the Clearinghouse for Federal Scientific and Technical Information Springfield, Virginia 22151 - Price $1.00
. I
INFLUENCE OF PROGRAMING TECHNIQUES AND OF VARYING LIMIT
LOAD FACTORS ON MANEUVER LOAD FATIGUE TEST RESULTS*
By Patr ick L. Corbin and Eugene C . Naumann Langley Research Center
I i I
Variable-amplitude axial-load fat igue t e s t s were conducted on
s t r e s s concentration fac tor of 4.
Life f o r variable-amplitude tests was found t o increase a s much as 60 percent
7075-T6 aluminum-alloy edge-notched specimens having a theore t ica l e l a s t i c
mate maneuver load spectra. Fatigue l i f e was found t o be shorter fo r random
est change i n l i f e occurred when the t e s t program contained negative loads.
above the or ig ina l test l i f e a f t e r preloading with a program having a higher l i m i t load factor . The summations of cycle r a t io s were approximately 2 f o r tests without negative loads but were approximately 1 f o r t e s t s with negativ
The load programs were designed t o approxi-
form tests than f o r block form tests havingthe same load spectrum. The
loads.
INTRODUCTION
I n recent years, the demand f o r increased performance of a i r c r a f t has accentuated t h e problem of fa t igue f a i l u r e . Fai lures i n both commercial and mil i tary a i r c r a f t have necessitated cos t ly programs of inspection and mainte- nance. dents, a i r c r a f t companies have r e s o r t e d t o programed fat igue t e s t s of s t ruc tu ra l components which a re designed t o simulate service conditions f o r the par t icu lar vehicle and component i n question. Such tes t ing i s required primarily because there i s no adequate theory f o r predict ing fatigue l i f e under variable-amplitude loading conditions.
I n an attempt t o reduce maintenance costs and the probabili ty of acci-
Two frequently used methods of programing a variable-amplitude fat igue test a r e the block form program i n which loads occur i n small groups having iden t i ca l amplitudes within each group and the random form t e s t i n which indi- vidual load cycles occur i n random sequence.
* The information presented herein w a s offered a s a thes i s , e n t i t l e d "The Influence of Testing Techniques and of Varying L i m i t Load Factors on Maneuver Load Fatigue Test Results" by P. L. Corbin, i n p a r t i a l fulf i l lment of the requirements f o r t he degree of Master of Science i n Engineering Mechanics, Virginia Polytechnic I n s t i t u t e , Blacksburg, Virginia, October 1964.
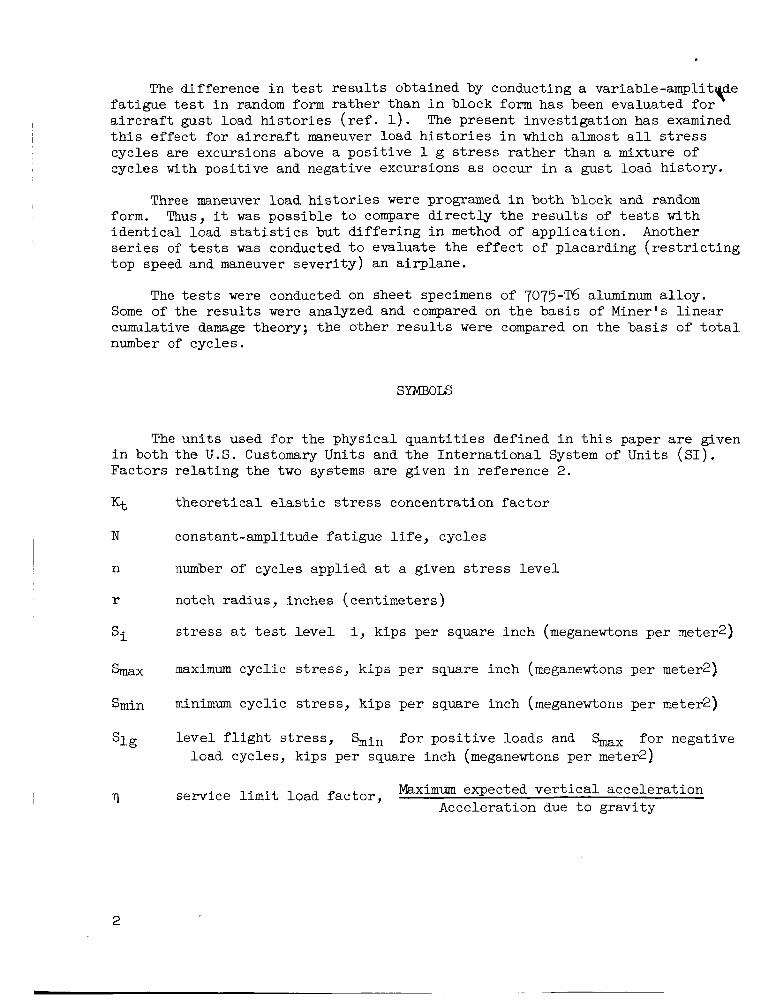
The difference i n t e s t r e su l t s obtained by conducting a variable-amplit de Y fa t igue t e s t i n random form ra ther than i n block form has been evaluated f o r a i r c r a f t gust load h i s to r i e s ( re f . 1). t h i s e f fec t for a i r c r a f t maneuver load h i s t o r i e s i n which almost a l l stress cycles are excursions above a pos i t ive 1 g stress ra ther than a mixture of cycles with posi t ive and negative excursions as occur i n a gust load his tory.
The present invest igat ion has examined
Three maneuver load h i s t o r i e s were programed i n both block and random Thus, it w a s possible t o compare d i r ec t ly the r e s u l t s of t es t s with
Another form. ident ica l load s t a t i s t i c s but d i f fe r ing i n method of application. s e r i e s of tes ts was conducted t o evaluate the e f f ec t of placarding ( r e s t r i c t i n g top speed and maneuver sever i ty) an airplane.
The tests were conducted on sheet specimens of 7075-T6 aluminum a l loy . Some of the r e su l t s w e r e analyzed and compared on t h e bas i s of Miner's l i nea r cumulative damage theory; the other r e s u l t s were compared on the bas i s of t o t a l number of cycles.
SYMBOLS
The uni t s used f o r the physical quant i t ies defined i n t h i s paper are given i n both the U . S . Customary Units and the In te rna t iona l System of Units ( S I ) . Factors r e l a t ing the two systems a r e given i n reference 2.
K t
N
n
r
S i
%ax
Smin
slg
7
2
theore t ica l e l a s t i c stress concentration f ac to r
constant -amplitude fa t igue l i f e , cycles
number of cycles applied a t a given s t r e s s l e v e l
notch radius, inches (centimeters)
s t r e s s a t t e s t l e v e l
maximum cycl ic stress, kips per square inch (meganewtons per meter21
minimum cycl ic stress, kips pe r square inch (meganewtons per meter2)
l eve l f l i g h t stress, k i n for pos i t ive loads and E&x f o r negative
i, kips per square inch (meganewtons per meter2)
load cycles, kips per square inch (meganewtons per meter21
Maximum expected v e r t i c a l accelerat ion Acceleration due t o gravi ty
service l i m i t load f ac to r ,
LOAD DETEfFJIINATIOlV AND APPLICATIOll
Maneuver bad Statistics
' Load factor
The variable-amplitude fatigue tests were designed to approximate a maneuver load his- tory. The frequency distribu- tion of positive maneuver peak loads presented in reference 3 was converted to a spectrum of stress plotted against cumula- tive frequency. (Slg)equal to 7 ksi (48.3 MN/m?) and a design lbit load factor of 7.3 were assumed for this con- version. One set of maneuver peak load statistics from refer- ence 3 is presented in table I. The converted data are presented graphically in figure 1. The lower curve in figure 1 is explained in a later section. This continuous load spectrum was reduced to eight discrete load levels using S-3 data f r o m constant-amplitude fatigue tests. The method used is described in reference 4 and the results obtained are pre- sented in table 11.
A 1 g stress
Rnnber exceeding
Load Programing
1.0
The load statistics were programed in both block and
10 ooo
[kneuver loads, reference 31
7.3 7.0 6.0 5-0 4.0 3-0 2.0
I
._ 40 - L. r
.I
: 30 - L c .. 4 2 0 - E
I
._ I 0
IO -
Figure 1.- Maneuver load cumulat ive frequency statistics.
350 ru E 300 \ z I
2 5 0 . 200 2
* .. D
LI
150 5 100 ;
E .- x
5 0
0
random form with the same cumulative frequency spectrum. described in the following paragraphs.
These two methods are
"he block method of programing resulted in a variable-amplitude test with the loads applied in groups of identical cycles. eight amplitudes was represented one time and all of the cycles at that ampli- tude were applied before proceeding to the next amplitude. the sequence of load levels was varied according to a schedule taken from a table of random numbers. the 20th block after which the schedule forthe first 20 blocks was repeated.
Within each block each of
Within each block
A different sequence was used for each block until
3
TABLE I1
VARIABLE-AMPLITUDE MAD PROGRAMS FOR 7075-T6 ALUMINUM-ALLOY SPECIMENS USING MANEWER MAD HISTORY
The random method involved programing each l&d cycle independently. The sequence of cycles was deter- mined by generating random numbers and assigning codes t o various s ized increments t o shape the overa l l frequency d i s t r ibu t ion t o match t h a t from reference 3. The method of generating the random num- bers and shaping the frequency d i s t r ibu t ion i s given i n reference 1.
TEST VARIATIONS
Automatic and Semiautomatic Tests
Since tes t r e s u l t s obtained on automatic machines i n the present invest igat ion were t o be compared with r e s u l t s from t e s t s conducted on semiautomatic machines, it was f i rs t necessary t o deter- mine whether machine e f f ec t s would inval idate these com- parisons. Therefore, t he f i rs t tes t series consisted of a block form maneuver load program, program I( a ) , con- ducted on both semiautomatic and filly automatic machines.
Block and Random Programs
The second s e r i e s of tests was intended t o deter-
mine whether s ign i f icant ly d i f fe ren t r e s u l t s would be obtained from t e s t s having the same load s t a t i s t i c s but applied by d i f f e ren t procedures. load programs were conducted i n both block and random form:
The following
Program l ( a ) i s shown i n table I1 and was reported i n reference 4 ( load schedule 1). pos i t ive , a minimum load of 1 g, and a maximum load of 7.3g (design l i m i t load) .
It was a block form maneuver load tes t with a l l stress cycles
4
Program l ( b ) was the same a s program l ( a ) except that two addi t ional s t r e s s l&els were added above the highest l eve l of program l ( a ) .
Program l ( c ) was the same as program 1 ( a ) except t ha t two negative stress leve ls were added. stress levels .
Therefore, this program had eight posi t ive and two negative
Service Load L i m i t s
Because of unforeseen design defects, vehicles frequently a re placarded a f t e r r e l a t ive ly short service, t h i s usually means that the maneuver severi ty and/or speed w i l l be r e s t r i c t ed t o extend the fa t igue l i f e . This, i n e f f ec t , reduces the service l i m i t load fac tor f ind i n quant i ta t ive terms the e f f ec t of reducing q i n a maneuver load tes t program.
q and it i s therefore of i n t e r e s t t o
I n reference 4, block form fat igue tests were reported f o r q = 7.3 (pro- gram l ( a ) ) . mately 20 percent; t h i s resul ted i n a program with referred t o a s the The stress - cumulative frequency f o r both programs i s given i n t ab le I1 and i s shown i n graphical form i n figure 1.
I n program 2, the value of each s t r e s s cycle was reduced approxi- This program is
The two programs were otherwise ident ica l . q = 6.
q = 6 program.
Load programs 2 (a ) , 2 (b) , and 2(c) were conducted i n block form with load fac tors from program l ( a ) fo r various percentages of the expected l i f e a t 9 = 7.3 t ab le shows the incremental n l u e s of program l ( a ) used:
and then completed with load factors from program 2. The following
Program Percent of expected
l i f e a t q = 7.3 (program u a 1 1
Percent of expected l i f e a t q = 6
(program 2 )
--------- 100
Remainder Remainder Remainder
The preceding t e s t schedules were designed t o evaluate t h e influence on fa t igue l i f e of reducing the service l i m i t load fac tor . Frequently, t he con- verse s i t ua t ion a r i s e s ; t h a t i s , mission requirements cause the service l imi t load fac tor t o be increased. In order t o evaluate the e f f ec t of t h i s type of change, load program 2( d) was developed. I n program 2( d) , loads were applied according t o program 2 u n t i l approximately 50 percent of the expected l i f e a t q = 6 f o r the remainder of t he tes t .
had elapsed,then the loads were increased t o the values fo r program l ( a )
5
TESTING MACHINES
A block diagram of the machine used i n t h i s invest igat ion i s shown i n f i g - ure 2. a x i a l load and the system i s capable of cycling rates up t o 7 cycles per sec- ond (7 Hz) depending on the load range. load controls i s selected i n an a r b i t r a r y sequence by a logic system which receives i ts si@;nal from punched cards. Use of t h i s electrohydraulic system allows the programing of any load h is tory t h a t can be represented by 55 or fewer discrete load leve ls .
The machine has a nominal capacity of k10 000 pounds (k44.5 W ) i n
A n y one of 55 individual ly adjustable
I n operation, the card reader transmits coded load information t o a logic system. The logic system performs a s e r i e s of funct ional checks and then switches the correct preset load control potentiometer i n t o t h e sensing c i r c u i t . The voltage from t h e load control i s combined with t h e output from a s t r a i n - gage bridge attached t o a weighbar which i s i n se r i e s with t h e specimen. The resu l tan t voltage (magnitude and po la r i ty ) i s used t o d i r ec t a servo valve. True load accuracy i s estimated t o be k0.3 percent of f u l l scale , or k 3 O pounds (13.35 N ) . This system i s explained i n d e t a i l i n reference 1.
SPECIMENS
The tes t specimens were made of 7075-T6 aluminum-alloy sheet, 0.090 inch (2.3 mm) thick. The specimen Configuration i s shown i n f igure 3 and consisted of edge notches with a theo re t i ca l e l a s t i c stress concentration f ac to r of 4.0. The specimen fabricat ion procedures a re given i n the appendix. The mater ia l properties (from ref. 5) a re given i n t ab le 111.
SERVO LOOP
Figure 2.- Block diagram of programed variable-amplitude fatigue test ing machine.
17.500in. t
8 750 in I ( 2 2 . 2 c m I .O 750in. ( I 9 cm)
r=O.O58in (015 c m )
I 5 0 0 i n . (3.81 cm)
- 2 2 5 0 i n .
( 5 7 2 cm)
Figure 3.- Specimen configuration w i th edge notches made of 0.090-inch-thick (2.3 m m ) 7075-T6 aluminum-al loy sheet. Kt = 4.0.
6
P
U l t i m t e t e n s i l e strength
k s i
TABLE I11
TENSILE MECHANICAL PROPERTIES OF TOT>-% AulMTNuM ALLOY
F52 t e s t s ; data from reference 5 1 Yield s t rength Total
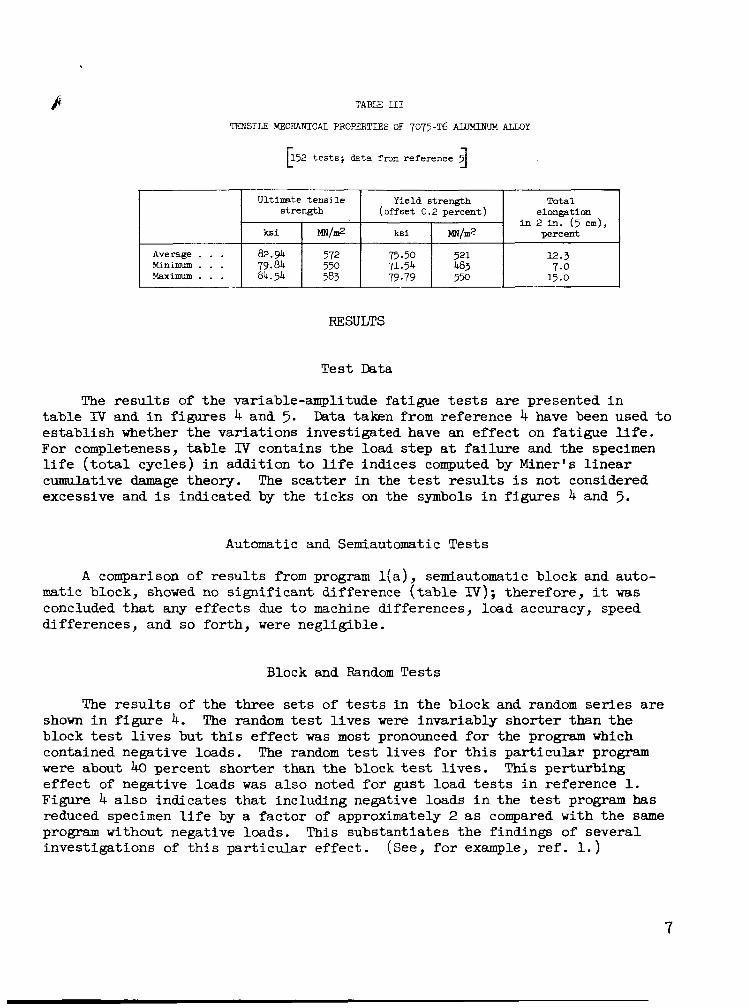
The results of the variable-amplitude fatigue t e s t s a re presented i n table N and i n figures 4 and 5. es tab l i sh whether the var ia t ions investigated have an e f f ec t on fat igue l i fe . For completeness, table IV contains the load s tep a t failure and the specimen l i f e ( t o t a l cycles) i n addition t o l i f e indices computed by Miner’s l i nea r cumulative damage theory. excessive and i s indicated by the t i c k s on the symbols i n figures 4 and 5.
Data taken from reference 4 have been used t o
The sca t t e r i n the t e s t r e s u l t s is not considered
Autmatic and Seloiautomatic Tests
A comparison of r e su l t s from program l ( a ) , semiautomatic block and auto- matic block, showed no s igni f icant difference ( t ab le IV); therefore, it was concluded t h a t any e f f ec t s due t o machine differences, load accuracy, speed differences, and so for th , were negligible.
Block and Random Tests
The r e s u l t s of the three sets of t e s t s i n the block and random series a re shown i n figure 4. The random test l i v e s were invariably shorter than t h e block test l i v e s but t h i s e f f ec t was most pronounced f o r the program which contained negative loads. w e r e about 40 percent shorter than the block test l ives . e f f ec t of negative loads was a l so noted f o r gust load tests i n reference 1. Figure 4 a l so indicates t h a t including negative loads i n the t e s t program has reduced specimen l i f e by a fac tor of approximately 2 as compared with the same program without negative loads. This substantiates the findings of several investigations of t h i s par t icu lar e f fec t .
The random t e s t l i ves f o r t h i s par t icu lar program This perturbing
(See, f o r example, r e f . 1.)
7
TABLE IV
VARIABLE-AMPLITLIDE TEST RESULTS MANEWER LOAD SPECTRUM
Program ~ ( c ) (program 1 ( a ) + 2 l eve l s < 0 ) ; random ?rogram 2( d) (50 percent program 1( a ) p lus program 2)
B15N2-1
B105N1-9 ~ 8 5 ~ 2 -3 ~85~2-1
B85~2-8 B105N-8
B105N1-4
0.85 .78 .75 .75 .74 .63
0.75 -
23 412 21 159 20 880 20 706 20 357 17 393
8 8
1 Geometric mean . . . . . . . . . . .
-. ~ - 20 570 . . . . .
*Reference 4.
8
1;
Program I ( a )
P r o g r a m I (b1
P r o g r a m I(c)
Moneuver r
Positive only
Posit ive + 2 > S e
P o s i t i v e + 2 Sl<O
Block form test 0 Rondom form tes t
ca
u u .5 I 5
c+
Figure 4.- Results of variable-amplitude fatigue tests showing effects of IMd randomization. Maneuver load spectrum; 7075-T6 aluminum alloy; l g stress = 7 ksi (48.3 MN/m2),
Percent of expected l i f e ot:
P r o g r a m r\ -7.3 r\ = 6 . 0
- I(o1 io0
1 0 0 - 2
2to) 25 Remainder
2(b) 5 0 Remainder
2(c) 7 5 R e m a i n d e r
2 ( d ) Remainder 5 0
T e s t s With Varylng Service Limi t Load Factor
A s shown i n figure 5, the number of simulated f l i g h t s the specimens survived first increased and then decreased a s the p r io r his tory loading under the more severe program increased from 0 t o 75 percent of the spec- imen’s average l i fe . For the pa r t i cu la r combination of load fac tors and p r io r h i s to r i e s used, the l i f e , i n simulated f l i g h t s , was a maxirmun a t t he 25-percent point, and the l i f e under t h i s combination was approximately 33 percent longer than the l i fe under the less severe program by i t s e l f .
The r e s u l t s of the tests dealing with block and random programs were ana- lyzed by Miner’s theory. This theory i s widely known and provides a convenient standard f o r comparison of fa t igue tes t resul ts . changing load limits, however, were analyzed on the bas i s of the number of s i m - u la ted f l i g h t s t he specimen survived. The number of simulated f l i g h t s i s equal t o the number of cycles survived divided by 68, since from reference 3 the average number of cycles per f l i g h t was 68.
“he t e s t s concerned with
A s an a i d i n judging whether an e f f ec t was present, the data were compared s t a t i s t i c a l l y with reference 6 a s a guide. In order t o make the s t a t i s t i c a l
9
analysis, the d is t r ibu t ion of t es t r e s u l t s was assumed t o be log normal and a 95-percent confidence l e v e l w a s used. The standard deviations of t he logar i
a r e ( o r are not) s ign i f icant ly d i f f e ren t ) and the means of t h e logarithms of t es t r e su l t s were compared by the "t" tes t ( i . e . , sample means a r e ( o r a r e not ) s ignif icant ly d i f f e ren t ) . The r e s u l t s of t h i s s t a t i s t i c a l analysis are pre- sented i n table V. The values i n t a b l e V provide quant i ta t ive support f o r the qua l i ta t ive conclusions reached i n the preceding observations.
s of t e s t r e su l t s were compared by t h e "F" test ( i . e . , sample standard deviat io T s
TABLE V
RESULTS OF STATISTICAL ANALYSIS OF VARIABLE-AMPLITUDE FATIGUE TESTS
[kmeuver load spectrum; 7 0 7 5 - T 6 aluminum-alloy specimens; 1 g stress = 7 ks i (48.3 MN/m21
Program 1( a ) , semiauto block
Program l ( a ) , automatic block
Program l ( a ) , random
Program l ( b ) , random (prog. l ( a ) + 2 > S8)
Program l ( b ) , block
Program 1( c ) , random (prog. l ( a ) + 2Si < o
Program l ( c ) , block
% -4
- P
- 0 P - +
Ld .A
k f M a l or0
e 2
% 0.92
NO
1.32
1.02
2.60
Yes
1.28 -
X
0 P- P - P P- v
!! M Ll a -
No
Yes
2.52
-
Y e s
Y e s
1 1.57
5 P- P - U
P- v
9 M h a -
Yes
-
\
--Sample b / N geometric means a r e s ign i f icant ly d i f f e ren t . I i .281\
Top group Side group
-atio X n / N geometric means,
10
- -
-c o m - 0
N h
f a
M r - 0- k k a a
Yes
Yes
Yes
No
A h
N -
+ - 74
d + ? I N
M M 0 0
k $ c , + - c
.da, - 0 CUh m a
k 0 2 a M l n 0-
Yes
Yes
Yes
Yes
,
#
TABLE V.- Concluded
RESULTS OF STATISTICAL ANALYSIS OF VARIA2JE-AMPIlTLmE FATIGUE TESTS
[hneuver load spectrum; 7075-T6 aluminum-alloy specimens; 1 g stress = 7 h i (48.3 ~ / m 2 i
.-. N
+ a rl
- v
ti
k P4
t, - G d m - 0 NFI
E g k l n M N 0.-
a
- N
+ d d
M k a t,
- G P o ) - 0
N h
E a
M A 0-
a
v
W
/I
F
N
2 M h a
\ - 1.75
Yes Yes Yes 'rogram l(a), block q = 7.3
'rogram 2 7 = 6 \ Yes Yes
'rogram 2(a) (25 percent prog. l(a) + 2 ,
5-82 L.39 \ NO 5 0.69
1.5L
-
'rogram 2(b) (50 percent prog. l(a) + 2'
L.14 - 3.78
i.36 -
0.82
- 0.56 - 1.89
'rogram 2( c ) (75 percent prog. l(a) + 2
'rogram 2 ( d ) (50 percent prog. 2 + l(a)
Yes ---Sample simulated flights geometric means are significantly different.
I t i o si-ted flights geometric means, Top group Side group
DISCUSSION OF €ESULTS
Damage and Failure Considerations
Trends i n fa t igue l i f e observed i n t h e present tes ts are explained quali- t a t i v e l y on the bas i s of res idual stress and residual s t a t i c strength considerations.
11
Residual s t resses . - Residual stresses a r e obtained whenever a l o c a l stress, such a s a t the root of a notch, has exceeded the e l a s t i c l i m i t of t he materidq-. The p l a s t i ca l ly deformed mater ia l m u s t be s t ressed t o re turn t o i t s o r ig ina l shape, and the necessary force i s provided by the adjacent e l a s t i c a l l y s t ra ined material. Residual s t r e s ses cannot be computed accurately or determined by non- destructive tes t ing ; however, t h e i r e f f e c t s can be determined through experi- mental methods and used t o advantage.
Compressive residual stresses delay fat igue crack i n i t i a t i o n and propaga- t i on , whereas t e n s i l e res idua l stresses have an adverse e f f ec t . The benef ic ia l e f f ec t s of compressive residual s t r e s ses w i l l decay under repeated cycling, t h e rate of decay being determined by the r e l a t i v e magnitude of the highest load l e v e l and successive load leve ls .
Residual s t a t i c strength.- Fai lure of t he specimen occurs when the applied load equals the residual s t a t i c s t rength of t h e specimen. The res idua l s t a t i c strength of a specimen f i r s t decreases sometimes precipi tously as a crack i s i n i t i a t e d and then de ter iora tes fur ther with increasing crack length. r e f . 7 . ) i f any, e f f ec t on the res idua l s t a t i c s t rength. High loads which may produce residual s t r e s ses tha t increase fat igue l i f e by retarding crack i n i t i a t i o n and propagation may a l s o cause ear ly f a i l u r e of a specimen containing a short fa t igue crack i f t he load exceeds the res idua l s t a t i c strength of t he specimen. Table I V indicates t h a t almost every specimen f a i l e d on the highest load i n the program, which substant ia tes t he above argument.
(See I n engineering materials, res idua l s t r e s ses probably have very l i t t l e ,
Block and Random Tests
In t h e block and random test s e r i e s , program l ( c ) showed the l a rges t var i - a t ion i n l i f e ; t h i s indicates t h a t t h e presence of negative load cycles i s one of t h e most disrupt ive fac tors i n comparisons of block and random tests. This variation w a s probably due t o the f a c t t h a t i n t h e block form tes t , the negative loads,which reduce benef ic ia l res idual s t resses ,occurred i n groups a t widely spaced in te rva ls and i n t h i s form had l i t t l e more e f f ec t than would s ingle neg- a t i v e loads a t l i k e in te rva ls . The same number of negative loads occurred i n the random t e s t , but i n t h i s case they were d is t r ibu ted throughout t he tes t program and therefore , i n e f f ec t , occurred a t a much higher frequency. This multiplied t h e i r res idual stress destroying capabi l i ty and a correspondingly shorter l i f e was obtained f o r t he random t e s t .
For t es t programs l ( a ) and l ( b ) t he differences between l i v e s of random and block tes ts were small. These differences were probably due t o the f a c t t h a t the random programs introduced more high load cycles i n the in t e rva l of program used than was t h e case f o r t h e block t e s t s . The random t e s t schedules were programed t o have the same s t a t i s t i c s a s the block t e s t s f o r t he t o t a l load history; however, the tes t l i f e ac tua l ly involved only a small i n t e rva l of the complete his tory and the above s i tua t ion was found t o be t rue i n the i n t e r - va l used.
It w a s noted tha t summation of cycle r a t i o s were approximately 2 f o r t h e t e s t s with a l l pos i t ive load fac tors , but were close t o 1 f o r the tes ts
12
containing negative loads. pumished i n reference 4.
These r e su l t s are consistent Kith the r e su l t s
Varying Service L i m i t Load Factor Tests
In t e s t programs 2(a) , 2(b) , and 2(c) t h e l i v e s were considerably longer than would be expected from l inear damage accumulation theories. i n life may be explained on the basis of res idual s t resses; that is, the high residual stresses introduced by the large amplitude loads of t he delayed crack i n i t i a t i o n and/or growth a t the subsequent lower s t resses of t h e q = 6 level .
This increase
q = 7.3 l eve l
For program 2(d) , i n which the low s t ress leve ls preceded the high s t r e s s leve ls , the t o t a l l i f e was approximately the sum of one-half the l i f e a t q = 6 and one-half the l i f e a t q = 7.3 of l i nea r damage theories . the other t e s t s i n which the high s t resses preceded the low s t r e s s leve ls .
which would be expected on the bas i s A s noted, however, t h i s concept does not hold f o r
CONCLUDING REMARKS
Variable-amplitude axial-load fat igue t e s t s of 7075-T6 aluminum-alloy sheet specimens were conducted according t o loading schedules designed t o approximate maneuver load h i s to r i e s . following observations:
The resu l t s of these t e s t s support the
Maneuver load fat igue l i v e s were shorter for random form t e s t s than fo r block-form t e s t s having t h e same load spectrum. when the loads were applied i n random sequence and negative loads were included.
The shortest l i f e occurred
Negative loads i n a t e s t program reduced fat igue l i ves by a factor of 2 as compared with the same t e s t without negative loads. t i on of cycle r a t i o s was found t o be approxixrately 1 and 2, respectively.
The corresponding summa-
Fatigue l i v e s up t o 60 percent above the or ig ina l test l i f e were obtained by preloading with a portion of a t e s t program having a higher l i m i t load factor .
.
A l l of t he trends noted herein may be explained qua l i ta t ive ly with the a i d of res idual s t r e s s and residual s t a t i c strength considerations.
Langley Research Center, National Aeronautics and Space Administration,
Langley Stat ion, Hampton, Va., August 5 , 1965.
APPENDIX \
Specimens
The material for specimens used i n t h i s investigation was taken from p a r t of a stock of commercial grade 0.090-inch-thick ( 2 . 3 mm) sheets of 7075-T6 alu- minum al loy retained a t the Langley Research Center f o r fatigue tes t purposes. The material properties are given i n t a b l e 111. given i n f igure 2 of reference 8.
The material blank layout i s
Each specimen w a s stamped with a number ident i fying the specimen as t o material, sheet number, and location within t h e sheet. For example, specimen ~115~1-7 i s 7075-T6 ( B ) , taken from sheet 115, blank N1, seventh posit ion.
The specimen dimensions are shown i n f igure 3. The specimen surface was l e f t as received, and t h e longitudinal edges were machined and notched t o give a theoret ical e l a s t i c concentration f a c t o r of 4.0. chosen because it has been found t o have fat igue charac te r i s t ics representative of a i r c r a f t components ( ref . 9 ) . form the notch root and then s l o t t i n g t o t h e specimen edge with a 3/32 inch (2.4 mm) mill ing too l . an undersize hole was d r i l l e d f i rs t and enlarged t o the proper radius by using progressively l a rge r dri l ls . nesses and then replaced. The last three d r i l l increments were 0.003 inch (0.076 m) and a d r i l l press with constant automatic feed w a s used.
This configuration w a s
The notch w a s formed by d r i l l i n g a hole t o
I n order t o minimize residual s t r e s ses due t o machining,
Drills were used t o dri l l four specimen thick-
Burrs l e f t on the specimens by the machining process were removed by holding the specimen l i g h t l y against a ro ta t ing composition dowel impregnated with a f ine grinding compound. This procedure was used t o keep the present tes ts consistent with past tests conducted a t t he Langley Research Center. All specimens were inspected with a f i v e power magnifying glass, and only those f r e e of defects i n and near the notches were used.
14
REFERENCES I
1. Naumann, Eugene C.: Evaluation of the Influence of Load Randomization and of Ground-Air-Ground Cycles on Fatigue Life. NASA TN D-1584, 1964.
2. Mechtly, E. A.: The International System of Units - Physical Constants and Conversion Factors. NASA SP-7012, 1964.
3. Mayer, John P.; Hamer, Harold A . ; and Huss, Carl R.: Controls and the Resulting Airplane Response During Service Training Oper- ations of Four Jet Fighter Airplanes.
A Study of the U s e of
NACA RM ~ 5 3 ~ 2 8 , 1954.
4. Naumann, Eugene C. ; and Schott, Russell L.: Axial-Load Fatigue Tests Using Loading Schedules Based on Maneuver-Load S t a t i s t i c s . NASA TN D-1253, 1962.
5 . Anon. : A Tentative Guide f o r Fatigue Testing and the S t a t i s t i c a l Analysis of Fatigue Data. Spec. Tech. F’ubl. No. 9 l -A , Am. SOC. Testing Mater., 19%.
6. McEvily, Arthur, J., Jr.; Illg, Walter; and Hardrath, Herbert F.: Strength of Aluminum-Alloy Specimens Containing Fatigue Cracks.
S ta t ic NACA
TN 3816, 1956.
7. Grover, H. J.; Bishop, S. M.; and Jackson, L. R.: Fatigue Strengths of Aircraft Materials. of 24S-T3 and 75S-T6 Aluminum Alloys and of SAE 4130 Steel.
Axial-Load Fatigue Tests on Unnotched Sheet Specimens NACA TN 2324,
1951
8. Spaulding, E. H.: Design fo r Fatigue. SA?3 Trans., vol. 62, 1954, pp. 104-116.
9. Grover, H. J.; Hyler, W. S.; K u h n , Paul; Landers, Charles B.; and Howell, F. M.: Axial-Load Fatigue Properties of 24s-T and 75s-T Aluminum Alloy as Determined i n Several Laboratories. NACA Rept. 1190, 1954. (Super- sedes NACA TN 2928. )