, NASACONTRACTOR NASA CR-2378 REPORT \ = NON-ENGINE AERODYNAMIC NOISE INVESTIGATION OF A LARGE AIRCRAFT by John S. Gibson Prepared by LOCKHEED-GEORGIA COMPANY Marietta, Ga. 30063 for 12mgley Research Cetzter. NATIONAL AEKONAUTICS AND SPACE ADMINISTRATION WASHINGTON, D. C. OCTOBER 1974 https://ntrs.nasa.gov/search.jsp?R=19740026369 2019-02-15T07:14:40+00:00Z
Transcript
, N A S A C O N T R A C T O R N A S A C R - 2 3 7 8
R E P O R T
\ =
NON-ENGINE AERODYNAMIC NOISE INVESTIGATION OF A LARGE AIRCRAFT
by John S. Gibson
Prepared by
LOCKHEED-GEORGIA COMPANY
Marietta, Ga. 3 0 0 6 3
for 12mgley Research Cetzter.
N A T I O N A L A E K O N A U T I C S A N D SPACE A D M I N I S T R A T I O N W A S H I N G T O N , D. C. OCTOBER 1974
NO N -E NG I NE AERODYNAMIC NO1 SE INVESTIGATION OF A LARGE AIRCRAFT
BY John S . Gibson
I Loc kheed-Georgia Company
I SUMMARY
Previous noise measurements and prediction procedures for non -engine aerodynamic noise were based on glider and small aircraft data (590 kg to 17,690 kg gross weight). The purpose of this program was primarily to determine i f the aerodynamic noise levels of a very large aircraft did occur in the general range predicted by small-aircraft prediction techniques. To verify large aircraft predictions, a series of flyover noise measurements were made under a C-5 Galaxy aircraft. The engines were cut back to fl ight idle, so that engine noise would have a minimum effect and could be separated from the non- engine aerodynamic noise. This type of experimental procedure was successful, and effective measures of aerodynamic noise were made from very low frequencies, through the expected peak aerodynamic noise range, and on up to the engine turbo-machinery noise range.
Effects of aerodynamic configuration were evaluated, particularly those relating to wing-flap and landing gear extension. Time histories of flyover noise showed complex variations of noise with time. Three specific noise source areas were identified: (1) air- flow over and from the wings, (2) airflow around the landing gear and wheel wells, and (3) trailing vortex wake. The first two are the most significant. Other possible secondary sources and subdivisions of the main sources were investigated, but no firm identifications could be made.
Peak aero noise frequencies and levels were close to those predicted. Wing-related noise had a narrower bandwidth than expected, resulting in less high-frequency noise and lower perceived noise leve Is than expected for an aerodynamica I ly IIc lean'' aircraft. The spectrum shape for normal, aerodynamically "dirty" landing configuration aircraft was essentially as predicted, and perceived noise as well as overall noise levels were close to those predicted. Therefore, i t i s concluded that the primary objective of the experimental program was met. I n addition, more insight was gained into the basic noise mechanisms involved.
I NTRO DUC T I ON
The subject of non-engine aerodynamic noise (sometimes called ''self-noise" or ''airframe noise") was concerned unti I recently with noise radiation from small, military survei I lance aircraft. Here the problem was to reduce noise so that the aural detection distance from an observer to the aircraft was at a minimum. To determine the contribu- tion of non-engine aerodynamic noise (hereafter usually referred to as aero noise) to the aural detection problem, noise measurements and analyses were made of the flyovers of gliders and unpowered smal I aircraft (q . , Ref. 1).
During the recent (1971 - 72) NASA sponsored Advanced Technology Transport Study Program, a complete systems analysis of advanced subsonic transport design was undertaken. This effort looked into noise problems in detail. Quiet aircraft and engine designs were investigated to get aircraft total noise levels as low as 20 EPNdB below current FAR 36 criteria levels. When i t appeared that the conventional noise sources of a transport air- craft could be reduced on this order, i t was necessary to investigate any additional possible noise "floors" or "barriers" that might prevent reaching the desired low noise levels. The generation and radiation of aero noise appeared to be a potential problem. The technology resulting from the small-aircraft programs was then applied to the large advanced subsonic aircraft under study, and surprisingly high noise levels were predicted (Ref. 2). A typical predicted spectrum i s shown i n Figure 1. Subjective noise predictions for a typical case (gross takeoff weight 272,000 kg) for the three FAR 36 locations were: takeoff flyover 92 EPNdB, takeoff sideline 86 EPNdB, and landing approach flyover 97 EPNdB, where the current criteria l imi t for a l l three cases i s 108 EPNdB.
The predicted level i s relatively high on takeoff flyover, but i s about 16 EPNdB below the criteria. At the sideline point, the predicted level i s 22 EPNdB below the criteria. Unless the engine noise levels and criteria are reduced by 15 ta 20 EPNdB on takeoff and sideline, aero noise would not be expected to have a great effect. However, on landing, the predicted 97 EPNdB i s only 11 EPNdB under the criteria. Thus, the large reductions in noise of new, quieter engines might not be effective i n the landing case, i f the aero noise predictions were realistic.
In order to determine i f the aero noise levels of a very large aircraft did occur in the general range predicted, and to find out more about the possible mechanisms involved (Figure 2), i t was felt that aero noise measurements were needed on a very large aircraft. The appropriate measurements were made under low-altitude flyovers of a Lockheed C-5 "Galaxy" transport. This report describes the experimental procedures and results of the f lyover noise measurement program.
2
EXPERIMENTAL RESULTS AND ANALYSIS
Experimenta I Procedures
To explore the extent and nature of the aero noise problem, an investigation of C-5 "Galaxy" flyover noise, infl ight with low engine power, was undertaken. Figure 3 shows, for reference, the overall dimensions and shape of the aircraft. The basic idea was to concentrate on the low-frequency range, where non-engine aerodynamic noise was expected to peak, and not to use the mid- to high-frequency range noise data known to be the range of engine fan tones. Also, low-frequency engine iet noise was expected to be 10 to 20 dB below non-engine aero noise. Thus, an acoustic "window" existed i n the frequency range of expected maximum aero noise levels, bounded on the bottom by engine iet noise and in the high-frequency range by the fan fundamental. Any noise appearing in the "window" i s assumed to be aero noise. A description of the "window" and a typical example of f ly- over data compared with static data are given in Figure 4. Litt le change would be expected i n the strong fan tones with forward speed, and litt le was observed. Some reduction in jet noise could be expected due to the relative velocity effect on jet noise. Therefore, the bottom boundary of the ''window" could actually be lower than that shown in Figure 4. (Further discussion of this subject appears in a later section.)
Detai I s of the experimental program are presented below.
Microphone Location - The microphone station was located at the west end of the main runway at Dobbins AFB, Georgia, in a flat, grassy overrun area, 140 meters from the pave- ment on the extended runway centerline. The general location i s given in Figure 5 .
Instrumentation and Equipment - B&K Type 4132 (2.54 cm) microphone and windscreen, 1 -5 meters above ground; B&K Type 2204 sound level meter; Nagra A .M . tape recorder for noise data acquisition. Data reduction was accomplished on a B&K Model 3329 one-third- octave-band analyzer, and an EMR 6040 computer with a fast Fourier transform program for narrow-band work. Altitude, gross weight, airspeed, were obtained from the aircraft. The Pressure altimeter was calibrated with the ground station on each run. Weather data were obtained from the Dobbins PFB weather office.
Procedure - The time history of each aircraft flyover was recorded on tape. The air- craft approached from the west using flight idle engine power unti l well past the measuring station, then fu l l power was applied for go-around. Target altitude over the measuring station was 100 meters. Actual altitudes ranged from 36 to 146 meters.
Date and Weather Conditions - 1 s t Test Series, January 18, 1973.
Temperature 15.6OC Re la t i ve Humidity Wind 2.3 m/s, N.W. Barometer
73%
763 mm of Hg . 3
- 2nd Test Series, March 12, 1973
Temperature Re la tive H um id i ty Wind Barometer
17.OoC 69% 3.6m/s, N.W. 753 mm of Hg.
Test Runs and Aircraft Configurations - Details regarding test runs and aircraft config- urations are given in Table 1 . In addition, dimensions which were constant are: wing span, 68.0 meters; average wing chord, 8.6 meters; and average wing thickness, 0.86 meters. Lockheed flight test airplane, Serial Number 0003, was used for a l l noise measurements.
Aerodynamic Configuration Effects
One of the obiectives of the experimental program was to determine the differences between the spectrum shapes for an aerodynamically "dirty" aircraft (with landing gear, flaps, and leading-edge slats extended) and an aerodynamically IIc lean" aircraft (all devices retracted). Photographs of the various configurations are shown in Figures 6, 7, and 8. The first, Figure 6, i s the takeoff configuration, shown for information only, since no data were taken at this condition. The landing configuration i s shown in Figure 7 and Figure 8 shows the "clean" configuration with a l l landing devices retracted.
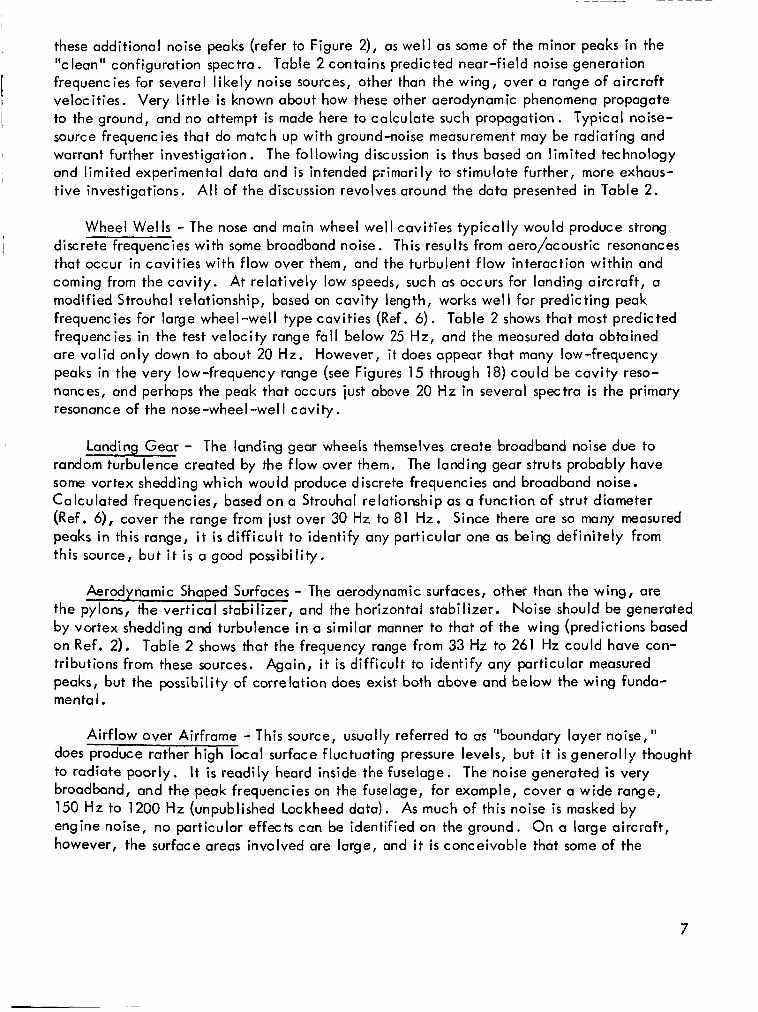
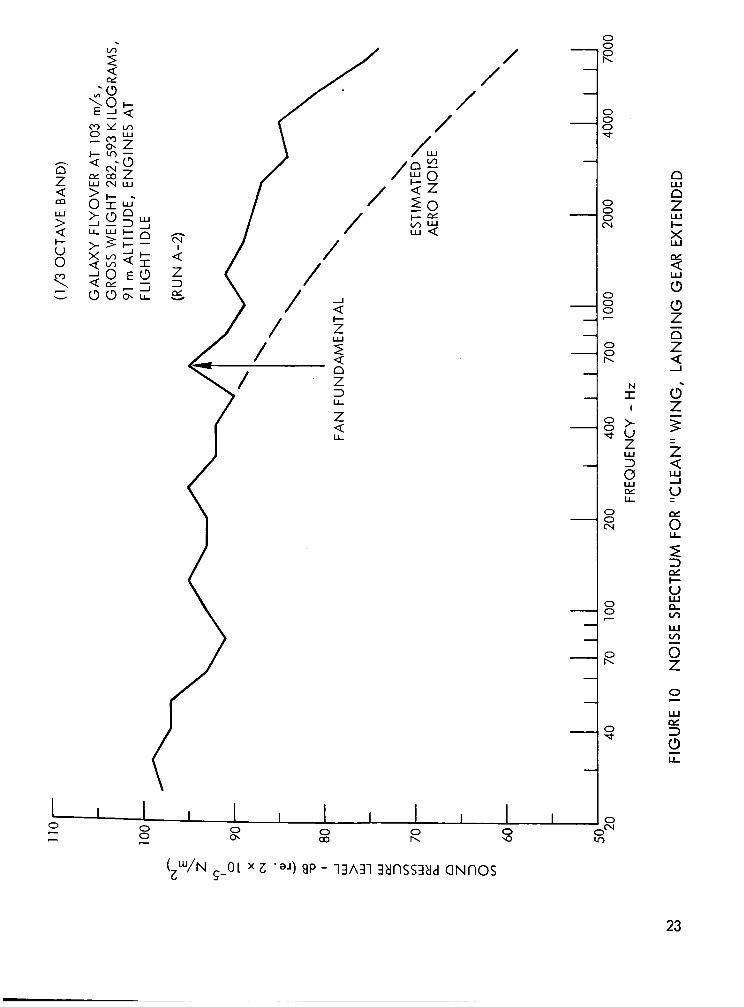
Figures 9 through 13 show third-octave spectra (peak levels) for a l l test runs in the first series. Figure 9 i s the spectrum resulting from a IIcIean" configuration flyover. This spec- trum, below the fan fundamental, has a peaked broadband shape that corresponds to pre- dicted fluctuating l i f t force/vortex shedding noise from the wing. The measured peak frequency in the broadband area corresponds rather closely to the predicted Strouhal frequency for wing-flow noise (discussed in a later section). These apparent semi-discrete frequencies occur in a fairly high Reynolds number range (4.0 x 10 6 to 6.0 x lo6, based on
wing thickness), even though one recent laboratory investigation could find no discrete frequency emission from a small airfoil at Reynolds numbers above 2.4 x 10 6 (Ref. 3).
Figures 14 through 18 are narrow-band plots for a l l first-series test runs. (These, and other narrow-band plots in this study, were made from a 1 .5-second segment of t ime just after the peak flyover noise levels occurred. The effective analyzer band- width was 1 .O Hz for a l l narrow band plots.) Figure 14 i s a narrow-band plot showing that, not only does a wing fundamental appear, but also an array of additional discrete frequencies appear throughout the spectrum. A l l these cases show a second hardmonic,
which in one case was as high tis the fundamental (Figure 18). It i s suspected that angle of attack, which was not constant during the tests, could have caused considerable varia- tions in fundamental -to-harmonic relationships. The characteristic frequency of fluctuating drag forces also i s double the frequency of the larger fluctuating l i f t forces. It does not appear that fluctuating drag-force noise could be as significant as fluctuating lift-force
4
noise, since drag forces are so much smaller and predominantly radiate in the wing plane, unless some sort of interaction occurs between the two sources.
Figure 1 1 i s an infl ight third-octave-band plot of a typical "dirty" configuration test run. The spectrum below the fan fundamental i s full of peaks, with rather high levels below the wing fundamental. Therefore, the combined effects of lowering landing gear and extending flaps and slats have greatly broadened the spectrum, The wing fundamental and harmonic can s t i l l be seen i n a l l the "dirty" configuration runs (Figures 10 through 13). In narrow-band form (Figures 15 through 18), these same spectra indicate that most of the increases i n noise level are also due to discrete or semi-discrete frequency emissions, rather than to broadband emissions such as might be expected in boundary-layer noise.
Since the "dirty" configuration spectra appear to be somewhat insensitive to f lap and slat extension on the wing, i t i s fel t that most of the noise increases are associated with the landing gear and wheel well, with only a slight trend toward increasing noise with increasing flap extension. This i s not entirely a conclusive result, since noise related to the landing gear/wheel well could be masking or interacting with flap effects.
A second series of three test runs was made to improve the isolation of f lap effects. Here, only flap extension was varied as a test parameter. However, due to the nature of the test procedure, velocity and angle of attack were not constant for the three test runs. These results also did not conclusively show the flap extension effects. Compared with the first series, the relative amplitude of the wing fundamental and harmonic reversed i n one case (Run B-1, "Clean"). This i s shown, along with the two other spectra, in Figure 19. When the second series of runs are normalized to the same velocity and altitude, the intermediate f lap setting gave the highest level and ful l flap the lowest, further confusing the issue. One point which could have affected the results ( in addition to angle-of-attack effects) of the second test series was the fact that the aircraft altitudes were very low, from 36 meters to 50 meters; this probably put the microphone i n the acoustic near field of the wing noise source. I t should be recalled that the wing source itself i s almost 68 meters across. Therefore, i t i s fe l t that the second series of test results should not be compared with the first series on an absolute basis.
The following discussion i s a possible explanation of the absence in either series of the strong flap effects which were expected. The aircraft has six individual flaps on each wing, each separated by a flap track fairing, as shown in Figure 7. The result i s that, with increasing flap extension, the wing trailing edge i s becoming irregular with flap segments of different sizes and fairings protruding aft. an air gap between a portion of each adjacent flap, as shown in Figures 6 and 7. The overall effect i s apparently an irregular wing trailing edge that breaks up or decorre- lates any large-scale fluctuating l i f t and turbulence formations, thereby reducing noise. This i s the same concept that was thought to be one of the features of the "quiet" f l ight of owls which was propounded in 1934 by Graham (Ref. 4).
At high flap angles, there i s also
5
The effects noted in this test are not expected to be the same on a1 I aircraft. Most aircraft have one or two long flaps, from which strong, correlated turbulence phenomena could be expected. Therefore, on most current aircraft, greater increases in noise level with increasing flap extension may be expected than was experienced here.
Time -H i story Ana I ys i s
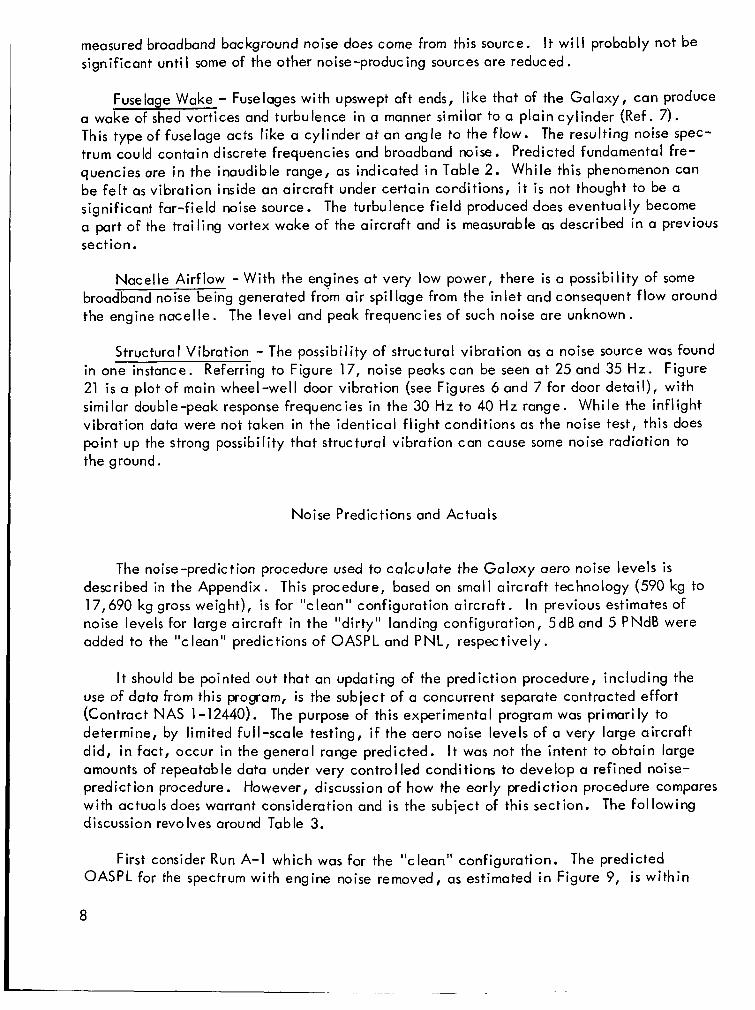
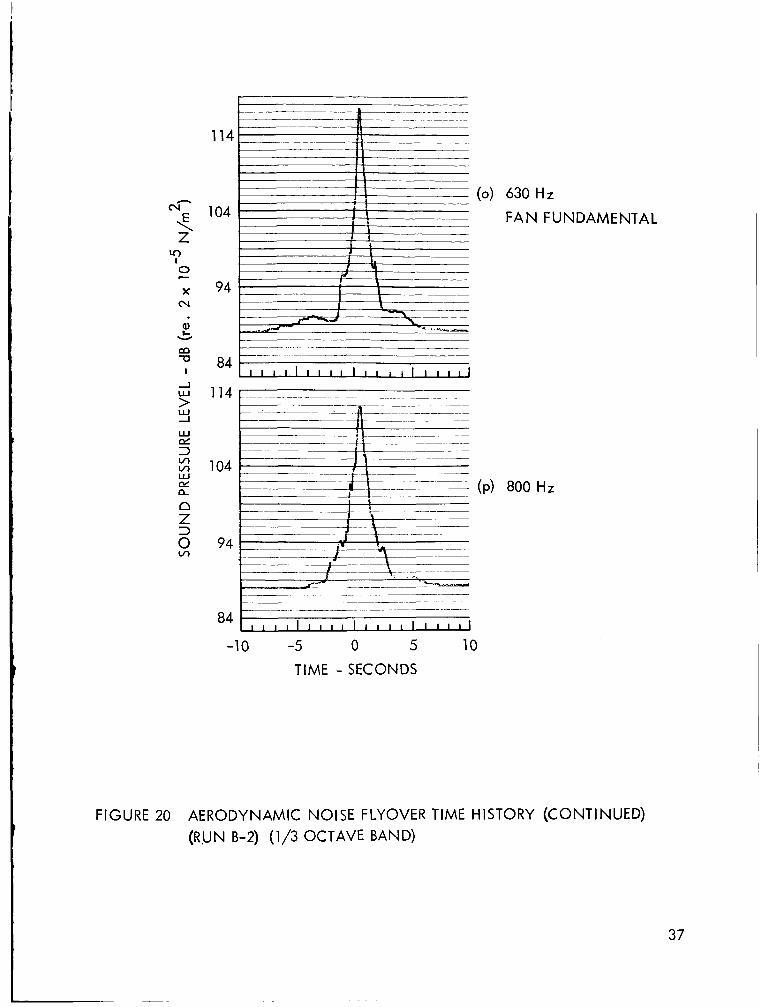
Time histories in each one-third octave band, up to and including the fan fundamental, are given in Figure 20 for a 40% flap, retracted landing gear case (Run B-2). The zero time point corresponds to the time of peak wing noise (100 Hz one-third-octave band); minus time i s time before peak, and plus time i s time after the peak. Peak wing noise time corresponds approximately to the time the wing inboard trailing edge i s directly over the measuring station. The correlation between peak wing noise time and aircraft location was done visually and i s good to about f 1/8 second. This test run had the cleanest signal for the entire time history. It was also the run with the lowest aircraft altitude and the highest signal levels. It should further be recalled that the measuring station in this case i s in the acoustic near field.
Examining the time histories, starting at the low-frequency end, i t i s evident that there i s a double-peak trend, most pronounced at 63 Hz. As the frequency goes higher, a new double peak trend i s seen at 100 Hz (peak wing noise), and a triple peak at 125 Hz. At 200 Hz, a new triple peak i s evident, close together in time with the central peak predominant. Going on to much higher frequencies, i t i s evident that the fan noise fun- damental peaks at 630 Hz, just after zero time. This corresponds to known static fan noise directivity, which i s not expected to be affected significantly by the relatively low aircraft forward speed. The numerous small peaks and valleys provide much in the way of questions which cannot yet be answered. Some peaks may be due to fluctuating drag forces on certain aerodynamic surfaces. These would be expected to peak at other points than directly overhead. They may also be the result of harmonics of the primary fluctuat- ing forces, or could be partially the effect of ground to microphone interference.
I t i s also interesting to note that peak wing noise (100 Hz) and peak fan noise (630 H d have similar rise-and-fall characteristics as a function of time. These rise-and-fall times are similar to those of the total noise of other unsuppressed turbofan engine aircraft a t the same altitude with low engine power (e.g. , see Ref. 5).
Noise-Source Study
In a previous section, the basic noise effects of the two primary noise sources, wings and landing gear/wheel well, were discussed. It was also shown that wing fundamentals generally f e l l i n the lOOHz to 125 Hz range, and a prominent harmonic at twice those frequencies. When the landing configuration was measured, numerous peaks above and below the wing fundamental appeared. It would be informative to know what Causes
6
I these additional noise peaks (refer to Figure 2), as well as some of the minor peaks in the "cleanll configuration spectra . Table 2 contains predicted near-field noise generation frequencies for several l ikely noise sources, other than the wing, over a range of aircraft velocities. Very l i t t le i s known about how these other aerodynamic phenomena propagate to the ground, and no attempt i s made here to calculate such propagation. Typical noise- source frequencies that do match up with ground-noise measurement may be radiating and warrant further investigation. The following discussion i s thus based on limited technology and limited experimental data and i s intended primarily to stimulate further, more exhaus- tive investigations. A l l of the discussion revolves around the data presented in Table 2.
1 I
I
I Wheel Wells - The nose and main wheel well cavities typically would produce strong I I discrete frequencies with some broadband noise. This results from aero/acoustic resonances
that occur in cavities with flow over them, and the turbulent flow interaction within and coming from the cavity. At relatively low speeds, such as occurs for landing aircraft, a modified Strouhal relationship, based on cavity length, works well for predicting peak frequencies for large wheel -well type cavities (Ref. 6). Table 2 shows that most predicted frequencies in the test velocity range fall below 25 Hz, and the measured data obtained are valid only down to about 20 Hz. However, i t does appear that many low-frequency peaks in the very low-frequency range (see Figures 15 through 18) could be cavity reso- nances, and perhaps the peak that occurs just above 20 Hz in several spectra i s the primary resonance of the nose-wheel-we1 I cavity.
Landing Gear - The landing gear wheels themselves create broadband noise due to random turbulence created by the flow over them. The landing gear struts probably have some vortex shedding which would produce discrete frequencies and broadband noise. Calculated frequencies, based on a Strouhal relationship as a function of strut diameter (Ref. 61, cover the range from just over 30 Hz to 81 Hz. Since there are so many measured peaks in this range, i t i s di f f icult to identify any particular one as being definitely from this source, but i t i s a good possibility.
Aerodynamic Shaped Surfaces - The aerodynamic surfaces, other than the wing, are the pylons, the vertical stabilizer, and the horizontal stabilizer. Noise should be generated by vortex shedding and turbulence in a similar manner to that of the wing (predictions based on Ref. 2). Table 2 shows that the frequency range from 33 Hz to 261 Hz could have con- tributions from these sources. Again, i t i s diff icult to identify any particular measured peaks, but the possibility of correlation does exist both above and below the wing funda- menta l.
Airflow over Airframe - This source, usually referred to as ''boundary layer noise," does produce rather high local surface fluctuating pressure levels, but it i s generally thought to radiate poorly. It i s readily heard inside the fuselage. The noise generated i s very broadband, and the peak frequencies on the fuselage, for example, cover a wide range, 150 Hz to 1200 Hz (unpublished Lockheed data). As much of this noise i s masked by engine noise, no particular effects can be identified on the ground. O n a large aircraft, however, the surface areas involved are large, and i t i s conceivable that some of the
7
measured broadband background noise does come from this source. It w i l l probably not be significant unti l some of the other noise-producing sources are reduced.
Fuselage Wake - Fuselages with upswept aft ends, like that of the Galaxy, can produce a wake of shed vortices and turbulence in a manner similar to a plain cylinder (Ref. 7). This type of fuselage acts like a cylinder a t an angle to the flow. The resulting noise spec- trum could contain discrete frequencies and broadband noise. Predicted fundamental fre- quencies are i n the inaudible range, as indicated i n Table 2. While this phenomenon can be fe l t as vibration inside an aircraft under certain conditions, i t i s not thought to be a significant far-field noise source. The turbulence f ie ld produced does eventually become a part of the trailing vortex wake of the aircraft and i s measurable as described in a previous section.
Nacelle Airflow -Wi th the engines at very low power, there i s a possibility of some broadband noise being generated from air spillage from the inlet and consequent flow around the engine nacelle. The level and peak frequencies of such noise are unknown.
Structural Vibration - The possibility of structural vibration as a noise source was found in one instance. Referring to Figure 17, noise peaks can be seen at 25 and 35 Hz. Figure 21 is a plot of main wheel-well door vibration (see Figures 6 and 7 for door detail), with similar double-peak response frequencies in the 30 Hz to 40 Hz range. While the inflight vibration data were not taken in the identical flight conditions as the noise test, this does point up the strong possibility that structural vibration can cause some noise radiation to the ground.
Noise Predictions and Ac tuals
The noise-prediction procedure used to calculate the Galaxy aero noise levels i s described in the Appendix. This procedure, based on small aircraft technology (590 kg to 17,690 kg gross weight), i s for "clean" configuration aircraft. noise levels for large aircraft in the "dirty" landing configuration, 5dB and 5 PNdB were added to the ''clean" predictions of OASPL and PNL, respectively.
In previous estimates of
I t should be pointed out that an updating of the prediction procedure, including the use of data from this program, i s the subject of a concurrent separate contracted effort (Contract NAS 1-12440). The purpose of this experimental program was primarily to determine, by limited full-scale testing, if the aero noise levels of a very large aircraft did, in fact, occur in the general range predicted. I t was not the intent to obtain large amounts of repeatable data under very controlled conditions to develop a refined noise- prediction procedure. However, discussion of how the early prediction procedure compares with actuals does warrant consideration and i s the subject of this section. The following discussion revolves around Table 3.
First consider Run A-1 which was for the ''clean" configuration. The predicted OASPL for the spectrum with engine noise removed, as estimated in Figure 9, i s wi th in
8
0.6 dB of the predicted level. The PNL i s some 5.4 PNdB lower than that predicted. The main reason for the large difference in P N L i s the fact that the measured tlcleanll spectrum i s much steeper than predicted and, therefore, contains less high-frequency noise which i s very P N L sensitive.
NDW consider Run A-5 which i s a fu l l "dirty" configuration flyover. Here the OASPL i s 6.8 dB higher than predicted, the spectrum i s broadband and similar to that predicted, and the PNL i s 7.9 PNdB higher than predicted. Based on this run alone for "dirty" con- figuration effects, the estimated 5 PNdB increase added to a "clean1' prediction was nearly correct. However, the total difference between "clean" and "dirty" configurations, based on the difference between the two runs, i s 13.3 PNdB. This i s somewhat higher than the 9 PNdB reported after a preliminary evaluation of some of the early data (Ref. 8). The large relative difference i n P N L (as opposed to a difference of only 7.4 dB i n OASPL) i s primarily the result of the difference in shape of the "clean" measured spectrum which was not considered in the prediction process. These trends are similar to the results obtained on a 747 aircraft, where a ''clean" to "dirty" effect of 10 to 12 PNdB was found (Ref. 9 ) .
The main contributor to "dirty" configuration noise appears to be the landing gear area. As evidenced for Runs A-2, A-3, A-4, a l l of which had landing gear down and 0% to 40% flaps, the actual noise levels i n terms of OASPL are from 2.6 dB to 3.7 dB higher than predicted, and the PNL's are 2.1 PNdB to 3.3 PNdB higher than predicted. Therefore, even at 0% flaps, but with the landing gear extended, noise levels are considerably higher, and the spectrum shape broader than for the "clean" run A-1 (see Figures 9 through 13 for spectrum shapes).
The net result i s that there does appear to be a 3 to 4 dB OASPL and 3 to 4 PNdB P N L increase effect for 100% flap extension as compared to 0% or 40% flaps, a l l with gear extension. If the total ful l "dirty" configuration effect ison theorderof 13PNdB, and 3 to 4 PNdB i s due to the flaps, then the remaining 9 to 10 PNdB are due to the landing gear. The relatively s m a l l flap effect may be explained as being related to f lap design, as stated i n a previous section. f ie ld" landing gear and wheel well of the Galaxy as compared with most other "hard f ield" transports.
The large landing gear effect may be due to the larger than usual "soft
The second series of runs, as stated previously, gave somewhat unexpected and incon- sistent results i n spectrum shape and level. It should be remembered that these runs were a l l taken at very low altitudes and are assumed to be i n the acoustic near-field. Since the noise level prediction procedure i s strictly far-field, predicted versus actual results for these cases are assumed to be meaningless and are not considered further. However, for completeness, 2nd test series data are included in Table 3.
In terms of predicted peak wing noise frequency, near-field or far-field conditions should have essentially no effect. The results of both series of tests do show predicted to actual agreement to within 20%, some much better, except for one case at 23%. Since some actuals are higher and Some lower than predicted, the frequency prediction procedure i s assumed to be essentially correct within the simplified ground rules from which i t was derived.
9
Other Observed Effects
Jet Noise Level in Flight - A partial substantiation of the reduction of jet noise due to the forward speed of the aircraft was determined. Figure 22 presents a plot of the aero noise portion of a ''clean" configuration run (Test Run A-1, from Figure 9), along with a plot of the static jet-noise spectrum (from Figure 4). The low-frequency skirt of the "wing" aero-noise spectrum should drop off as indicated by the dashed downward extension, rather than leveling off at 75 dB. The jet velocity from the primary and fan nozzles are both approximately only 88 meters/second at f l ight idle, which falls i n the range of aircraft forward velocities encountered in this test program. Therefore, the relative jet velocity compared with the atmosphere i s essentially zero, and iet noise should drop appreciably. If i t i s assumed that jet noise does drop, i t must be concluded that the reason for the lack of a much greater "relative velocity" reduction i s the fact that, at very low jet velocities, "excess jet noise'' or other "tailpipe" noise sources are holding the level up, even though ''pure iet mixing'' noise may be much lower.
Trailing Vortex Wake Noise - After one of the low flybys (Run A-5), and when the aircraft was about 1600 meters away, the trailing vortex wake was clearly audible. Figures 23 and'24 show the measured third-octave and narrow-band spectra of this noise phenomenon. To a ground observer, vortex wake noise i s characterized by a general 'lrushing" sound similar to low-velocity jet noise, with the addition of Some faint "crackling" or "popping" sounds. The "cracking" sound i s believed to be associated with the beginnings of vortex breakup. The peak frequency i s rather low, and this noise source i s not expected to be a problem, except that i t might keep low-frequency noise levels up sufficiently to lengthen the time between the 10 dB down points on a flyover noise time history. This could possibly increase the level of an Effective Perceived Noise Level calculation.
C ONC LUSlO NS
The main objective of this test program was to determine i f the aero noise levels of very large aircraft did occur in the general range predicted. Since the peak frequencies and levels did appear essentially as predicted, i t i s concluded that this primary test obiec tive was met.
Three noise source areas were identified: ( 1 ) wing noise, ( 2 ) landing gear/wheel well noise, and (3) trailing vortex noise. The first two components are the most significant.
Of the major source areas on the Galaxy, the landing gear/wheel well area produced the largest increase when going from k lean" to ''dirty" configurations. The flaps had a lesser effect, probably due to the rather unusual aerodynamic design. The total effect of going from a ''clean" to a "dirty" configuration on the Galaxy i s 7.4 dB in OASPL and 13.3 PNdB in PNL.
Wing-related noise has a narrower bandwidth than that predicted based on the small aircraft data. This i s the reason for the larger differences in predicted versus actual PNL 's as compared to OASPL's for the 'IC lean" configuration.
Noise data measured at approximately a wing span or greater behaved as i f in the far field, whereas data measured at less distance was inconsistent, and i s probably in the near field.
Some evidence was found to give a partial confirmation of the drop in low-frequency iet noise due to aircraft'forward speed.
1 1
(3 ZCr - 0 s z(3 4
5 0
I F u w
I-
w X
n 0. 0 0 +
9 n 0
P3 0.
cv co N
?
7 u.
8 7
c : n
n -0 0
0
Q 3
L
v
cv 4
co 9 0 0 +
8 c
n m
co p\ CY
O.
7
0.
9 03
C 3 8 n -0 0
0. n N
L
0 v
g d
d
CJ 0. 0
+ G
CO w -
9 0.
9 n cv
2
m v)
cv n
C : n
e
0
h
-0
co 0. 9
v
E 0 7
m 4
0. ch 0
0 +
0 co 0
f 0.
i cv
0 In
c7 0.
Q 3
h
-0 F s 5
7
I m
h
c7 n I N
I 7
c -0 C N
c7 c7 0
d +
0 co 0
0 2 i cv
9 c7
c7 u.
Q 3
h
-0
0. h N
e
6 z -t
cv I
m
12
L cn .- I i? 8
-0 C 0 I) -0 0 e m . v)
U C 0 E 0 I
.- L
L cn I .-
-0 C 0 I) -0 0 e m . v)
U C 0
.- E
I
0 C al
-0 C 3 U
b
- +
E
9 c
cv c
W
- - 2 - al al L 3 C .- s
L cn I .-
-0 C 0 11 -0 0 e m
v)
U C 0 E 0 I
0 C al
-0 C 3 U
.- L
. - +
E
- W
c 9
- d
L 0
d 0) C .- -E
% 0 -1
2
r 0)
I .- f. >"
-0 C 0 11 -0 0 2
m
v)
U .- s E O I
0 C al
-0 C 3 U
L
. - +
5
u) 9
v. *
cv m
6 5 0) C -0 C
.- 4 C .- s
E,
L .- -0
-0 C 0
-0 0
-0
2 m
v) 0 C 0 E
I
0 C al
.-
6 . -
+
E -0 C 3 U
d 2
c) cv - cv co
v) C 0 x Q) C 0) C Lu
- n
.-
5 r" .- U
-0 C 0 I) -0 0 2 m
v) u c 0 E 0 I
0 C al
.- L
. - +
E -0 C 3 U
7
'0 v. 7
c rn 7
L cu N .- - .- n 0 lA
0 C 0 N
I
c
- +
.- 6
5 2 .- -0
U C 0 I) -0 0 2
m . v) U C 0 E 0 I
0 C (u
.- L
. - c
5 -0 C 3
L L
- 7
c
m m
8
L 9) N
I) 0 v,
0 u
.- - .- + - .- + L
3
3 0 -1
-0 C 0 11 D 0 2
m x
I . -0 al Y 0 al n
0 0 cu c
0 0 (x
0 0 9
-0
U I
3
ti x 0 -1
x -0 C 3 0
6
m
3 0 J
-0 C 0 I) -0 0 2
m x
3 . -0 al Y 0 al n
8 9
0 7
8 m
2 z I
al x 0 -1
L
2 9 -0 C
2 -1
-0 C 0 I) -0 0 2
m x
3 . -0 al
Y 0 0, n
0 0 m
u) cv cv
0 u) -
c a I
al x 0 J
x 0
D C
L
L
9
-0 C 0 11 -0 0 2
m
b > x
. -0 al Y
B n
W
-0 c 0 I) -0 0 2 m al I)
0
-0 0)
+
+
E .- + Y)
w
In U .- 5 E 0 I
0 C al
L
- +
E -0 C 3 U
u) m C 3 e
" 3 , " Y
d u) m
.- El + e 11 >
13
I
m < 2 U Q
> Z 0
u n
m
m
- I-
W oi a Lu
!4 0 Z
m
0. &
n d e
0 0 7
e
* m 0 -
"! 0 0 e
7
G e
C 0 P) - V
e
k
n m h 00 I e - v
c m e
00
8 7
"! 0. 0.
0
8 e
'9 0 e e
In
0 0 - 00 9 0.
x c L .- n x 0 - - .- c
t!
P
n
6
0.
0 r; 7
I\
2i -
0
CY 0 - u)
2 -
00
% e
00
8 -
S 0 al - U
e I
m
n m n cy
I m -0 C
(Y
c
Y
n n e h l Y V
.. W
5 Z
14
c u i
Z 5
1 W
W 4
>
n z 0 3
v,
AERODYNAMICALLY CLEAN CASE AT LANDING SPEED, 113m ALTITUDE; 272,000 kg, ATT TYPE AIRCRAFT
(1/3 OCTAVE BAND) 90 r 80
70
60
50
I I I l l I I I I l l 100 200 400 700 1000 2000 4000 7000 10,
FREQUENCY - HZ
FIGURE 1 PREDICTED AERODY NAMlC NOISE SPECTRUM
000
15
WING UNSTEADY BOUNDARY LAYER FLOW AERODYNAMIC FORCES AND OVER THE E N T I R E AIRFRAME
WAKES TRAl LI NG FROM WING, LANDING GEAR, FUSELAGE AND WHEEL WELLS, EMPE N N A G E DOORS
FLOW AROUND
FIGURE 2 AERODYNAMIC NOISE SOURCES
b- 75.6m 4
MAX TAKEOFF GROSS WT - 346,777 kg
FIGURE 3 GALAXY GENERAL ARR,ANGEMENT
17
- n Z Q m
> Q U 0
W
I-
Y 7 Y
I 0 c -
81
0 0 7
0 0 0 I\
0 0 0 d
0 Ch
0 03
'r
FIGURE 5 NOISE MEASUREMENT LOCATION
19
FIGURE 6 GALAXY IN THE TAKEOFF CONFIGURATION
FIGURE 7 GALAXY IN THE LANDING CONFIGURATION
FIGURE 8 GALAXY N THE "CLEAN" CONFIGURATION
21
W
L L
w n e $9 /
I I I I I I I I I I I 0 (u
0 0 0 0 0 h 53 u, co 0 0. 0 7
7 -
22
n Z Q m W > 2 8 /
/ / Q
/ Z
2 LL
/ Z -=f LL
/ /
/ /
/u
0 0 e
0 0 0 d
0 0 0 CJ
0 0 0 7
0 0 I\
N
I
I
g>- d U
Z 3 0 W
W & LL
0 0 cv
0 0 7
0 I\
0 d
23
h n Z Q m W > Q I-
/
0 - c
n n Z
25
W
W I-
O i
W Q (3 (3 Z n Z -
4
4 .
ul a
LL
8
0
z
0 * ni
LI
3 ai I-
Y a ul W E 0 Z
- - W ni 3 (3 LL
24
25
n a Z Q: m
> U 0
W
2
c c v
(3 Z a Z
- 4
. s
26
90
m- < z 80 ? 0
X 0 4
c
70 W
m U
I J w w
W ni
v, v, w ni a
> 60
3
n z 50 0 3
v,
40
(RUN A-1)
I I I I 1 1 1 , 1
FIGURE 14 NARROW BAND SPECTRUM - "CLEAN" CONFIGURATION
I I I I I I I I I I I 1 1 1 1 10 20 40 70 100 200 400 700 1000
FIGURE 18 NARROW BAND SPECTRUM - "DIRTY" CONFIGURATION
31
< E c7 o\
u W
n
I- $’ O Q
Q m
< t
3 3 3 -
0 0 n-
0 0 d
0 0 c.l
0 0 - 0 h
0 *
0 cu
0
N I
I
> V Z 3 CI Lu
W e LL
3 Lu
(3
c W & . v, L
4 LL
Z
- 3 >
32
I
c u i
Z -5
1
94
lo4- 94
-. 84 - - 1 1 1 1 1 1 I 1 , I l I 1 1 1 1
104
94
94
84 -~ I l l l l l l l l l l l l l l l l
-10 -5 0 5 10 TIME - SECONDS
(a) 25 H z
(b) 31.5 H z
( c ) 40 Hz
(d) 50 Hz
(e) 63 Hz
FIGURE 20 AERODYNAMIC NOISE FLYOVER TIME HISTORY (RUN 8-2) (1/3 OCTAVE BAND)
33
104
(9) 100 Hz WING FUNDAMENTAL 104
94
84 .~ 1 1 l 1 1 1 1 1 1 1 1 1 1 1 1 1 1 1
(h) 125 Hz 04
94
84
-10 -5 0 5 10
TIME - SECONDS
FIGURE 20 AERODYNAMIC NOISE FLYOVER TIME HISTORY (CONTINUED) (RUN B-2) (1/3 OCTAVE BAND)
34
FIGURE 20
104
94
I I
84
104
94
84
1141-
104
94
104 rt-
160 H z
200 Hz
250 Hz
( I ) 315 Hz 94w 84
I I I I I I , l l , , , ) , I -1 0 -5 0 5 10
TIME - SECONDS
AERODYNAMIC NOISE FLYOVER TIME HISTORY (CONTINUED) (RUN B-2) (1/3 OCTAVE BAND)
35
? 0
X cu
-
m U I
4 W
W -J
>
n Z 3 0 v)
TIME - SECONDS
FIGURE 20 AERODYNAMIC NOISE FLYOVER TIME HISTORY (CONTINUED) (RUN B-2) (1/3 OCTAVE BAND)
36
? 0
X cu
- Q) L.
W
m U
I
-I Lu
LLI -I
> W ai
1 i I I i i 104 I FAN FUNDAMENTAL
94
84
-10 -5 0 5 10
TIME - SECONDS
FIGURE 20 AERODYNAMIC NOISE FLYOVER TIME HISTORY (CONTINUED) (R,UN B-2) (1/3 OCTAVE BAND)
37
1 .o
.5
.2
. 1
.05
.02
- (UNPUBLISHED LOCKHEED DATA)
.01
I
I I I I I I I I I I I 1 3 4 5 6 7 8 9 1 0 20 30 40 50 .005 I
2 1
I FREQUENCY - H Z I
FIGURE 21 WHEEL WELL DOOR VIBRATION
38
I I I I I I I
I I I
I- I
'\ \
0 0 m
0 0 h(
N
I I
>- s! W 7
3 0 W
LL
0 m
0 h(
39
I I
40
I
70
cu- -5 z 60
? 0
X cu
-
50 m U I
-1 W
W -1
a!
c/1 v, w a! a
> w 40 3
n Z 3 30 0 v,
20
FIGURE 24 NARROW BAND SPECTRUM - TRAILING VORTEX NOISE
41
APPENDIX
Original Noise Prediction Procedure
Empirical aero noise prediction procedures, based on test results of small aircraft and gliders, were developed under a Lockheed-CaIifornia Company/Navy program. These pro- cedures predict the overall level and spectrum shape (as discussed in Ref. 2). The maximum overall sound pressure level (OASPLMax) i s calculated by equation 1.
(VELOCITY4 . WEIGHT CHORD * - PO ) + CONST (1)
SPAN T E M P ~ CL = 10 log (ma4 lo DISTANCE*
OASPL
where CONST = 27.5 for "clean" configuration aircraft and the other variables as defined under input data on the next page.
The spectrum shape i s determined by first calculating the spectrum frequency (f ) at max which maximum noise occurs by equation 2.
- - 1.85 x VELOCITY T f
(ma4
After f(max) has been determined, a ratio (TR; = fi/fmax) is determined for each one- third-octave-band center frequency (fi) . The differences ( ASPLi) between OASPLmax and the one-third-octave-band levels (SPLi) are determined from a generalized empirical curve by entering the curve with successive values of TR; This curve can be plotted from values given in the computer program listing (which follows) by using values of TR (lines 3 and 4) as the abscissa, and corresponding values of DELSPL (lines 5 and 6) as the ordinate.
The noise-predic tion procedure, with subjective noise-evaluation additions, was incorporated into a computer program that was developed for a UNIVAC 1106 computer with an EXEC-8 software system and a FORTRAN V compiler. The program, designated AIRNOY, calculates OASPLmax, PNL, EPNL, and one-third-octave-band spectrum at any specified distance for an observer location directly under the aircraft. Perceived Noise Levels are calculated by the PNLREV subroutine using methods presented in SAE ARP 865-A "Definitions and Procedures for Computing Noise Level of Aircraft Noise. 'I Conversion from PNL to EPNL i s accomplished by using the AIA empirical conversion curve prepared for the AlA/DOT Noise Certification meeting, Nov. 4, 1968. The use of this curve i s provisional, and i t i s used only to obtain a "Ball Park" EPNL evaluation.
The program has the capability of iterating either velocity or weight (or both) over any desired range to calculate successive noise values for the new parameters. For each increment M (above the value l ) , 1000 pounds are added to the aircraft weight, and for each increment N (above the value l ) , 10 knots are added to the velocity.
43
Required input data to the computer program are as follows:
INPUT DATA
FORMAT (2F10.2, 2110) V M W M M N
FORMAT (8F10.2) DI ST WEIGHT C L CHORD SPAN
FORMAT (1F10.2)
T
V M =Velocity multiplier
W M = Weight multiplier
M = Weight cases to be run
N = Velocity cases to be run
DlST = Distance from aircraft to observer - f t
WEIGHT = Weight of aircraft - Ibs
CL = Coefficient of l i f t
CHORD = Avg chord'length - f t SPAN = Wing span - ft VEL = Aircraft velocity - knots
PO = Atmospheric pressure - millibars
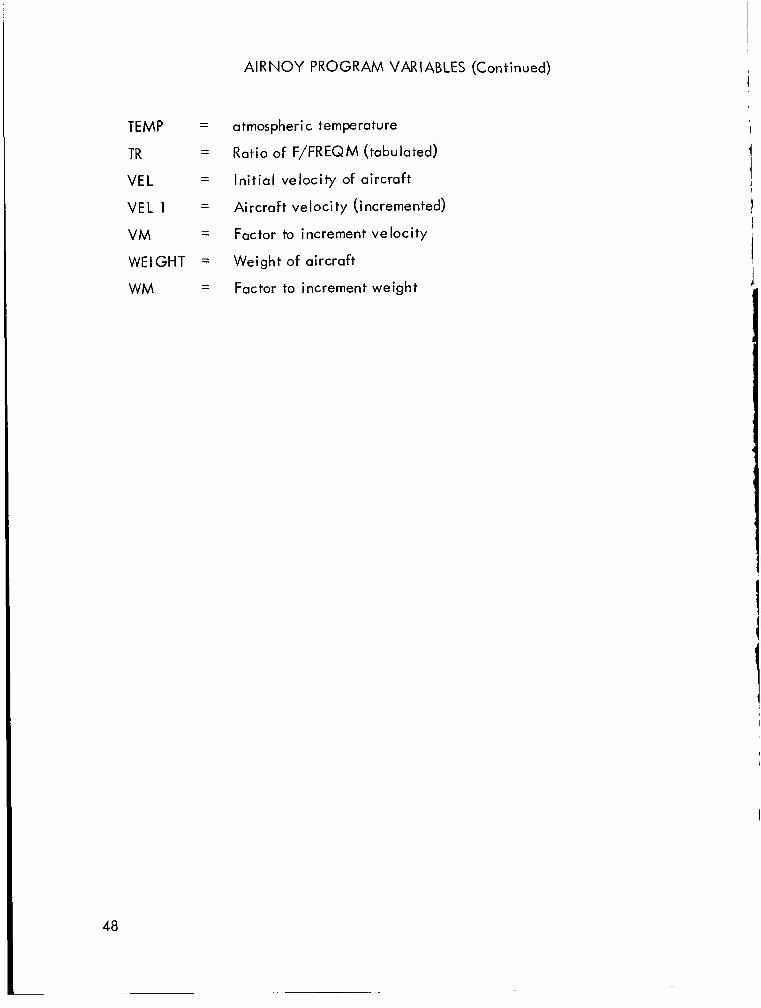
TEMP = Atmospheric temperature - O K
T = Average wing thickness - f t
VEL PO TEMP
I t should be noted that M and N are integers, and a l l other input i s comprised of floating-point numbers: For standard day, sea level conditions, PO = 1040 millibars and TEMP = 294°K. I
i I Following i s a listing of the main computer program, a l i s t of the main program
variables, and the PNLREV subroutine. Also, two pages of output are given. The input data are printed on the first page along with the calculated noise. The second page i s typical of a l l additional pages which give noise levels for the incremented weight or
16 SUMl=SUMl+ANOY IF(SUMl.LT.O.01) GO TO 30 IF(SUM2.LT.0.01) GO TO 3 0 IF(SUM2.GT.SUMl) GO TO 3 0 PN=40.0+33.22*ALOGlO(SUM2+.15*(SUMl-SUM2) )
GO TO 1 0 0 3 0 PNZO.0
100 RETURN END
50
A I R C K A F T AEHODYNAMIC N O I S E
294.U DEGaK - ATMOSPHERIC TEMP, - ATMOSPHERIC PRESSURE = 1 0 4 0 a 0 M I L L I B A R S C O E F F I C I E N T OF L I F T - AVERAGE CHORD LENGTH = 2R.3 F E r T AVERAGE WING T H I C K N E S Y = 2.81 FEILT WING SPAN - D I S T A N C E TO OBSERVER = 300.0 FEILT A I R C R A F T WEIGHT = 6131)OO.O POUNDS A I R C H A F T V E L O C I T Y -
laC3 -
219 .0 FE' -T -
16R.O KNOTS -
96.t) DH - CALCULATED OASPL - FREQUENCY O F M A X . SPL 1 ! 0 . 6 HZ
FREQUFNC Y SPECTRUM (HZ) ( D B )
511.0 63aO R O a O
125 . 0 161 "0 200 .0 25c a 0 315.0 400 e 0 500 a 0 631 . 1) R10.0
IPC0.0 1250.0 1600 0 2 o c o ,0 2 5 0 0 " 0 31c)0 s 0 4nNl.O 5000 a 0 63OO.O R O O 0 a 0 10000.0
l o o a r
83a5 84 .9 85.5 86.2 86.5 86.2 85.!3 85.2 8 4 . 4 03 "2 R ? .9 80.1 7 i . 8 75.b 7 3 us 7G.2 b 7 u 5 64 . 9 til "i)
5 0 . 2 55.1 5 l . l 4 7 . 1 4 3 . 7
P NL . 93.4
EPNL 9 4 . 2
STANDARD PRINTOUT
51
PNL
EPNL
99.4
94.2
OPTIONAL PRINTOUT
52
REF ERE NCES
1 I ' 1 .
2.
3 .
4.
5.
6.
7.
8.
9.
Smith, D. L., et al.: Measurements of the Radiated Noise from Sailplanes. FDL TM-70-3-FDDA, Wright-Patterson AFB, Ohio, 1970.
Gibson, J. S.: The Ultimate Noise Barrier - Far Field Radiated Aerodynamic Noise. Inter Noise 72 Proceedings, p. 332, Washington , D .C . , 1972.
Paterson, R . W., et a l .: Vortex Shedding Noise of an Isolated Airfoi l . United Aircraft Research Laboratories, Technical Report K810867, 1971 . Graham, R . R.: The Silent Flight of Owls. Journal of the Royal Aeronautical Society, Vol. 38, 1934.
Bishop, D. E .: Frequency Spectrum and Time Duration Descriptions of Aircraft F ly-over Noise Signals. FAA DS -67-6,1967.
Eldred, K., Roberts, W. , and White, R. : Structural Vibrations in Space Vehicles, Section II I Aerodynamic Excitation. Northrop Corporation, WADD TR61-62, 1961.
Theisen, J . G ., Haas, J .: Turbulence Upset and Other Studies on Jet Transports. Journal of Aircraft, Vol . 5, No. 4, 1968.
Gibson, J. S.: Non-Engine Aerodynamic Noise: The Limit to Aircraft Noise Reduction. Inter-Noise 73 Proceedings, Copenhagen, 1973.
Blumenthal, V . L., et al.: Aircraft Environmental Problems. AlAA Paper 73-5, Washington, D .C . , 1973.