4 NASICON Materials: Structure and Electrical Properties Lakshmi Vijayan and G. Govindaraj Department of Physics, School of Physical, Chemical and Applied Sciences, Pondicherry University, R. V. Nagar, Kalapet India 1. Introduction Solid electrolytes are one of the functional materials, practically applied in industries because of its high ion conducting property. It provides scientific support for wide variety of advanced electrochemical devices such as fuel cells, batteries, gas separation membranes, chemical sensors and in the last few years, ionic switches. NASICON type ion conductors have been tested widely in energy applications for instance in electric vehicles. High ion conductivity and stability of phosphate units are advantages of NASICON over other electrolyte materials (Hong, 1976). Among the batteries those based on lithium show the best performance. In NASICON frame-work, A x B y (PO 4 ) 3, A is an alkali metal ion and B is a multivalent metal ion. The charge compensating A cations occupy two types of sites, M1 and M2 (1:3 multiplicity), in the interconnected channels formed by corner sharing PO 4 tetrahedra and BO 6 octahedra. M1 sites are surrounded by six oxygens and located at an inversion center and M2 sites are symmetrically distributed around three-fold axis of the structure with ten- fold oxygen coordination. In three-dimensional frame-work of NASICON, numerous ionic substitutions are allowed at various lattice sites. Generally, NASICON structures crystallize in thermally stable rhombohedral symmetry. But, members of A 3 M 2 (PO 4 ) 3 family (where A=Li, Na and M=Cr, Fe) crystallize in monoclinic modification of Fe 2 (SO 4 ) 3 -type structure and show reversible structural phase transitions at high temperatures (d'Yvoire et al.,1983). NASICON based phosphates are widely studied in past decades. But LiTi 2 (PO 4 ) 3 is an interesting system because of its high ion conductivity at room temperature. The Na 3 Cr 2 (PO 4 ) 3 and Li 3 Fe 2 (PO 4 ) 3 are intriguing due to its structural peculiarity. These materials crystallize in structurally unstable phase by conventional synthesis technique. Since, Na 3 Cr 2 (PO 4 ) 3 and Li 3 Fe 2 (PO 4 ) systems are not stable at the room temperature phase, a chemical synthesis technique of solution combustion is explored. In the present work we have achieved a stable phase through solution combustion technique and electrical properties are investigated and results are reported. The LiTi 2 (PO 4 ) 3 and Li 3 Fe 2 (PO 4 ) 3 systems used as electrolytes in solid state batteries and Na 3 Cr 2 (PO 4 ) 3 system used in is sodium sensors. High energy ball milling technique can control the crystallite size through milling duration. In LiTi 2 (PO 4 ) 3 system, milling is performed for various duration to study the effect of crystallite size on electrical conductivity. www.intechopen.com
Transcript
4
NASICON Materials: Structure and Electrical Properties
Lakshmi Vijayan and G. Govindaraj Department of Physics, School of Physical, Chemical and Applied Sciences,
Pondicherry University, R. V. Nagar, Kalapet India
1. Introduction
Solid electrolytes are one of the functional materials, practically applied in industries because of its high ion conducting property. It provides scientific support for wide variety of advanced electrochemical devices such as fuel cells, batteries, gas separation membranes, chemical sensors and in the last few years, ionic switches. NASICON type ion conductors have been tested widely in energy applications for instance in electric vehicles. High ion conductivity and stability of phosphate units are advantages of NASICON over other electrolyte materials (Hong, 1976). Among the batteries those based on lithium show the best performance.
In NASICON frame-work, AxBy(PO4)3, A is an alkali metal ion and B is a multivalent metal ion. The charge compensating A cations occupy two types of sites, M1 and M2 (1:3 multiplicity), in the interconnected channels formed by corner sharing PO4 tetrahedra and BO6 octahedra. M1 sites are surrounded by six oxygens and located at an inversion center and M2 sites are symmetrically distributed around three-fold axis of the structure with ten-fold oxygen coordination. In three-dimensional frame-work of NASICON, numerous ionic substitutions are allowed at various lattice sites. Generally, NASICON structures crystallize in thermally stable rhombohedral symmetry. But, members of A3M2(PO4)3 family (where A=Li, Na and M=Cr, Fe) crystallize in monoclinic modification of Fe2(SO4)3-type structure and show reversible structural phase transitions at high temperatures (d'Yvoire et al.,1983).
NASICON based phosphates are widely studied in past decades. But LiTi2(PO4)3 is an interesting system because of its high ion conductivity at room temperature. The Na3Cr2(PO4)3 and Li3Fe2(PO4)3 are intriguing due to its structural peculiarity. These materials crystallize in structurally unstable phase by conventional synthesis technique. Since, Na3Cr2(PO4)3 and Li3Fe2(PO4) systems are not stable at the room temperature phase, a chemical synthesis technique of solution combustion is explored. In the present work we have achieved a stable phase through solution combustion technique and electrical properties are investigated and results are reported. The LiTi2(PO4)3 and Li3Fe2(PO4)3 systems used as electrolytes in solid state batteries and Na3Cr2(PO4)3 system used in is sodium sensors. High energy ball milling technique can control the crystallite size through milling duration. In LiTi2(PO4)3 system, milling is performed for various duration to study the effect of crystallite size on electrical conductivity.
www.intechopen.com
Polycrystalline Materials – Theoretical and Practical Aspects
78
To overcome the shortcomings in the conventional synthesis of NASICON, high-energy ball milling and solution combustion technique are explored. Correlation between mobile ion conduction and phase symmetry in NASICONs is explored in this study. Present chapter deals with the structure and electrical properties of important family of NASICONs like:
i. LiTi2(PO4)3 and Li1.3Al0.3Ti1.7(PO4)2.9(VO4)0.1 synthesized by high energy ball-milling. ii. A3M2(PO4)3 (A=Li, Na and M=Cr, Fe) synthesised by solution combustion technique.
Characterization techniques like X-ray powder diffraction (XRD), Fourier-transform infrared spectroscopy (FT-IR), thermogravimetry and differential thermal analysis (TG-DTA) etc are exploited for structural confirmation of the synthesized material. Microscopy of the surface is analyzed using scanning electron microscope (SEM) and transmission electron microscope (TEM). UV-vis spectroscopy is used for confirmation of the electronic state of the transition elements and Kramers-Kronig test is performed for confirming the quality of measured electrical parameters. Transport number is measured by Wagner polarization technique. The electrical relaxation parameters are investigated in the frequency range 10Hz-25MHz at different temperatures using broadband dielectric spectrometer. Magnetic behavior of the material is investigated by vibrating sample magnetometer (VSM). In general, complex impedance, admittance, permittivity and modulus forms are used for representation of different electrical parameters. Present chapter uses impedance/dielectric spectroscopy technique for the electrical characterization of mobile ions.
2. Experimental details
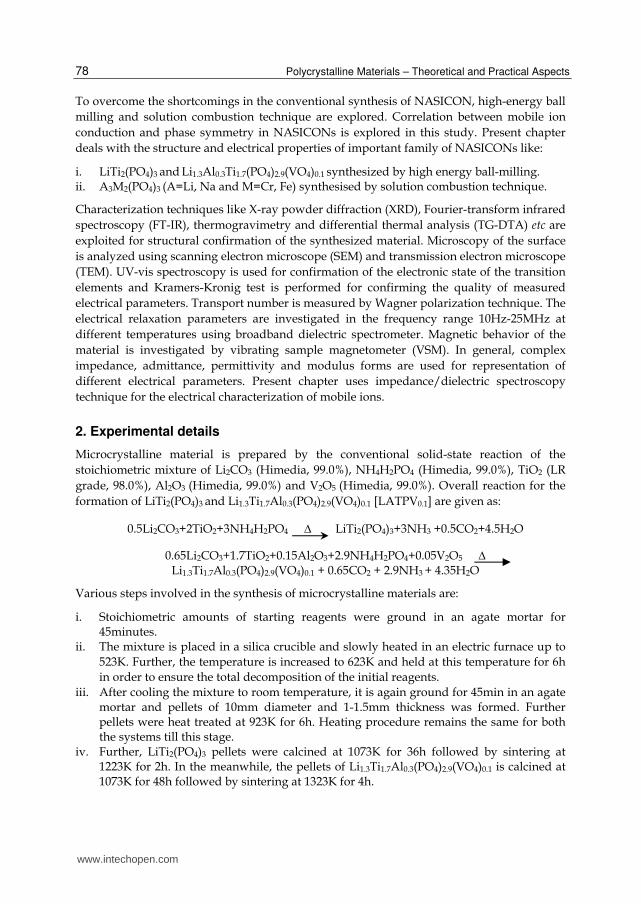
Microcrystalline material is prepared by the conventional solid-state reaction of the stoichiometric mixture of Li2CO3 (Himedia, 99.0%), NH4H2PO4 (Himedia, 99.0%), TiO2 (LR grade, 98.0%), Al2O3 (Himedia, 99.0%) and V2O5 (Himedia, 99.0%). Overall reaction for the formation of LiTi2(PO4)3 and Li1.3Ti1.7Al0.3(PO4)2.9(VO4)0.1 [LATPV0.1] are given as:
Various steps involved in the synthesis of microcrystalline materials are:
i. Stoichiometric amounts of starting reagents were ground in an agate mortar for 45minutes.
ii. The mixture is placed in a silica crucible and slowly heated in an electric furnace up to 523K. Further, the temperature is increased to 623K and held at this temperature for 6h in order to ensure the total decomposition of the initial reagents.
iii. After cooling the mixture to room temperature, it is again ground for 45min in an agate mortar and pellets of 10mm diameter and 1-1.5mm thickness was formed. Further pellets were heat treated at 923K for 6h. Heating procedure remains the same for both the systems till this stage.
iv. Further, LiTi2(PO4)3 pellets were calcined at 1073K for 36h followed by sintering at 1223K for 2h. In the meanwhile, the pellets of Li1.3Ti1.7Al0.3(PO4)2.9(VO4)0.1 is calcined at 1073K for 48h followed by sintering at 1323K for 4h.
www.intechopen.com
NASICON Materials: Structure and Electrical Properties
79
Crystallites of smaller size materials are prepared through conventional solid-state reaction of the ball-milled stoichiometric mixture. The mixture is heated at 623K before ball-milling to remove the gases and water content. This minimizes sticking property of the mixture to the vial and balls. The tungsten carbide vial and balls were used for high energy milling; the typical ball to powder mass ratio is kept at 5:1 throughout the milling. The rotation speed is kept at 300rpm, each cycle comprised of 2h run followed by 30minutes pause, and these cycles were repeated. Milling is carried out in an ethanol medium in case of Li1.3Ti1.7Al0.3(PO4)2.9(VO4)0.1, which acts as a surfactant to decrease the agglomeration and helps to reduce the heat produced while milling. The powder obtained after milling was made into pellets and further heat treatments were applied from 923K to 1223K for LiTi2(PO4)3, and 923K to 1323K for Li1.3Ti1.7Al0.3(PO4)2.9(VO4)0.1 with the same duration as the microcrystalline sample. In this study, material is sintered at a temperature lower than the conventional ceramic route. Even though, the sintering temperature is low, long hours of sintering are performed to obtain the required density for samples. Low temperature sintering is applied to maintain the nanocrystalline nature of the samples.
Self propagating solution combustion synthesis is a rapid and energy saving technique that works on the principle of decomposition of an oxidizer, metal nitrate, in the presence of fuel/complexing agent . The Na3Cr2(PO4)3 using glycine in 1:1fuel ratio (Na3Cr2(PO4)3-G1:1) is prepared from NaNO3 and Cr(NO3)3.9H2O. Stoichiometric amount of the metal nitrates and glycine (NH2-CH2COOH) were mixed with distilled water in 1:1 molar ratio. The NH4H2PO4 dissolved in distilled water is added to this mixture to form homogenous solution. Slow evaporation of the homogenous solution produced thick viscous gel. Further heating resulted in flame, producing voluminous powder named as-prepared material. Over all reaction for the formation of Na3Cr2(PO4)3-G1:1 is calculated as:
In the case of glycine-nitrate combustion, primarily N2, CO2, and H2O were evolved as gaseous products. As-prepared material is in amorphous phase and further heating at 800˚C produced the pure Na3Cr2(PO4)3 phase. To understand the effect of fuel molar ratio on physical and electrical properties; glycine, urea and citric acid were used in 1:1, 1:2 and 1:3 molar ratios for the synthesis of Na3Cr2(PO4)3.
The Fe3+ based NASICON materials were synthesized using citric acid: ethylene glycol mixture (CA:EG). The metal cations were complexed by citric acid (C6H8O7) and pH of the resultant solution is adjusted in the range 7-8 using ammonia solution. This solution is kept under constant stirring and NH4H2PO4 is added to it. After proper stirring, ethylene glycol is added to this solution by maintaining the molar ratio with citric acid at 1:1. The homogenous solution is heated further and the as-prepared material is formed. Further calcination at 800◦C resulted in pure phase. Objective of the present investigation is to synthesize nanocrystalline materials by a unique combination of citric acid (as complexing agent) and ethylene glycol (as polymerizing agent). In the presence of ethylene glycol, esterification (reaction between alcohol and acid) resulted in the formation of gel. The Li3Fe2(PO4)3 is also prepared using glycine in 1:2 molar ratio.
www.intechopen.com
Polycrystalline Materials – Theoretical and Practical Aspects
80
3. Results and discussion
3.1 X-ray powder diffraction analysis
X-ray patterns are not recorded in very low quality; it is collected using Philips X’pert pro-diffractometer with Bragg-Brentano geometry in configuration. The monochromatic Cu-K radiation of wavelength, λ = 1.5406Å is used. The pattern is recorded in the 2 range 5º-75º with step size of 0.02º and the step scan of 0.50 seconds. Figs. 1(a)-(b) show XRD patterns of the microcrystalline and 40h ball-milled LiTi2(PO4)3 sintered at 1073K. Peaks in the diffraction pattern correspond to the rhombohedral phase but, minor phase of TiP2O7 are observed due to Li loss in high temperature sintered material [Aono et al.,19984 & Wong et al., 1998]. Fig.1(c) shows XRD pattern of microcrystalline, 22h and 55h ball-milled Li1.3Ti1.7Al0.3(PO4)2.9(VO4)0.1 material. Lattice parameters are calculated using UNITCELL software (Unit-Cell software,1995), ball-milling decreases lattice parameters and unit cell volume of LiTi2(PO4)3 (Delshad et al., 2009 & Hamzaoui et al., 2003). But, lattice parameters increase for Li1.3Ti1.7Al0.3(PO4)2.9(VO4)0.1 with ball-milling (Prithu et al., 2009) as given in Table 1. The line broadening in XRD pattern occurs due to the simultaneous change in crystallite size and strain effects (Savosta et al., 2004), because high energy ball-milling introduces considerable strain in the material. The strain resulted in broadening the XRD peak and shifting the peak positions towards the higher 2 values.
Fig. 1. X-ray powder diffraction patterns of (a) microcrystalline LiTi2(PO4)3 (b) nanocrystalline LiTi2(PO4)3 (c) Li1.3Ti1.7Al0.3(PO4)2.9(VO4)0.1 microcrystalline, 22h and 55h ball-milled material and (d) Full width at half maximum of maximum intensity peak of microcrystalline, 22h and 55h ball-milled Li1.3Ti1.7Al0.3(PO4)2.9(VO4)0.1.
Williamson and Hall (Williamson & Hall, 1953) developed a model to separate the size and strain effects in broadening the XRD peaks and the model is given by:
Bcos=K/D+4sin (1)
1 0 2 0 3 0 4 0 5 0 6 0 7 0
2 2 h
(c )5 4 h
L i1 .3
T i1 .7
A l0 .3
(P O4)
2 .9(V O
4)
0 .1
Inte
nsi
ty [
a.u
.]
m ic ro c ry s ta ll in e
2
1 0 2 0 3 0 4 0 5 0 6 0 7 02
(50
2)
(410
)
(042
)
(134
)
(131)
(300
) (1
16)
(211
)
(024)
(006)/
(202
)(1
13)
(110
)
(01
2)
(b )
Inte
nsi
ty[a
.u.] n a n o c ry s ta l l in e L T P
24.0 24.5 25.0
M icrocrystalline
FW H M =0.0867
2
(d) 22hrs ball-milled
FW HM =0.0907
55hrs ball-milled
FW HM =0.1336
1 0 2 0 3 0 4 0 5 0 6 0 7 0
(502
)
( a ) m i c r o c r y s t a l l i n e L T P
(410
)
(04
2)(1
34)
(13
1)
(30
0)
(21
1)
(11
6)(0
24)
(006)/
(202)
(113
)
(11
0)
(012
)
Inte
nsi
ty [
a.u]
www.intechopen.com
NASICON Materials: Structure and Electrical Properties
81
where, B is the full width at half maximum (FWHM) of XRD peaks, K is the Scherrer constant, D is the crystallite size, is the wavelength of X-ray, is the micro-strain in the lattice and is the Bragg angle. For Gaussian X-ray profiles, B can be calculated as:
B2=Bm2-Bs2 (2)
where, Bm is the FWHM of the material and Bs is the FWHM of a standard sample; silicon is chosen as the standard for calculation of instrumental parameters. Linear extrapolation of the plot of Bcos vs 4sin gives average crystallite size from the intercept, K/D and the slope gives micro-strain. The strain contribution in Eq. (1) is negligible for the crystallite size calculation of microcrystalline materials. Micro-strain and average crystallite size of LiTi2(PO4)3 and Li1.3Ti1.7Al0.3(PO4)2.9(VO4)0.1 are listed in Table 1.
Ball-milling induces strain in the crystal lattice and decreases the average crystallite size to 70nm for 40h ball-milled LiTi2(PO4)3 material. Milling reduces the average size of crystallites to nanometer range and long hours of ball-milling lead to the formation of an amorphous state (Yamamoto et al., 2004 & Nobuya et al., 2005). Hence, sintering at high temperature after ball-milling resulted in the formation of nanocrystallites instead of microcrystalline material. XRD pattern gradually broadens and the particle size decreases with milling duration, which is clear from the FWHM of highest intensity peaks of ball-milled Li1.3Ti1.7Al0.3(PO4)2.9(VO4)0.1 as given in Fig. 1(d). The nanocrystalline nature of the ball-milled materials is evident from the broadened XRD peak and there is decrease in peak intensity as compared to the microcrystalline material.
Table 1. Average crystallite size, micro-strain and unit cell parameters of microcrystalline and nanocrystalline LiTi2(PO4)3 and Li1.3Ti1.7Al0.3(PO4)2.9(VO4)0.1 materials.
The Na3Cr2(PO4)3 is synthesised using glycine, urea and citric acid in 1:1,1:2 and 1:3 molar ratios by solution combustion technique. The Na3Cr2(PO4)3 synthesized through conventional ceramic route is reported to exhibit two main structural phase transitions at 138ºC and 166ºC, before the stable rhombohedral symmetry is attained at high temperature (d'Yvoire et al.,1983). Fig. 2(a) shows the powder XRD patterns of Na3Cr2(PO4)3-G1:1, Na3Cr2(PO4)3-G1:2 and Na3Cr2(PO4)3-G1:3 pellets sintered at 900ºC. The Na3Cr2(PO4)3, that are synthesised using citric acid in all molar ratios and urea in 1:3 molar ratio, are crystallized in mixed phase. Hence, further studies related to these compositions are not discussed in this chapter.
www.intechopen.com
Polycrystalline Materials – Theoretical and Practical Aspects
82
d’Yvoire et al., reported the monoclinic symmetry (-form) of Na3Cr2(PO4)3, at the room temperature, where, Na+ ions are ordered at M1 site (d'Yvoire et al.,1983). The reversible phase transitions in conventionally synthesized Na3Cr2(PO4)3 are: ↔' at 75˚C; '→at 138˚C and ↔at166˚C. In the high temperature -form of rhombohedral symmetry, Na+ ions are distributed in M1 and M2 sites in the disordered manner. The temperature dependent XRD studies showed that →phase transitions are associated with slight changes in the crystal lattice. Peaks in the DTA curve are not completely separable for '↔ and ↔ transitions, but it forms relatively broad endo or exothermic effect from 120˚C to 178˚C with two maxima. Change of slope in the Arrhenius plot around 75˚C and increase in conductivity about 140˚C are attributed to ↔' and '↔ transitions respectively. The ↔ transition is associated with the decrease in activation energy (d'Yvoire et al., 1983).
Fig. 2. (a) XRD pattern of Na3Cr2(PO4)3 in three glycine molar ratios sintered at 900˚C (b) XRD patterns of Na3Cr2(PO4)3-G1:1 at 30˚C, 85˚C,150˚C and 200˚C (c) Rietveld refinement of Na3Cr2(PO4)3-G1:1 with observed, calculated and difference patterns.
While, nanocrystalline Na3Cr2(PO4)3 synthesized in the present study, is crystallized in thermally stable rhombohedral symmetry (JCPDS reference code: 01-084-1203). The XRD patterns are indexed and all reflections are from the rhombohedral phase. This type of structural modification is common in materials synthesized by the various chemical routes. In order to confirm the structural stability of Na3Cr2(PO4)3, XRD patterns are recorded at 30˚C, 85˚C, 150˚C and 200˚C. High temperature XRD patterns match well with the room temperature pattern and do not show any structural change with the temperature as shown in Fig. 2(b) for Na3Cr2(PO4)3-G1:1. The Rietveld refinement of room temperature XRD pattern of Na3Cr2(PO4)3-G1:1, is performed using GSAS computer package (Toby, 2001 & Larson, 1994) to confirm the crystal system. The Fig. 2(c) shows the Rietveld refinement, where symbol
www.intechopen.com
NASICON Materials: Structure and Electrical Properties
83
shows the experimental data collected in the slow scan mode, calculated and difference patterns are in solid lines with different colours. Refinement is performed based on rhombohedral crystal system in R3c space group. Initially, the parameters like zero shift, FWHM, background, scale factor and pseudo-Voigt coefficient are refined. Then lattice parameters, atomic positions of Cr, P and O are refined in 12c(0,0,z), 18e(x,0,1/4), and 36f(x,y,z) wyckoff positions respectively. Na+ ions are assumed to occupy M1 and M2 sites partially; whose wyckoff positions are 6b(0,0,0) and 18e(x,0,1/4) respectively. The results of Rietveld refinement are given in Table 2. From these results, it is confirmed that in solution combustion synthesised Na3Cr2(PO4)3, Na+ ions are distributed in M1 and M2 sites at the room temperature itself. Hence, this material does not show structural changes with temperature.
Cr 12c 0.0000 0.0000 0.147(2) 1.551 1.000 P 18e 0.291(9) 0.0000 0.2500 2.224 1.000
O (1) 36f 0.181(5) -0.039(7) 0.193(5) 3.479 1.000 O (2) 36f 0.199(3) 0.166(1) 0.0894 1.453 1.000
Table 2. Results of Rietveld refinement of Na3Cr2(PO4)3-G1:1. Atomic and isotropic displacement factors obtained from the refinement are provided below.
Rp =30.51(%), Rwp = 42.33(%), 2 = 3.258
Another member of the NASICON family, that shows structural phase transition is Li3Fe2(PO4)3. The Li3Fe2(PO4)3 synthesised by ceramic route is crystallized in Fe2(SO4)3-type monoclinic symmetry and exhibited reversible structural phase transitions below 350˚C, that are not completely separated (d'Yvoire et al.,1983). Its XRD patterns do not show any modifications due to structural phase transitions, implying the Li+ ion distribution or ordering, rather than ordering of the networks. d’Yvoire et al., and Bykov et al., (Bykov,1990) showed that the monoclinic Li3Fe2(PO4)3 transforms reversibly to the orthorhombic phase upon heating above 270˚C, due to progressive breaking of long-range ordering of Li+ ions in the interstitial space. The Fe2(SO4)3-type phase generally crystallize in two symmetries: (i) orthorhombic (Pcan) of highest symmetry and (ii) primitive monoclinic (P21/n) symmetry (Mineo, 2002).
In the present study, Li3Fe2(PO4)3 is synthesized by solution combustion technique using
different fuels i.e., glycine in 1:2 molar ratio and citric acid: ethylene glycol mixture in 1:1 molar ratio. Both of these Li3Fe2(PO4)3 is crystallized as mixture of monoclinic (P21/n) and orthorhombic (Pcan) symmetry. Due to sintering in air, XRD patterns showed presence of minor phases of LiFeP2O7 that crystallized in monoclinic symmetry. Fig. 3(a) shows XRD patterns of Li3Fe2(PO4)3, sintered at 900˚C, synthesized using glycine. In the Figs. 3(a)-(c), black and red colour indexes are reflections from monoclinic and orthorhombic symmetry respectively. The violet colour index shows reflections due to LiFeP2O7 phase. In contradiction with the conventional synthesis process, solution combustion technique crystallized the material as a mixture of room temperature and high temperature phases. In the high temperature orthorhombic phase, alkali ions distribute disorderly in the available sites; hence the structural phase transitions are absent in the investigated Li3Fe2(PO4)3 material.
www.intechopen.com
Polycrystalline Materials – Theoretical and Practical Aspects
84
Fig. 3. XRD patterns of (a) Li3Fe2(PO4)3-G and (b) Na3Fe2(PO4)3 sintered at 900˚.
The conventionally synthesised Na3Fe2(PO4)3 (d'Yvoire et al.,1983) showed two reversible phase transitions: (i) transition from monoclinic (C2/c) symmetry, ↔ below 368K and (ii) monoclinic to rhombohedral, ↔ at 418K, where, -phase (R3c) is the stable symmetry. The monoclinic symmetry contains two formula units, i.e., Z=2 and in this frame-work, Na+ ions occupy three different sites.
In the present study, Na3Fe2(PO4)3 is synthesized by solution combustion technique using citric acid: ethylene glycol mixture in 1:1 molar ratio. The material is crystallized in monoclinic symmetry of Cc space group without an impurity phase. Fig. 3 shows the room temperature XRD pattern of Na3Fe2(PO4)3 sintered at 910˚C. The high temperature XRD and
DTA studies confirmed the structural stability of solution combustion synthesised Na3Fe2(PO4)3. XRD patterns of Na3Fe2(PO4)3 is recorded at 30˚C, 110˚C, 300˚C and 500˚C. The high temperature XRD patterns match well with the room temperature pattern and do not show any structural change with temperature. Table 3 provides the crystal system and physical parameters of NASICON materials investigated in the present study.
Table 3. The crystal system and physical parameters of NASICON materials
(-211)
(-171
)
(042)
(-3
21)
(-310
)(2
02
)
(-12
2)
(022)
(-11
1)
(011
)
(53
4)
(381)
(136
)
(551
)
(27
3)
(43
4)
(371
)
(-44
2)
(353)
(-115
)
(440)(-
26
0)
(161
)
(-1
24)
(-233
)
(05
2)
(-242
)
(122
)
(-1
30)
(201)
(01
2)
(111
)
L i 3 F e 2 ( P O 4 ) 3 : G
M o n o c l i n i c : P 2 1 / n
O r t h o r h o m b i c : P c a n
L i F e P 2 O 7 : P 2 1 / n
Inte
nsi
ty[a
.u.]
1 0 2 0 3 0 4 0 5 0 6 0 7 0
(-226)
(-754
)
(460)
(-1145)
(-752)
(-316)
(-1022)
(-934)
(-716)
(-553)(602)
(711)
(-444)
(-115)
(-734)
(-731)
(422)
(710)
(004)(-442)
(042)
(-624)
(-711)
(-424)
(600)
(-532)
(312)
(222)
(-404)
(-132)
(-331)
(022)
(130)(-222)
(002)
(-312)
(-311)
(-202)
(-111)
2
(110)
Inte
nsi
ty [
a.u.]
N a3
F e2
( P O4
)3
M o n o c l i n i c : C c
R3c
www.intechopen.com
NASICON Materials: Structure and Electrical Properties
85
3.2 FT-IR analysis
FT-IR is one of the most general spectroscopic techniques used to identify the functional groups in materials. It is an important and popular tool for structural exposition and compound identification. The FT-IR spectra of NASICON materials are dominated by intense, overlapping intramolecular PO43- stretching modes (ν1 and ν3) that range from 1300 to 700cm−1
(Corbridge and Lowe, 1954) . In most of the cases, experimentally measured vibrations are divided into internal and external modes. The internal vibrations consist predominantly of intramolecular stretching and bending motions of the PO43- anions and are usually described in terms of the fundamental vibrations of the free anion (i.e., ν1–ν4). Bands between 650 and 400cm−1 are attributed to the harmonics of deformation of O–P–O angle (ν2 and ν4 modes) (Rao, 2001). Bands in the region 580cm−1 are attributed to the asymmetric bending vibrational modes of O–P–O units (Sayer & Mansingh, 1972). The region 931–870cm-1 is assigned to PO43-
ionic group vibration (Rulmont, 1991). The entire region down to 400cm-1 is dominated by vibrations of PO4 tetrahedra group. Stretching vibrations of P–O–P bond are identified in the region 700-758cm-1 (Alamo & Roy, 1998; Kravchenko et al. 1992; Rougier, 1997). Further, FT-IR spectra show weak peak of carbonates in the region 1400-1600cm-1.
The FT-IR absorption bands of ball-milled Li1.3Ti1.7Al0.3(PO4)2.9(VO4)0.1 in the range 1600cm-1-400cm-1 are shown in Fig. 4. The asymmetric stretching vibration of VO4 tetrahedra is observed at 810-850cm-1 as broad band (Benmokhtar, 2007). In addition, oxygen atom in the VO4 tetrahedra can form bond with Al atom which can lead to some asymmetry. The stretching modes of VO4 in the IR spectra confirm the substitution of vanadium for phosphorus in PO4 tetrahedra.
Fig. 4. FT-IR spectra of WBM and 55h ball-milled Li1.3Ti1.7Al0.3(PO4)2.9(VO4)0.1, Li3Fe2(PO4)3
and Na3Fe2(PO4)3.
The external modes are composed of Li+/Na+, Fe3+, Cr3+, Mg2+, PO43- translations and pseudo-rotations. Separation of internal and external modes is justified as because the intramolecular PO43- vibrations have much larger force constants than the external modes. The Li+ translatory vibrations (Li+ ion “cage modes”) often occur at relatively high frequencies and mix with PO43-
bending modes of identical symmetry (Rulmont, et al. ,1997). In these vibrations, Li+ ions undergo translatory motions in a potential energy environment, that is determined by the nearest neighbour oxygen atoms. Bands in the region 1227-185cm-1 of Na3Cr2(PO4)3 correspond to the interaction of P-O bond and adjacent Cr-O bond (Alamo & Roy, 1986).
www.intechopen.com
Polycrystalline Materials – Theoretical and Practical Aspects
86
3.3 SEM-EDS and TEM analysis
The crystallites in nanocrystalline LiTi2(PO4)3 are agglomerated and its size distribution is not uniform due to dry milling (Puclin,1995). The quantitative chemical analysis is performed through EDS, but it cannot detect elements with atomic number less than four and hence Li metal cannot be detected by this technique. Surface morphology of Li3Ti1.7Al0.3(PO4)2.9(VO4)0.1 material also shows agglomeration of crystallites in the ball-milled samples and the particle size decreases with milling duration as shown in Figs. 5(a)-(c). X-ray mapping is an imaging technique performed using X-ray. This analytical technique provides a high magnification image related to the distribution and relative abundance of elements within a given specimen. This technique is useful for: (i) identifying the location of individual elements and (ii) mapping the spatial distribution of specific elements and phases in the material surface. Figs. 5(d(ii)-(vi)) show X-ray dot mapping of the SEM image of the 55h ball-milled Li1.3Ti1.7Al0.3(PO4)2.9(VO4)0.1 material shown in d(i). Elemental analysis shows peaks corresponding to Ti, Al, P and O elements present in the material. The inset table in Fig. 6(e) give weight and atomic percentage of elements present in 55h ball-milled Li1.3Ti1.7Al0.3(PO4)2.9(VO4)0.1 material. The percentages of elements that are detected by instrument and calculated from molecular formula fall within the error.
Fig. 5. SEMs image of (a) microcrystalline (b) 22h ball-milled and (c) 55h ball-milled Li1.3Ti1.7Al0.3(PO4)2.9(VO4)0.1 d(i) SEM image of 55h ball-milled material and (d(ii)-(vi)) show X-ray mapping of d(i) image and (e) EDS spectrum shows peaks corresponding to the elements present in 55hball-milled material and the inset table give atomic and weight percentage of the elements.
www.intechopen.com
NASICON Materials: Structure and Electrical Properties
87
Figs. 6(a)-(c) are SEM images of sintered pellets of Na3Cr2(PO4)3, synthesized using glycine in different fuel/complexing agent molar ratios. The molar ratios affect product morphology and sinterability. It is evident from SEM images that, the crystallite’s density decreases and agglomeration increases with the molar ratios. The surface morphology reveals that the particles are of submicron size.
Fig. 6. The SEM images of sintered pellet of (a) Na3Cr2(PO4)3-G1:1 (b) Na3Cr2(PO4)3-G1:2 and (c) Na3Cr2(PO4)3-G1:3.
The nanocrystalline nature of the samples is confirmed from TEM images. The Figs. 7(a)-(b) show TEM images of sintered Na3Cr2(PO4)3-G1:1 and Na3Cr2(PO4)3-G1:3 materials. The agglomeration of nanometer sized crystallites is seen in TEM images. Fig. 7(c) is the diffraction pattern of the selected area from the microscopic image of Na3Cr2(PO4)3-G1:3 in Fig. 7(b). Due to strong association, the individually well separated microcrystals are not observable in the TEM images.
Fig. 7. TEM images of 900˚C sintered (a) Na3Cr2(PO4)3-G1:1 (b) Na3Cr2(PO4)3-G1:3 and (c) Diffraction pattern of Na3Cr2(PO4)3-G1:3.
www.intechopen.com
Polycrystalline Materials – Theoretical and Practical Aspects
88
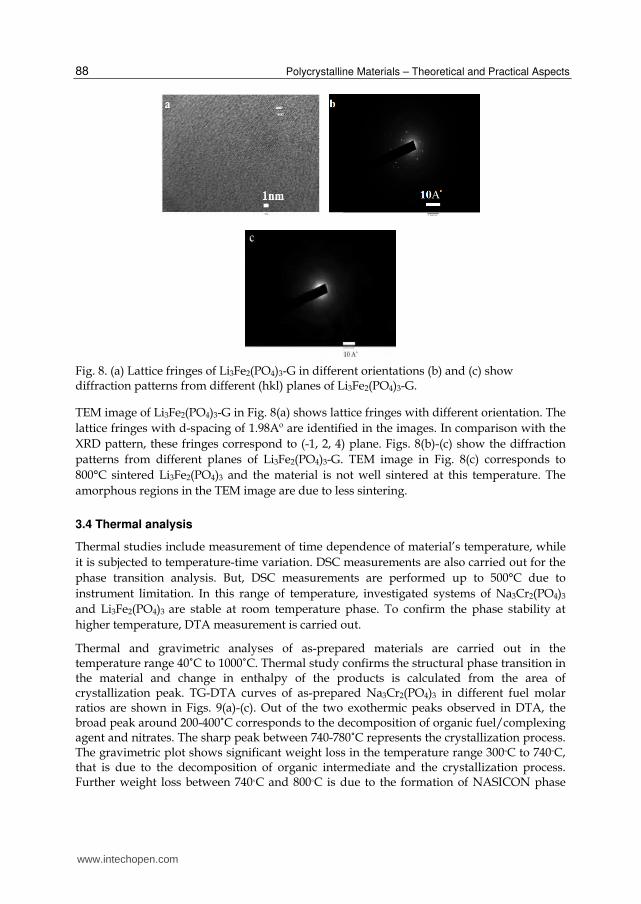
Fig. 8. (a) Lattice fringes of Li3Fe2(PO4)3-G in different orientations (b) and (c) show diffraction patterns from different (hkl) planes of Li3Fe2(PO4)3-G.
TEM image of Li3Fe2(PO4)3-G in Fig. 8(a) shows lattice fringes with different orientation. The lattice fringes with d-spacing of 1.98Aº are identified in the images. In comparison with the XRD pattern, these fringes correspond to (-1, 2, 4) plane. Figs. 8(b)-(c) show the diffraction patterns from different planes of Li3Fe2(PO4)3-G. TEM image in Fig. 8(c) corresponds to 800°C sintered Li3Fe2(PO4)3 and the material is not well sintered at this temperature. The amorphous regions in the TEM image are due to less sintering.
3.4 Thermal analysis
Thermal studies include measurement of time dependence of material’s temperature, while it is subjected to temperature-time variation. DSC measurements are also carried out for the phase transition analysis. But, DSC measurements are performed up to 500°C due to instrument limitation. In this range of temperature, investigated systems of Na3Cr2(PO4)3 and Li3Fe2(PO4)3 are stable at room temperature phase. To confirm the phase stability at higher temperature, DTA measurement is carried out.
Thermal and gravimetric analyses of as-prepared materials are carried out in the temperature range 40˚C to 1000˚C. Thermal study confirms the structural phase transition in the material and change in enthalpy of the products is calculated from the area of crystallization peak. TG-DTA curves of as-prepared Na3Cr2(PO4)3 in different fuel molar ratios are shown in Figs. 9(a)-(c). Out of the two exothermic peaks observed in DTA, the broad peak around 200-400˚C corresponds to the decomposition of organic fuel/complexing agent and nitrates. The sharp peak between 740-780˚C represents the crystallization process. The gravimetric plot shows significant weight loss in the temperature range 300◦C to 740◦C, that is due to the decomposition of organic intermediate and the crystallization process. Further weight loss between 740◦C and 800◦C is due to the formation of NASICON phase
www.intechopen.com
NASICON Materials: Structure and Electrical Properties
89
that is articulated in the DTA plot as sharp exothermic peak. The weight loss curve follows the same path for all materials, but the percentage of weight loss is more for higher molar ratios, due to the presence of more amount of carbonaceous residue. Absence of any additional peaks, in the DTA plot of the as-prepared material, ruled out the possibility of thermodynamical changes due to structural transition.
Fig. 9. Thermal and gravimetric plots of as-prepared (a) Na3Cr2(PO4)3-G1:1 (b) Na3Cr2(PO4)3-G1:2 and (c) Na3Cr2(PO4)3-G1:3.
The surface area and crystallite size are primarily decided by enthalpy or flame temperature of combustion process. The flame temperature depends on the nature of fuel/complexing agent and its molar ratio. Rapid evolution of large volume of gaseous products during combustion process dissipates heat, whereby limits the increase of temperature. This reduces the possibility of premature local partial sintering among the primary particles and helps in limiting the inter-particle contact. The crystallite size is decided mainly by two factors i.e., adiabatic flame temperature and number of moles of gases released during combustion process. These two factors are more for higher fuel/complexing agent molar ratios. Higher values of flame temperature result in the formation of dense agglomerates that are disintegrated by the release of more amounts of gases (Hahn, 1990). The competition between flame temperature and number of moles of gases released decides the crystallite size. Crystallites of Na3Cr2(PO4)3-G1:1 are the smallest among the three fuel/ complexing agent ratios. Table 3 gives variation of crystallite size with molar ratios. In the present study, flame temperature has a major role than the number of moles of gases released, on controlling the crystallite size. DTA curves of Li3Fe2(PO4)3 prepared using different fuels/complexing agents are different due to the difference in the chemical decomposition of organic components. Table 4 provides crystallization temperature of investigated NASICONs obtained from the DTA plot. The crystallization temperature depends on nature of the fuel/complexing agent and its molar ratio.
DTA has been used to confirm the possible reversible structural phase transition in NASICON type materials. Fig. 10 shows the typical heating and cooling curve of Na3Cr2(PO4)3-G1:3 in the temperature range 40˚C to 900˚C (at the rate of 10ºC/minute for both heating and cooling). The heating/cooling curves did not show exothermic/endothermic effect corresponding to phase transitions. This ruled out the possibility of structural phase transitions in Na3Cr2(PO4)3 and Li3Fe2(PO4)3 materials synthesized by solution combustion technique.
0 200 400 600 800 1000-36
-30
-24
-18
-12
-6
0 Na3Cr
2(PO
4)3-G1:1
Temperature [0C]
Hea
t fl
ow
[m
Wg
-1]
84
86
88
90
92
94
96
98
100(a)
89%
93%W
eight
loss
[%
]
0 200 400 600 800 1000
88
90
92
94
96
98
-4
-2
0
Hea
t fl
ow
[W
g-1]
Temperature [0C]
Wei
gh
t lo
ss [
%]
Na3Cr
2(PO
4)3-G1:2(b)
0 200 400 600 800 1000-4
-2
0
Temperature [0C]
Hea
t fl
ow
[ W
g-1
]
84
86
88
90
92
94
96
98
100
(c) Na
3Cr
2(PO
4)3-G1:3
87%
91%
Wei
ght
loss
[%
]
www.intechopen.com
Polycrystalline Materials – Theoretical and Practical Aspects
Table 4. Crystallization temperatures obtained from the DTA plot.
Fig. 10. Thermal analysis of as-prepared Na3Cr2(PO4)3-G1:3 (both heating and cooling curve).
3.5 Ultraviolet and visible absorption spectroscopy analysis
UV-vis spectroscopy is a tool for identifying valency (electronic) state of transition metals. The transition metals like Fe and Cr show variable valencies and can co-ordinate tetrahedrally and octahedrally. Each co-ordination state produces its own set of characteristic absorption bands in the visible and near UV range. These characteristic absorption bands are used to find skeleton co-valency of the material, which is related to the electronic contribution.
The UV-vis spectra of Na3Cr2(PO4)3 in three different glycine molar ratios has two absorption peaks as shown in Fig. 11(a). The 3d3 configuration of Cr3+ has a 4F fundamental state with 4P as the first excited state. The spin allowed transitions appeared at 670, 468 and 300nm are: 1:
4A2g(F)→4T2g(F), 2:4A2g(F)→4T1g(F), 3:
4A2g(F)→4T1g(P). Out of these three bands,3 band appears occasionally [Stalhandske, 2000]. In Na3Cr2(PO4)3 material, Cr3+ does not show variable valency state and its contribution to the electronic part is negligible. The Fe3+ ions reveal absorption bands in the visible and near UV range. Both Fe2+ and Fe3+ ions can exist in tetrahedral and octahedral sites, and majority of Fe3+ ions are believed to occupy the tetrahedral network. The double absorption band at 340 and 380nm may be attributed to 4D5 for ferric ion in tetrahedral state and absorption at 440nm is due to 4G5 for ferric ion mostly in
www.intechopen.com
NASICON Materials: Structure and Electrical Properties
91
tetrahedral form. In addition to that, the absorption band at 560-580nm may be due to the presence of ferric ion in octahedral site (ElBatal et al., 1988; Bates & Mackenzie, 1962; Kurkjian & Sigety, 1968; Steele & Douglas, 1965; Edwards & Paul, 1972). The absorption band at 410-420nm of transition, 3F2→3P4, is related to the ferric ion in octahedral symmetry. Li3Fe2(PO4)3-CA:EG, Li3Fe2(PO4)3-G and Na3Fe2(PO4)3-CA:EG show absorption bands in the region of 420nm, 550nm and 720nm as in Fig. 11(b). These absorption peaks correspond to Fe3+ ions in octahedral state, this ruled out the presence of Fe2+ ions in the material. The present study concluded that, the dominating contribution to the total conductivity is from ions and the electronic part is negligible. The broad band in the region 200–400nm is due to the phosphate group and its location is independent of the nature of the cation.
Fig. 11. UV-vis spectrum of (a) Na3Cr2(PO4)3-G1:1, G1:2 and G1:3 and (b) Li3Fe2(PO4)3-G, Li3Fe2(PO4)3-CA:EG and Na3Fe2(PO4)3.
3.6 Wagner polarization technique
The NASICON materials investigated in the present study contain transition elements like Cr and Fe. Due to the presence of variable valency states, these elements may contribute to the electronic part in the total conductivity. The electronic contribution is determined quantitatively by transport number measurement through Wagner polarization technique. The transport number is calculated from the instantaneous and steady state values of current obtained by dc polarization technique. The transport number of investigated materials in the present study is found to be approximately equal to one. Hence, the contribution of electronic part to total conductivity is negligibly small and this corroborates the results from VSM data.
3.7 K-K transformations
To validate the electrical microstructure of the material, like grain, grain-boundary and other external parameters such as electrode polarization, ac electrical parameters are plotted in the complex impedance formalism. Kramers–Kronig (K–K) relation is used to evaluate the quality of the measured impedance data. The K-K relations are true for complex impedance spectroscopic data that are linear, causal, and stable. Fig. 12(a) shows K-K fit to Na3Cr2(PO4)3-G1:3 at different temperatures and (b) shows K-K fit to Na3Cr2(PO4)3 in different glycine molar ratios at 393K. All these fits match well with the experimental data, implying good quality of the measured data. Kramers-Kronig fit to the complex impedance data is achieved through the software K-K test. Solid line shows K-K fit to the experimental data at different temperatures.
www.intechopen.com
Polycrystalline Materials – Theoretical and Practical Aspects
92
Fig. 12. (a) K-K fit to Na3Cr2(PO4)3-G1:3 at different temperatures and (b) K-K fit to Na3Cr2(PO4)3 in three glycine molar ratios at 393K.
3.8 Vibrating sample magnetometer analysis
In the present study, magnetization of NASICON materials are recorded over a range of field, using VSM at room temperature. Electronic contribution to the total conducivity is related to the co-existence of different electronic states. Generally, exchange interaction between equal valence ions is antiferromagnetic and interaction between ions with different valence states like Fe3+ (3d5) and Fe2+ (3d6) is ferromagnetic (Takano, 1981; Li, 1997). VSM measurement of the investigated NASICON materials as in Fig.13 show antiferromagnetic behaviour. This indicates that, the contribution to electronic conductivity is negligible in these materials.
Fig. 13. Magnetization versus applied magnetic field at room temperature for Na3Cr2(PO4)3,Na3Fe2(PO4)3, Li3Fe2(PO4)3- EG:CA and Li3Fe2(PO4)3- G.
0 7 140
7
14(b)
Z'()x104[]
-Z"()x
104[]
393K
Na3Cr
2(PO
4)
3-G1:1
Na3Cr
2(PO
4)
3-G1:2
Na3Cr
2(PO
4)
3-G1:3
K-Kfit
0 5 100
5
10
Na3Cr
2(PO
4)
3-G1:3
-Z"()x
10
3[]
Z'()x103[]
513K
473K
423K
K-K fit
(a)
www.intechopen.com
NASICON Materials: Structure and Electrical Properties
93
4. Impedance spectroscopy analysis
The real part, Z’() and the imaginary part, Z”() of the complex impedance, Z*()= Z’()-iZ”() are calculated from the measured G and C values as:
Z’()= G/(G2+C22) (3)
Z”()=C/(G2+C22) (4)
where, f, f being the frequency in Hertz.
Fig. 14. The complex impedance spectra of (a) microcrystalline LiTi2(PO4)3 at 368K and (b) nanocrystalline LiTi2(PO4)3 at 348K. Inset of Fig. 14(a) and (b) shows grain part of the corresponding equivalent circuit and the continuous line is the simulation result.
The elements of an equivalent circuit model represent various (macroscopic) processes involved in the transport of mass and charge. Using NLLS techniques, all the parameters in the equivalent circuit are adjusted simultaneously, thus obtaining the optimum fit to the measured dispersion data. A more general NLLS-fit program based on the Marquardt algorithm has been used. The impedance parameters are obtained by fitting the data to an equivalent circuit using NLLS fitting procedure due to Boukamp [Boukamp, 1989; Mariappan & G. Govindaraj, 2004 & 2006).
Figs. 14 (a) and (b) show the complex impedance plane plot of microcrystalline LiTi2(PO4)3 material at 368K and nanocrystalline LiTi2(PO4)3 material at 348K. For both of these materials equivalent circuit model is the same throughout the temperature range from 309K to 388K. Equivalent circuit model consists of two depressed semi-circles, where the high frequency semi-circle is displaced from the origin. Since, the high frequency semi-circle is impeded by the low frequency one and effectively only one semi-circle can be visible in the complex impedance plane plot. The ratio of grain capacitance to the grain-boundary capacitance should be less than 10-3 for the appearance of two separate semi-circles in the complex impedance plane plot (Barsoukov & Macdonald, 2005; Mariappan & Govindaraj, 2005). Inset of Figs. 14(a) and (b) show the high frequency part in the complex impedance plane plot, where continuous line is the simulation result. Simulation clearly shows the grain semi-circle, which is not seen explicitly in the complex impedance representation of the equivalent circuit.
0 2 4
0
2
4microcrystalline
LiTi2(PO
4)
3
1 2 3 4
1
2
3
4 Simulation
experimental data
Z'()x103[]
-Z
"()x
10
3[]
368 K
Rc(R
gQ
g)(R
gbQ
gb)
Z'()x105[]
-Z
"()x
10
5[]
(a)
0 2 4 6 8 10
0
2
4
6
8
10
nanocrystalline LiTi2(PO
4)3
1.5 3.0 4.5 6.0
1.5
3.0
4.5
6.0 experimental data
simulation
-Z"()x
103[]
Z'()x103[ ]
(b)
348 K
Rc(R
gQ
g)(R
gbQ
gb)
Z'()x105[]
-Z
"()x
10
5[]
www.intechopen.com
Polycrystalline Materials – Theoretical and Practical Aspects
94
The impedance plane plots are depressed due to the distribution of relaxation times; a non-ideal capacitor or the CPE, Q, is used to explain the depressed semi-circle (Lakshmi et al., 2011,2011) Equivalent circuit of the impedance plane plots obtained using the Boukamp equivalent circuit analysis is found to be Rc(RgQg)(RgbQgb). Resistance of the electrolyte-electrode contact is Rc, which is characterized by the shift of the impedance arc from the origin. Constant phase elements, Qg and Qgb represent the grain and grain-boundary property of the sample. Grain resistance, Rg and the grain-boundary resistance, Rgb of the sample are obtained by right and left intercepts of the semi-circles with the real axis. Rg and Rgb are used to calculate the corresponding grain conductivity, dcg and grain-boundary conductivity, dcgb. The obtained equivalent circuit is the same for both the LiTi2(PO4)3 samples, but with the different magnitudes of circuit parameters.
For both the samples, Rc variation is not consistent with temperature, Rg and Rgb of both the samples decrease with increase in temperature, Qgb values increases with temperature, while, Qg decreases. The grain conductivity at 309K (dcg309K1.82x10-6Scm-1) of the microcrystalline material is consistent with the reported room temperature value of 10-7Scm-
1 (Palani Balaya, 2006). At 388K, grain conductivity (dcg388K=8.57x10⁻⁴Scm-1) of nanocrystalline material shows an order of magnitude jump (Lakshmi et al, 2009, 2011) compared to the microcrystalline material (dcg388K=7.74x10⁻⁵Scm-1). This significant increase in the grain conduction resulted from the reduced crystallite size. High energy ball-milling introduces grain-boundaries in the material and its volume fraction is more in nanocrystalline material. The diffusion through grain-boundaries is much faster than the grain diffusion; hence large volume fractions of grain-boundaries play a dominant role in the ion conduction (Schoonman, 2003).
Figs. 15(a) and (b) show Arrhenius plot of grain and grain-boundary conductivity of the microcrystalline and nanocrystalline LiTi2(PO4)3 material. The Arrhenius equation is given by:
dc0exp/k(5)
where, dcis the dc conductivity, 0 is the pre-exponential factor, T is the temperature in Kelvin, is the activation energy for dc conduction and k is the Boltzmann’s constant.
Fig. 15. Arrhenius plot of (a) grain and (b) grain-boundary conductivity of microcrystalline and nanocrystalline LiTi2(PO4)3 material. Solid line represents best fit to the Eq. (5).
2.4 2.6 2.8 3.0 3.2 3.410
-4
10-3
10-2
10-1
100
(a)Microcrystalline LTP
Nanocrystalline LTP
dcg
T(S
cm-1
K)
1000/T(K-1)
2.4 2.6 2.8 3.0 3.2
10-5
10-4
(b)
nanocrystalline LTP
Microcrystalline LTP
dcg
bT
(S
cm-1K
)
1000/T(K-1)
www.intechopen.com
NASICON Materials: Structure and Electrical Properties
95
From the slope of the Arrhenius plots, grain and grain-boundary activation energies g and gb are calculated and are shown in Table 5. Increase in the grain conductivity of nanocrystalline material is due to the feasible conduction through grain-boundaries as its activation energy for grain-boundary conduction is less compared to the grain conduction (Mouahid, 2001). Even though the ball-milling decreases the crystallite size, its distribution is not uniform due to dry milling. The non-uniform size distribution and agglomeration are the causes of higher activation energy in nanocrystalline LiTi2(PO4)3 material, in spite of its higher conductivity (Lakshmi et. al, 2009, 2011). These agglomerated crystallites are seen clearly in SEM images. Table 6 provides the charge carrier concentration, nc, of microcrystalline and nanocrystalline LiTi2(PO4)3 material, which authenticate that the ball-milling does not increase the carrier concentration.
LiTi2(PO4)3
Activation energy for conduction through [eV]
Grain conductivity,[Scm-1]
Grain, Eg Grain-boundary, Egb dcg at dcgb at Microcrystalline (0.54±0.02) (0.34±0.02) 2.34x10⁻⁶ 7.74x10⁻⁵
Table 5. Activation energies and dc conductivity values of microcrystalline and nanocrystalline LiTi2(PO4)3 materials.
Fig. 16. Complex impedance spectra of (a) microcrystalline (b) 22h and (c) 55h ball-milled Li1.3Ti1.7Al0.3(PO4)2.9(VO4)0.1 material at 95ºC. In Fig. 16(c) inset shows simulation to the grain semi-circle.
The impedance plane plots of Li1.3Ti1.7Al0.3(PO4)2.9(VO4)0.1 material shows obvious indication of blocking effect at the grain-boundaries and at the electrode-sample interface. Figs. 15(a)-(c) show impedance plots of microcrystalline and ball-milled materials. Equivalent circuit consists of series combination of a semi-circle associated to grain-boundary contribution and spike characterizing the electrode disparity at the low frequency part. The equivalent circuit representation is (RgbQgbCgb) up to 85°C and at higher temperatures it becomes (RgbQgb)(QeCe) for the microcrystalline material. In the case of 22h ball-milled material, the equivalent circuit representation is (RgbQgb)(QeCe) in the whole temperature range. Impedance plane plots of 55h ball-milled material show overlapped semicircles; in which the high frequency arc is attributed to the grain contribution.
Inset of Fig. 16(c) shows the high frequency part in the complex impedance plane plot where continuous line is the simulation result. Simulation clearly shows the grain semi-circle,
0 1 2 3 4
0
1
2
3
4
Li1.3
Ti1.7
Al0.3
(PO4)2.9
(VO4)0.1
0 2 4 6 8 10
0
2
4
6
8
10
-Z
"()x
10
2[]
-Z'()x102[]
experimental data
simulation
55h
95°C
NLLS fit
(RgQg)(RgbQgb)Qe
-Z
"()x
10
5[]
Z'()x105[]
(C)
0 2 4 6 8 10 12
0
2
4
6
8
10
12
Li1.3
Ti1.7
Al0.3
(PO4)
2.9(VO
4)
0.1
Z'()x105 []
(a)
(Rgb
Qgb
Cgb
)(QeC
e)
-Z
"()x
10
5 [] 95°C
NLLS fit
microcrystalline
0.0 0.5 1.0 1.5 2.0
0.0
0.5
1.0
1.5
2.0
Li1.3
Ti1.7
Al0.3
(PO4)
2.9(VO
4)
0.1
95°C
NLLS fit
Z'()x105[]
-Z
"()x
10
5 [] (b) 22h (R
gbQ
gbC
gb)(Q
eC
e)
www.intechopen.com
Polycrystalline Materials – Theoretical and Practical Aspects
96
which is not seen explicitly in the complex impedance plane representation. The high frequency studies are requisite to obtain the grain contribution of microcrystalline and 22h ball-milled material. Mechanical milling changes the capacitive contribution in such a way that in 55h ball-milled material, grain contribution is substantial within the frequency window (Lakshmi et al, 2009, 2011). Mechanical milling decreases the difference between the grain and grain-boundary capacitance values; which indicates relatively good connectivity between the grains.
Table 6. Carrier concentartion of microcrystalline and nanocrystalline LiTi2(PO4)3 materials over the temperature range 308K to 398K.
Table 7 provides the dc conductivity values and activation energies of microcrystalline and ball-milled Li1.3Ti1.7Al0.3(PO4)2.9(VO4)0.1 materials. Grain-boundary conductivity of 55h ball-milled material at 65ºC illustrates an order of magnitude increase in comparison to the microcrystalline counterpart. High frequency investigation is needed to explore the grain characteristics of the microcrystalline and 22h ball-milled material. Micro-strain induced by the milling creates defects like grain-boundaries and its volume fraction is much more in ball-milled samples. Ions can diffuse faster through grain-boundaries and it is reflected in the observed jump in the conductivity in the 55h ball-milled material (Lakshmi et al, 2009, 2011).The ease of ion diffusion through grain-boundary is reflected in the values of activation energy as given in Table 7. With the milling duration activation energy decreases since the ion diffusion become easier as the volume fraction of the grain-boundaries increases.
Table 7. Conductivity and activation energy of the grain-boundary and grain conduction in microcrystalline and ball-milled Li1.3Ti1.7Al0.3(PO4)2.9(VO4)0.1 materials.
www.intechopen.com
NASICON Materials: Structure and Electrical Properties
97
The spectroscopic plot of real part of the complex permittivity, *() of Li1.3Ti1.7Al0.3(PO4)2.9(VO4)0.1 shows relaxation at the high frequency. This results from the constriction effect at the grain-boundaries (Mouahid et al., 2001) and is explicit in the impedance representation. This relaxation is prominent in the samples milled for longer times since the grain-boundaries are more significant in those samples (Martin et al., 2006). The ' of Li1.3Ti1.7Al0.3(PO4)2.9(VO4)0.1 material shows a prominent increase at low frequency which is associated with charges accumulating at the blocking electrode. Permittivity loss in the 55h ball-milled material shows an order of magnitude increase in comparison to the microcrystalline material and the augmented permittivity loss may be due to the ease of diffusion through the grain-boundaries that is reflected in the total conductivity hike of the 55h ball-milled material.
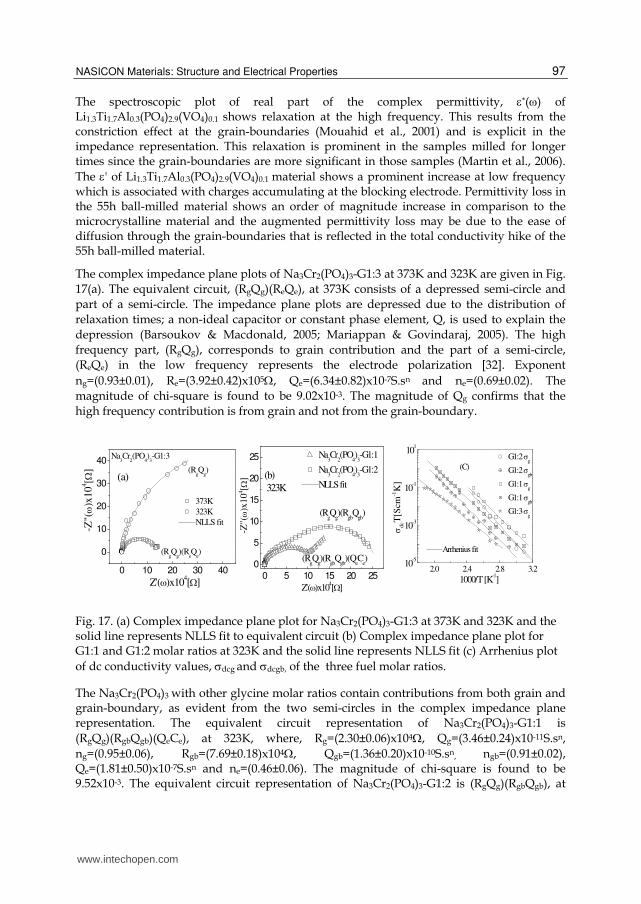
The complex impedance plane plots of Na3Cr2(PO4)3-G1:3 at 373K and 323K are given in Fig. 17(a). The equivalent circuit, (RgQg)(ReQe), at 373K consists of a depressed semi-circle and part of a semi-circle. The impedance plane plots are depressed due to the distribution of relaxation times; a non-ideal capacitor or constant phase element, Q, is used to explain the depression (Barsoukov & Macdonald, 2005; Mariappan & Govindaraj, 2005). The high frequency part, (RgQg), corresponds to grain contribution and the part of a semi-circle, (ReQe) in the low frequency represents the electrode polarization [32]. Exponent ng=(0.93±0.01), Re=(3.92±0.42)x105, Qe=(6.34±0.82)x10-7S.sn and ne=(0.69±0.02). The magnitude of chi-square is found to be 9.02x10⁻³. The magnitude of Qg confirms that the high frequency contribution is from grain and not from the grain-boundary.
Fig. 17. (a) Complex impedance plane plot for Na3Cr2(PO4)3-G1:3 at 373K and 323K and the solid line represents NLLS fit to equivalent circuit (b) Complex impedance plane plot for G1:1 and G1:2 molar ratios at 323K and the solid line represents NLLS fit (c) Arrhenius plot of dc conductivity values, dcg and dcgb, of the three fuel molar ratios.
The Na3Cr2(PO4)3 with other glycine molar ratios contain contributions from both grain and grain-boundary, as evident from the two semi-circles in the complex impedance plane representation. The equivalent circuit representation of Na3Cr2(PO4)3-G1:1 is (RgQg)(RgbQgb)(QeCe), at 323K, where, Rg=(2.30±0.06)x104, Qg=(3.46±0.24)x10-11S.sn, ng=(0.95±0.06), Rgb=(7.69±0.18)x104, Qgb=(1.36±0.20)x10-10S.sn, ngb=(0.91±0.02), Qe=(1.81±0.50)x10-7S.sn and ne=(0.46±0.06). The magnitude of chi-square is found to be 9.52x10⁻³. The equivalent circuit representation of Na3Cr2(PO4)3-G1:2 is (RgQg)(RgbQgb), at
2.0 2.4 2.8 3.210
-5
10-3
10-1
101
Arrhenius fit
dcT
[Scm
-1K
]
1000/T [K-1]
G1:2 g
G1:2 gb
G1:1 g
G1:1 gb
G1:3 g
(C)
0 5 10 15 20 25
0
5
10
15
20
25
(RgQ
g)(R
gbQ
gb)(Q
eC
e)
(RgQ
g)(R
gbQ
gb)
(b)
323K
-Z
"()x
10
4[]
Z'()x104[]
Na3Cr
2(PO
4)3-G1:1
Na3Cr
2(PO
4)3-G1:2
NLLS fit
0 10 20 30 40
0
10
20
30
40(R
gQ
g)
(a)
(RgQ
g)(R
eQ
e)
-Z
"()x
10
4[]
Z'()x104[]
373K
323K
NLLS fit
Na3Cr
2(PO
4)3-G1:3
www.intechopen.com
Polycrystalline Materials – Theoretical and Practical Aspects
98
323K where, Rg=(2.16±0.05)x104, Qg=(3.39±0.10)x10-11S.sn, ng=(0.95±0.05), Rgb=(1.12±0.53)x105, Qgb=(5.26±0.18)x10-10S.sn and ngb=(0.82±0.03). The magnitude of chi-square is found to be 9.78x10⁻³. In these cases, grain and grain-boundary contributions are distinguished by the magnitude of constant phase element; for grain contribution, Qg, value is in the range 10-12-10-11S.sn, for grain-boundary, Qgb, value is around 10-10-10-9S.sn. For electrode contribution, Qe, takes the value in the range of 10-7-10-6S.sn.
The Rg and Rgb values are obtained by intercept of high frequency and low frequency semi-circles with the real axis and are used to calculate the dc conductivity values, dcg and dcgb
using the cell constant. The parameters, dcg and dcgb are thermally activated and show Arrhenius dependence on temperature. The dc conductivity values and the activation energy, obtained from the slope of Arrhenius plot, are given in Table 8. Complex impedance plane plots for 1:1 and 1:2 glycine fuel molar ratios at 323K are shown in Fig. 17(b) and the solid line represents NLLS fit to the equivalent circuit. The highest dc conductivity value, (2.35±0.25)x10-
6Scm-1 at 323K, is obtained for Na3Cr2(PO4)3-G1:1 among the different glycine molar ratios. This magnitude is one order higher than the reported value, 1.1x10⁻⁷Scm-1, for conventionally synthesized Na3Cr2(PO4)3 (d'Yvoire et al.,1983.) The increase in the conductivity of Na3Cr2(PO4)3-G1:1 is explained through its dense sintering (Lakshmi et al., 2011,2011) (93.25% of theoretical density) and the smallest crystallite size, (31.29±3.91)nm, among the series (Lakshmi et al., 2011,2011). The present study evidenced that the grain and grain-boundary conductivity values decreases with fuel/complexing agent ratio in glycine assisted synthesis. Arrhenius plot of dc conductivity values, dcg and dcgb, for three glycine molar ratios are shown in Fig. 17(c). Agglomeration increases with fuel molar ratio, due to hike in the flame temperature. Agglomeration decreases the density owing to less packing of larger crystallites, which affects the electrical properties adversely. This study concluded that, the fuel molar ratio play a major role in deciding the physical and electrical properties and 1:1 fuel molar ratio is found to be the optimized value to obtain the highest electrical conductivity.
Table 8. The dc conductivity values and activation energy of Na3Cr2(PO4)3 synthesized using different fuels/complexing agents.
Fig. 18(a) shows the complex impedance plot of Na3Cr2(PO4)3-U1:1 and Na3Cr2(PO4)3-U1:2 at 383K. In urea assisted Na3Cr2(PO4)3 series, 1:2 molar ratio showed improved conductivity due to less activation energy compared to 1:1 molar ratio, as shown in Fig. 18(b). Among the different fuels used, Na3Cr2(PO4)3-U1:2 showed the highest conductivity due to lower grain-boundary activation energy of (0.73±0.02)eV. The volume fraction of grain-boundary is more in nanocrystalline materials and it enhances the diffusion of ions. Table 8 gives dc conductivity and activation energy values of Na3Cr2(PO4)3 synthesized using different fuels.
www.intechopen.com
NASICON Materials: Structure and Electrical Properties
99
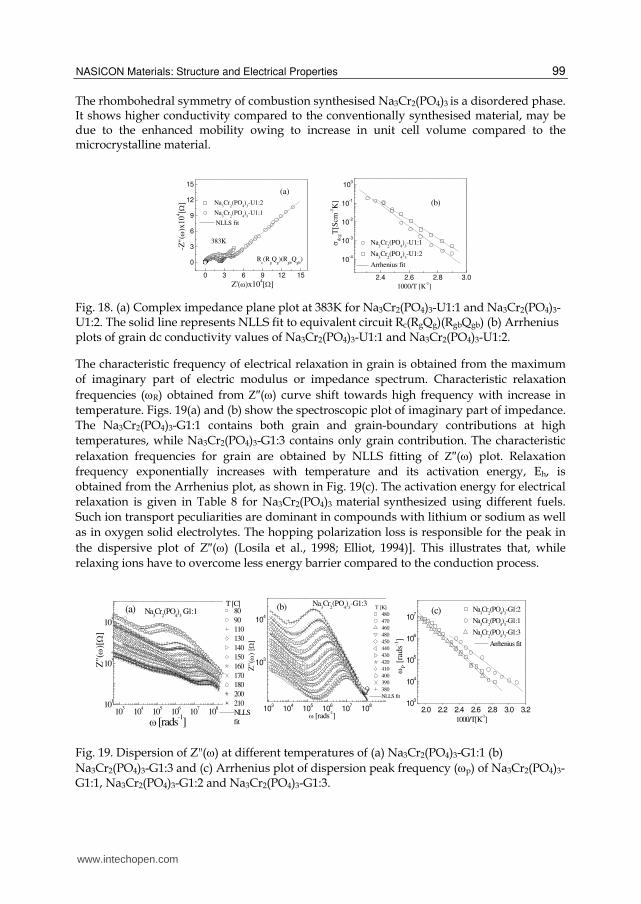
The rhombohedral symmetry of combustion synthesised Na3Cr2(PO4)3 is a disordered phase. It shows higher conductivity compared to the conventionally synthesised material, may be due to the enhanced mobility owing to increase in unit cell volume compared to the microcrystalline material.
Fig. 18. (a) Complex impedance plane plot at 383K for Na3Cr2(PO4)3-U1:1 and Na3Cr2(PO4)3-U1:2. The solid line represents NLLS fit to equivalent circuit Rc(RgQg)(RgbQgb) (b) Arrhenius plots of grain dc conductivity values of Na3Cr2(PO4)3-U1:1 and Na3Cr2(PO4)3-U1:2.
The characteristic frequency of electrical relaxation in grain is obtained from the maximum of imaginary part of electric modulus or impedance spectrum. Characteristic relaxation frequencies (R) obtained from ″() curve shift towards high frequency with increase in temperature. Figs. 19(a) and (b) show the spectroscopic plot of imaginary part of impedance. The Na3Cr2(PO4)3-G1:1 contains both grain and grain-boundary contributions at high temperatures, while Na3Cr2(PO4)3-G1:3 contains only grain contribution. The characteristic relaxation frequencies for grain are obtained by NLLS fitting of ″() plot. Relaxation frequency exponentially increases with temperature and its activation energy, Eh, is obtained from the Arrhenius plot, as shown in Fig. 19(c). The activation energy for electrical relaxation is given in Table 8 for Na3Cr2(PO4)3 material synthesized using different fuels. Such ion transport peculiarities are dominant in compounds with lithium or sodium as well as in oxygen solid electrolytes. The hopping polarization loss is responsible for the peak in the dispersive plot of Z″() (Losila et al., 1998; Elliot, 1994)]. This illustrates that, while relaxing ions have to overcome less energy barrier compared to the conduction process.
Fig. 19. Dispersion of Z"() at different temperatures of (a) Na3Cr2(PO4)3-G1:1 (b) Na3Cr2(PO4)3-G1:3 and (c) Arrhenius plot of dispersion peak frequency (p) of Na3Cr2(PO4)3-G1:1, Na3Cr2(PO4)3-G1:2 and Na3Cr2(PO4)3-G1:3.
2.4 2.6 2.8 3.0
10-4
10-3
10-2
10-1
100
dcg
T[S
cm-1
K]
1000/T [K-1]
Na3Cr
2(PO
4)
3-U1:1
Na3Cr
2(PO
4)
3-U1:2
Arrhenius fit
(b)
0 3 6 9 12 15
0
3
6
9
12
15
Rc(R
gQ
g)(R
gbQ
gb)
-Z
"()x
10
4[]
Z'()x104[]
383K
Na3Cr
2(PO
4)
3-U1:2
Na3Cr
2(PO
4)
3-U1:1
NLLS fit
(a)
2.0 2.2 2.4 2.6 2.8 3.0 3.210
3
104
105
106
107
(c)
P [
rads-1
]
1000/T[K-1]
Na3Cr
2(PO
4)3-G1:2
Na3Cr
2(PO
4)3-G1:1
Na3Cr
2(PO
4)3-G1:3
Arrhenius fit
103
104
105
106
107
108
101
103
105
(a)
Z"()[
]
80
90
110
130
140
150
160
170
180
200
210
NLLS
fit [rads-1]
Na3Cr
2(PO
4)3 G1:1
T [C]
103
104
105
106
107
108
103
104
Z"()
[]
[rads-1]
T [K]
480
470
460
480
450
440
430
420
410
400
390
380
NLLS fit
Na3Cr
2(PO
4)3-G1:3(b)
www.intechopen.com
Polycrystalline Materials – Theoretical and Practical Aspects
100
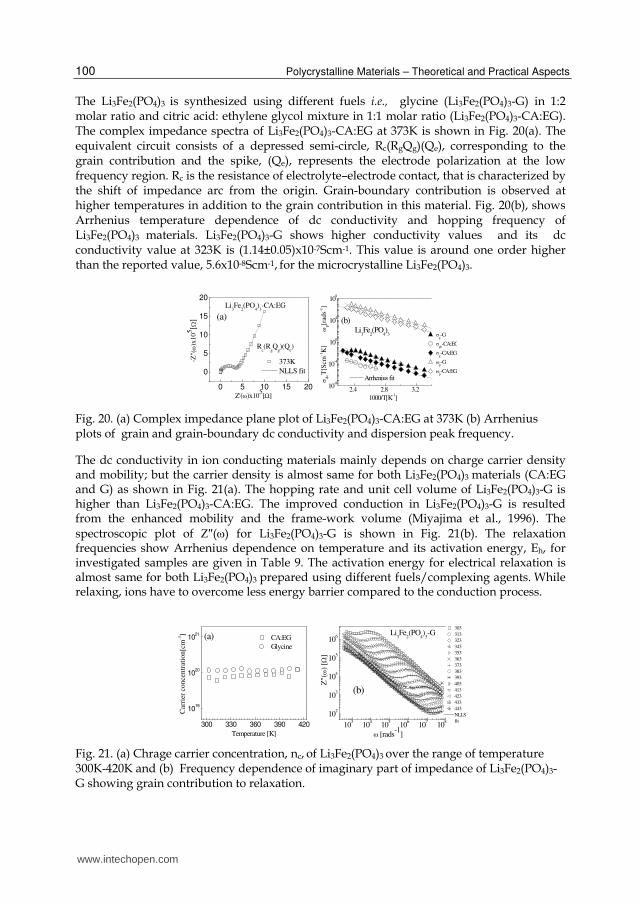
The Li3Fe2(PO4)3 is synthesized using different fuels i.e., glycine (Li3Fe2(PO4)3-G) in 1:2 molar ratio and citric acid: ethylene glycol mixture in 1:1 molar ratio (Li3Fe2(PO4)3-CA:EG). The complex impedance spectra of Li3Fe2(PO4)3-CA:EG at 373K is shown in Fig. 20(a). The equivalent circuit consists of a depressed semi-circle, Rc(RgQg)(Qe), corresponding to the grain contribution and the spike, (Qe), represents the electrode polarization at the low frequency region. Rc is the resistance of electrolyte–electrode contact, that is characterized by the shift of impedance arc from the origin. Grain-boundary contribution is observed at higher temperatures in addition to the grain contribution in this material. Fig. 20(b), shows Arrhenius temperature dependence of dc conductivity and hopping frequency of Li3Fe2(PO4)3 materials. Li3Fe2(PO4)3-G shows higher conductivity values and its dc conductivity value at 323K is (1.14±0.05)x10-7Scm-1. This value is around one order higher than the reported value, 5.6x10⁻⁸Scm-1, for the microcrystalline Li3Fe2(PO4)3.
Fig. 20. (a) Complex impedance plane plot of Li3Fe2(PO4)3-CA:EG at 373K (b) Arrhenius plots of grain and grain-boundary dc conductivity and dispersion peak frequency.
The dc conductivity in ion conducting materials mainly depends on charge carrier density and mobility; but the carrier density is almost same for both Li3Fe2(PO4)3 materials (CA:EG and G) as shown in Fig. 21(a). The hopping rate and unit cell volume of Li3Fe2(PO4)3-G is higher than Li3Fe2(PO4)3-CA:EG. The improved conduction in Li3Fe2(PO4)3-G is resulted from the enhanced mobility and the frame-work volume (Miyajima et al., 1996). The spectroscopic plot of ″() for Li3Fe2(PO4)3-G is shown in Fig. 21(b). The relaxation frequencies show Arrhenius dependence on temperature and its activation energy, Eh, for investigated samples are given in Table 9. The activation energy for electrical relaxation is almost same for both Li3Fe2(PO4)3 prepared using different fuels/complexing agents. While relaxing, ions have to overcome less energy barrier compared to the conduction process.
Fig. 21. (a) Chrage carrier concentration, nc, of Li3Fe2(PO4)3 over the range of temperature 300K-420K and (b) Frequency dependence of imaginary part of impedance of Li3Fe2(PO4)3-G showing grain contribution to relaxation.
0 5 10 15 20
0
5
10
15
20
373K
NLLS fit
-Z
"()x
105[]
Rc(R
gQ
g)(Q
e)
Z'()x105[]
Li3Fe
2(PO
4)
3-CA:EG
(a)
2.4 2.8 3.210
-8
10-4
100
104
108
Arrhenius fit
Li3Fe
2(PO
4)3
dcT
[Scm
- 1K
]
p
[rad
s- 1]
1000/T[K-1]
g-G
gb-CA:EG
g-CA:EG
p-G
p-CA:EG
(b)
300 330 360 390 420
1019
1020
1021
Car
rier
co
nce
ntr
atio
n[c
m-3]
Temperature [K]
CA:EG
Glycine
(a)
103
104
105
106
107
108
102
103
104
105
106
Z"()
[]
[rads-1
]
303
313
323
343
353
363
373
383
393
403
413
423
433
443
NLLS
fit
Li3Fe
2(PO
4)
3-G
(b)
www.intechopen.com
NASICON Materials: Structure and Electrical Properties
101
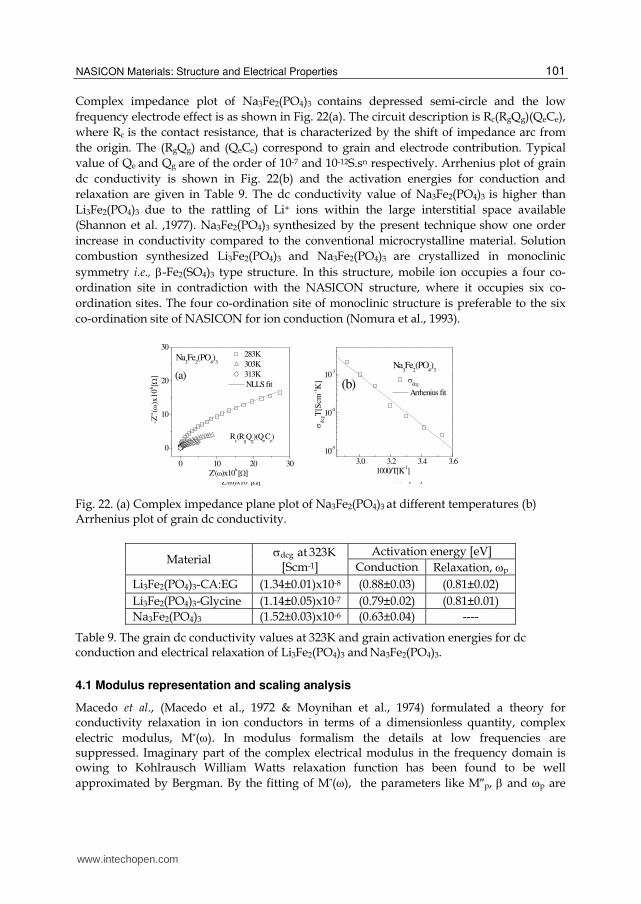
Complex impedance plot of Na3Fe2(PO4)3 contains depressed semi-circle and the low frequency electrode effect is as shown in Fig. 22(a). The circuit description is Rc(RgQg)(QeCe), where Rc is the contact resistance, that is characterized by the shift of impedance arc from the origin. The (RgQg) and (QeCe) correspond to grain and electrode contribution. Typical value of Qe and Qg are of the order of 10-7 and 10-12S.sn respectively. Arrhenius plot of grain dc conductivity is shown in Fig. 22(b) and the activation energies for conduction and relaxation are given in Table 9. The dc conductivity value of Na3Fe2(PO4)3 is higher than Li3Fe2(PO4)3 due to the rattling of Li+ ions within the large interstitial space available (Shannon et al. ,1977). Na3Fe2(PO4)3 synthesized by the present technique show one order increase in conductivity compared to the conventional microcrystalline material. Solution combustion synthesized Li3Fe2(PO4)3 and Na3Fe2(PO4)3 are crystallized in monoclinic symmetry i.e., -Fe2(SO4)3 type structure. In this structure, mobile ion occupies a four co-ordination site in contradiction with the NASICON structure, where it occupies six co-ordination sites. The four co-ordination site of monoclinic structure is preferable to the six co-ordination site of NASICON for ion conduction (Nomura et al., 1993).
Fig. 22. (a) Complex impedance plane plot of Na3Fe2(PO4)3 at different temperatures (b) Arrhenius plot of grain dc conductivity.
Table 9. The grain dc conductivity values at 323K and grain activation energies for dc conduction and electrical relaxation of Li3Fe2(PO4)3 and Na3Fe2(PO4)3.
4.1 Modulus representation and scaling analysis
Macedo et al., (Macedo et al., 1972 & Moynihan et al., 1974) formulated a theory for conductivity relaxation in ion conductors in terms of a dimensionless quantity, complex electric modulus, M*(). In modulus formalism the details at low frequencies are suppressed. Imaginary part of the complex electrical modulus in the frequency domain is owing to Kohlrausch William Watts relaxation function has been found to be well approximated by Bergman. By the fitting of M″(), the parameters like M″p, and p are
3.0 3.2 3.4 3.6
10-5
10-4
10-3
dcg
T[S
cm-1
K]
1000/T[K-1]
dcg
Arrhenius fit
Na3Fe
2(PO
4)3
(b)
0 10 20 30
0
10
20
30
Rc(R
gQ
g)(Q
eC
e)
-Z
"()x
10
6[]
Z'()x106 []
283K
303K
313K
NLLS fit(a)
Na3Fe
2(PO
4)3
3.0 3.2 3.4 3.6
10-5
10-4
10-3
dcg
T[S
cm-1K
]
1000/T[K-1]
dcg
Arrhenius fit
Na3Fe
2(PO
4)3
(b)
0 10 20 30
0
10
20
30
Rc(R
gQ
g)(Q
eC
e)
-Z
"()x
10
6[]
Z'()x106 []
283K
303K
313K
NLLS fit(a)
Na3Fe
2(PO
4)3
www.intechopen.com
Polycrystalline Materials – Theoretical and Practical Aspects
102
extracted. The maximum value of Mp″ is found at p=1/p and p shifts to higher frequencies with increase in temperature.
The charge carriers are mobile over long distances in the region left to peak; while right to the peak ions are spatially confined to the potential wells. The frequency of relaxation, p, where Mp″() is an indicative of transition from short-range to long-range mobility at the decreasing frequency. The p exponentially increases with temperature and the activation energy for relaxation is calculated from the Arrhenius behaviour. The scaling of modulus spectra is shown in Fig. 23(a), for Na3Cr2(PO4)3-G1:3 and inset shows the Arrhenius plot of p. Grain contribution is dominant in Na3Cr2(PO4)3-G1:3, over the frequency and temperature range of the experiment.
Fig. 23. (a) The modulus scaling in Na3Cr2(PO4)3-G1:3 at different temperatures and (b) Frequency dependence of Z"() and M"() at 413K.
Further, in Fig. 23(b), Z) and Mpeaks are almost coincident and there is no additional peak in these representations. The single relaxation peak in the modulus representation of Na3Cr2(PO4)3-G1:3 is contributed from the grain part since the electrode contribution is suppressed. The Z) and Mpeaks are almost coincident, which implies that the grain contributes for impedance relaxation. The small separation in the modulus and impedance peak positions points to the good grain connectivity.
Table 10. The activation energy for electrical relaxation obtained from Modulus representation
Conductivity spectra at different temperatures collapsed to a single curve at higher frequencies on appropriate scaling, which implies that the relaxation mechanism at the higher frequency is independent of temperature. But in some cases, as shown in Figs. 24(a)-(b), low frequency part of the plot is not scaled due to contribution from electrode
102
103
104
105
106
1070
2
4
6
8
413K
Z"()
M"()
[rads-1]
Z
"()x
10
3 []
Na3Cr
2(PO
4)
3-G1:3
0.0
0.5
1.0
1.5
2.0(b) M"(
)x1
0-3
10-4
10-2
100
102
104
0
1
1.8 2.1 2.4 2.7
105
106
107
p [
Hz]
1000/T[ K-1]
(a)
M"/
M" p
/p
T [K]
493
483
473
463
453
443
433
423
413
403Na
3Cr
2(PO
4)
3-G1:3
www.intechopen.com
NASICON Materials: Structure and Electrical Properties
103
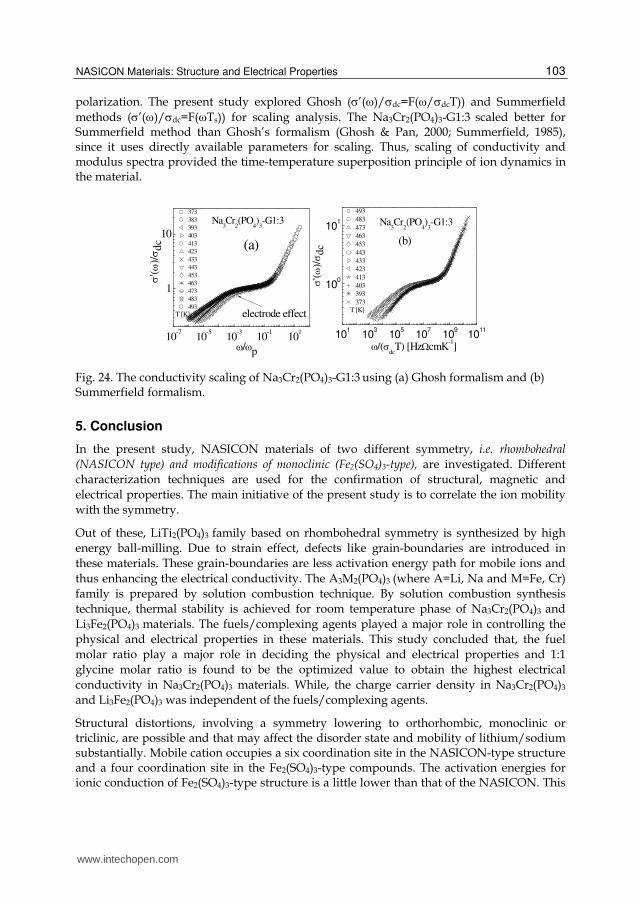
polarization. The present study explored Ghosh (’()/dc=F(/dcT)) and Summerfield methods (’()/dc=F(Ts)) for scaling analysis. The Na3Cr2(PO4)3-G1:3 scaled better for Summerfield method than Ghosh’s formalism (Ghosh & Pan, 2000; Summerfield, 1985), since it uses directly available parameters for scaling. Thus, scaling of conductivity and modulus spectra provided the time-temperature superposition principle of ion dynamics in the material.
Fig. 24. The conductivity scaling of Na3Cr2(PO4)3-G1:3 using (a) Ghosh formalism and (b) Summerfield formalism.
5. Conclusion
In the present study, NASICON materials of two different symmetry, i.e. rhombohedral
(NASICON type) and modifications of monoclinic (Fe2(SO4)3-type), are investigated. Different characterization techniques are used for the confirmation of structural, magnetic and electrical properties. The main initiative of the present study is to correlate the ion mobility with the symmetry.
Out of these, LiTi2(PO4)3 family based on rhombohedral symmetry is synthesized by high energy ball-milling. Due to strain effect, defects like grain-boundaries are introduced in these materials. These grain-boundaries are less activation energy path for mobile ions and thus enhancing the electrical conductivity. The A3M2(PO4)3 (where A=Li, Na and M=Fe, Cr)
family is prepared by solution combustion technique. By solution combustion synthesis technique, thermal stability is achieved for room temperature phase of Na3Cr2(PO4)3 and Li3Fe2(PO4)3 materials. The fuels/complexing agents played a major role in controlling the physical and electrical properties in these materials. This study concluded that, the fuel molar ratio play a major role in deciding the physical and electrical properties and 1:1 glycine molar ratio is found to be the optimized value to obtain the highest electrical conductivity in Na3Cr2(PO4)3 materials. While, the charge carrier density in Na3Cr2(PO4)3
and Li3Fe2(PO4)3 was independent of the fuels/complexing agents.
Structural distortions, involving a symmetry lowering to orthorhombic, monoclinic or triclinic, are possible and that may affect the disorder state and mobility of lithium/sodium substantially. Mobile cation occupies a six coordination site in the NASICON-type structure and a four coordination site in the Fe2(SO4)3-type compounds. The activation energies for ionic conduction of Fe2(SO4)3-type structure is a little lower than that of the NASICON. This
10-7
10-5
10-3
10-1
101
1
10
T [K]
(a)
electrode effect
Na3Cr
2(PO
4)
3-G1:3
'()/ dc
/p
373
383
393
403
413
423
433
443
453
463
473
483
493
101
103
105
107
109
1011
100
101 Na
3Cr
2(PO
4)
3-G1:3
T [K]
(b)
493
483
473
463
453
443
433
423
413
403
393
373
'()/ dc
/(dc
T) [HzcmK-1]
www.intechopen.com
Polycrystalline Materials – Theoretical and Practical Aspects
104
indicates that the four coordination site of the Fe2(SO4)3-type structure is preferable to the six coordination of the NASICON-type structure for ionic conduction. This is the reason behind the enhanced conduction in combustion synthesized Li3Fe2(PO4)3 and Na3Fe2(PO4)3
materials.
The scaling of ac conductivity and modulus spectra provided time-temperature superposition principle of ion dynamics in these materials. The ability to scale different data sets to one common curve indicated that the common physical mechanism in a process can be separated by thermodynamic scales. These materials find application in sensors, rechargeable batteries etc.
6. Acknowledgment
I would like to thank UGC-SAP1 F.530/15/DRS/2009 for financial support and Dr. G. Saini for TEM measurement. Central Instrumentation facility, Pondicherry University, is gratefully acknowledged for TG-DTA, FT-IR, SEM, VSM and UV-vis techniques.
7. References
Alamo, J. Roy, R. (1986). J. Mater. Sci., Vol. 21, pp. 444. Aono, H. Sugimoto, E. Sadoka, Y. Imanaka, N. Ya, G. Adachi (1993). J. Electrochem. Soc.,
Vol.140, pp. 1827 Barsoukov, E. Macdonald, J. R. (2005). Impedance Spectroscopy Theory, Experiment and
Applications, (Second Ed.), A John Wiley & Sons, New Jersey Bates, T. Mackenzie, J. D. (1962). Modern Aspects of the Vitreous State, Vol. 2, Butterworths,
London, p. 195; Benmokhtar, S. El Jazouli, A. Krimi, S. Chaminade, J. P. Gravereau, P. Menetrier, M. De
Waal, D. (2007). Materials Research Bulletin, Vol. 42, pp. 892. Boukamp, B. A. (1989). Equivalent Circuit, Users Manual, p. 12, University of Twente,
Enschede, Netherlands. Bykov, A. B. Chirkin A. P., Demyanets, L. N. Doronin, S. N. Genkina, E. A. Ivanov-Shits, A.
K. Kondratyuk, I. P. Maksimov, B. A. Melonikov, O. K. Muradyan, L. N. Simonov, V. I. Timofeeva, V. A. (1990). Solid State Ionics, Vol. 38, pp. 31
Corbridge D. E. C., Lowe, E. J. (1954). J. Chem. Soc., Part I, pp. 493. Delshad Chermahini, M. Sharafi, S. Shokrollahi H., Zandrahimi, M. (2009) J. Alloys and
Compounds, Vol. 474, pp. 18 d'Yvoire, F. Pintard-ScrGpell, M. Bretey, E. de la Rochsre, M. (1983) Solid State Ionics, Vol. 9-
10, pp.851 Edwards, J. S. Paul, A. Douglas, R. W. (1972). Phys. Chem. Glasses, Vol. 13, pp. 131. ElBatal, H.A. Ezz Eldin, F. M. Shafi, N. A. (1988). Phys.Chem. Glasses, Vol. 29, pp. 235 Elliott, S. R. (1994). Solid State Ionics, Vol. 70–71, pp. 27 Ghosh, A. Pan A., (2000). Phys. Rev. Lett., Vol. 84, pp. 2188 Hahn, H. Logas, J. Averback, R. S. (1990). J. Mater. Res., Vol. 5, pp. 609. Hamzaoui, R., Elkedim, O. Fenineche, N., Gaffet, E. Craven, (2003). J. Mater. Sci. Eng. A, Vol.
360, pp. 299. Hong, H.Y-P. (1976). Mater. Res. Bull., Vol.11, pp. 173 Kravchenko, V. V. Michailov, V. I. Segaryov, S. E. (1992). Solid State Ionics, Vol. 50, pp. 19
www.intechopen.com
NASICON Materials: Structure and Electrical Properties
105
Kurkjian, C. R. Sigety, E. A. (1968). Phys. Chem. Glasses, Vol. 9, pp. 73 Lakshmi Vijayan, Govindaraj, G. (2009) Physica B, Vol. 404, pp. 3539 Lakshmi Vijayan, Govindaraj, G. (2011) J. Phys. Chem. Solids,Vol. 72, pp. 613. Lakshmi Vijayan, Rajesh Cheruku, Govindaraj, G. Rajagopan, S. (2011). Materials Chemistry
and Physics, Vol. 125, pp. 184. Lakshmi Vijayan, Rajesh Cheruku, Govindaraj, G. Rajagopan, S. (2011). Materials Chemistry
and Physics, in press. Larson, A. C. Von Dreele, R. B. (1994). Los Alamos National Laboratory Report, pp. 86. Li, J.Q. Matsui, Y. Park, S.K. Tokura, Y. (1997). Phys. Rev. Lett. Vol. 79, pp. 297 Losila, E. R. Aranda, M. A. G. Bruque, S. Paris, M. Sanz, J. West, A. R. (1998). Chem. Mater.
Vol. 10, pp. 665 Macdonald, J. R. (1987). Impedance Spectroscopy, Wiley, New York. Macedo, P. B. Moynihan, C.T. Bose, R. (1972). Phys. Chem. Glass., Vol. 13, pp. 171 Mariappan, C. R. Govindaraj, G. (2004). Physica B, Vol. 353, pp. 65 Mariappan, C. R. Govindaraj, G. (2006). J. Non-Cryst. Solids, Vol. 352, pp. 2737 Mariappan, C. R. Govindaraj, G. Roling, B. (2005). Solid State Ionics, Vol. 176, pp. 723 Martin G. Bellino, Diego G. Lamas, Noemỉ E. Walsoe de Reca, (2006). Adv. Mater. Vol. 18, pp.
Solid State Ionics, Vol. 152-153, pp. 247. Miyajima, Y. Saito, Y. Matsuoka, M. Yamamoto, Y. (1996). Solid State Ionics, Vol. 84, pp. 61. Mouahid F. E., Zahir, M. Maldonado-Manso, P. Bruque, S. Losilla, E. R. Aranda, M. A. G.
Leon, C. Santamaria, J. (2001). J. Mater. Chem. Vol. 113, pp. 258. Moynihan, C. T. Boesch, L. P. Laberge, N. L. (1973). Phys. Chem. Glass. Vol. 14, pp.
Nomura, K. Ikeda, S. Ito, K. Einaga, H. (1993). Solid State Ionics, Vol. 61, pp. 293. Palani Balaya, Martin Ahrens, Lorentz Kienle, Joachim Maier, (2006). J. Am. Ceram. Soc. Vol.
89, pp. 2804. Prithu Sharma. Krishanu Biswas. Amit Kumar Mondal. Kamanio Chattopadhyay. (2009)
Scripta Materialia, Vol. 61, pp. 600. Puclin, T. Kaczmarek, W. A. Ninham, B. W. (1995). Mat. Chem. Phys., Vol. 40, pp. 73. Rao, K. J. Sobha, K. C. Kumar, S. (2001). Proc. Indian Acad. Sci., Vol. 113, pp. 497. Rougier, C. J. Nazri, G. A. Julian, C. (1997). Mater. Res. Soc. Symp. Proc., Vol. 453, pp. 647. Rulmont, A. Cahay, R. Liégeois-Duyckaerts, M. Tarte, P. (1991). Eur. J. Solid State Inorg.
Chem., Vol. 28, pp. 207. Savosta, M. M. Krivoruchko, V. N. Danilenko, J. A. Yu. Tarenkov, V. Konstantinova, T. E.
Borodin, A. V. Varyukhin, V. N. (2004). Phys. Rev. B, Vol. 69, pp. 24413. Sayer, M. Mansingh, A. (1972). Phys. Rev. B, Vol. 6, pp. 4629. Schoonman, J. (2003). Solid State Ionics, Vol. 157, pp. 319. Shannon, R. D. Taylor, B. E. English, A. D. Berzins, T. (1977) Electrochim. Acta, Vol. 22, pp.
783 Sigaryov, S. E. (1992). Mater. Sci. Eng. B, Vol. 13, pp. 121. Stalhandske, C. (2000). Glasteknisk Tidskrift, Vol. 55, pp. 65. Steele, F. N. Douglas, R. W. (1965). Phys. Chem. Glasses, Vol. 6, pp. 246 Summerfield, S. (1985). Philos. Mag. B, Vol. 52, pp. 9.
www.intechopen.com
Polycrystalline Materials – Theoretical and Practical Aspects
106
Takano, M. Kawachi, J. Nakanishi, N. Takeda, Y. (1981). J. Solid State Chem., Vol. 39, pp. 75 Toby, B. H. (2001). J. Appl. Cryst., Vol. 34, pp.210 Unit-Cell software for cell refinement method of TJB Holland & SAT Redfern, 1995. West, A. R. Abram, E. J. Sinclair, D. C. (2002). in: Proceeding of 8th Asian conference on Solid
State Ionics, p.487, World Scientific, Singapore Williamson, G. K. Hall, W. H. (1953). Acta. Metall., Vol.1, pp. 22. Wong Shan, Peter J. Newman, Best, A. S. Nairn, K.M. Macfarlane, D. R. Maria Forsyth
(1998). J. Mat. Chem., Vol. 8, pp. 219. Yamamoto Hidekazu. Machida Nobuya. Shigematsu Toshihiko. (2004). Solid State Ionics,
Vol. 175, pp. 707
www.intechopen.com
Polycrystalline Materials - Theoretical and Practical AspectsEdited by Prof. Zaharii Zakhariev
ISBN 978-953-307-934-9Hard cover, 164 pagesPublisher InTechPublished online 20, January, 2012Published in print edition January, 2012
InTech ChinaUnit 405, Office Block, Hotel Equatorial Shanghai No.65, Yan An Road (West), Shanghai, 200040, China
Phone: +86-21-62489820 Fax: +86-21-62489821
The book "Polycrystalline Materials - Theoretical and Practical Aspects" is focused on contemporaryinvestigations of plastic deformation, strength and grain-scale approaches, methods of synthesis, structurals,properties, and application of some polycrystalline materials. It is intended for students, post-graduatestudents, and scientists in the field of polycrystalline materials.
How to referenceIn order to correctly reference this scholarly work, feel free to copy and paste the following:
Lakshmi Vijayan and G. Govindaraj (2012). NASICON Materials: Structure and Electrical Properties,Polycrystalline Materials - Theoretical and Practical Aspects, Prof. Zaharii Zakhariev (Ed.), ISBN: 978-953-307-934-9, InTech, Available from: http://www.intechopen.com/books/polycrystalline-materials-theoretical-and-practical-aspects/nasicon-materials-structure-and-electrical-properties