20
Daniel M. Hofmann Senior Advisor Financial Stability The Geneva Association ISCM, Zurich, 15 September 2016 Nat Cat Protection Gaps in Emerging Market Economies

Daniel M. HofmannSenior Advisor Financial Stability
The Geneva Association
ISCM, Zurich, 15 September 2016
Nat Cat Protection Gapsin Emerging Market Economies

222
A FIRST INDICATOR – THE S-CURVECOUNTRIES BELOW THE CURVE ARE UNDERINSURED
Source: Swiss Re
Non-life insurance penetration; premium in percent of GDP/capita (2013)

333
A SECOND INDICATOR – THE GAP BETWEEN INSURED AND TOTAL LOSSESURBANISATION IN KNOWN RISK ZONES DRIVES GAP WIDENING
0.00%
0.05%
0.10%
0.15%
0.20%
0.25%
1976-1985 1986-1995 1996-2005 2006-2015
In p
erce
nt o
f GD
P
Total losses Insured losses
Source: Swiss Re
Insured and total economic losses in percent of gross domestic product (GDP)
△ = 40%
△ = 68%
△ = 73%

444
GLOBAL PROTECTION GAPS
Source: Swiss Re
High concentration of absolute property protection gaps
Annual expected natural catastrophe damage losses (USD bn, 2014)
USJapanChinaMexicoItalyTaiwanTurkeyPhilippinesIndonesiaGermanyCanadaIndiaChile
-5-10-15-20-25-30 5 10 15 20 25 30
Insured earthquakeUninsured earthquake
Insured floodUninsured flood
Insured windUninsured wind
INSURED UNINSURED
0
• Models estimate global uninsured Nat Cat losses at USD 153 bn annually
• Additional property under-insurance protection gap estimated at USD 68 bn
• Total annual/global NL protection gap USD 221 bn
• US Biggest uninsured: EQBiggest insured: Wind
• JapanBiggest uninsured: EQ
• ChinaBiggest uninsured: EQ and flood
• Global Life gap USD 86 trill

555
RELATIVE GAPS CONCENTRATED ON EMERGING MARKET ECONOMIES (EMEs)
0%
20%
40%
60%
80%
100%
120%
CHN COL JPN IDN IND TRK ESP AUS USA GBR CAN NZL
Nat Cat protection gap in percent of economic losses (1974-2013)(Selective sample only to illustrate predicament of EMEs)
Source: Swiss Re
• Urbanisation contributes to high property concentrations in known risk zones

666
JapanCalifornia
PROTECTION GAPS IN ADVANCED MARKET ECONOMIES (AMEs)THE SPECIAL CASES OF CALIFORNIA AND JAPAN
Last big event Northridge 1994
Economic loss USD 44 bn
Fatalities 61
Insured loss USD 24.5 bn (in 2015 prices)- 55.7% of total
HO policies in force 10% of total (was >70% on new homes 3 years after Northridge)
Commercial policies in force
55% of total but varying coverage
Reasons for gap • Anomalous industry reaction• Consumers’ inability to
comprehend low frequency risk• High premiums• 10% to 20% deductible; 15%
on CEA policies• Moral hazard (FEMA will pay)
Potential remedies • Compulsory EQ insurance• Federal reinsurance backstop• Cooperative reserve pool• Change tax rules on reserving
Last big event Fukushima 2011
Economic loss USD 210 bn
Fatalities 15,880
Insured loss USD 40.0 bn (in 2015 prices)- 19.0% of total
HO policies in force >74%
Commercial policies in force
11% of total
Reasons for gap • Focus on commercial cover but compensated by- Effective pre-disaster miti-
gation; good business conti-nuity (BCM) management
• Very high PML and • Little global reinsurance cover
Potential remedies • Make access to global reinsurance more attractive
CEA: California Earthquake Authority; FEMA: Federal Emergency Management Auhority

777
0
20
40
60
80
100
120
140
Perc
ent
Economic losses (USD bn)Haiti 8.0Chile 30.0NZ 20.0 (3 quakes total)
A TALE OF THREE EARTHQUAKES HAITI, CHILE, AND NEW ZEALAND (2010)
Haiti Chile NZ Haiti Chile NZ
Insured loss in percent of total Economic loss in percent of GDP
Haiti (Haiti) Chile (Maulé) New Zealand (Canterbury) Oct. 2010 – Feb. 2011
Magnitude 7.0 8.8 7.1
Buildings damaged 177,000 – 313,000 1,500,000 > 200,000
Fatalities 92,000 – 225,000 521 - 577 185
Source: CATDAT
3 quakes in total
3 quakes in total

888
CHILE, HAITI, AND NEW ZEALAND – FIVE YEARS LATER
80
90
100
110
120
130
09 10 11 12 13 14
Real GDP 2009=100
Chile – Uneven recovery Haiti – Still in shambles
80.0
90.0
100.0
110.0
120.0
130.0
09 10 11 12 13 14
Real GDP 2009=100
NZ – Steady recovery underway
80.0
90.0
100.0
110.0
120.0
130.0
09 10 11 12 13 14
Real GDP 2009=100
• In general, relative small structural damages due to strong building codes (withstand 9.0 magnitude)
• Steady reconstruction of private housing; <75% completed
• 85,000 people still housed in tent cities; many more in ramshackle temporary buildings
• Only small aid flows reached the country: of USD 2 bn in U.S. AID money only 0.7% reached Haiti; much of the remainder trickled down into Washington-based contractors
• Insurance industry paid out NZD 16.7bn; Earthquake Commission (EQC) paid NZD 9.0bn
• 4,500 claims yet to be settled
• Majority of 70,000 home repairs completed
• Surge in construction, yet parts of downtown Canterbury and Christ-church inhabitable due to many after-quakes

999
CAUSES OF UNDERINSURANCE IN EMERGING MARKET ECONOMIES (EMEs)
Cultural • Stigma on financial services (Takaful)• Lack of awareness and financial literacy
Economic development
• ”Backwardness”• Lack of affordability• Dominant state sector, weak private sector• Weak financial infrastructure• Weak institutional and governance frameworks in support
of private insurance market development• Inability to enforce contracts• Weak regulation; inadequate supervision
Insurance specific• Insufficient exposure data; weak cat modelling• Inability to implement appropriate risk-pricing• Broader limits to insurability
Source: The Geneva Association / DMH

101010
-2.0-1.5-1.0-0.50.00.51.01.52.0
GDP cumulative – 100% insured
t = years
-1.5
-1.0
-0.5
0.0
0.5
1.0
1.5GDP growth path – 100% insured
t = years
-4.0
-3.0
-2.0
-1.0
0.0
1.0GDP cumulative – uninsured
t = years
-1.5
-1.0
-0.5
0.0
0.5
1.0GDP growth path – uninsured
t = years
DOES INSURANCE WORK?POST-CATASTROPHE GDP DEVELOPMENT WITH AND WITHOUT INSURANCE SOLUTIONS
Source: v. Peter, v. Dahlen, Saxena, “Unmitigated disaster,” BIS WP No. 394, 2012
Based on a sample of 2,381 Nat Cats of category 4 or higher in 203 countries/jurisdictions, period 1960-2011

111111
Ø Potential to break the cycle between vulnerability and povertyØ 4 billion customers with unmet needs; accessible through new distribution channels (cell phones)Ø Impressive growth rates (although from low levels); but so far only a drop in the bucket
THE ROLE OF INNOVATION – 1MICRO-INSURANCE
Lives covered Micro-GWPUSD million
Micro-insurance GWPin % of total EME GWPmillion in % of total pop
Africa 44.4 4.4 550 0.9
Asia 170.4 4.3 830 0.2
Latin America 48.6 7.9 830 0.5
Total 263.4 2,210Source: Munich Re; Swiss Re
0% 2% 4% 6% 8%
LatamAsia
AfricaEMEsAMEsInsurance penetration rates (premiums / GDP) Premiums in USD million (2015)
AMEs
EMEs
Africa
Asia
Latam
3,704,063
849,723
64,123
524,211
158,146
121212
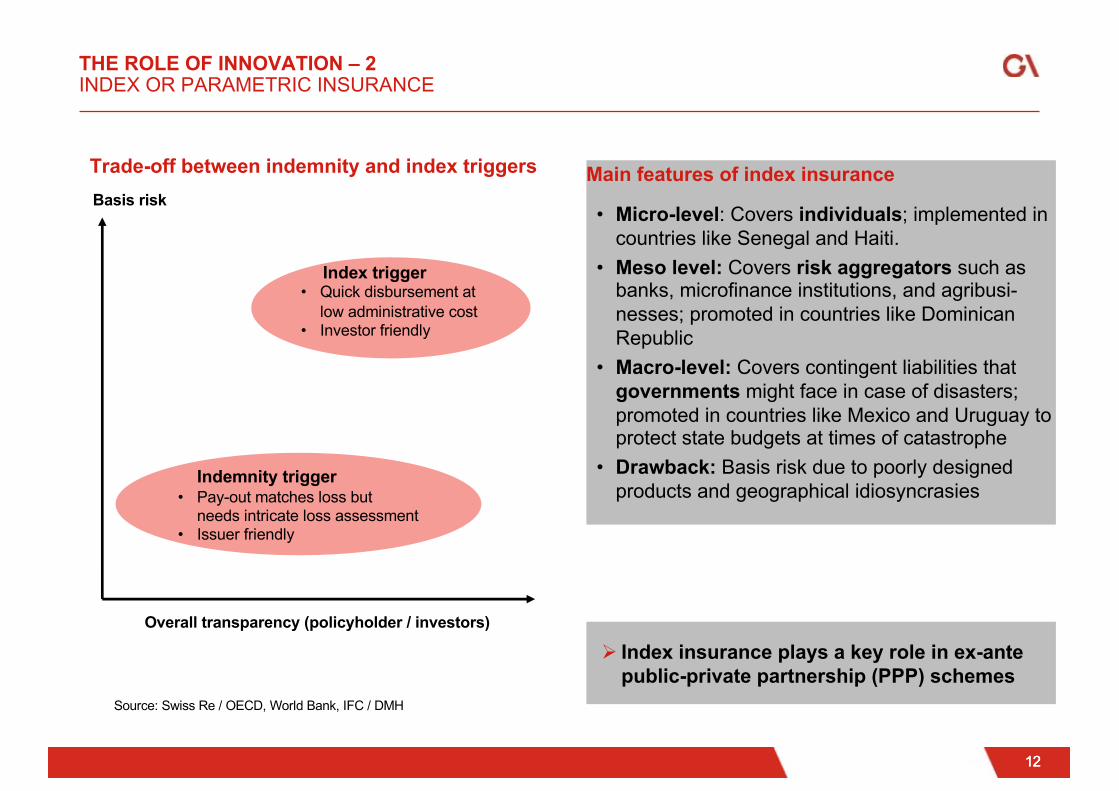
THE ROLE OF INNOVATION – 2INDEX OR PARAMETRIC INSURANCE
Basis risk
Overall transparency (policyholder / investors)
Source: Swiss Re / OECD, World Bank, IFC / DMH
Indemnity trigger• Pay-out matches loss but
needs intricate loss assessment• Issuer friendly
Index trigger• Quick disbursement at
low administrative cost• Investor friendly
Main features of index insurance
• Micro-level: Covers individuals; implemented in countries like Senegal and Haiti.
• Meso level: Covers risk aggregators such as banks, microfinance institutions, and agribusi-nesses; promoted in countries like Dominican Republic
• Macro-level: Covers contingent liabilities that governments might face in case of disasters; promoted in countries like Mexico and Uruguay to protect state budgets at times of catastrophe
• Drawback: Basis risk due to poorly designed products and geographical idiosyncrasies
Trade-off between indemnity and index triggers
Ø Index insurance plays a key role in ex-ante public-private partnership (PPP) schemes

131313
Three enabling factors• High PMLs and skewed loss distributions make for an
expensive Nat Cat capital allocation• Shrinking retro market after 2005 hurricane season;
also persistent regulatory pressure on retro market• Investors seek non-market correlated assets with high
Sharpe ratios
Innovative ART solutions• Insurance-linked securities (ILS) such as industry loss
warrants (ILWs), cat bonds and sidecars
Main challenges• For issuers and investors: design of triggers • For investors:
– Lack of transparency– Rating agency concerns– Liquidity
Potential solutions• Move from bespoke to standardised solutions• Allow for tranching to meet desired ratings and enable
bunching in tradeable derivatives
THE ROLE OF INNOVATION – 3PUSHING THE ART FRONTIER
51.3
37.0
25.1
2.7 3.0 1.60.1 0.9 0.10.0
10.0
20.0
30.0
40.0
50.0
60.0
EQ 6 events
Wind 27 events
Flood 18 events
USD
billi
on
High PMLs and skewed loss distributions
MaxMedianMin
Loss distribution of significant disasters over 50 years (U.S.)Source: Kunreuther and Michel-Kerjan (2009)
141414
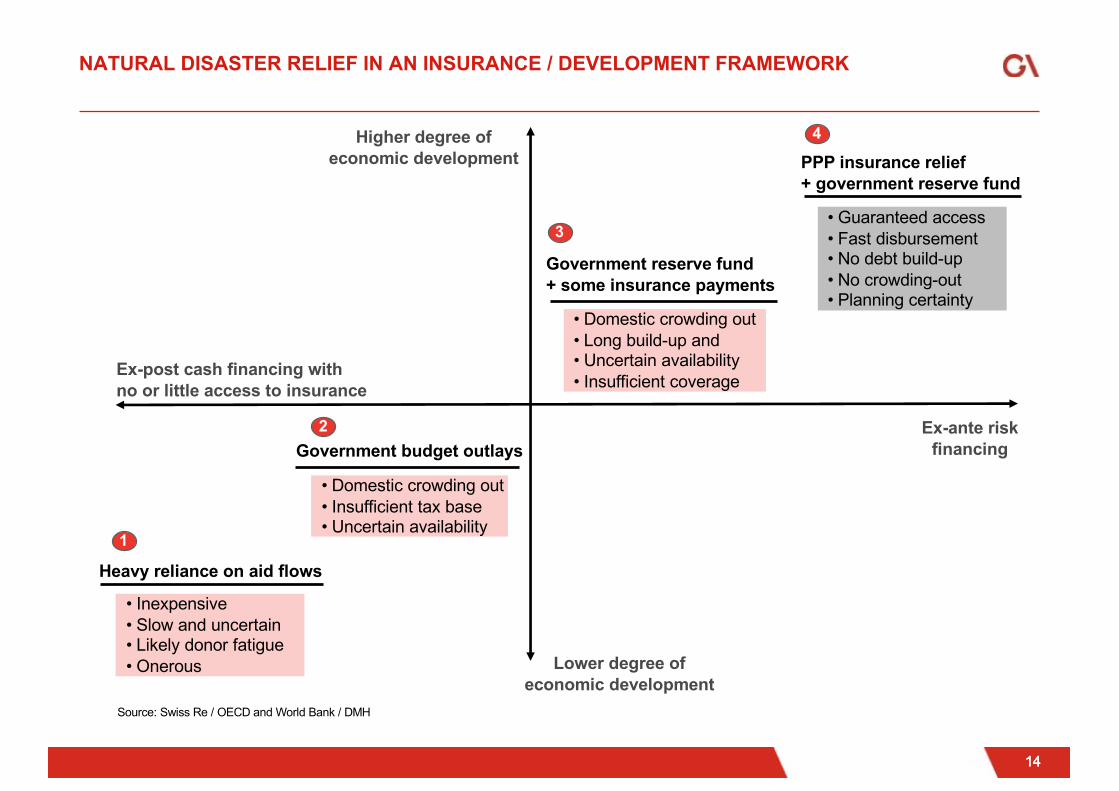
NATURAL DISASTER RELIEF IN AN INSURANCE / DEVELOPMENT FRAMEWORK
Higher degree ofeconomic development
Lower degree ofeconomic development
Ex-ante riskfinancing
Ex-post cash financing withno or little access to insurance
Heavy reliance on aid flows
Government budget outlays
Government reserve fund+ some insurance payments
PPP insurance relief+ government reserve fund
Source: Swiss Re / OECD and World Bank / DMH
• Inexpensive• Slow and uncertain• Likely donor fatigue• Onerous
• Domestic crowding out• Insufficient tax base• Uncertain availability
• Domestic crowding out• Long build-up and• Uncertain availability• Insufficient coverage
• Guaranteed access• Fast disbursement• No debt build-up• No crowding-out• Planning certainty
1
2
3
4

151515
CLOSING THE EME INSURANCE GAP REQUIRES A MULTI-STAKEHOLDER APPROACH
Cultural • Promote financial literacy and risk awareness
Economic development
• Strengthen financial infrastructure and market governance• Promote private sector development• Enforce contractual certainty• Enact regulation and strengthen supervision and establish
effective compulsory regimes
Insurance specific
• Promote risk prevention and risk mitigation• Encourage product innovation and new distribution channels• Reduce product complexity and improve product transparency• Promote micro-insurance• Deploy technology to enable more sophisticated u/w and risk
modelling• Promote collective data collection and data sharing to strengthen
cat / exposure modelling and improve loss estimates• Promote regional cat risk pooling• Build public-private partnerships (PPPs) • Promote financial innovation and tap into (global) capital markets
to enhance financial resilience in EMEs
Source: The Geneva Association / DMH
161616
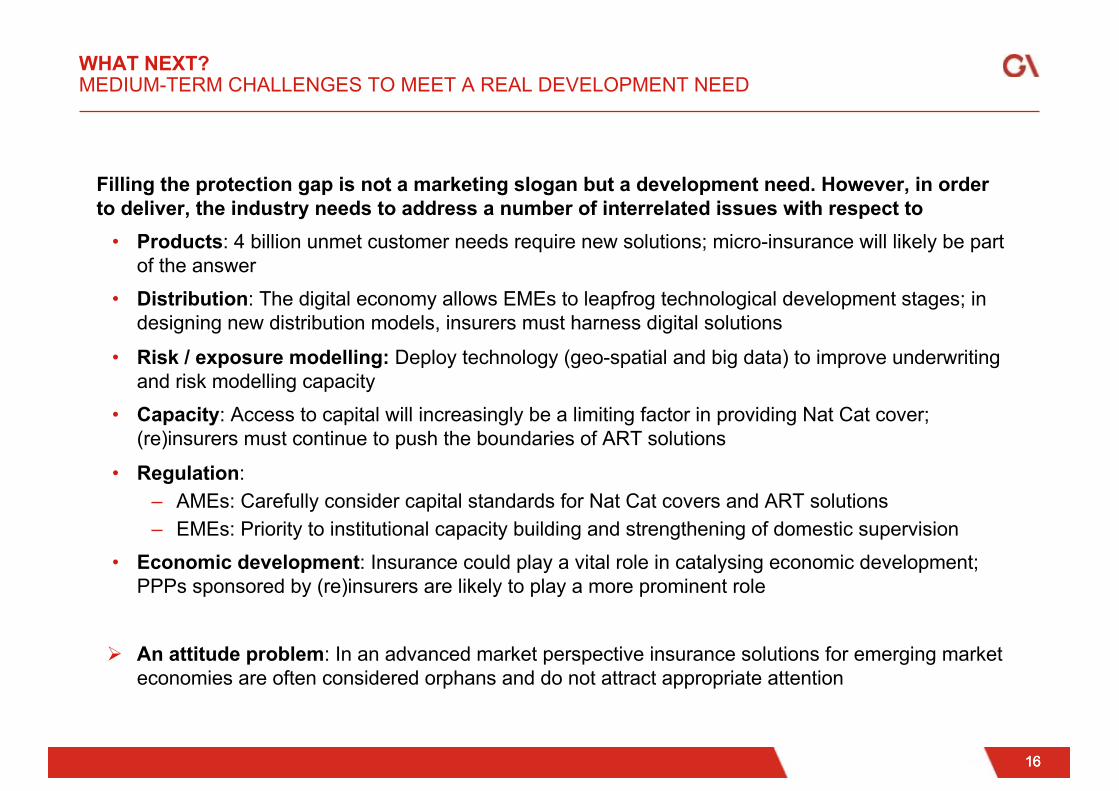
Filling the protection gap is not a marketing slogan but a development need. However, in order to deliver, the industry needs to address a number of interrelated issues with respect to
• Products: 4 billion unmet customer needs require new solutions; micro-insurance will likely be part of the answer
• Distribution: The digital economy allows EMEs to leapfrog technological development stages; in designing new distribution models, insurers must harness digital solutions
• Risk / exposure modelling: Deploy technology (geo-spatial and big data) to improve underwriting and risk modelling capacity
• Capacity: Access to capital will increasingly be a limiting factor in providing Nat Cat cover; (re)insurers must continue to push the boundaries of ART solutions
• Regulation: – AMEs: Carefully consider capital standards for Nat Cat covers and ART solutions– EMEs: Priority to institutional capacity building and strengthening of domestic supervision
• Economic development: Insurance could play a vital role in catalysing economic development; PPPs sponsored by (re)insurers are likely to play a more prominent role
Ø An attitude problem: In an advanced market perspective insurance solutions for emerging market economies are often considered orphans and do not attract appropriate attention
WHAT NEXT?MEDIUM-TERM CHALLENGES TO MEET A REAL DEVELOPMENT NEED
171717
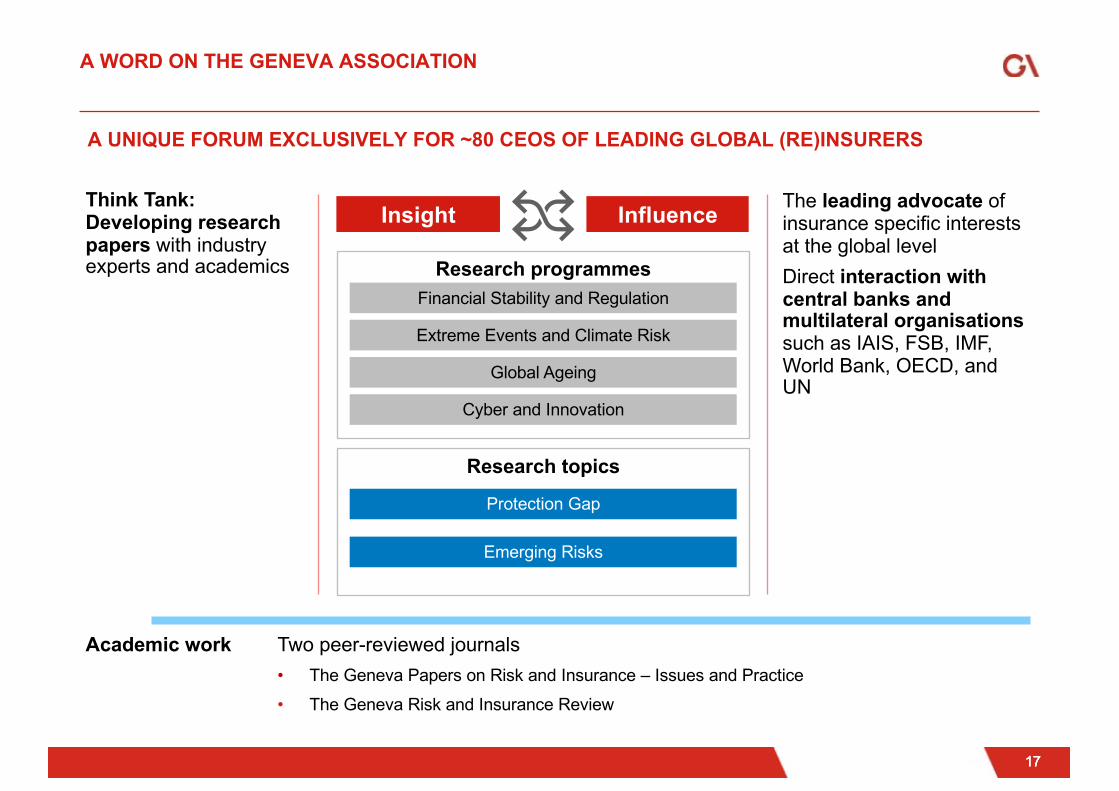
A WORD ON THE GENEVA ASSOCIATION
InfluenceInsight
Research programmesFinancial Stability and Regulation
Extreme Events and Climate Risk
Global Ageing
Cyber and Innovation
Research topics
Protection Gap
Emerging Risks
Think Tank: Developing research papers with industry experts and academics
The leading advocate of insurance specific interests at the global levelDirect interaction with central banks and multilateral organisationssuch as IAIS, FSB, IMF, World Bank, OECD, and UN
Academic work Two peer-reviewed journals • The Geneva Papers on Risk and Insurance – Issues and Practice • The Geneva Risk and Insurance Review
A UNIQUE FORUM EXCLUSIVELY FOR ~80 CEOS OF LEADING GLOBAL (RE)INSURERS

181818
EXAMPLE: OUR GLOBAL PROTECTION GAP RESEARCH ACTIVITIES
2014: The Global Insurance Protection Gap
Two major publications in 2014 / 2015
2015: Insuring Flood Riskin Asia’s High-Growth Markets

191919
• Structural features of today’s insurance markets: gauging the potential for digital• How digitisation impacts the economics and business models of insurance• Case studies (focus on emerging markets)• Stakeholder recommendations• Research complemented by more than 20 expert/executive interviews• To be published in Q4 2016
Upcoming GA study: Harnessing technology to narrow the protection gap
THE UNIVERSE OF PROTECTION GAPS IS WIDE AND GROWING
• Pensions / savings gap GA publication scheduled for Q4/2016 • Life protection and mortality gap
Other identified gaps


