Nat. Med. 17, 55–63 (2011) Receptor-mediated activation of ceramidase activity initiates the pleiotropic actions of adiponectin William L Holland, Russell A Miller, Zhao V Wang, Kai Sun, Brian M Barth, Hai H Bui, Kathryn E Davis, Benjamin T Bikman, Nils Halberg, Joseph M Rutkowski, Mark R Wade, Vincent M Tenorio, Ming-Shang Kuo, Joseph T Brozinick, Bei B Zhang, Morris J Birnbaum, Scott A Summers & Philipp E Scherer In the version of this supplementary file initially posted online, the Supplementary Methods were not included. The Supplementary Methods are now provided as of 8 July 2011. CORRECTION NOTICE
Transcript
Nat. Med. 17, 55–63 (2011)
Receptor-mediated activation of ceramidase activity initiates the pleiotropic actions of adiponectinWilliam L Holland, Russell A Miller, Zhao V Wang, Kai Sun, Brian M Barth, Hai H Bui, Kathryn E Davis, Benjamin T Bikman, Nils Halberg, Joseph M Rutkowski, Mark R Wade, Vincent M Tenorio, Ming-Shang Kuo, Joseph T Brozinick, Bei B Zhang, Morris J Birnbaum, Scott A Summers & Philipp E Scherer
In the version of this supplementary file initially posted online, the Supplementary Methods were not included. The Supplementary Methods are now provided as of 8 July 2011.
co r r e c t i o n n ot i c e
Supplementary Information Titles
Journal: Nature Medicine Article Title: The Pleiotropic Actions of Adiponectin are Initiated via Receptor-Mediated
Activation of Ceramidase Activity Corresponding Author:
Philipp Scherer
Supplementary Item & Number (add rows as necessary)
Title or Caption
Supplementary Figure 1 Adiponectin-decreases ceramide accumulation and improves hepatic insulin sensitivity in ob/ob mice.
Supplementary Figure 2 Adenoviral induction of LKB1 ablation does not alter LKB1 expression in cardiac or skeletal muscle, but alters sphingolipid metaboic gene expression in liver.
Supplementary Figure 3 Effect of Caspase 8 dimerization or adiponectin overexpression on sphingolipid levels and heart weight
Supplementary Figure 4 Adiponectin preserves functional b cell mass in PANIC ATTAC mice.
Supplementary Figure 5 Adiponectin prevents ceramide overaccumulation and activates ceramidase activity in Ins-1 b cells independently of AMPK activation.
Supplementary Figure 6 Adiponectin receptor double knockout MEFs are more susceptible to lipid induced cell death and overaccumulate ceramide in caveolar fractions and non-caveolar fractions.
Supplementary Table 1 Primers for AdipoR1 and AdipoR2 constructs and site directed mutagenesis.
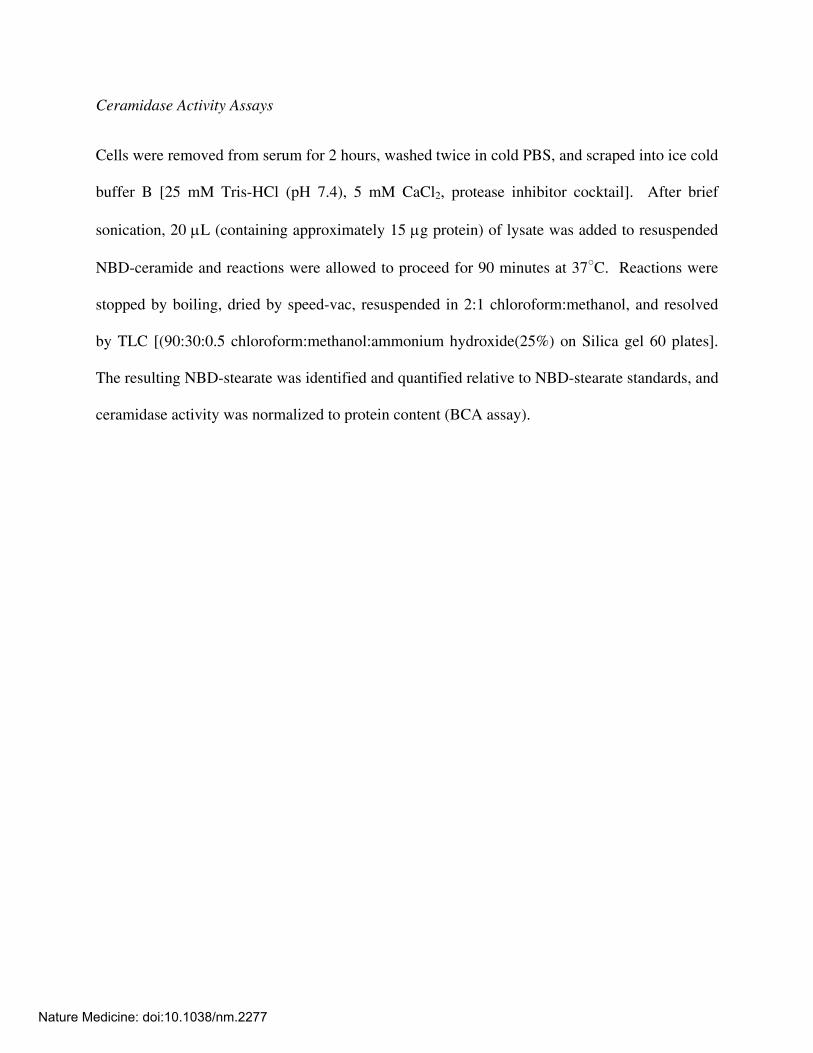
Supplementary Methods
Nature Medicine: doi:10.1038/nm.2277
The Pleiotropic Actions of Adiponectin are Initiated via Receptor‐Mediated Activation of Ceramidase ActivityWilliam L. Holland, Russell A. Miller, Zhao V. Wang, Kai Sun, Brian M. Barth, Hai H. Bui, Kathryn E. Davis,
Benjamin T. Bikman, Nils Halberg, Joseph M. Rutkowski, Mark R. Wade, Vincent M. Tenorio, Ming‐Shang Kuo, h k h b h l h
150 PBSa
Joseph T. Brozinick, Bei B. Zhang, Morris J. Birnbaum, Scott A. Summers and Philipp E. Scherer
Supplementary Information
leanobese
mid
e /m
g)
150
100
PBSAdn
a
mid
em
g w
t)
500400
300
b
*†
Cer
am(n
g/m
l
50 Cer
am(n
gpe
r m
200
100
Ceramide species
0
Time (min) after Adn0 30 60
0
45
60
disp
osal
g/m
in)
PBS Adnc d45
60
ucos
e kg
/min
) PBS Adn
0
15
30
Glu
cose
(m
g/kg
*
0
15
30
Hep
atic
gl
utpu
t (m
g/
0
Clamped600 f
Basal Beforebolus
After bolus
Clamped
Basal Beforebolus
After bolus
0o
400
600
gluc
ose
mg/
dl)
AdnPBS
152025
(ng/
ml)
PBSAdn
* * * *e f
0
200
Blo
od
(m
05
10
Insu
lin
Basal Before After
Supplemental Figure 1. Adiponectin-decreases ceramide accumulation and improves hepatic insulin sensitivity in ob/ob mice. (a) Hepatic concentrations of individual ceramide species were quantified from liver of 10 week old leptin
0 60 120 180 240 300 360Minutes after insulin Clamped
Basal Beforebolus
After bolus
ob/ob mice. (a) Hepatic concentrations of individual ceramide species were quantified from liver of 10 week old leptindeficient (ob/ob) mice (n=6/group) after a 60-minute treatment with full length adiponectin (2 mg/kg, IV). (b) Livers were harvested from 10 week-old leptin deficient (ob/ob) mice (n=4/group) 0, 30, or 60-minute after treatment with full length adiponectin (2 mg/kg, IV) and hepatic ceramide concentrations were quantified. (c-f) Hyperinsulinemic-euglycemic clamps were performed on 10 week-old male ob/ob mice (n=5/group). After initiating hyperinsulinemia (10 mU/kg/min), variable infusion of dextrose (50%, iv, Figure 1B) was used to maintain euglycemia. 3H-Glucose was infused for 90 minutes prior to insulin delivery and coinfused throughout the 5 hour clamped period Glucose disposal (c) and hepatic glucose output (d)insulin delivery and coinfused throughout the 5-hour clamped period. Glucose disposal (c) and hepatic glucose output (d) were calculated from serum samples obtained in triplicate during the basal state (-20, -10, 0 minutes before insulin), during hyperinsulinemic steady-state (90, 100, 110 minutes after insulin), and during a final hyperinsulinemic steady-state period after a bolus injection of adiponectin (Adn, 2 mg/kg, IV, 120 minutes post-insulin; 280, 290, 300 minutes after insulin). After initiating hyperinsulinemia, whole blood glucose (e) was determined every 10 minutes by glucometer from a tail nick in ob/ob mice which received a bolus of adiponectin (adn, 2mg/kg, IV, 120 minutes post insulin) or PBS. (f) Plasma was collected before insulin infusion (-10 minutes), during the initial clamped steady-state before bolus injections (120 minutes), or after bolus injections at the end of the clamped steady-state (300 minutes). Insulin concentrations were determined by ELISA. † denotes p<0.08 compared to 0 minute time-point. * denotes p<0.01 compared to basal
Nature Medicine: doi:10.1038/nm.2277
Lean
3000
40005000
Lepob/obc
DAG
r mg
wt)
c D
AGer
mg
wt)
2000
3000
4000a b
*
* * *
0
1000
2000
PBS Adn
Hep
atic
(pm
olpe
r
Hep
atic
(pm
olpe
0
1000
2000
Chow HFD HFD +Adn
*
cAdn
2 5
1
1.5
2
2.5
GFP‐PBS
CRE‐PBS
mRN
A expression
d to GFP con
trol)
**
*d
0
0.5
Relative m
(Com
pared
**
*
Ceramide synthesisCeramide metabolism
Supplemental Figure 2. Adenoviral induction of LKB1 ablation does not alter LKB1 expression in cardiac or skeletal muscle, but alters sphingolipid metaboic gene expression in liver. (a‐b) Diacylglycerol levels were quantified from liver of ob/ob mice (a) and diet‐induced obese (DIO) mice (b) 60 minutes after administration of recombinant adiponectin (2 mg/kg, IV). n=8 per group. * denotes significant difference from lean control (p<0.05). (c‐d) LKB1(fl/fl) mice were infected with adenovirus encoding either GFP or Crerecombinase 16 days prior to experiments (n=8/group). (c) Liver, heart, or skeletal muscle proteins were resolved by SDS‐PAGE andrecombinase 16 days prior to experiments (n 8/group). (c) Liver, heart, or skeletal muscle proteins were resolved by SDS PAGE and western blots probing against LKB1 and tubulin were performed. (d) RT‐PCR on β‐actin, key sphingolipid synthetic enzymes [serine palmitoyltransferase subunits (SPT1 & SPT2), dihydroceramide synthase isoforms (Cers2 & Cers4), dihydroceramide synthase (Des1)], and key ceramide metabolism enzymes [acid ceramidase (AC), glucosylceramide synthase (GCS), ceramide kinase (CK), AdipoR1, and AdipoR2. Relative expression of genes was determined by comparison with β‐actin. * denotes p<0.05 compared to GFP infected treated control group.
Nature Medicine: doi:10.1038/nm.2277
90 800 b
60
90de mg
wt) 600
(ng
/ml)
a b
*
30Cer
amid
pmol
per m
200
400
erum
S1P
(
0
(p
WT HEART 0
200Se
AdnTg/+ Adn+/+
ATTAC
c6
t rat
io
AdnTg/+ Adn+/+
4
ody
wei
ght
gl/g
)
**
2rt w
eigh
t/bo
(mg
0
Hea
10 20 30
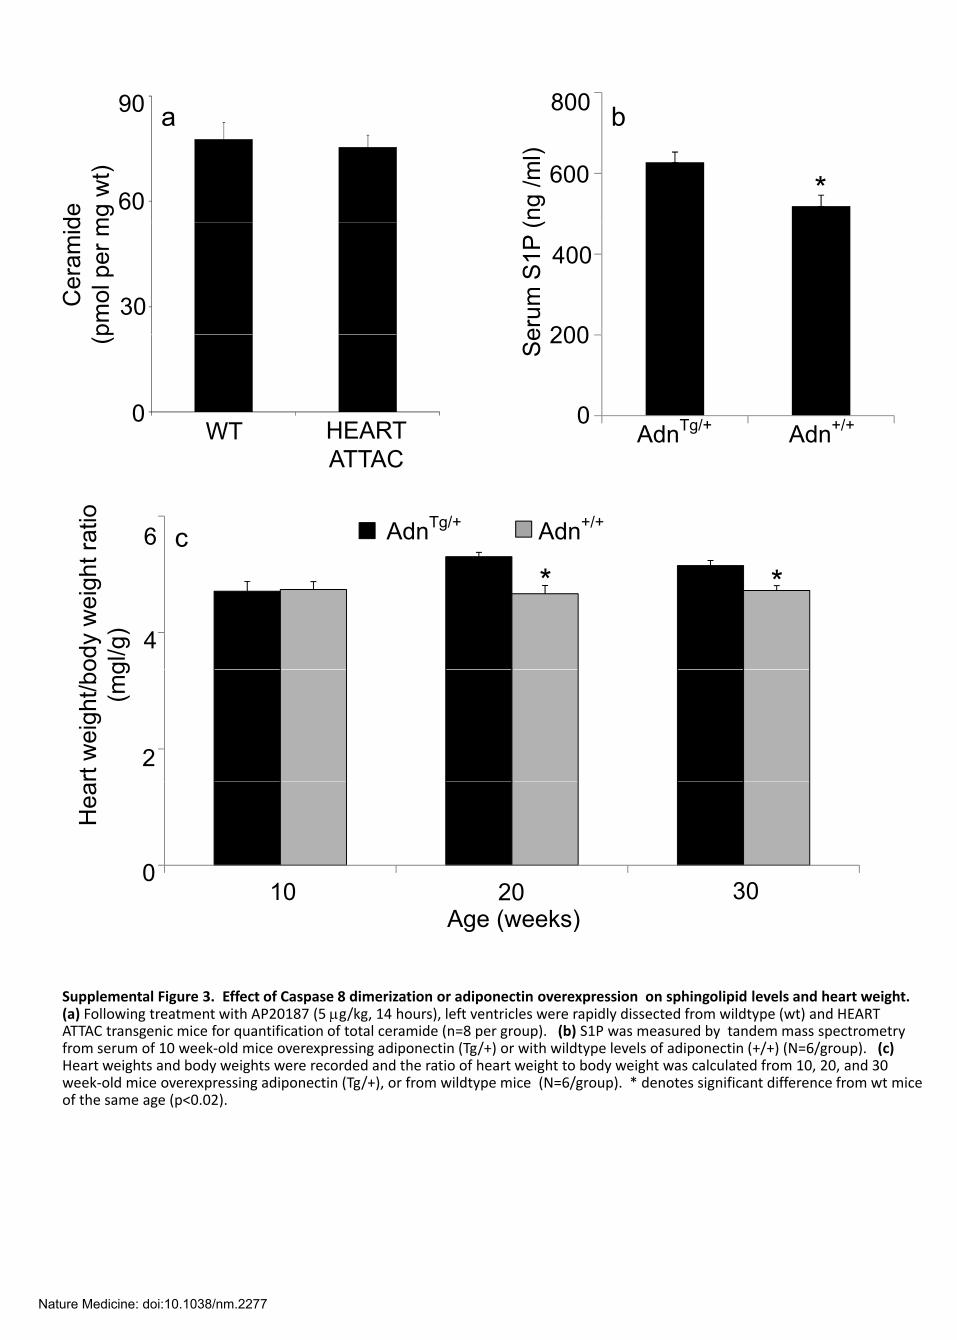
Supplemental Figure 3. Effect of Caspase 8 dimerization or adiponectin overexpression on sphingolipid levels and heart weight.
10 20 30Age (weeks)
(a) Following treatment with AP20187 (5 μg/kg, 14 hours), left ventricles were rapidly dissected from wildtype (wt) and HEARTATTAC transgenic mice for quantification of total ceramide (n=8 per group). (b) S1P was measured by tandem mass spectrometry from serum of 10 week‐old mice overexpressing adiponectin (Tg/+) or with wildtype levels of adiponectin (+/+) (N=6/group). (c) Heart weights and body weights were recorded and the ratio of heart weight to body weight was calculated from 10, 20, and 30 week‐old mice overexpressing adiponectin (Tg/+), or from wildtype mice (N=6/group). * denotes significant difference from wt mice of the same age (p<0.02).
Nature Medicine: doi:10.1038/nm.2277
Adn+/Tg Adn+/+ Adn–/–a
WT
PANIC
PANIC+
AP20187AP20187
600
800
ent
eas)
WTPANICTg/Tg
200
250m
g/dL
)*
* **
Adn–/–
b c
400
ulin
Con
tem
g pa
ncr
* Adn+/+
100
150
ucos
e (m
0
200Insu
(ng/
m
0
50
Blo
od G
l
0Adn+/+AdnTg/+ 0
0 1.5 3 10 30Age (weeks)
4 400
Adn–/–
3
4
Adn+/+(ng/
mL)
300
400
mg/
dL) e
**
Adn–/–d
1
2Adn
Adn–/–
Insu
lin (
*200
Glu
cose
(m **
Ad +/+
0 10 20 30
1
Ser
um
0
100
Bloo
d G
0
Adn+/+
0 10 20 30Minutes after Arginine
00 30 60 90 120
Minutes After Glucose
1.5
g/m
L)
rface
M
2 )
25
20
Vehicle + AP20187f gBasalPost Glucose
1
nsul
in (n
g
Isle
t Sur
(X10
3μ
10
15*
*
*†
0
0.5
Ser
um In
Mea
n I
Are
a
5
10*
0S
0Adn–/–Adn+/+Adn–/–Adn+/+
Supplemental Figure 4. Adiponectin preserves functional β cell mass in PANIC ATTAC mice. (a) Pancreata were obtained 10 days after treatment with AP20187 (0.2 mg/kg) or vehicle from 10-12 week-old male mice overexpressing adiponectin (Tg/+), wildtype for adiponctin (+/+), or lacking adiponectin (-/-). Tissue was sectioned at multiple levels, and islets were imaged after H&E staining with a Nikon Coolscope. Images are representative of 6 animals per condition. with multiple paraffin sections cut in 100 micrometer intervals.(bar=100μm). (b) Total pancreatic insulin content was measured from 10 week-old male mice overexpressing adiponectin (+/Tg), wildtype for adiponectin (+/+) or lacking di ti ( / ) t PANIC ATTAC b k d * d t i ifi t diff b t PANIC ATTAC t ti i (WT) d h PANIC ATTAC iadiponectin (-/-) on wt or PANIC ATTAC backgrounds. * denotes significant difference between PANIC ATTAC transgene negative mice (WT) and homozygous PANIC ATTAC mice
of the same adiponectin genotype (p<0.01) N=6/group. (c-g) Metabolic studies were performed on PANIC ATTACTg/Tg mice. (c) Random fed blood glucose was determined by glucometer in mice lacking adiponectin (-/-) or with wildtype levels of adiponectin (+/+) at indicated ages without AP20187 treatment (n=7 per group). * denotes significant (p<0.02) difference between adiponectin transgenic from wt animal of the same treatment. (d) Following injection of L-arginine (1 mg/g, IP), serum was collected at indicated time points and insulin concentrations were measured by ELISA N=7/group * denotes significant (p<0 02) difference between adiponectin transgenic from wt animal of the same treatmentinsulin concentrations were measured by ELISA. N=7/group. denotes significant (p<0.02) difference between adiponectin transgenic from wt animal of the same treatment. Glucose (e) and insulin (f) (0 and 30 minutes) were measured from adiponectin null and wildtype PANIC-ATTAC mice challenged with glucose (1mg/g, IP)(n=7 per group). * denotes significant (p<0.02) difference between adiponectin transgenic from wt animal of the same treatment. (g) Pancreas was obtained 10 days after initiating treatment with AP20187 (0.2 mg/kg, IP, twice daily for 3 days) or vehicle from 10-12 week-old female mice expressing wildtype adiponctin (+/+), or lacking adiponectin (-/-). Tissue was sectioned at multiple levels and islets were imaged after H&E staining with a Nikon Coolscope Islet size was calculated by mean cross-sectional area of multicelled islets and reported asat multiple levels, and islets were imaged after H&E staining with a Nikon Coolscope. Islet size was calculated by mean cross sectional area of multicelled islets and reported as microns2/islet. N=6/group. * Indicates significant effect of dimerizer p<0.01. †Indicates significant difference compared to wildtype mice under the same treatment condition.
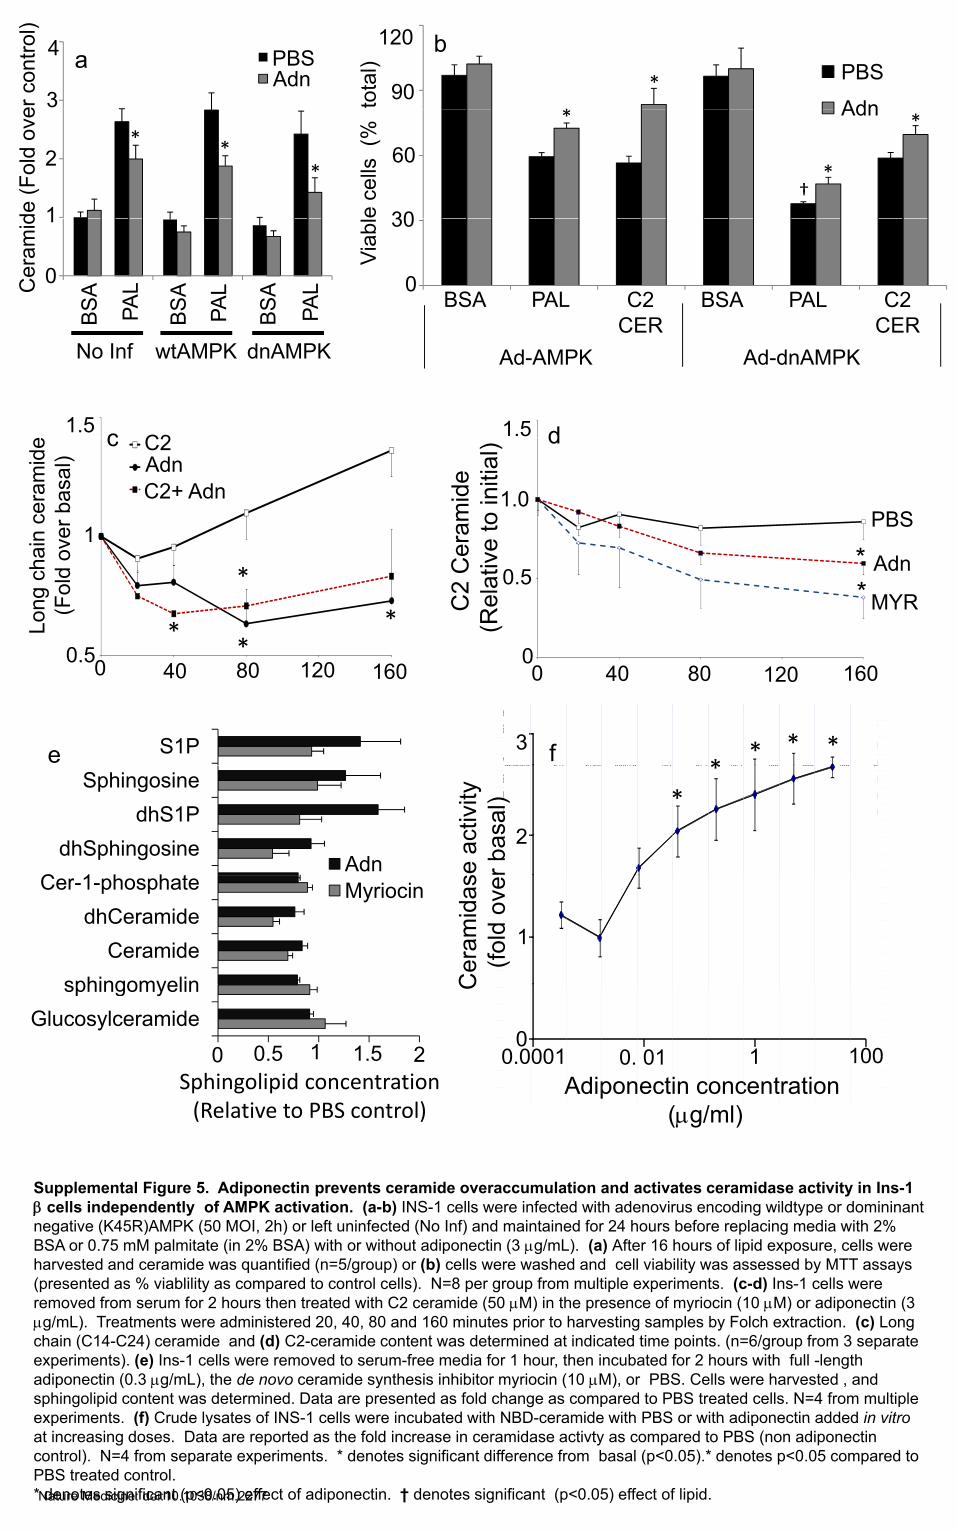
Supplemental Figure 5. Adiponectin prevents ceramide overaccumulation and activates ceramidase activity in Ins-1 β ll i d d tl f AMPK ti ti ( b) INS 1 ll i f t d ith d i di ildt d i i tβ cells independently of AMPK activation. (a-b) INS-1 cells were infected with adenovirus encoding wildtype or domininantnegative (K45R)AMPK (50 MOI, 2h) or left uninfected (No Inf) and maintained for 24 hours before replacing media with 2% BSA or 0.75 mM palmitate (in 2% BSA) with or without adiponectin (3 μg/mL). (a) After 16 hours of lipid exposure, cells were harvested and ceramide was quantified (n=5/group) or (b) cells were washed and cell viability was assessed by MTT assays (presented as % viablility as compared to control cells). N=8 per group from multiple experiments. (c-d) Ins-1 cells were removed from serum for 2 hours then treated with C2 ceramide (50 μM) in the presence of myriocin (10 μM) or adiponectin (3 μg/mL). Treatments were administered 20, 40, 80 and 160 minutes prior to harvesting samples by Folch extraction. (c) Long chain (C14-C24) ceramide and (d) C2-ceramide content was determined at indicated time points. (n=6/group from 3 separate experiments). (e) Ins-1 cells were removed to serum-free media for 1 hour, then incubated for 2 hours with full -length adiponectin (0.3 μg/mL), the de novo ceramide synthesis inhibitor myriocin (10 μM), or PBS. Cells were harvested , and sphingolipid content was determined. Data are presented as fold change as compared to PBS treated cells. N=4 from multiple experiments. (f) Crude lysates of INS-1 cells were incubated with NBD-ceramide with PBS or with adiponectin added in vitroexperiments. (f) Crude lysates of INS 1 cells were incubated with NBD ceramide with PBS or with adiponectin added in vitroat increasing doses. Data are reported as the fold increase in ceramidase activty as compared to PBS (non adiponectin control). N=4 from separate experiments. * denotes significant difference from basal (p<0.05).* denotes p<0.05 compared toPBS treated control. * denotes significant (p<0.05) effect of adiponectin. † denotes significant (p<0.05) effect of lipid.Nature Medicine: doi:10.1038/nm.2277
s )30
40 VehicleS1P
††
a
Dea
d C
ells
(% t
otal
)
10
20
*
0BSA
10
Palmitate C2
**
*
Ceramide
AdiponectinF i #
b
WT MEF
Fraction # 1 2 3 4 5 6 1 2 3 4 5 6
R1R2DKO MEF
WT MEF
R1R2
Fraction #
DKO MEF
7 8 9 10 11 12 7 8 9 10 11 12Adiponectin
Supplemental Figure 6. Adiponectin receptor double knockout MEFs are more susceptible to lipid induced cell death and overaccumulate ceramide in caveolar fractions and non-caveolar fractions. (a) MEFs deficient for both Adi R1 d Adi R2 d f d i t i d f 16 h i 2% BSA 2% BSA j t d t l it t
Adiponectin
AdipoR1 and AdipoR2 were removed from serum and maintained for 16 hours in 2% BSA, 2% BSA conjugated to palmitate (0.75 mM), or 2% BSA containing C-2 ceramide (50 μM). Cell viability was assessed by MTT assay. N=8, from multiple experiments. † denotes a significant effect of the pro-apoptotic lipid treatment (p<0.02). * denotes a significant (p<0.05) effect of S1P. (b) After 2 hours of treatment with adiponectin (3 μg/mL, Right 6 lanes), embryonic fibroblasts (80% confluent) were washed twice in cold PBS, scraped into 2 ml of MBS (25 mm Mes, pH 6.5, 150 mm NaCl) containing 1% Triton X-100, passed 5 times through a loose fitting Dounce homogenizer, and mixed with an equal volume of 80% sucrose (prepared in MBS lacking Triton X-100). The sample was then transferred to a 12-ml ultracentrifuge tube and overlaid with a discontinuous sucrose gradient (4 ml of 30% sucrose, 4 ml of 5% sucrose, both prepared in MBS, lacking detergent). The samples were subjected to centrifugation at 200,000 × g (39,000 rpm in Sorval rotor TH-641) for 16 h. A light scattering band was observed at the 5/30% sucrose interface. Twelve 1-ml fractions were collected, and lipids were extracted for radioactive assessment of ceramide. 32P labeled ceramide-1 phosphate was resolved by TLC, visualized on a Storm phosphorescent imager after phosphorylation by DAG kinase. Quantifiaction of lanes 3-6 correspond to caveolin-enriched p p g p p y y pfractions indicates that adiponectin decreased raft-associated ceramides by 23% in wt (but not DKO) MEFs.
Nature Medicine: doi:10.1038/nm.2277
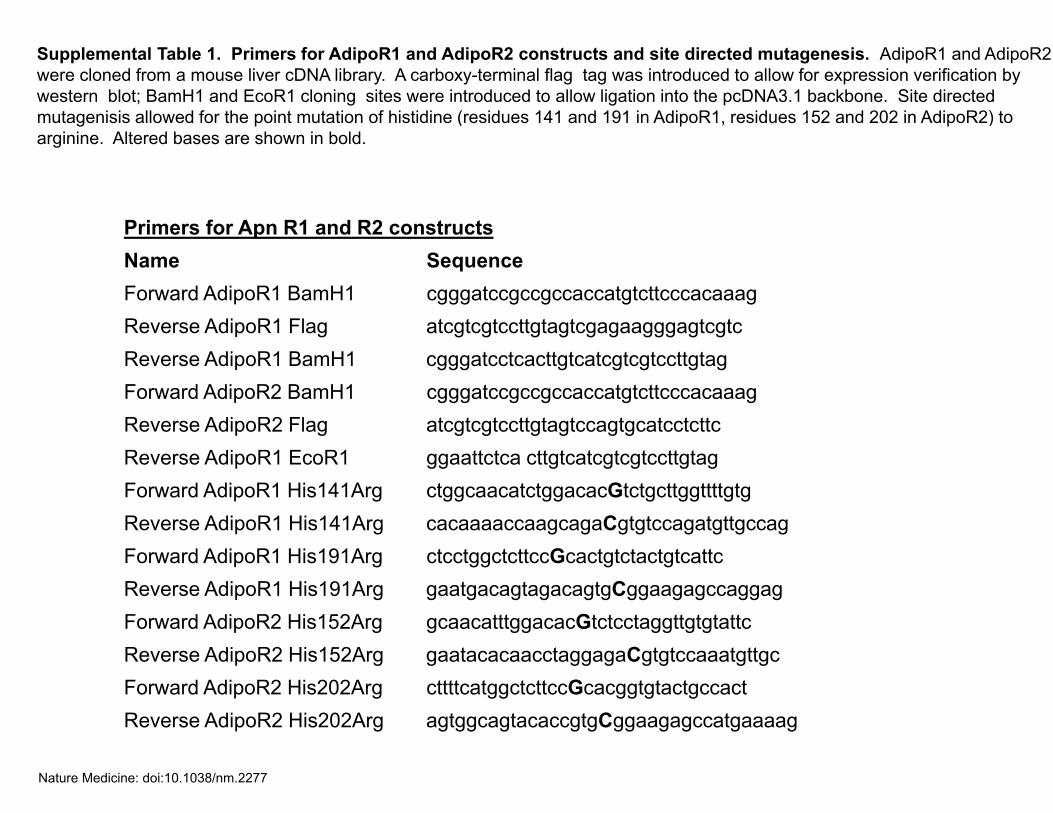
Supplemental Table 1. Primers for AdipoR1 and AdipoR2 constructs and site directed mutagenesis. AdipoR1 and AdipoR2 were cloned from a mouse liver cDNA library. A carboxy-terminal flag tag was introduced to allow for expression verification by western blot; BamH1 and EcoR1 cloning sites were introduced to allow ligation into the pcDNA3.1 backbone. Site directed
i i ll d f h i i f hi idi ( id 141 d 191 i Adi R1 id 152 d 202 i Adi R2)mutagenisis allowed for the point mutation of histidine (residues 141 and 191 in AdipoR1, residues 152 and 202 in AdipoR2) toarginine. Altered bases are shown in bold.